census
census
census

You also want an ePaper? Increase the reach of your titles
YUMPU automatically turns print PDFs into web optimized ePapers that Google loves.
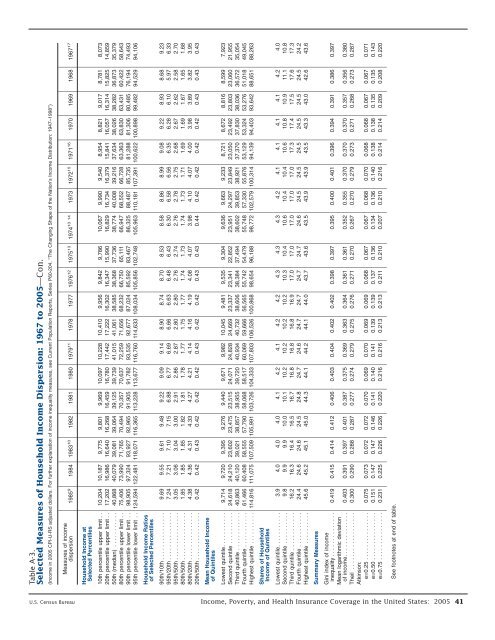
Table A-3.<br />
Selected Measures of Household Income Dispersion: 1967 to 2005—Con.<br />
(Income in 2005 CPI-U-RS adjusted dollars. For further explanation of income inequality measures, see Current Population Reports, Series P60-204, ‘‘The Changing Shape of the Nation’s Income Distribution: 1947–1998’’)<br />
Measures of income<br />
dispersion 1985 9 1984 1983 10 1982 1981 1980 1979 11 1978 1977 1976 12 1975 13 1974 13 14 1973 1972 15 1971 16 1970 1969 1968 1967 17<br />
Household Income at<br />
Selected Percentiles<br />
10th percentile upper limit . . 10,204 10,187 9,775 9,801 9,969 10,097 10,228 10,410 9,956 9,842 9,786 10,067 9,990 9,540 8,954 8,821 9,017 8,781 8,073<br />
20th percentile upper limit . . 17,202 16,986 16,640 16,268 16,459 16,780 17,442 17,222 16,302 16,347 15,990 16,829 16,734 16,379 15,841 16,057 16,314 15,825 14,859<br />
50th (median) ........... 40,868 40,079 39,081 39,064 39,125 39,739 41,015 41,061 38,585 38,368 37,736 38,774 40,008 39,216 37,634 38,026 38,282 36,873 35,379<br />
80th percentile upper limit . . 75,406 73,990 71,765 70,494 70,357 70,637 72,259 71,656 68,232 66,750 65,111 66,947 68,552 66,728 63,363 63,830 63,431 60,422 58,643<br />
90th percentile lower limit . . 98,905 97,324 93,927 92,965 91,905 91,782 93,535 92,677 87,024 85,592 83,467 86,325 88,487 85,735 81,288 81,306 80,485 76,194 74,493<br />
95th percentile lower limit . . 124,594 122,481 118,071 116,365 113,228 113,677 116,760 114,633 108,034 105,856 102,748 105,963 110,181 107,391 100,622 100,898 99,482 94,529 94,106<br />
Household Income Ratios<br />
of Selected Percentiles<br />
90th/10th ............... 9.69 9.55 9.61 9.48 9.22 9.09 9.14 8.90 8.74 8.70 8.53 8.58 8.86 8.99 9.08 9.22 8.93 8.68 9.23<br />
95th/20th ............... 7.24 7.21 7.10 7.15 6.88 6.77 6.69 6.66 6.63 6.48 6.43 6.30 6.58 6.56 6.35 6.28 6.10 5.97 6.33<br />
95th/50th ............... 3.05 3.06 3.04 3.00 2.91 2.86 2.87 2.80 2.80 2.76 2.74 2.76 2.78 2.75 2.68 2.67 2.62 2.58 2.70<br />
80th/50th . . . ............ 1.85 1.85 1.85 1.82 1.81 1.78 1.77 1.75 1.77 1.74 1.73 1.74 1.73 1.71 1.69 1.69 1.67 1.65 1.68<br />
80th/20th . . . ............ 4.38 4.36 4.31 4.33 4.27 4.21 4.14 4.16 4.19 4.08 4.07 3.98 4.10 4.07 4.00 3.98 3.89 3.82 3.95<br />
20th/50th ............... 0.42 0.42 0.43 0.42 0.42 0.42 0.43 0.42 0.42 0.43 0.43 0.44 0.42 0.42 0.42 0.42 0.43 0.43 0.43<br />
Mean Household Income<br />
of Quintiles<br />
Lowest quintile. .......... 9,714 9,720 9,395 9,276 9,440 9,671 9,982 10,045 9,481 9,535 9,304 9,636 9,663 9,233 8,721 8,672 8,816 8,599 7,923<br />
Second quintile . . . . . . . . . . 24,618 24,210 23,602 23,475 23,515 24,071 24,828 24,669 23,337 23,341 22,852 23,951 24,297 23,849 23,050 23,492 23,803 23,060 21,955<br />
Third quintile . . . ......... 40,863 40,120 39,021 38,857 38,955 39,720 40,934 40,732 38,606 38,384 37,494 38,602 39,853 38,921 37,370 37,830 38,036 36,572 35,054<br />
Fourth quintile ........... 61,466 60,408 58,555 57,790 58,068 58,517 60,069 59,666 56,565 55,742 54,479 55,748 57,330 55,876 53,129 53,324 53,276 51,018 49,045<br />
Highest quintile .......... 114,816 111,075 107,509 105,991 103,726 104,333 107,803 106,526 100,868 98,654 96,188 98,772 102,579 100,314 94,139 94,403 93,642 88,651 88,263<br />
Shares of Household<br />
Income of Quintiles<br />
Lowest quintile. .......... 3.9 4.0 4.0 4.0 4.1 4.2 4.1 4.2 4.2 4.3 4.3 4.3 4.2 4.1 4.1 4.1 4.1 4.2 4.0<br />
Second quintile .......... 9.8 9.9 9.9 10.0 10.1 10.2 10.2 10.2 10.2 10.3 10.4 10.6 10.4 10.4 10.6 10.8 10.9 11.1 10.8<br />
Third quintile ............ 16.2 16.3 16.4 16.5 16.7 16.8 16.8 16.8 16.9 17.0 17.0 17.0 17.0 17.0 17.3 17.4 17.5 17.6 17.3<br />
Fourthquintile........... 24.4 24.6 24.6 24.5 24.8 24.7 24.6 24.7 24.7 24.7 24.7 24.6 24.5 24.5 24.5 24.5 24.5 24.5 24.2<br />
Highest quintile .......... 45.6 45.2 45.1 45.0 44.3 44.1 44.2 44.1 44.0 43.7 43.6 43.5 43.9 43.9 43.5 43.3 43.0 42.6 43.6<br />
Summary Measures<br />
Gini index of income<br />
inequality .............. 0.419 0.415 0.414 0.412 0.406 0.403 0.404 0.402 0.402 0.398 0.397 0.395 0.400 0.401 0.396 0.394 0.391 0.386 0.397<br />
Mean logarithmic deviation<br />
of income. ............. 0.403 0.391 0.397 0.401 0.387 0.375 0.369 0.363 0.364 0.361 0.361 0.352 0.355 0.370 0.370 0.370 0.357 0.356 0.380<br />
Theil .................. 0.300 0.290 0.288 0.287 0.277 0.274 0.279 0.275 0.276 0.271 0.270 0.267 0.270 0.279 0.273 0.271 0.268 0.273 0.287<br />
Atkinson:<br />
e=0.25 ............... 0.075 0.073 0.072 0.072 0.070 0.069 0.070 0.069 0.069 0.068 0.067 0.067 0.068 0.070 0.068 0.068 0.067 0.067 0.071<br />
e=0.50 ............... 0.151 0.147 0.147 0.146 0.141 0.140 0.141 0.139 0.139 0.137 0.136 0.134 0.136 0.140 0.138 0.138 0.135 0.135 0.143<br />
e=0.75 ............... 0.231 0.225 0.226 0.226 0.220 0.216 0.216 0.213 0.213 0.211 0.210 0.207 0.210 0.216 0.214 0.214 0.209 0.208 0.220<br />
See footnotes at end of table.<br />
U.S. Census Bureau Income, Poverty, and Health Insurance Coverage in the United States: 2005 41