Volume 2, Issue 1, 2011, Full Text - 5th International Conference on ...
Volume 2, Issue 1, 2011, Full Text - 5th International Conference on ...
Volume 2, Issue 1, 2011, Full Text - 5th International Conference on ...

You also want an ePaper? Increase the reach of your titles
YUMPU automatically turns print PDFs into web optimized ePapers that Google loves.
Sustainable C<strong>on</strong>structi<strong>on</strong> and Design <str<strong>on</strong>g>2011</str<strong>on</strong>g><br />
s<br />
Df = 4 +<br />
(4)<br />
2<br />
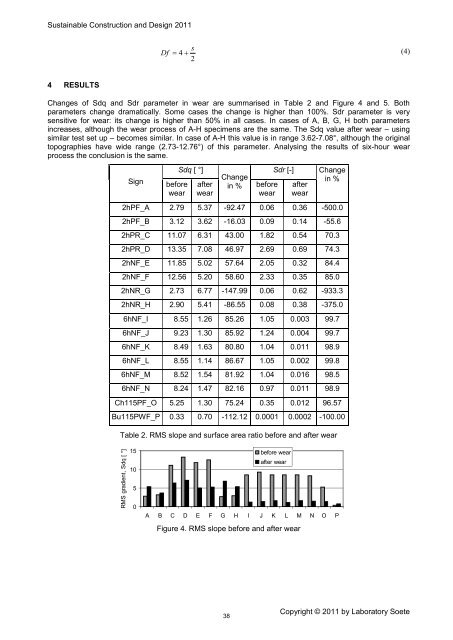
4 RESULTS<br />
Changes of Sdq and Sdr parameter in wear are summarised in Table 2 and Figure 4 and 5. Both<br />
parameters change dramatically. Some cases the change is higher than 100%. Sdr parameter is very<br />
sensitive for wear: its change is higher than 50% in all cases. In cases of A, B, G, H both parameters<br />
increases, although the wear process of A-H specimens are the same. The Sdq value after wear – using<br />
similar test set up – becomes similar. In case of A-H this value is in range 3.62-7.08°, although the original<br />
topographies have wide range (2.73-12.76°) of this parameter. Analysing the results of six-hour wear<br />
process the c<strong>on</strong>clusi<strong>on</strong> is the same.<br />
Sign<br />
before<br />
wear<br />
Sdq [ °]<br />
after<br />
wear<br />
Change<br />
in %<br />
before<br />
wear<br />
Sdr [-]<br />
after<br />
wear<br />
Change<br />
in %<br />
2hPF_A 2.79 5.37 -92.47 0.06 0.36 -500.0<br />
2hPF_B 3.12 3.62 -16.03 0.09 0.14 -55.6<br />
2hPR_C 11.07 6.31 43.00 1.82 0.54 70.3<br />
2hPR_D 13.35 7.08 46.97 2.69 0.69 74.3<br />
2hNF_E 11.85 5.02 57.64 2.05 0.32 84.4<br />
2hNF_F 12.56 5.20 58.60 2.33 0.35 85.0<br />
2hNR_G 2.73 6.77 -147.99 0.06 0.62 -933.3<br />
2hNR_H 2.90 5.41 -86.55 0.08 0.38 -375.0<br />
6hNF_I 8.55 1.26 85.26 1.05 0.003 99.7<br />
6hNF_J 9.23 1.30 85.92 1.24 0.004 99.7<br />
6hNF_K 8.49 1.63 80.80 1.04 0.011 98.9<br />
6hNF_L 8.55 1.14 86.67 1.05 0.002 99.8<br />
6hNF_M 8.52 1.54 81.92 1.04 0.016 98.5<br />
6hNF_N 8.24 1.47 82.16 0.97 0.011 98.9<br />
Ch115PF_O 5.25 1.30 75.24 0.35 0.012 96.57<br />
Bu115PWF_P 0.33 0.70 -112.12 0.0001 0.0002 -100.00<br />
Table 2. RMS slope and surface area ratio before and after wear<br />
RMS gradient, Sdq [ °]<br />
15<br />
10<br />
5<br />
0<br />
before wear<br />
after wear<br />
A B C D E F G H I J K L M N O P<br />
Figure 4. RMS slope before and after wear<br />
38<br />
Copyright © <str<strong>on</strong>g>2011</str<strong>on</strong>g> by Laboratory Soete