Sust Qre tainab endi, M ble En Malta nergy Actio n Plan n
Sust Qre tainab endi, M ble En Malta nergy Actio n Plan n
Sust Qre tainab endi, M ble En Malta nergy Actio n Plan n

You also want an ePaper? Increase the reach of your titles
YUMPU automatically turns print PDFs into web optimized ePapers that Google loves.
<strong>Sust</strong><strong>tainab</strong><strong>ble</strong><br />
<strong>En</strong><strong>nergy</strong><br />
<strong>Actio</strong>n<br />
<strong>Plan</strong>n<br />
<strong>Qre</strong> <strong>endi</strong>, M<strong>Malta</strong><br />
May 2010<br />
Prepareed<br />
in asso ociation wwith<br />
<strong>Qre</strong>nndi<br />
Local Council (M<strong>Malta</strong>)<br />
by<br />
Econingg<br />
<strong>En</strong>ginee ering Connsultancy<br />
Ltd.<br />
1
Acknowledgements<br />
This <strong>Sust</strong>aina<strong>ble</strong> <strong>En</strong>ergy <strong>Actio</strong>n <strong>Plan</strong> has been completed with the support of a number of<br />
entities, the Covenant of Mayors Supporting Structure in <strong>Malta</strong>, namely the Local Councils<br />
Association, utility providers and the Joint Research Centre of the European Commission.<br />
We would like to acknowledge the supportive role of the following persons whose help has<br />
been found to be invalua<strong>ble</strong> in the compilation of this document.<br />
Mr. Damian Bornas Cayuela, Joint Research Centre, European Commission<br />
Mr. Ronald Piers, Joint Research Centre, European Commission<br />
Mr. Jimmy Magro, Executive Secretary, Local Councils Association<br />
2
Ta<strong>ble</strong> of Contents<br />
1. Introduction and General Information .................................................................... 5<br />
2. The National Situation ............................................................................................ 7<br />
3. About the Locality .................................................................................................. 9<br />
4. Political Commitment ........................................................................................... 11<br />
5. Baseline Emissions Inventory (BEI) ....................................................................... 12<br />
5.1 Selection of Baseline Year ........................................................................ 12<br />
5.2 Sources of Data ........................................................................................ 13<br />
5.3 Availability of Data and Fields of <strong>Actio</strong>n .................................................. 14<br />
6. Buildings, Equipment, Facilities and Industries ................................................... 17<br />
6.1 Municipal Buildings, Equipment and Facilities ......................................... 17<br />
6.2 Residential Buildings ................................................................................ 19<br />
6.2.1 Electricity .................................................................................. 19<br />
6.2.2 Liquefied Petroleum Gas (LPG) ................................................. 20<br />
6.2.3 Kerosene ................................................................................... 20<br />
6.3 Tertiary (Non Municipal) Buildings, Equipment and Facilities ................ 22<br />
6.3.1 Electricity .................................................................................. 22<br />
6.3.2 Liquefied Petroleum Gas (LPG) ................................................. 22<br />
6.3.3 Other Fossil Fuels ..................................................................... 23<br />
6.4 Accuracy of Electrical <strong>En</strong>ergy Allocation by Sector ................................. 25<br />
6.5 Municipal Public Lighting ......................................................................... 26<br />
6.6 Industries ................................................................................................. 28<br />
7. Transport .............................................................................................................. 29<br />
7.1 Municipal Fleet ........................................................................................ 29<br />
7.2 Public Transport ....................................................................................... 30<br />
7.3 Private and Commercial Transport .......................................................... 31<br />
8. Others .................................................................................................................. 33<br />
8.1 Water Consumption ................................................................................ 33<br />
3
9. Baseline Emissions Inventory (BEI) Summary ....................................................... 34<br />
9.1 Overview .................................................................................................. 34<br />
9.2 <strong>En</strong>ergy Consumption by Sector ............................................................... 35<br />
9.3 <strong>En</strong>ergy Consumption by Source .............................................................. 36<br />
9.4 CO2 Emissions by Sector .......................................................................... 37<br />
9.5 CO2 Emissions by Source of <strong>En</strong>ergy ......................................................... 38<br />
10. <strong>Sust</strong>aina<strong>ble</strong> <strong>En</strong>ergy <strong>Actio</strong>n <strong>Plan</strong> (SEAP) ................................................................ 42<br />
10.1 <strong>Qre</strong>ndi’s Vision towards a <strong>Sust</strong>aina<strong>ble</strong> <strong>En</strong>ergy Future ........................... 42<br />
10.2 <strong>Actio</strong>ns to implement the locality toward <strong>En</strong>ergy <strong>Sust</strong>ainability .......... 42<br />
10.2.1 Buildings, Equipment and Facilities ........................................ 44<br />
10.2.2 Transport ................................................................................ 49<br />
10.2.3 Local Electricity Production .................................................... 50<br />
10.2.4 Land Use <strong>Plan</strong>ning .................................................................. 51<br />
10.2.5 Local District Heating / Cooling, CHPs .................................... 52<br />
10.2.6 Public Procurement of Products and Services ....................... 52<br />
10.2.7 Working with the Citizens and Stakeholders ......................... 53<br />
11. <strong>En</strong>dorsement ........................................................................................................ 60<br />
12. Conclusions .......................................................................................................... 61<br />
13. List of Figures and Ta<strong>ble</strong>s ..................................................................................... 62<br />
13.1 Figures .................................................................................................... 62<br />
13.2 Ta<strong>ble</strong>s ...................................................................................................... 63<br />
14. App<strong>endi</strong>x 1: Dwelling Stock Breakdown ............................................................. 64<br />
4
1. Introduction and General Information<br />
The European Union, in its bid to lead the global fight against climate change has<br />
committed itself to reduce the overall emissions to at least 20% below 1990 levels by the<br />
year 2020. It has also acknowledged that local authorities have a key role to play in the<br />
achievement of the EU’s e<strong>nergy</strong> and climate objectives.<br />
As a result, it has taken the initiative to establish the<br />
Covenant of Mayors. This is a process in which local<br />
authorities commit themselves voluntarily to reduce their<br />
CO2 emissions beyond this 20% target.<br />
To realize this commitment, each participating locality is<br />
producing and eventually implementing a <strong>Sust</strong>aina<strong>ble</strong><br />
<strong>En</strong>ergy <strong>Actio</strong>n <strong>Plan</strong> (SEAP). Such plan has to be prepared<br />
and completed within one year from the date of<br />
adhesion.<br />
Figure 2 – Details from Covenant of Mayors website<br />
In this case, since the date of the<br />
adhesion for the locality of <strong>Qre</strong>ndi<br />
was the 2 nd day of October 2009, the<br />
<strong>Sust</strong>aina<strong>ble</strong> <strong>En</strong>ergy <strong>Actio</strong>n <strong>Plan</strong><br />
(SEAP) has to be completed within<br />
one year from this date, that is, by<br />
the end of September 2010.<br />
As a basis for the SEAP, a Baseline Emissions Inventory (BEI) is prepared to provide<br />
knowledge of the entities contributing to CO2 emissions in the locality’s geographical area.<br />
The BEI shall also be used to identify and select appropriate actions and opportunities for<br />
reaching the locality’s targets.<br />
Figure 1 – Covenant of Mayors Logo<br />
5
In future, in order to monitor progress of implementation of the actions within the SEAP, a<br />
Monitoring Emissions Inventory (MEI) shall be prepared to establish whether actions have<br />
been successful in reducing the overall emissions.<br />
This SEAP must be envisaged as a key document illustrating how the Local Council shall<br />
reach its commitment by 2020. It defines concrete reduction measures which translate the<br />
long‐term strategy into action and which shall have an effect on everyone including the<br />
private sector.<br />
As described by the European Commission itself, action plans shall include actions in the<br />
following sectors:<br />
• Built environment, including new buildings and major refurbishment;<br />
• Municipal infrastructure (district heating, public lighting, smart grids, etc);<br />
• Land use and urban planning;<br />
• Decentralised renewa<strong>ble</strong> e<strong>nergy</strong> sources;<br />
• Public and private transport policies and urban mobility;<br />
• Citizen and, in general, civil society participation;<br />
• Intelligent e<strong>nergy</strong> behaviour by citizens, consumers and businesses.<br />
This <strong>Sust</strong>aina<strong>ble</strong> <strong>En</strong>ergy <strong>Actio</strong>n <strong>Plan</strong> shall not be regarded as a rigid document. As<br />
circumstances change and as experience is gained through the ongoing implementation of<br />
actions, it may be useful to revise the plan. Furthermore, the plan establishes a strategy<br />
which is at least 10 years long. As a consequence, technological developments within the<br />
coming decade are foreseen to be significant.<br />
For this reason, it may make technical sense to revise the SEAP at least during its mid‐term<br />
to include any actions or opportunities that may arise. The impacts of missing such<br />
opportunities may be significant and long lasting.<br />
6
2. The National Situation<br />
The Ministry for Resources and Rural Affairs has presented the National Strategy for Policy<br />
and Abatement Measures relating to the reduction of Greenhouse Gas emissions in<br />
September 2009.<br />
The same national strategy underlines that a number of proposed actions require further<br />
study as it was not deemed possi<strong>ble</strong> or realistic that the published strategy document<br />
would be comprehensive in terms of the details and impacts of each policy or abatement<br />
measure considered.<br />
Furthermore, it was emphasized that the proposed strategy is not absolute and immuta<strong>ble</strong>.<br />
As new challenges emerge and unforeseen opportunities arise, the strategy should be<br />
reviewed and reconsidered. This strategy for policy and abatement measures relating to<br />
the reduction of Greenhouse Gas emissions was based on the following building blocks:<br />
Figure 3 – National Strategy building blocks<br />
In the same way, this <strong>Actio</strong>n <strong>Plan</strong> shall be seen as a dynamic document. It attempts to<br />
include those measures presented in the National Strategy that can be implemented at<br />
local level. Given the limited jurisdiction and budgets of Local Councils, many of such<br />
actions shall require financial and administrative support of the Central Government.<br />
7
This should not be a strenuous feat as such actions performed by the Local Council shall be<br />
in line with the national strategy and shall be deemed to be contributing to the<br />
achievement of the national targets.<br />
As a part of the mentioned National Strategy, the country shall undergo a substantial<br />
investment in e<strong>nergy</strong> supply by considering the possibility of substituting present sources<br />
of e<strong>nergy</strong> by cleaner solutions. Since electricity production is the major source of CO2<br />
emissions, it is envisaged that any improvement in this regard shall contribute to an<br />
improvement in the National Emission Factor and as result reduce the locality’s portion of<br />
CO2 emissions.<br />
In addition, as a part of the <strong>En</strong>ergy Demand Management measures, it is expected that<br />
national measures such as the installation of smart utility meters, promotion of e<strong>nergy</strong><br />
efficient appliances and the implementation of the EU Directive on the ban on<br />
incandescent lights shall also be a contributor to the overall reduction of the locality’s<br />
e<strong>nergy</strong> requirements.<br />
The implementation of the <strong>En</strong>ergy Performance of Buildings Directive shall have a long<br />
term effect to reduce e<strong>nergy</strong> requirements of buildings in the locality. However, since the<br />
positive effects of this Directive are considered to be achieva<strong>ble</strong> over a number of years, it<br />
is unlikely that this shall have a measurea<strong>ble</strong> effect over the term of the Covenant of<br />
Mayors.<br />
The national measures aimed to stimulate the penetration and use of renewa<strong>ble</strong> e<strong>nergy</strong><br />
systems shall be looked upon closely by the Local Council. It shall attempt, as a part of this<br />
action plan, to help its citizens in tapping on the financial and technical resources made<br />
availa<strong>ble</strong> by central government in the implementation of the National Strategy.<br />
8
3.<br />
517 inha abitants/kmm<br />
2 is quite be elow the national<br />
avera age and is coonsidered<br />
to o be amongst<br />
the loweest.<br />
About the Loccality<br />
off<br />
<strong>Qre</strong>nd di<br />
compare ed to the national aveerage<br />
of 13308<br />
inhabitaants/km<br />
2 , itts<br />
populatioon<br />
density oof<br />
The locaal<br />
administrrative<br />
body is the <strong>Qre</strong>nddi<br />
Local Cou uncil which is democrattically<br />
electeed<br />
and con nsists of five members in ncluding thee<br />
Mayor. Th he office of tthe<br />
Mayor is s occupied bby<br />
candidates<br />
of the poolitical<br />
partyy<br />
which obtaains<br />
the absoolute<br />
majoritty<br />
at the elections.<br />
The office<br />
of the Mayor<br />
is curre ently occupied<br />
by Mr. Carmel C Falzon<br />
who is thee<br />
signatory oof<br />
the Cove enant of Ma ayors.<br />
Figure<br />
4 – Geographiical<br />
position and pphotos<br />
of <strong>Qre</strong>ndi<br />
In 20055,<br />
<strong>Qre</strong>ndi had<br />
a popul lation of 2, 535 inhabittants<br />
over an area of 4.9km 2 . AAs<br />
the eleccted<br />
Councillor<br />
who ob btains the hhighest<br />
number<br />
of first count votees<br />
among thhe<br />
9
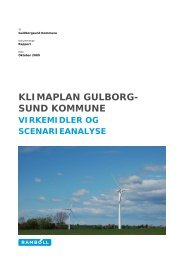
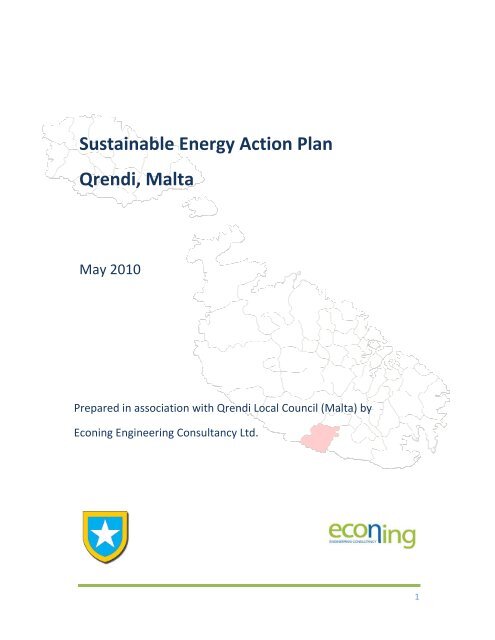
The little<br />
village of <strong>Qre</strong>ndi is situated<br />
to thhe<br />
south weest<br />
of the Islland,<br />
between<br />
two otheer<br />
villages Mqabba and<br />
Zurrieq. The<br />
village booasts<br />
of two o of the Maltese<br />
megalithic<br />
sites, thhe<br />
famous Ħaġar Qim and Mnajdra<br />
temples. These are our well doocumented<br />
aand<br />
well keppt<br />
templess<br />
from the Co opper Age. Other smalller<br />
finds in this<br />
village innclude<br />
Misraaħ<br />
Sinjura annd<br />
Sqaq il‐ Bal. The chuurch<br />
conseccrated<br />
to the<br />
Assumptioon<br />
of Our LLady,<br />
becamme<br />
a parish in<br />
1618. TThere<br />
are alsso<br />
a number of other chaapels<br />
in the vicinity.<br />
Figure<br />
5 – Mnajdra and<br />
Hagar Qim<br />
110
4. Political Commitment<br />
The <strong>Qre</strong>ndi Local Council wants to create a healthy, thriving development with increasing<br />
concern for its environment and surrounding natural resources. As a result, it wants that<br />
all developments, in future, will be conducted with sus<strong>tainab</strong>ility in mind.<br />
The <strong>Qre</strong>ndi Local Council has already committed itself by adhering to the Covenant of<br />
Mayors since 2 nd October 2009. In addition, it has taken an active role by starting the<br />
process required in the Covenant of Mayors. This <strong>Sust</strong>aina<strong>ble</strong> <strong>En</strong>ergy <strong>Actio</strong>n <strong>Plan</strong> is a step<br />
in the right direction encouraging citizens to take the responsibility for their own part,<br />
however small, in conserving the environment. It aims to reduce climate change by<br />
reducing CO2 emissions.<br />
The Local Council is aware that to realize its ambitions to reduce the locality’s impact on<br />
climate change it needs to encourage the reduction of use of fossil fuels and a challenging<br />
plan of actions is required to define its commitment to reducing CO2 emissions.<br />
The Local Council is also conscious that to achieve its overall target, it needs to involve all<br />
stakeholders in the process. Each citizen of the locality needs to be involved to participate<br />
in, at least, some of the actions of this plan. There may be several methods to secure<br />
public participation and this plan attempts to identify a number of possibilities.<br />
It is evident that due to the limited administrative power of Local Councils in general, it<br />
shall have to rely on a number of actions that need to be implemented by the Central<br />
Government. Nevertheless, it shall do its utmost to lobby for the implementation of the<br />
necessary actions.<br />
11
5. Baseline Emissions Inventory (BEI)<br />
5.1 Selection of Baseline Year<br />
It is to be noted that Local Councils in <strong>Malta</strong> are a fairly recent political development. They<br />
have been established by Act of Parliament in 1993 (Act XV of 1993 – Local Councils Act).<br />
Prior to this development, since <strong>Malta</strong> was considered as one political entity, statistical<br />
data was separated mainly according to the divisions of the two main islands, namely <strong>Malta</strong><br />
and Gozo, of the Maltese archipelago.<br />
For this reason, statistical data by locality is not readily availa<strong>ble</strong> in all fields and, where<br />
availa<strong>ble</strong>, it does not date back extensively. National statistical data has been published at<br />
locality level with some degree of detail in the National Census of 2005.<br />
Consequently, it has been resolved that the furthest year for which the most<br />
comprehensive and relia<strong>ble</strong> data can be collected is the year 2005. It is predicted, that<br />
future data at locality level will be accessi<strong>ble</strong> to a higher level of detail. Hence, Monitoring<br />
Emissions Inventories, to be presented in future, as committed in the Covenant of Mayors,<br />
may include adjustments and improvements in the accuracy of the emissions data at<br />
locality level.<br />
12
5.2 Sources of Data<br />
Data relating to municipal buildings, equipment and facilities, municipal fleet and municipal<br />
public lighting has been provided directly by the local council. Besides this direct data, the<br />
following primary sources of data have been consulted in the preparation of the Baseline<br />
Emissions Inventory:<br />
National Statistics Office: <strong>En</strong>ergy Consumption in <strong>Malta</strong>, 2000 – 2007.<br />
National Statistics Office: Census of Population and Housing 2005,<br />
Volume 1: Population.<br />
National Statistics Office: Census of Population and Housing 2005,<br />
Volume 2: Dwellings.<br />
National Statistics Office: Transport Statistics, 2005.<br />
<strong>Malta</strong> <strong>En</strong>vironment and <strong>Plan</strong>ning Authority: GHG Inventory for <strong>Malta</strong>,<br />
Common Reporting Format (CRF) Ta<strong>ble</strong>s, Submission 2009, v1.3<br />
National Greenhouse Gas Emissions Inventory Report for <strong>Malta</strong>, 1990‐2007,<br />
March 2009.<br />
<strong>En</strong>emalta Corporation, Annual Report, 2005.<br />
Water Services Corporation, Annual Report, 2005.<br />
Street Lighting Survey Maps, <strong>Qre</strong>ndi Local Council.<br />
13
5.3 Availability of Data and Fields of <strong>Actio</strong>n<br />
The Joint Research Committee (JRC) document named “Existing Methodologies and Tools<br />
for the Development and Implementation of SEAPs”, dated September 11, 2009, states<br />
that small municipalities usually have less data about e<strong>nergy</strong> consumption making the<br />
baseline estimation more difficult.<br />
Consequently, it has been inevita<strong>ble</strong> to perform a degree of proportioning of national data<br />
to locality level. However, extreme care has been taken such that the proportioning<br />
models are truly representative of the situation in the locality.<br />
As a result, the scope of the Baseline Emissions Inventory and eventually the <strong>Sust</strong>aina<strong>ble</strong><br />
<strong>En</strong>ergy <strong>Actio</strong>n <strong>Plan</strong> abide by the outcome of the JRC Workshop on Methodologies for<br />
<strong>Sust</strong>aina<strong>ble</strong> <strong>En</strong>ergy <strong>Actio</strong>n <strong>Plan</strong>s (SEAPs) under the Covenant of Mayors that has taken<br />
place in Ispra, Italy on May 18, 2009.<br />
During this workshop, there has been a presentation entitled “Issues and Methods for<br />
Developing a SEAP for a small city”. The approach taken in the developing of this Baseline<br />
Emissions Inventory and <strong>Sust</strong>aina<strong>ble</strong> <strong>En</strong>ergy <strong>Actio</strong>n <strong>Plan</strong> follows the guidelines mentioned<br />
in the presentation. The fields of action are stated below, identifying whether the local<br />
council has authority, competence and jurisdiction on the particular field.<br />
14
SEAP FIELDS OF ACTION:<br />
NON STRICTLY ON ENERGY, IDENTIFIED BY LOCAL COUNCIL COMPETENCE<br />
Field of <strong>Actio</strong>n<br />
Road Transport<br />
(Private and Commercial)<br />
Under Direct<br />
Local Council<br />
Jurisdiction<br />
Emissions<br />
Inventory<br />
<strong>Actio</strong>n<br />
Proposals<br />
Reduction<br />
Commitment<br />
NO YES YES NO<br />
Public Transport NO YES YES NO<br />
Municipal Fleet YES YES YES YES<br />
Water Consumption NO YES YES NO<br />
Others NO NO YES NO<br />
SEAP FIELDS OF ACTION:<br />
STRICTLY ON ENERGY, IDENTIFIED BY LOCAL COUNCIL COMPETENCE<br />
Field of <strong>Actio</strong>n<br />
Municipal Buildings, Directly<br />
Managed or by Concession<br />
Under Direct<br />
Local Council<br />
Jurisdiction<br />
Emissions<br />
Inventory<br />
<strong>Actio</strong>n<br />
Proposals<br />
Reduction<br />
Commitment<br />
YES YES YES YES<br />
Residential Buildings NO YES YES NO<br />
Tertiary Buildings (Small<br />
Businesses, Shops, Repair Shops,<br />
etc.)<br />
Ta<strong>ble</strong> 1 – SEAP Fields of <strong>Actio</strong>n (non‐strictly on e<strong>nergy</strong>)<br />
NO YES YES NO<br />
Municipal Public Lighting NO YES YES YES<br />
Traffic Lights NO YES YES YES<br />
Municipal Fleet YES YES YES YES<br />
Others NO NO YES NO<br />
Ta<strong>ble</strong> 2 – SEAP Fields of <strong>Actio</strong>n (strictly on e<strong>nergy</strong>)<br />
15
For fields of action for which the local authority does not have jurisdiction, the action plan<br />
has been limited to an estimation of emissions, which is as accurate as far as reasonably<br />
practica<strong>ble</strong>, together with proposals for action to reduce CO2 emissions. No commitment<br />
on the amount of reduction can be justifiably made by the local council as it has no control<br />
whatsoever over these particular fields of action.<br />
An exception to this rule is in the field of action relating to municipal public lighting. It is<br />
very likely that by the year 2020, that is, during the course of the Covenant of Mayors, the<br />
competence on public lighting excluding lighting of national arterial roads shall be de‐<br />
centralised to be controlled by local councils. Should this not materialize, the local council<br />
shall, nevertheless, endeavour to implement the proposed actions to achieve the<br />
anticipated targets.<br />
Where applica<strong>ble</strong>, details on the methodology employed for proportioning of national data<br />
are availa<strong>ble</strong> under the relevant subheadings in the next chapter.<br />
16
6. Buildings, Equipment, Facilities and Industries<br />
6.1 Municipal Buildings, Equipment and Facilities<br />
The local council operates one small office building in Triq il‐Knisja and has one rented<br />
building in Triq il‐Kbira used for public courses, meetings and exhibitions. The estimated<br />
electrical e<strong>nergy</strong> consumption for these buildings in the baseline year was equal to<br />
3.65 MWh. Emissions generated due to this consumption are equal to 3.16 tCO2.<br />
In addition, the council is responsi<strong>ble</strong> for two public recreational areas known as<br />
Ġnien tal‐Kmand and Ġnien N. Communet. These areas have an annual consumption of<br />
1.41 MWh equivalent to 1.22 tCO2.<br />
Furthermore, two public monuments are under the jurisdiction of the Local Council, these<br />
being the Monument for Youth and Life and the War Memorial. The e<strong>nergy</strong> consumption<br />
for these monuments was 1.34 MWh in the baseline year. This is equivalent to 1.16 tCO2.<br />
In total, the e<strong>nergy</strong> consumption for municipal buildings equipment and facilities, in the<br />
baseline year, is equal to 6.40 MWh. The associated CO2 emissions add up to 5.54 tCO2.<br />
17
ENERGY CONSUMPTION FOR MUNICIPAL BUILDINGS, EQUIPMENT AND FACILITIES<br />
Building / Equipment / Facility<br />
<strong>En</strong>ergy Consumption<br />
(MWh)<br />
CO2 Emissions<br />
(tCO2)<br />
Office Buildings 3.65 3.16<br />
Recreational Areas 1.41 1.22<br />
Others (Public Monuments) 1.34 1.16<br />
Total <strong>En</strong>ergy Consumption &<br />
Total CO2 Emissions<br />
6.40 5.54<br />
Ta<strong>ble</strong> 3 –<strong>En</strong>ergy Consumption for Municipal buildings, equipment and facilities<br />
18
6.2 Residential Buildings<br />
Data for e<strong>nergy</strong> consumption in residential buildings only, at a locality level, was not<br />
availa<strong>ble</strong> from the utility supplier. For this reason, a national proportioning method has<br />
been employed. A two dimensional matrix, representing the types of dwellings by number<br />
of persons living in the dwelling and number of rooms has been created. A weighting<br />
factor for the number of persons and another weighting factor for the number of rooms,<br />
both relating to electricity consumption, have been assigned. Similarly, a set of weighting<br />
factors has been assigned relating to fuel combustion in residential buildings.<br />
The dwelling stock data used in the weighting matrix can be seen in App<strong>endi</strong>x 1.<br />
6.2.1 Electricity<br />
In the baseline year, 2005, a total of 2,260,762 MWh of electricity were generated in <strong>Malta</strong>.<br />
Fossil fuel used to generate this amount of electricity produced 1961.27 Gg of CO2. This<br />
value is based on the quantity reported in the National Greenhouse Gas Emission Inventory<br />
for <strong>Malta</strong> and the values therein have been calculated using standard emission factors in<br />
line with IPCC principles. As a result, the overall emission factor for electricity has been<br />
calculated to be equal to 0.867 tCO2/MWh.<br />
Of the total electricity generated, 658,224 MWh have been used at a national level for<br />
domestic (residential) purposes. Using the two dimensional matrix model, as described<br />
above, 3351.09 MWh can be attributed to electricity usage in residential buildings in the<br />
locality.<br />
Applying the above calculated emission factor results in a CO2 contribution of 2905.39 tCO2<br />
for the baseline year.<br />
19
6.2.2 Liquefied Petroleum Gas (LPG)<br />
A similar approach has been employed for the purpose of establishing the locality’s<br />
contribution of fuel combustion in residential buildings. The National Emissions Inventory<br />
for <strong>Malta</strong>, states that 99% of fuel combustion in residential buildings originates from the<br />
combustion of liquefied petroleum gas (LPG).<br />
<strong>En</strong>emalta Corporation imported 19,513 tons of LPG in 2005. Of these, 80% was sold in<br />
cylinders for residential use equating to 15,610.4 tons of LPG. Using an average calorific<br />
value of 12.45 kWh/kg of LPG results in a final e<strong>nergy</strong> consumption of 194,349 MWh.<br />
Using the IPCC emission factor for LPG of 0.227 tCO2/MWh, results in 43.86 Gg of CO2<br />
emissions. The National Inventory report 44.44 Gg of CO2 emissions from fuel combustion<br />
in residential buildings for 2005. The difference is attributed to minor use of kerosene in<br />
residential buildings, equivalent to 2285.16 MWh and 580 tCO2.<br />
By applying the two dimensional matrix, described above, 965.61 MWh equivalent of liquid<br />
gas can be attributed to the locality of <strong>Qre</strong>ndi. The equivalent quantity of CO2 emissions is<br />
equal to 219.19 tCO2 for the baseline year.<br />
6.2.3 Kerosene<br />
The use of kerosene (reported as “heating oil” in the baseline inventory) is equivalent to<br />
11.35 MWh of e<strong>nergy</strong> and 2.88 tCO2 for the baseline year.<br />
20
EN NERGY CONSUUMPTION<br />
FOOR<br />
RESIDENTIAL<br />
BUILDINGGS<br />
Eleectricity<br />
Typee<br />
of Fuel<br />
Liqquefied<br />
Petro oleum Gas (LP PG)<br />
Heeating<br />
Oil (Kerosene)<br />
To otal <strong>En</strong>ergy Coonsumption<br />
&<br />
To otal CO2 Emiss sions<br />
965.61<br />
11.35<br />
<strong>En</strong>eergy<br />
Consumpption<br />
(MWh)<br />
3351.09<br />
965.61<br />
11.35<br />
4328.05<br />
Ta<strong>ble</strong> 4 –<strong>En</strong>ergy Consumpption<br />
for residentiaal<br />
buildings<br />
335 51.09<br />
CO2 Emissioons<br />
(tCO2)<br />
2905.39<br />
219.19<br />
2.88<br />
3127.46<br />
Electricity E<br />
LPG L<br />
Heating H Oil<br />
Figure 6 – Pie<br />
chart for e<strong>nergy</strong> y consumption in MMWh<br />
for residentiial<br />
buildings<br />
221
6.3 Tertiary (Non Municipal) Buildings, Equipment and Facilities<br />
As explained above, electricity consumption data for the locality is not split by sector.<br />
However, since a reasona<strong>ble</strong> good degree of confidence exists for the estimation of<br />
residential electrical e<strong>nergy</strong> consumption, and since the locality does not have any<br />
particularly sizea<strong>ble</strong> industries, the amount of electrical e<strong>nergy</strong> used in tertiary buildings,<br />
equipment and facilities is deemed to be equal to the difference between the locality’s<br />
total electrical e<strong>nergy</strong> metered and the sum of the municipal and residential e<strong>nergy</strong><br />
consumption. This may prove to be a slight overestimation of the tertiary e<strong>nergy</strong><br />
consumption.<br />
6.3.1 Electricity<br />
The locality’s total electricity consumption, excluding street lighting, for the baseline year,<br />
was 5,119.89 MWh. Using the above assumption, the electrical e<strong>nergy</strong> consumption in the<br />
tertiary (non municipal) buildings, equipment and facilities is equal to 1,762.40 MWh.<br />
Using the emission factor for electricity calculated above, the CO2 contribution of tertiary<br />
(non municipal) buildings, equipment and facilities for the baseline year is equal to<br />
1,528.00 tCO2 for the baseline year.<br />
6.3.2 Liquefied Petroleum Gas (LPG)<br />
Since bulk fuel is distributed by a number of private contractors, consumption of fuels by<br />
locality is not availa<strong>ble</strong> from <strong>En</strong>emalta Corporation. On a national level, using the data<br />
from the GHG CRF Ta<strong>ble</strong>s for <strong>Malta</strong> for the baseline year, the total amount of liquefied<br />
petroleum gas (LPG) used in commercial and institutional buildings amounts to<br />
47,059.84 MWh equivalent to 10,600 tCO2.<br />
22
Using data from the National Statistics Office, a total of 264 businesses operate in the<br />
locality of <strong>Qre</strong>ndi. This is equivalent to 0.479% of the national business community.<br />
Although due to their different nature of operations, different businesses consume<br />
different amounts of e<strong>nergy</strong> per unit, since data is not availa<strong>ble</strong> at a locality level, it is<br />
considered appropriate to allocate the same percentage for the fuel combustion in tertiary<br />
(non municipal) buildings to the locality.<br />
With this rationale, the e<strong>nergy</strong> from liquid gas consumed in the locality equates to<br />
225.42 MWh equivalent to 51.17 tCO2.<br />
6.3.3 Other Fossil Fuels<br />
On a national level, the total amount of other liquid fuels used, amounts to 152,385.7 MWh<br />
equivalent to 40,400 tCO2.<br />
Using the same reasoning as for LPG, an amount of 729.93 MWh of e<strong>nergy</strong> from other<br />
liquid fuels was consumed in the baseline year in the locality, equivalent to 193.52 tCO2.<br />
This latter amount includes both heating oil and diesel but the proportions of the two types<br />
of fuel are not availa<strong>ble</strong>. For this reason, it is reported under “Other Fossil Fuels” in the<br />
Baseline Emissions Inventory ta<strong>ble</strong>s.<br />
When one considers the proximity of localities in <strong>Malta</strong> together with the fact that citizens<br />
frequently make use of businesses from localities other than their own, the above<br />
calculation of proportioning fuel consumption in tertiary (non municipal) buildings by the<br />
proportion of businesses registered in the locality is the best possi<strong>ble</strong> approximation using<br />
the data availa<strong>ble</strong>.<br />
23
EN NERGY CONSUUMPTION<br />
FOOR<br />
TERTIARY ( (NON MUNICCIPAL)<br />
BUILDINGS,<br />
EQUIPM MENT<br />
ANND<br />
FACILITIESS<br />
Eleectricity<br />
Typee<br />
of Fuel<br />
Liqquefied<br />
Petro oleum Gas (LP PG)<br />
Otther<br />
Fossil Fueels<br />
(inncludes<br />
Heatin ng Oil and Dieesel)<br />
To otal <strong>En</strong>ergy Coonsumption<br />
&<br />
To otal CO2 Emiss sions<br />
225.42<br />
72 29.93<br />
<strong>En</strong>eergy<br />
Consumpption<br />
(MWh)<br />
1762.4<br />
225.42<br />
729.93<br />
2717.75<br />
TTa<strong>ble</strong><br />
5 –<strong>En</strong>ergy CConsumption<br />
for te ertiary buildings, eequipment<br />
and faccilities<br />
17762.4<br />
CO2 Emissioons<br />
(tCO2)<br />
1528.00<br />
51.17<br />
193.52<br />
1772.69<br />
Electriccity<br />
LPG<br />
Other Fossil F Fuels<br />
Figure 7 – Pie chart<br />
for e<strong>nergy</strong> connsumption<br />
in MWh h for tertiary builddings<br />
224
6.4 Accuracy of Electrical <strong>En</strong>ergy Allocation by Sector<br />
It is to be pointed out that although there may be some errors in the allocation of electrical<br />
e<strong>nergy</strong> by sector, since all electrical e<strong>nergy</strong> has been provided from one source, namely<br />
<strong>En</strong>emalta Corporation, the overall total electrical e<strong>nergy</strong> consumed in the locality is correct<br />
as it is recorded from billing data.<br />
Any over or underestimation in the residential electrical e<strong>nergy</strong> consumption is inversely<br />
reflected in the tertiary (non municipal) electrical e<strong>nergy</strong> consumption and the overall<br />
estimation of the CO2 emissions by the locality is reasonably accurate.<br />
25
6.5 Municipal Public Lighting<br />
An inventory of street lighting luminaries has been collected from street lighting survey<br />
maps provided by the local council. Together with this, the annual operating time was also<br />
estimated in order to achieve a figure for the annual e<strong>nergy</strong> consumption for each type of<br />
light fitting installed.<br />
ESTIMATE OF ENERGY CONSUMPTION FOR STREET LIGHTING IN THE LOCALITY<br />
Type<br />
Number of<br />
Fittings<br />
Nominal Power<br />
Consumption<br />
(W)<br />
Power Consumption<br />
Including Control Gear<br />
(W)<br />
Estimated Annual<br />
<strong>En</strong>ergy Consumption<br />
(kWh)<br />
Y 23 70 77 7651<br />
L 122 70 77 40582<br />
W 175 70 77 58212<br />
S 47 250 275 55836<br />
D 5 500 550 11880<br />
R 12 70 77 3992<br />
C 2 250 275 2376<br />
F 6 400 440 11405<br />
TOTAL 392 191,934<br />
Ta<strong>ble</strong> 6 –<strong>En</strong>ergy Consumption for street lighting<br />
26
The findings of this street lighting e<strong>nergy</strong> consumption inventory are reproduced above for<br />
completeness and for straightforward reference.<br />
For traceability purposes, the nomenclature pertaining to the type of fittings is identical to<br />
the nomenclature availa<strong>ble</strong> on the inventory provided by the local council.<br />
The annual e<strong>nergy</strong> consumption for municipal street lighting in the baseline year is equal to<br />
191.93 MWh.<br />
Since the source of e<strong>nergy</strong> for municipal public lighting is electricity, originating from the<br />
same source, the equivalent emission factor is identical as for residential buildings,<br />
specifically 0.867 tCO2/MWh. This corresponds to an annual CO2 emission for municipal<br />
public lighting of 166.40 tCO2.<br />
To some extent, this e<strong>nergy</strong> consumption is apparently high when compared to the size of<br />
the urban area of the locality. However, it must be noted that since the area of Wied iż‐<br />
Żurrieq is within the geographical boundary of the locality, then the e<strong>nergy</strong> consumed by<br />
street lighting in this area is attributed to the locality of <strong>Qre</strong>ndi.<br />
27
6.6 Industries<br />
Industries are currently under the responsibility of <strong>Malta</strong> <strong>En</strong>terprise, a central government<br />
agency responsi<strong>ble</strong> for the promotion of foreign investment and industrial development in<br />
<strong>Malta</strong>. This agency is already advocating e<strong>nergy</strong> saving initiatives under the European<br />
Regional Development Fund (ERDF) and several grants have been given to aid industries in<br />
reducing their e<strong>nergy</strong> consumption and carbon footprint.<br />
Since industries are therefore not under the jurisdiction of the local council, and since the<br />
authority of local councils over industrial estates is specifically excluded under the Local<br />
Councils Act, emissions due to industries have been explicitly excluded from the Baseline<br />
Emissions Inventory and the <strong>Sust</strong>aina<strong>ble</strong> <strong>En</strong>ergy <strong>Actio</strong>n <strong>Plan</strong>.<br />
This option is in line with the guidelines for Baseline Emissions Inventories under the<br />
Covenant of Mayors.<br />
28
7. Transport<br />
7.1 Municipal Fleet<br />
The local council does not own or operate any vehicles. Thus no emissions can be<br />
attributed in this regard. Any transport services made use of by the local council would be<br />
accounted for under the commercial transport section of this report.<br />
29
7.2 Public Transport<br />
The locality is served by one route on the national public transport schedule. It has been<br />
calculated that, on an annual bases, 27,431 trips are undertaken. The route length is<br />
approximately equal to 13.8 km. This results in an annual travel distance of 378,548 km.<br />
The public transport service in <strong>Malta</strong> is operated by a mixture of new and old vehicles,<br />
some of which dating back as far as the 1970’s. All vehicles are operated by Diesel<br />
powered internal combustion engines. When considering the number of stops, the means<br />
speed and the type of buses in operation, a fuel consumption value of 55l/100km has been<br />
considered reasona<strong>ble</strong> to estimate the fuel consumption on this route. Therefore, the<br />
calculated annual Diesel consumption is that of 208,201 litres.<br />
Using a calorific value of 10.0 kWh/l of Diesel, then, the e<strong>nergy</strong> consumption for public<br />
transport for the locality is equal to 2082.01 MWh. Applying the IPCC emission factor of<br />
0.267 tCO2/MWh for Diesel, gives an annual emission of 555.90 tCO2.<br />
30
7.3 Private and Commercial Transport<br />
The case of private and commercial transport is similar to that for residential and<br />
commercial buildings, that is, there is no locality specific data. Due to the close proximity<br />
of localities in <strong>Malta</strong>, it is very common that vehicles are refuelled in a locality other than<br />
the registered locality. For this reason, it has been considered inappropriate to obtain fuel<br />
consumption data per locality.<br />
Once again, a level of proportioning of national data has been inevita<strong>ble</strong>.<br />
An analysis of the vehicle stock for the baseline year was carried out. It was found out that<br />
the locality had 15 agricultural vehicles, 314 commercial vehicles, 6 garage hire vehicles, 95<br />
motorcycles, 1,112 private vehicles, 10 buses and 3 taxis in the baseline year.<br />
A fuel consumption weighting factor has been assigned to each type of vehicle based on<br />
the engine capacity and estimated activity. From this, the annual e<strong>nergy</strong> consumption and<br />
CO2 emissions allocated to the locality have been calculated.<br />
The amount attributa<strong>ble</strong> to public transport has been deducted to avoid dou<strong>ble</strong><br />
accounting. This is accounted for under a separate computation (see above).<br />
The e<strong>nergy</strong> consumption for private and commercial transport for the baseline year is<br />
equal to 13,031.22 MWh divided as 6,626.71 MWh from Gasoline (Petrol), 6,355.41 MWh<br />
from Diesel and 49.10 MWh originating from the use of Bio‐Diesel.<br />
Since proportioning of National data has been carried out in this part of this exercise, the<br />
emission conversion factors used in the National Emissions Inventory Report were used for<br />
consistency. The equivalent CO2 emissions add up to 3,326.82 tCO2 in total, divided as<br />
1,636.68 tCO2 due to combustion of Gasoline (Petrol), 1,677.62 tCO2 due to combustion of<br />
Diesel and 12.52 tCO2 due to combustion of Bio‐Diesel for private and commercial<br />
transport.<br />
31
EN NERGY CONSUUMPTION<br />
FOOR<br />
PRIVATE AAND<br />
COMMERRCIAL<br />
TRANSSPORT<br />
Dieesel<br />
Gaasoline<br />
Bio o fuel<br />
Typee<br />
of Fuel<br />
To otal <strong>En</strong>ergy Coonsumption<br />
&<br />
To otal CO2 Emiss sions<br />
6626.71<br />
49.1<br />
<strong>En</strong>eergy<br />
Consumpption<br />
(MWh)<br />
6355.41<br />
6626.71<br />
49.10<br />
13031.22<br />
Ta<strong>ble</strong> 7 – –<strong>En</strong>ergy Consumpttion<br />
for private annd<br />
commercial tran nsport<br />
6355.41<br />
CO2 Emissioons<br />
(tCO2)<br />
1677.62<br />
1636.68<br />
12.52<br />
3326.82<br />
Diesel<br />
Gasoline<br />
Biofuel<br />
Fi igure 8 – Pie chartt<br />
for e<strong>nergy</strong> consumption<br />
in MWh foor<br />
private and commmercial<br />
transportt<br />
332
8. Others<br />
8.1 Water Consumption<br />
Production of pota<strong>ble</strong> water in <strong>Malta</strong> is mainly by means of sea water desalination. Hence,<br />
the provision of water is an e<strong>nergy</strong> intensive process. For this reason, it has been deemed<br />
sensi<strong>ble</strong> to include the CO2 related to the production and distribution of water in the<br />
baseline emissions inventory.<br />
From utility billing data, the water consumption for the locality, in the baseline year, was<br />
equal to 76,040 m 3 . According to the Water Services Corporation, the specific e<strong>nergy</strong> for<br />
the production and distribution of water for 2005 was 5.89 kWh/m 3 . This means that the<br />
e<strong>nergy</strong> consumption relating to the production and distribution of water in the locality for<br />
the baseline year was equal to 447.88 MWh.<br />
Since the source of this e<strong>nergy</strong> is electricity, using the emission factor of 0.867 tCO2/MWh<br />
results in a CO2 emission for water production and distribution of 388.31 tCO2.<br />
33
9. Baseline Emissions Inventory (BEI) Summary<br />
9.1 Overview<br />
The total e<strong>nergy</strong> consumption for the locality, in the baseline year, 2005, was equal to<br />
22,805.24 MWh. The associated CO2 emissions generated totalled 9,343.12 tCO2.<br />
The corresponding annual values per capita are 9.00 MWh/capita and 3.69 tCO2/capita.<br />
Annual <strong>En</strong>ergy Consumption<br />
(MWh)<br />
Annual CO2 Emissions<br />
(t CO2)<br />
Locality Total 22,805.24 9,343.12<br />
Per Capita 9.00 3.69<br />
Ta<strong>ble</strong> 8 –Overview of annual e<strong>nergy</strong> consumption<br />
34
9.2 <strong>En</strong>eergy<br />
Consuumption<br />
by<br />
Sector<br />
557.14%<br />
Municipal<br />
Buildings, Eq quipment and Facilities Tertiary<br />
(Non Muunicipal)<br />
Residenttial<br />
Buildings<br />
Water Production<br />
and Distribution<br />
Private and a Commercial<br />
Transport<br />
The abo ove pie chartt<br />
shows the distribution of e<strong>nergy</strong> coonsumption<br />
by sector, in<br />
the locality.<br />
The larggest<br />
consumer<br />
of e<strong>nergy</strong>y<br />
is the sectoor<br />
of Privatee<br />
and Commercial<br />
Transpport<br />
(57.14% %)<br />
followedd<br />
by Residential<br />
Buildinngs<br />
(18.98% ). This is foollowed<br />
by Tertiary (Noon<br />
Municipaal)<br />
Buildinggs,<br />
Equipmennt<br />
and Facilit ties (11.92% %) and Public c Transport ( (9.13%).<br />
fraction of the locality’s<br />
e<strong>nergy</strong> consumptioon.<br />
0.03%<br />
11.92%<br />
Public<br />
Lighting<br />
Public<br />
Transport<br />
99.13%<br />
18.98% %<br />
0.84%<br />
1.96%<br />
Figuure<br />
9 – Pie chart foor<br />
e<strong>nergy</strong> consumption<br />
by sector<br />
Municippal<br />
Buildings s, Equipmennt<br />
and Facilities,<br />
as exxpected,<br />
conntribute<br />
to a very smaall<br />
335
9.3 <strong>En</strong>eergy<br />
Consuumption<br />
by<br />
Source<br />
The sou urces of eneergy<br />
in the locality aree<br />
Electricity, Liquid Gass,<br />
Diesel andd<br />
Heating OOil<br />
(combinned<br />
as indica ated in Tertia ary buildingss<br />
estimates) , Gasoline annd<br />
Bio fuels. .<br />
5.33%<br />
0.22%<br />
Electriccity<br />
(water production<br />
excludded)<br />
Diesel aand<br />
Heating Oil<br />
Biofuell<br />
Gasolinne<br />
29.64%<br />
Diesel and a heating oil are the mmajor<br />
contriibutors<br />
of en<strong>nergy</strong><br />
supplyying<br />
the Transport<br />
sectoor<br />
and to a lesser exte ent as a sourrce<br />
of heat inn<br />
Tertiary (NNon<br />
Municippal)<br />
Buildingss.<br />
Gasoline is<br />
the next t largest souurce<br />
of enerrgy<br />
and is alsso<br />
used in thhe<br />
Transporrt<br />
sector. Th he next majoor<br />
contribu utor is Electricity,<br />
mainnly<br />
consumed<br />
in Residdential<br />
Builddings<br />
and TTertiary<br />
(Noon<br />
Municippal)<br />
Buildingss,<br />
Equipmen nt and Facilitties.<br />
41.055%<br />
Liquid GGas<br />
23.76%<br />
Figure 10 – Pie<br />
chart for e<strong>nergy</strong>y<br />
consumption by ssource<br />
336
9.4 Carrbon<br />
Dioxid de (CO2) Emmissions<br />
byy<br />
Sector<br />
35.61%<br />
Municipal Buildings,<br />
Equipm ment and Faciliities<br />
Tertiary y (Non Municippal)<br />
Residential Buildings<br />
5.95% %<br />
4.16% 4 1.78%<br />
Water Producction<br />
and Distr ribution<br />
Private and CCommercial<br />
Traansport<br />
In comparison,<br />
the e above chhart<br />
shows the distribution<br />
of CO<br />
Evidentlly,<br />
the sharee<br />
of CO2 emmissions<br />
due to residenttial<br />
buildingss<br />
(33.47%) iss<br />
significanttly<br />
fact that<br />
the sourcee<br />
of e<strong>nergy</strong> ffor<br />
a large pproportion<br />
of f e<strong>nergy</strong> useed<br />
in residenntial<br />
buildinggs<br />
is electrricity.<br />
In fact,<br />
althoughh<br />
this percentage<br />
is sommewhat<br />
loww<br />
when commpared<br />
to thhe<br />
benchm mark Europe ean average e contributiion<br />
from residential<br />
bbuildings<br />
off<br />
40%, therre<br />
remainss<br />
a huge poteential<br />
for redduction<br />
in thhis<br />
sector.<br />
The nex xt largest sec ctor remains<br />
that of Priivate<br />
and Co ommercial TTransport,<br />
too<br />
be followeed<br />
by Tertiary<br />
(Non Mu unicipal) Buildings.<br />
0.06%<br />
18.97%<br />
Public LLighting<br />
Public TTransport<br />
33.47%<br />
Figure 11 – Pie chart for Carbon DDioxide<br />
(CO2) Emisssions<br />
by Sector<br />
O2 emission<br />
ns by sectoor.<br />
larger thhan<br />
the sharre<br />
of e<strong>nergy</strong>y<br />
consumptioon<br />
for the saame<br />
sector. This is mainnly<br />
due to thhe<br />
337
9.5 Carrbon<br />
Dioxide<br />
(CO2) EEmissions<br />
bby<br />
Source of <strong>En</strong>ergy<br />
The graph<br />
below shows<br />
the so ources of C<br />
relatively<br />
high emission<br />
factor ffor<br />
electricityy,<br />
the CO2 emissions<br />
duee<br />
to this souurce<br />
of energgy<br />
are sign nificantly higghest<br />
even tthough<br />
it is not the larggest<br />
e<strong>nergy</strong> provider for<br />
the locality.<br />
effect inn<br />
reducing thhe<br />
CO2 emisssions.<br />
0.114%<br />
3.01%<br />
Electriccity<br />
(water production<br />
excludded)<br />
Diesel aand<br />
Heating Oil<br />
Biofuell<br />
Gasolinne<br />
27.14%<br />
18.28%<br />
O2 emission<br />
This me eans that anny<br />
initiative to reduce the consummption<br />
of electricity<br />
hass<br />
the highest<br />
Liquid GGas<br />
ns by sourcee<br />
of e<strong>nergy</strong>. . Due to thhe<br />
51.43%<br />
Figure 12 – Pie chart for Carboon<br />
Dioxide (CO2) EEmissions<br />
by Sourcce<br />
of <strong>En</strong>ergy<br />
338
Baseline Emissions Inventory (BEI) Ta<strong>ble</strong>s<br />
General Data<br />
Baseline Year 2005<br />
Number of Inhabitants in Baseline Year 2535<br />
Emission Factors Standard Emission Factors in line with IPCC Principles<br />
Emission Reporting Unit CO2 Emissions<br />
Total Annual <strong>En</strong>ergy Consumption per Capita 9.00 MWh<br />
Total Annual CO2 Emissions per Capita 3.69 tCO2<br />
Ta<strong>ble</strong> 9 – General data from Baseline Emissions Inventory<br />
39
Key Results of the Baseline Emissions Inventory<br />
FINAL ENERGY CONSUMPTION (MWh)<br />
Category Electricity<br />
Liquid Gas Heating Oil<br />
Fossil Fuels<br />
Diesel Gasoline<br />
Other Fossil<br />
Fuels*<br />
Bio fuel TOTAL<br />
BUILDINGS, EQUIPMENT AND FACILITIES<br />
Municipal Buildings,<br />
Equipment and Facilities<br />
6.40 0 0 0 0 0 0 6.40<br />
Tertiary (Non Municipal)<br />
Buildings, Equipment and Facilities<br />
1762.40 225.42 0 0 0 729.93 0 2717.75<br />
Residential Buildings 3351.09 965.61 11.35 0 0 0 0 4328.05<br />
Municipal Public Lighting 191.93 0 0 0 0 0 0 191.93<br />
Subtotal<br />
Buildings, Equipment, Facilities<br />
TRANSPORT<br />
5311.82 1191.03 11.35 0 0 729.93 0 7244.13<br />
Municipal Fleet 0 0 0 0 0 0 0 0<br />
Public Transport 0 0 0 2082.01 0 0 0 2082.01<br />
Private and Commercial Transport 0 0 0 6355.41 6626.71 0 49.10 13031.22<br />
Subtotal<br />
Transport<br />
OTHERS<br />
0 0 0 8437.42 6626.71 0 49.10 15113.23<br />
Water Production and Distribution 447.88 0 0 0 0 0 0 447.88<br />
TOTAL (MWh) 5759.7 1191.03 11.35 8437.42 6626.71 729.93 49.10 22805.24<br />
*Includes and Combination of Heating Oil and Diesel used in Tertiary (Non Municipal) Buildings Ta<strong>ble</strong> 10 – Final <strong>En</strong>ergy Consumption<br />
40
CO2 EMISSIONS (t)<br />
Category Electricity<br />
Liquid Gas Heating Oil<br />
Fossil Fuels<br />
Diesel Gasoline<br />
Other Fossil<br />
Fuels*<br />
Bio fuel TOTAL<br />
BUILDINGS, EQUIPMENT AND FACILITIES<br />
Municipal Buildings,<br />
Equipment and Facilities<br />
5.54 0 0 0 0 0 0 5.54<br />
Tertiary (Non Municipal)<br />
Buildings, Equipment and Facilities<br />
1528.00 51.17 0 0 0 193.52 0 1772.69<br />
Residential Buildings 2905.39 219.19 2.88 0 0 0 0 3127.46<br />
Municipal Public Lighting 166.40 0 0 0 0 0 0 166.40<br />
193.52 4605.33 270.36 2.88 0 0 193.52 0 5072.09<br />
TRANSPORT<br />
Municipal Fleet 0 0 0 0 0 0 0 0<br />
Public Transport 0 0 0 555.90 0 0 0 555.9<br />
Private and Commercial Transport 0 0 0 1677.62 1636.68 0 12.52 3326.82<br />
Subtotal<br />
Transport<br />
OTHERS<br />
0 0 0 2233.52 1636.68 0 12.52 3882.72<br />
Water Production and Distribution 388.31 0 0 0 0 0 0 388.31<br />
TOTAL (tCO2) 4993.64 270.36 2.88 2233.52 1636.68 193.52 12.52 9343.12<br />
Corresponding<br />
CO2 Emission Factors (tCO2/MWh)<br />
0.867 0.226 0.254 0.265 0.247 0.265 0.255 0.410<br />
*Includes and Combination of Heating Oil and Diesel used in Tertiary (Non Municipal) Buildings Ta<strong>ble</strong> 11 – CO2 emissions<br />
41
10. <strong>Sust</strong>aina<strong>ble</strong> <strong>En</strong>ergy <strong>Actio</strong>n <strong>Plan</strong> (SEAP)<br />
10.1 <strong>Qre</strong>ndi’s Vision towards a <strong>Sust</strong>aina<strong>ble</strong> <strong>En</strong>ergy Future<br />
The locality of <strong>Qre</strong>ndi is setting the vision statement below as its guiding principle in its<br />
effort in favour of a <strong>Sust</strong>aina<strong>ble</strong> <strong>En</strong>ergy Future for the locality, in line with the objectives of<br />
the Covenant of Mayors.<br />
“The locality of <strong>Qre</strong>ndi, aware of the challenge of a building a <strong>Sust</strong>aina<strong>ble</strong><br />
<strong>En</strong>ergy future, shall aim to lead by its actions towards sus<strong>tainab</strong>le<br />
development where its e<strong>nergy</strong> consumption shall be reduced and the related<br />
CO2 emissions minimised. It shall contribute to the reduction of CO2<br />
emissions at a National and European level, in proportion to its population<br />
and resources.<br />
<strong>Qre</strong>ndi aims to become a village in which its residents can identify<br />
themselves with the locality’s goal to sus<strong>tainab</strong>le living with minimal<br />
environmental impact.”<br />
10.2 <strong>Actio</strong>ns to Implement the Locality’s Vision towards <strong>En</strong>ergy <strong>Sust</strong>ainability<br />
As mentioned previously in this document, the local council is committing itself to reduce<br />
CO2 emissions in the areas under its direct jurisdiction. These include emissions due to<br />
e<strong>nergy</strong> consumption in municipal buildings, municipal public lighting and the municipal<br />
fleet. It is to be noted that municipal public lighting is not presently under the jurisdiction of<br />
the local council but it is expected that in the term of the Covenant of Mayors, that is, by the<br />
year 2020, the responsibility of municipal public lighting excluding arterial roads would be<br />
handed over to the local authorities.<br />
The following ta<strong>ble</strong> lists the annual e<strong>nergy</strong> consumption and CO2 emissions that the local<br />
council is committed to reduce.<br />
42
ANNUAL ENERGY CONSUMPTION UNDER LOCAL COUNCIL’S JURISDICTION<br />
Field of <strong>Actio</strong>n<br />
Municipal Buildings, Facilities and<br />
Equipment<br />
<strong>En</strong>ergy Consumption<br />
(MWh)<br />
CO2 Emissions<br />
(tCO2)<br />
6.40 5.54<br />
Municipal Public Lighting 191.93 166.40<br />
Municipal Fleet N/A N/A<br />
Total <strong>En</strong>ergy Consumption &<br />
Total CO2 Emissions<br />
198.33 171.94<br />
The quantifia<strong>ble</strong> actions of this sus<strong>tainab</strong>le e<strong>nergy</strong> action plan listed below shall reduce<br />
the above CO2 emissions by 25.6%.<br />
The local council is, however, aware that this is a small fraction of the locality’s total<br />
emissions. For this reason, it shall include also in this action plan, those actions that it can<br />
possibly take to ena<strong>ble</strong> the reduction of CO2 emissions in the locality either by providing<br />
education and general information to the citizens in its locality. Though, since it has no<br />
authority on the remaining fields of action, it cannot be committed with a finite quantified<br />
emission reduction.<br />
The major and most significant reduction in CO2 emissions shall result from an improvement<br />
in electricity generation in <strong>Malta</strong>. This shall reduce the emission factor for electricity and<br />
hence the overall emissions. As a member state, <strong>Malta</strong> is also committed to ensure that<br />
10% of its e<strong>nergy</strong> needs shall be provided by renewa<strong>ble</strong> sources by the year 2020. This shall<br />
also have an effect on the reduction of the locality’s emissions. Such measures are<br />
nevertheless under the control of central government.<br />
Ta<strong>ble</strong> 12 – Annual <strong>En</strong>ergy Consumption under local council’s jurisdiction<br />
43
10.2.1 Buildings, Equipment and Facilities<br />
10.2.1.1 Municipal Buildings, Equipment and Facilities<br />
<strong>Actio</strong>n 1.1: Conduct an e<strong>nergy</strong> audit for local council buildings.<br />
The local council shall conduct an e<strong>nergy</strong> audit of its office buildings in<br />
order to identify possibilities of reducing e<strong>nergy</strong> consumption. Although,<br />
this action does not reduce emissions per se, it will serve as a basis for the<br />
identification of tangi<strong>ble</strong> actions which will reduce the annual e<strong>nergy</strong><br />
consumption.<br />
<strong>Actio</strong>n 1.2: Conduct an e<strong>nergy</strong> audit for public gardens and recreational<br />
areas in the locality.<br />
Similar to <strong>Actio</strong>n 1.1, this e<strong>nergy</strong> audit shall identify means of reducing<br />
e<strong>nergy</strong> consumption in public areas in the locality. Such actions will also<br />
not reduce e<strong>nergy</strong> consumption directly. However, if the work is publicised<br />
well, it shall have an effect to increase the awareness of the citizens of the<br />
locality and involve them in the process of decreasing e<strong>nergy</strong> consumption<br />
in the locality, possibly encouraging them to take other actions under their<br />
direct control.<br />
<strong>Actio</strong>n 1.3: Perform actions identified in e<strong>nergy</strong> audit for local council<br />
buildings, municipal lighting facilities and public gardens and recreational<br />
areas.<br />
Following actions 1.1 and 1.2, any actions identified shall be implemented<br />
over the course of the Covenant of Mayors. Neither the cost, nor the<br />
expected emission reduction can be quantified at this stage.<br />
44
<strong>Actio</strong>n 1.4: Install a 1.8 kWp (minimum) photovoltaic system to serve the<br />
Local Council building.<br />
The local council shall commission the installation of a photovoltaic system<br />
of a 1.8 kWp to provide part of the electrical e<strong>nergy</strong> used in the Local<br />
Council office building. It is expected that such a system shall cost in the<br />
order of € 7,000 and shall reduce annual e<strong>nergy</strong> consumption and CO2<br />
emissions by 2.90 MWh equivalent to 2.51 tCO2.<br />
<strong>Actio</strong>n 1.5: Identify possibilities and proceed with installation of further<br />
renewa<strong>ble</strong> e<strong>nergy</strong> systems on other public buildings to be managed by<br />
the local council.<br />
The Local Council shall embark on a project to identify a number of sites<br />
that are potentially suita<strong>ble</strong> for installation of further renewa<strong>ble</strong> e<strong>nergy</strong><br />
systems, possibly employing different technologies. Such buildings may<br />
include buildings owned by the central government. The Local council shall<br />
enter in an agreement with the owner of the proposed sites to install the<br />
renewa<strong>ble</strong> e<strong>nergy</strong> systems and eventually take over the installation,<br />
maintenance and management of such systems.<br />
Since the possibilities are not identified at this stage, the expected cost and<br />
e<strong>nergy</strong> savings cannot be quantified at this stage. It is however expected<br />
that carefully chosen sites, systems and technologies shall make such<br />
initiative revenue neutral in the payback period of the system.<br />
Such an action shall have the added advantage of promoting renewa<strong>ble</strong><br />
e<strong>nergy</strong> systems in the locality and ena<strong>ble</strong> the citizens to have firsthand<br />
experience with such systems in order to encourage them to invest in their<br />
own renewa<strong>ble</strong> e<strong>nergy</strong> technology.<br />
45
10.2.1.2 Tertiary, Non‐Municipal Buildings<br />
<strong>Actio</strong>n 1.6: Promote e<strong>nergy</strong> audits for non‐municipal public buildings in<br />
the locality such as political clubs, band clubs and sports clubs.<br />
Promotional material shall be provided to promote the implementation of<br />
e<strong>nergy</strong> audits for non municipal public buildings. The aim is that public<br />
buildings, where citizens gather for social and other activities, get on board<br />
with the locality on its commitment to reduce emissions. Such clubs and<br />
social groups are very likely to have an influential effect on their members<br />
and hence a large portion of the civil society can be made aware of the<br />
locality’s initiatives regarding emission reduction measures.<br />
10.2.1.3 Residential Buildings<br />
<strong>Actio</strong>n 1.7: Perform e<strong>nergy</strong> audits in a limited number of dwellings<br />
(tentatively 5 residences) to serve as a pilot study.<br />
The local council shall embark on a pilot study on a limited number of<br />
residences in order to identify the potential to reduce e<strong>nergy</strong> consumption<br />
and emissions. Such residences are to be selected on the criteria that their<br />
tenants are willing to invest in e<strong>nergy</strong> reduction measures. The findings of<br />
this study shall be used in <strong>Actio</strong>n 1.8.<br />
<strong>Actio</strong>n 1.8: Analyze Data from Pilot Study and present it to the public for<br />
information.<br />
The information gathered from this pilot study shall be analysed and used<br />
in a public awareness campaign on the possibilities that do in fact exist for<br />
reducing e<strong>nergy</strong> consumption in residential buildings.<br />
46
<strong>Actio</strong>n 1.9: Conduct a public awareness campaign and organise <strong>En</strong>ergy<br />
Days to involve the wider public in the use of renewa<strong>ble</strong> e<strong>nergy</strong> sources<br />
and e<strong>nergy</strong> efficiency.<br />
In line with its commitment in the Covenant of Mayors, the local council<br />
shall periodically organise <strong>En</strong>ergy Days to involve the general public in<br />
activities related to the production or use of renewa<strong>ble</strong> e<strong>nergy</strong> sources and<br />
e<strong>nergy</strong> efficiency. These can take the form of guided visits and tours,<br />
education activities, open door days and exhibitions.<br />
<strong>Actio</strong>n 1.10: Conclude agreement(s) with a number of suppliers of<br />
renewa<strong>ble</strong> e<strong>nergy</strong> systems to obtain preferential prices for use in<br />
buildings in the locality.<br />
By entering into an agreement with a number of suppliers of renewa<strong>ble</strong><br />
e<strong>nergy</strong> systems, the local council shall be in a position to offer residences in<br />
its locality the possibility to purchase renewa<strong>ble</strong> e<strong>nergy</strong> technology at<br />
reduced prices. This model has already been employed in <strong>Malta</strong> and has<br />
been very successful at a local level. It should be aimed to introduce a<br />
renewa<strong>ble</strong> e<strong>nergy</strong> system on at least 50% of rooftops in the locality.<br />
Typical renewa<strong>ble</strong> e<strong>nergy</strong> systems may include but are not limited to solar<br />
(water and space) heating systems, photovoltaic systems and vertical axis<br />
(low noise) helical wind turbines which tend to be more aesthetic due to its<br />
design and quieter because the of the lower blade tip speed. Obviously,<br />
this is subject to the approval of the <strong>Malta</strong> <strong>En</strong>vironment and <strong>Plan</strong>ning<br />
Authority and/or other authorities as applica<strong>ble</strong>.<br />
47
10.2.1.4 Municipal Public Lighting<br />
<strong>Actio</strong>n 1.11: Conduct an e<strong>nergy</strong> audit for municipal lighting facilities in<br />
the locality to assess the adequacy of public lighting and identify methods<br />
to improve e<strong>nergy</strong> efficiency.<br />
A detailed e<strong>nergy</strong> audit of municipal public lighting shall be undertaken to<br />
assess the adequacy of public lighting and identify methods to improve<br />
e<strong>nergy</strong> efficiency.<br />
<strong>Actio</strong>n 1.12: Install intelligent street lighting control systems in all<br />
substations.<br />
By installing intelligent (such as adaptive) street lighting control systems in<br />
the locality, it is predicted that around 25% of e<strong>nergy</strong> used for street<br />
lighting can be reduced. This would equate to a reduction of 41.60 tCO2<br />
emissions annually.<br />
It is expected that such a system would cost around € 110,000 for the<br />
whole locality with a payback period in the order of 3 years. Funding from<br />
central government may be required for this action.<br />
48
10.2.2 Transport<br />
10.2.2.1 Private and Commercial Transport<br />
<strong>Actio</strong>n 2.1: Provide preferential reserved parking spaces for electric,<br />
hybrid or low emission vehicles.<br />
In order to promote the introduction of electric or hybrid vehicles, the local<br />
council is to provide a number of preferential parking spaces in the centre<br />
of the locality such that these spaces are reserved for these types of<br />
vehicles only.<br />
In addition, the local council shall provide a number of small parking spaces<br />
specifically for small vehicles that are likely to produce lower emissions.<br />
This approach is already being applied in other countries.<br />
Suita<strong>ble</strong> promotion of this initiative shall encourage citizens to consider<br />
purchasing cleaner vehicles with reduced CO2 emissions when replacing<br />
their vehicles.<br />
49
10.2.3 Local Electricity Production<br />
10.2.3.1 Combined Heat and Power<br />
<strong>Actio</strong>n 3.1: Conduct a feasibility study for installation of a Combined Heat<br />
and Power with Absorption Cooling in Public Building (if deemed feasi<strong>ble</strong>)<br />
The local council shall commission a feasibility study for the installation of a<br />
combined heat and power unit with absorption cooling for use in a<br />
prominent public building. If the project is deemed feasi<strong>ble</strong>, the local<br />
council shall attempt to proceed with funding and installation. This project<br />
is aimed to introduce this highly efficient technology in the locality.<br />
50
10.2.4 Land Use <strong>Plan</strong>ning<br />
10.2.4.1 Carbon Sequestration Measures<br />
<strong>Actio</strong>n 4.1: Conduct a locality survey to identify locations where new<br />
trees can be planted. Survey is to identify possi<strong>ble</strong> locations by availa<strong>ble</strong><br />
areas or number of tree spaces.<br />
Although not strictly an e<strong>nergy</strong> initiative, this action is intended to make<br />
maximum use of spaces availa<strong>ble</strong> for the planting of new vegetation,<br />
especially trees that have the function to capture atmospheric CO2 and<br />
offset part of the locality’s emissions.<br />
<strong>Actio</strong>n 4.2: Undertake a tree planting exercise as identified in the locality<br />
survey (<strong>Actio</strong>n 4.1) to counteract emissions produced in the locality.<br />
Conduct a tree planting exercise in the locality involving as much as<br />
possi<strong>ble</strong> the general public in participating in such exercise. This can be<br />
combined with the <strong>En</strong>ergy Days activities.<br />
51
10.2.5 Local District Heating / Cooling, CHPs<br />
Not applica<strong>ble</strong> for the locality.<br />
10.2.6 Public Procurement of Products and Services<br />
10.2.6.1 <strong>En</strong>ergy Efficiency Requirements / Standards<br />
<strong>Actio</strong>n 6.1: Establish a policy such that all equipment purchased by Local<br />
Council is rated as the least e<strong>nergy</strong> consuming.<br />
All tenders for the purchase of equipment issued by the local council shall<br />
include a clause to give preference to the equipment which consumes least<br />
e<strong>nergy</strong> for the same functions.<br />
<strong>Actio</strong>n 6.2: Establish a policy such that service providers that have<br />
recognised environmental policies and independent accreditation will be<br />
given preference in the selection process.<br />
It shall be the council policy that in the selection process, preference is<br />
given to service providers with recognised environmental policies and<br />
independent accreditation. Such a policy shall be communicated in all<br />
tender documents.<br />
52
10.2.7 Working with the Citizens and Stakeholders<br />
10.2.7.1 Awareness raising and local networking<br />
<strong>Actio</strong>n 7.1: Consult with <strong>Malta</strong> Resources Authority about the possibility<br />
of offering e<strong>nergy</strong> saving incentives applications from the Local Council<br />
Office.<br />
The local council shall investigate the possibility of helping the citizens in<br />
the locality by processing applications for renewa<strong>ble</strong> e<strong>nergy</strong> incentives<br />
promoted by the <strong>Malta</strong> Resources Authority from its offices within the<br />
locality. It is likely that this shall make it easier for residents to participate<br />
and benefit from such incentives, thus attracting renewa<strong>ble</strong> e<strong>nergy</strong><br />
technology towards the locality.<br />
53
List of <strong>Actio</strong>ns of the SEAP<br />
Sectors and Fields of<br />
<strong>Actio</strong>n<br />
1. Buildings, Equipment and Facilities<br />
Municipal Buildings,<br />
Equipment and<br />
Facilities<br />
Key <strong>Actio</strong>ns and Measures<br />
1. 1 Conduct an e<strong>nergy</strong> audit for local<br />
council buildings.<br />
1.2 Conduct an e<strong>nergy</strong> audit for public<br />
gardens and recreational areas in the<br />
locality.<br />
1.3 Perform actions identified in e<strong>nergy</strong><br />
audit for local council buildings,<br />
municipal lighting facilities and public<br />
gardens and recreational areas.<br />
1.4 Install a 1.8kWp PV system to serve<br />
the local council building.<br />
Implementation<br />
(Start and <strong>En</strong>d Time)<br />
Start: January 2011<br />
<strong>En</strong>d: June 2011<br />
Start: January 2011<br />
<strong>En</strong>d: June 2011<br />
Start: July 2012<br />
<strong>En</strong>d: As indicated in respective <strong>En</strong>ergy<br />
Audit recommendations.<br />
Start: January 2011<br />
<strong>En</strong>d: June 2011<br />
Expected Costs<br />
per <strong>Actio</strong>n or<br />
Measure<br />
€ 1000 Nil<br />
€ 1000 Nil<br />
Dep<strong>endi</strong>ng on<br />
<strong>Actio</strong>ns Identified<br />
in <strong>Actio</strong>ns 1.1 and<br />
1.2 above.<br />
Expected CO2<br />
Reduction per<br />
Measure<br />
[Tonnes CO2 pa]<br />
Not Quantifia<strong>ble</strong> at<br />
this stage.<br />
€ 7000 2.51 tCO2<br />
54
Sectors and Fields of<br />
<strong>Actio</strong>n<br />
Tertiary,<br />
Non‐Municipal<br />
Buildings<br />
Residential<br />
Buildings<br />
Key <strong>Actio</strong>ns and Measures<br />
1.5 Identify possibilities and proceed with<br />
installation of further renewa<strong>ble</strong><br />
e<strong>nergy</strong> systems on other public<br />
buildings to be managed by the local<br />
council.<br />
1.6 Promote e<strong>nergy</strong> audits for non‐<br />
municipal public buildings in the<br />
locality such as political clubs, band<br />
clubs and sports clubs.<br />
1.7 Perform e<strong>nergy</strong> audits in a limited<br />
number of dwellings (tentatively 5<br />
residences) to serve as a pilot study.<br />
1.8 Analyze Data from Pilot Study and<br />
present it to the public for<br />
information.<br />
1.9 Conduct a public awareness campaign<br />
and organise <strong>En</strong>ergy Days to involve<br />
the wider public in the use of<br />
renewa<strong>ble</strong> e<strong>nergy</strong> sources and e<strong>nergy</strong><br />
efficiency<br />
Start: 2013<br />
<strong>En</strong>d: 2017<br />
Implementation<br />
(Start and <strong>En</strong>d Time)<br />
Start: June 2011<br />
<strong>En</strong>d: December 2011<br />
Start: January 2012<br />
<strong>En</strong>d: June 2012<br />
Start: July 2012<br />
<strong>En</strong>d: September 2012<br />
Start: October 2012<br />
<strong>En</strong>d: Ongoing till 2020<br />
Expected Costs<br />
per <strong>Actio</strong>n or<br />
Measure<br />
Dep<strong>endi</strong>ng on<br />
technologies<br />
employed and<br />
capacity installed.<br />
€ 500 for<br />
promotional<br />
material<br />
€ 750 for<br />
performance of<br />
e<strong>nergy</strong> audits in 5<br />
dwellings<br />
€ 500 for an<br />
analysis report of<br />
pilot study<br />
€ 2,000 for<br />
promotional<br />
material and<br />
organisation of<br />
events.<br />
Expected CO2<br />
Reduction per<br />
Measure<br />
[Tonnes CO2 pa]<br />
Not Quantifia<strong>ble</strong> at<br />
this stage.<br />
Nil<br />
Nil<br />
Nil<br />
Not Quantifia<strong>ble</strong>.<br />
55
Sectors and Fields of<br />
<strong>Actio</strong>n<br />
Municipal Public<br />
Lighting<br />
2. Transport<br />
Private and<br />
Commercial<br />
Transport<br />
Key <strong>Actio</strong>ns and Measures<br />
1.10 Conclude agreement(s) with a<br />
number of suppliers of RE systems to<br />
obtain preferential prices for use in<br />
buildings in the locality.<br />
1.11 Conduct an e<strong>nergy</strong> audit for<br />
municipal lighting facilities in the<br />
locality to assess the adequacy of<br />
public lighting and identify methods<br />
to improve e<strong>nergy</strong> efficiency.<br />
1.12 Install intelligent street lighting<br />
control system in all substations.<br />
2.1 Provide preferential reserved parking<br />
spaces for electric, hybrid or low<br />
emission vehicles.<br />
Implementation<br />
(Start and <strong>En</strong>d Time)<br />
Start: January 2013<br />
<strong>En</strong>d: December 2013<br />
Start: January 2013<br />
<strong>En</strong>d: December 2013<br />
Start: January 2017<br />
<strong>En</strong>d: December 2019<br />
Start: January 2012<br />
<strong>En</strong>d: December 2012<br />
Nil<br />
Expected Costs<br />
per <strong>Actio</strong>n or<br />
Measure<br />
€ 1,000 Nil<br />
Expected CO2<br />
Reduction per<br />
Measure<br />
[Tonnes CO2 pa]<br />
Not Quantifia<strong>ble</strong> at<br />
this stage.<br />
€ 110,000 41.60 tCO2<br />
€ 250 for<br />
additional signage<br />
and road<br />
marking.<br />
Not Quantifia<strong>ble</strong>.<br />
56
Sectors and Fields of<br />
<strong>Actio</strong>n<br />
3. Local Electricity Production<br />
Combined Heat and<br />
Power<br />
4. Land Use <strong>Plan</strong>ning<br />
Carbon<br />
Sequestration<br />
Measures<br />
Key <strong>Actio</strong>ns and Measures<br />
3.1 Conduct a feasibility study for the<br />
installation of a Combined Heat and<br />
Power with Absorption Cooling in<br />
Public Building. Install unit if deemed<br />
feasi<strong>ble</strong>.<br />
4.1 Conduct a locality survey to identify<br />
locations where new trees can be<br />
planted. Survey is to identify possi<strong>ble</strong><br />
locations by availa<strong>ble</strong> areas or<br />
number of tree spaces.<br />
4.2 Undertake a tree planting exercise as<br />
identified in the locality survey (see<br />
<strong>Actio</strong>n 4.1) to counteract emissions<br />
produced in the locality.<br />
Implementation<br />
(Start and <strong>En</strong>d Time)<br />
Start: January 2018<br />
<strong>En</strong>d: December 2020<br />
Start: January 2014<br />
<strong>En</strong>d: March 2014<br />
Start: October 2014<br />
<strong>En</strong>d: As indicated in survey<br />
recommendations.<br />
Expected Costs<br />
per <strong>Actio</strong>n or<br />
Measure<br />
Prices are not yet<br />
known as the<br />
technology is still<br />
developing. It is<br />
envisaged that<br />
feasi<strong>ble</strong><br />
commercial units<br />
will be availa<strong>ble</strong><br />
by 2018.<br />
€ 100 for<br />
administrative<br />
costs<br />
Dep<strong>endi</strong>ng on the<br />
type and number<br />
of trees to be<br />
planted.<br />
Expected CO2<br />
Reduction per<br />
Measure<br />
[Tonnes CO2 pa]<br />
Not Quantifia<strong>ble</strong>.<br />
Nil<br />
Not Quantifia<strong>ble</strong><br />
57
Sectors and Fields of<br />
<strong>Actio</strong>n<br />
5. Local District Heating and Cooling<br />
Local District<br />
Heating and Cooling<br />
Key <strong>Actio</strong>ns and Measures<br />
6. Public Procurements of Products and Services<br />
<strong>En</strong>ergy Efficiency<br />
Requirements and<br />
Standards<br />
Implementation<br />
(Start and <strong>En</strong>d Time)<br />
Expected Costs<br />
per <strong>Actio</strong>n or<br />
Measure<br />
Not Applica<strong>ble</strong> Nil<br />
6.1 Establish a policy such that all<br />
equipment purchased by Local<br />
Council is rated as the least e<strong>nergy</strong><br />
consuming.<br />
6.2 Establish a policy such that service<br />
providers that have recognized<br />
environmental policies and<br />
independent accreditation are<br />
preferred in the selection process.<br />
Start: September 2010<br />
<strong>En</strong>d: Ongoing<br />
Start: March 2011<br />
<strong>En</strong>d: Ongoing<br />
Expected CO2<br />
Reduction per<br />
Measure<br />
[Tonnes CO2 pa]<br />
Nil Not Quantifia<strong>ble</strong>.<br />
Nil Not Quantifia<strong>ble</strong><br />
58
Sectors and Fields of<br />
<strong>Actio</strong>n<br />
Key <strong>Actio</strong>ns and Measures<br />
7. Working with the Citizens and Stakeholders<br />
Awareness raising<br />
and local<br />
networking<br />
7.1 Consult with the <strong>Malta</strong> Resources<br />
Authority about the possibility of<br />
offering e<strong>nergy</strong> saving incentives<br />
applications from the Local Council<br />
office.<br />
Implementation<br />
(Start and <strong>En</strong>d Time)<br />
Start: March 2011<br />
<strong>En</strong>d: June 2011<br />
Expected Costs<br />
per <strong>Actio</strong>n or<br />
Measure<br />
Nil Nil<br />
Expected CO2<br />
Reduction per<br />
Measure<br />
[Tonnes CO2 pa]<br />
TOTAL 44.11 tCO2<br />
Ta<strong>ble</strong> 13 – List of <strong>Actio</strong>ns for SEAP<br />
59
11. <strong>En</strong>dorsement<br />
We, the <strong>Qre</strong>ndi Local Council, today the _______ day of _____________________, 2010,<br />
hereby approve this <strong>Sust</strong>aina<strong>ble</strong> <strong>En</strong>ergy <strong>Actio</strong>n <strong>Plan</strong> as a part of the Council’s commitment<br />
to the Covenant of Mayors.<br />
___________________________<br />
Mr. Carmel Falzon,<br />
Mayor<br />
60
12. Conclusions<br />
The <strong>Qre</strong>ndi Local Council is aware that the jurisdiction and power of local councils in <strong>Malta</strong><br />
with respect to e<strong>nergy</strong> management is rather limited. This, however, shall not be a<br />
restrictive factor in preventing the locality from actively participating in the Covenant of<br />
Mayors.<br />
Remarkably, besides those fields of action on which the Local Council has direct control, it is<br />
also committing itself on a number of actions, included in this plan, covering fields outside<br />
its direct authority.<br />
In this way, its contribution to the reduction of CO2 emissions by 2020, together with the<br />
initiatives taken at a National level, shall be a significant factor in the abatement of global<br />
climate change in proportion to the population and resources of the locality.<br />
The locality of <strong>Qre</strong>ndi, by its participation and adherence to the Covenant of Mayors, aims<br />
to demonstrate that actions at a local level, however small, can have significant<br />
measurea<strong>ble</strong> effects in the fight against climate change.<br />
61
13. List of Figures and Ta<strong>ble</strong>s<br />
13.1 Figures<br />
Figure 1 – Logo Covenant of Mayors<br />
Figure 2 – Details from Covenant of Mayors website<br />
Figure 3 – National Strategy building blocks<br />
Figure 4 – Geographical position and photos of <strong>Qre</strong>ndi<br />
Figure 5 – Mnajdra and Ħaġar Qim<br />
Figure 6 – Pie chart for e<strong>nergy</strong> consumption in MWh for residential buildings<br />
Figure 7 – Pie chart for e<strong>nergy</strong> consumption in MWh for tertiary buildings<br />
Figure 8 – Pie chart for e<strong>nergy</strong> consumption for private and commercial transport<br />
Figure 9 – Pie chart for e<strong>nergy</strong> consumption by sector<br />
Figure 10 – Pie chart for e<strong>nergy</strong> consumption by source<br />
Figure 11 – Pie chart for Carbon Dioxide (CO2) Emissions by Sector<br />
Figure 12 – Pie chart for Carbon Dioxide (CO2) Emissions by Source of <strong>En</strong>ergy<br />
62
13.2 Ta<strong>ble</strong>s<br />
Ta<strong>ble</strong> 1 – SEAP Fields of <strong>Actio</strong>n (non‐strictly on e<strong>nergy</strong>)<br />
Ta<strong>ble</strong> 2 – SEAP Fields of <strong>Actio</strong>n (strictly on e<strong>nergy</strong>)<br />
Ta<strong>ble</strong> 3 –<strong>En</strong>ergy Consumption for Municipal buildings, equipment and facilities<br />
Ta<strong>ble</strong> 4 –<strong>En</strong>ergy Consumption for residential buildings<br />
Ta<strong>ble</strong> 5 –<strong>En</strong>ergy Consumption for tertiary buildings, equipment and facilities<br />
Ta<strong>ble</strong> 6 –<strong>En</strong>ergy Consumption for street lighting<br />
Ta<strong>ble</strong> 7 –<strong>En</strong>ergy Consumption for private and commercial transport<br />
Ta<strong>ble</strong> 8 –Overview of annual e<strong>nergy</strong> consumption<br />
Ta<strong>ble</strong> 9 – General data from Baseline Emissions Inventory<br />
Ta<strong>ble</strong> 10 – Final <strong>En</strong>ergy Consumption<br />
Ta<strong>ble</strong> 11 – CO2 emissions<br />
Ta<strong>ble</strong> 12 – Annual <strong>En</strong>ergy Consumption under Local Council’s jurisdiction<br />
Ta<strong>ble</strong> 13 – List of <strong>Actio</strong>ns for SEAP<br />
63
14. App<strong>endi</strong>x 1: Dwelling Stock Breakdown<br />
National Dwelling Stock Breakdown<br />
Number of<br />
Persons<br />
Total Number of Rooms<br />
Source: Census of Population and Housing 2005, Volume 2, Dwellings, NSO, <strong>Malta</strong> 2007<br />
139178 1 2 3 4 5 6 7 8 9 10<br />
1 26259 342 1717 3715 5600 6872 4582 1719 887 337 261 227<br />
2 35643 67 762 2516 6547 10099 7919 3811 2120 855 503 444<br />
3 30581 30 303 1153 4173 8749 7655 4063 2370 940 644 501<br />
4 30729 10 174 607 2807 7737 8344 5154 2967 1306 832 791<br />
5 11331 8 58 224 918 2521 2887 2066 1262 608 430 349<br />
6 3351 3 14 90 291 796 833 525 332 200 121 146<br />
7 874 5 21 67 223 209 133 103 38 46 29<br />
8 266 1 3 12 25 60 50 45 28 13 10 19<br />
9 84 3 5 10 27 16 7 5 4 4 3<br />
10+ 60 2 5 9 12 14 7 4 2 3 2<br />
Total 139178 461 3041 8348 20447 37096 32509 17530 10078 4303 2854 2511<br />
More<br />
Than 10<br />
64
Locality (<strong>Qre</strong>ndi) Dwelling Stock Breakdown Source: Census of Population and Housing 2005, Volume 2, Dwellings, NSO, <strong>Malta</strong> 2007<br />
Number of<br />
Persons<br />
Total Number of Rooms<br />
851 1 2 3 4 5 6 7 8 9 10<br />
1 138 5 5 13 22 43 23 14 10 1 2<br />
2 217 6 17 38 50 59 22 13 4 4 4<br />
3 188 2 11 23 46 40 32 16 6 6 6<br />
4 201 3 14 33 69 44 21 6 8 3<br />
5 68 2 3 16 17 15 11 1 3<br />
6 29 1 2 6 8 3 3 2 2 2<br />
7 6 3 1 1 1<br />
8 1 1<br />
9 1 1<br />
10+ 2 2<br />
Total 851 5 13 47 102 194 221 131 76 18 24 20<br />
More<br />
Than 10<br />
65