Proceedings of the meeting - Department of Physics - University of ...
Proceedings of the meeting - Department of Physics - University of ...
Proceedings of the meeting - Department of Physics - University of ...

Create successful ePaper yourself
Turn your PDF publications into a flip-book with our unique Google optimized e-Paper software.
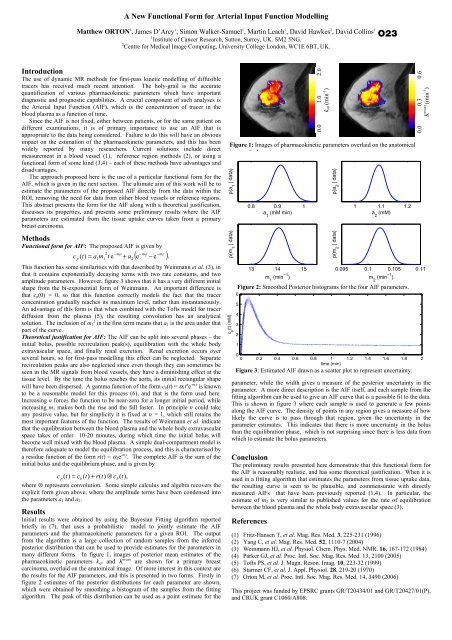
A New Functional Form for Arterial Input Function ModellingMat<strong>the</strong>w ORTON 1 , James D’Arcy 1 , Simon Walker-Samuel 1 , Martin Leach 1 , David Hawkes 2 , David Collins 11 Institute <strong>of</strong> Cancer Research, Sutton, Surrey, UK. SM2 5NG.2 Centre for Medical Image Computing, <strong>University</strong> College London, WC1E 6BT, UK.O23IntroductionThe use <strong>of</strong> dynamic MR methods for first-pass kinetic modelling <strong>of</strong> diffusibletracers has received much recent attention. The holy-grail is <strong>the</strong> accuratequantification <strong>of</strong> various pharmacokinetic parameters which have importantdiagnostic and prognostic capabilities. A crucial component <strong>of</strong> such analyses is<strong>the</strong> Arterial Input Function (AIF), which is <strong>the</strong> concentration <strong>of</strong> tracer in <strong>the</strong>blood plasma as a function <strong>of</strong> time.Since <strong>the</strong> AIF is not fixed, ei<strong>the</strong>r between patients, or for <strong>the</strong> same patient ondifferent examinations, it is <strong>of</strong> primary importance to use an AIF that isappropriate to <strong>the</strong> data being considered. Failure to do this will have an obviousimpact on <strong>the</strong> estimation <strong>of</strong> <strong>the</strong> pharmacokinetic parameters, and this has beenwidely reported by many researchers. Current solutions include directmeasurement in a blood vessel (1), reference region methods (2), or using afunctional form <strong>of</strong> some kind (3,4) – each <strong>of</strong> <strong>the</strong>se methods have advantages anddisadvantages.The approach proposed here is <strong>the</strong> use <strong>of</strong> a particular functional form for <strong>the</strong>AIF, which is given in <strong>the</strong> next section. The ultimate aim <strong>of</strong> this work will be toestimate <strong>the</strong> parameters <strong>of</strong> <strong>the</strong> proposed AIF directly from <strong>the</strong> data within <strong>the</strong>ROI, removing <strong>the</strong> need for data from ei<strong>the</strong>r blood vessels or reference regions.This abstract presents <strong>the</strong> form for <strong>the</strong> AIF along with a <strong>the</strong>oretical justification,discusses its properties, and presents some preliminary results where <strong>the</strong> AIFparameters are estimated from <strong>the</strong> tissue uptake curves taken from a primarybreast carcinoma.MethodsFunctional form for AIF: The proposed AIF is given by2 −m1t−m2t−m1tcp( t)= a1m1t e + a2( e − e ).This function has some similarities with that described by Weinmann et al. (3), inthat it contains exponentially decaying terms with two rate constants, and twoamplitude parameters. However, figure 3 shows that it has a very different initialshape from <strong>the</strong> bi-exponential form <strong>of</strong> Weinmann. An important difference isthat c p (0) = 0, so that this function correctly models <strong>the</strong> fact that <strong>the</strong> tracerconcentration gradually reaches its maximum level, ra<strong>the</strong>r than instantaneously.An advantage <strong>of</strong> this form is that when combined with <strong>the</strong> T<strong>of</strong>ts model for tracerdiffusion from <strong>the</strong> plasma (5), <strong>the</strong> resulting convolution has an analyticalsolution. The inclusion <strong>of</strong> m 2 1 in <strong>the</strong> first term means that a 1 is <strong>the</strong> area under thatpart <strong>of</strong> <strong>the</strong> curve.Theoretical justification for AIF: The AIF can be split into several phases – <strong>the</strong>initial bolus, possible recirculation peak(s), equilibration with <strong>the</strong> whole bodyextravascular space, and finally renal excretion. Renal excretion occurs overseveral hours, so for first-pass modelling this effect can be neglected. Separaterecirculation peaks are also neglected since even though <strong>the</strong>y can sometimes beseen in <strong>the</strong> MR signals from blood vessels, <strong>the</strong>y have a diminishing effect at <strong>the</strong>tissue level. By <strong>the</strong> time <strong>the</strong> bolus reaches <strong>the</strong> aorta, its initial rectangular shapewill have been dispersed. A gamma function <strong>of</strong> <strong>the</strong> form c b (t) = α 1 t n e -m t 1is knownto be a reasonable model for this process (6), and that is <strong>the</strong> form used here.Increasing n forces <strong>the</strong> function to be near-zero for a longer initial period, whileincreasing m 1 makes both <strong>the</strong> rise and <strong>the</strong> fall faster. In principle n could takeany positive value, but for simplicity it is fixed at n = 1, which still retains <strong>the</strong>most important features <strong>of</strong> <strong>the</strong> function. The results <strong>of</strong> Weinmann et al. indicatethat <strong>the</strong> equilibration between <strong>the</strong> blood plasma and <strong>the</strong> whole body extravascularspace takes <strong>of</strong> order 10-20 minutes, during which time <strong>the</strong> initial bolus willbecome well mixed with <strong>the</strong> blood plasma. A simple dual-compartment model is<strong>the</strong>refore adequate to model <strong>the</strong> equilibration process, and this is characterised bya residue function <strong>of</strong> <strong>the</strong> form r(t) = α 2 e -m t 2. The complete AIF is <strong>the</strong> sum <strong>of</strong> <strong>the</strong>initial bolus and <strong>the</strong> equilibrium phase, and is given bycp( t)= cb(t)+ r(t)⊗ cb(t),where ⊗ represents convolution. Some simple calculus and algebra recovers <strong>the</strong>explicit form given above, where <strong>the</strong> amplitude terms have been condensed into<strong>the</strong> parameters a 1 and a 2 .ResultsInitial results were obtained by using <strong>the</strong> Bayesian Fitting algorithm reportedbriefly in (7), that uses a probabilistic model to jointly estimate <strong>the</strong> AIFparameters and <strong>the</strong> pharmacokinetic parameters for a given ROI. The outputfrom <strong>the</strong> algorithm is a large collection <strong>of</strong> random samples from <strong>the</strong> inferredposterior distribution that can be used to provide estimates for <strong>the</strong> parameters inmany different forms. In figure 1, images <strong>of</strong> posterior mean estimates <strong>of</strong> <strong>the</strong>pharmacokinetic parameters k ep and K trans are shown for a primary breastcarcinoma, overlaid on <strong>the</strong> anatomical image. Of more interest in this context are<strong>the</strong> results for <strong>the</strong> AIF parameters, and this is presented in two forms. Firstly infigure 2 estimates <strong>of</strong> <strong>the</strong> posterior distributions for each parameter are shown,which were obtained by smoothing a histogram <strong>of</strong> <strong>the</strong> samples from <strong>the</strong> fittingalgorithm. The peak <strong>of</strong> this distribution can be used as a point estimate for <strong>the</strong>0.0 1.0 2.0kep (min -1 )Figure 1: Images <strong>of</strong> pharmacokinetic parameters overlaid on <strong>the</strong> anatomicalimage <strong>of</strong> a breast carcinoma.p(a 1| data)p(m 1| data)c p(t) (mM)6543210.8 0.9 1a 1(mM min)13 14 15m 1(min −1 )1 1.1 1.2a 2(mM)Figure 2: Smoo<strong>the</strong>d Posterior histograms for <strong>the</strong> four AIF parameters.Figure 3: Estimated AIF drawn as a scatter plot to represent uncertainty.0.3 0.6K trans (min -1 )00 0.2 0.4 0.6 0.8 1 1.2 1.4 1.6 1.8 2time (min)p(a 2| data)p(m 2| data)0.00.095 0.1 0.105 0.11m 2(min −1 )parameter, while <strong>the</strong> width gives a measure <strong>of</strong> <strong>the</strong> posterior uncertainty in <strong>the</strong>parameter. A more direct description is <strong>the</strong> AIF itself, and each sample from <strong>the</strong>fitting algorithm can be used to give an AIF curve that is a possible fit to <strong>the</strong> data.This is shown in figure 3 where each sample is used to generate a few pointsalong <strong>the</strong> AIF curve. The density <strong>of</strong> points in any region gives a measure <strong>of</strong> howlikely <strong>the</strong> curve is to pass through that region, given <strong>the</strong> uncertainty in <strong>the</strong>parameter estimates. This indicates that <strong>the</strong>re is more uncertainty in <strong>the</strong> bolusthan <strong>the</strong> equilibration phase, which is not surprising since <strong>the</strong>re is less data fromwhich to estimate <strong>the</strong> bolus parameters.ConclusionThe preliminary results presented here demonstrate that this functional form for<strong>the</strong> AIF is reasonably realistic, and has some <strong>the</strong>oretical justification. When it isused in a fitting algorithm that estimates <strong>the</strong> parameters from tissue uptake data,<strong>the</strong> resulting curve is seen to be plausible, and commensurate with directlymeasured AIFs that have been previously reported (1,4). In particular, <strong>the</strong>estimate <strong>of</strong> m 2 is very similar to published values for <strong>the</strong> rate <strong>of</strong> equilibrationbetween <strong>the</strong> blood plasma and <strong>the</strong> whole body extravascular space (3).References(1) Fritz-Hansen T, et al. Mag. Res. Med. 3, 225-231 (1996)(2) Yang C, et al. Mag. Res. Med. 52, 1110-7 (2004)(3) Weinmann HJ, et al. Physiol. Chem. Phys. Med. NMR. 16, 167-172 (1984)(4) Parker GJ, et al. Proc. Intl. Soc. Mag. Res. Med. 13, 2100 (2005)(5) T<strong>of</strong>ts PS, et al. J. Magn. Reson. Imag. 10, 223-32 (1999)(6) Starmer CF, et al. J. Appl. Physiol. 28, 219-20 (1970)(7) Orton M, et al. Proc. Intl. Soc. Mag. Res. Med. 14, 3490 (2006)This project was funded by EPSRC grants GR/T20434/01 and GR/T20427/01(P),and CRUK grant C1060/A808.