Consolidated half-year report at 30 June 2012 - Snam
Consolidated half-year report at 30 June 2012 - Snam
Consolidated half-year report at 30 June 2012 - Snam

Create successful ePaper yourself
Turn your PDF publications into a flip-book with our unique Google optimized e-Paper software.
2 <strong>Snam</strong> Directors' Report / Financial reviewMISSIONWe are a company <strong>at</strong> the forefront of the regul<strong>at</strong>ed gas sector in Italyand a major player in Europe in terms of regul<strong>at</strong>ory asset base (RAB).We have excellent expertise in the transport<strong>at</strong>ion, disp<strong>at</strong>ch,storage and distribution of n<strong>at</strong>ural gas, and the regasific<strong>at</strong>ionof liquefied n<strong>at</strong>ural gas.We have provided our customers with a safe and dependableservice over time. We do this through our commitment to developinginfrastructure and cre<strong>at</strong>ing a flexible gas market accordingto the principles of competition and assuring our customersequal access to infrastructures and equal tre<strong>at</strong>ment.Our aim is to cre<strong>at</strong>e value th<strong>at</strong> will fulfil our shareholders’ expect<strong>at</strong>ions.We are able to realise this commitment thanks to professional skillsof people who, on a daily basis, do their utmost to achievesustainable growth th<strong>at</strong> is environmentally friendly and accountableto local areas and their communities.<strong>Snam</strong> Half - <strong>year</strong> Report <strong>2012</strong>
DisclaimerThis <strong>report</strong> includes forward-looking st<strong>at</strong>ements, especially in the “Outlook” section, rel<strong>at</strong>ing to: n<strong>at</strong>uralgas demand, investment plans, future oper<strong>at</strong>ing performance and project execution.Such st<strong>at</strong>ements are, by their very n<strong>at</strong>ure, subject to risk and uncertainty as they depend on whether futureevents and developments take place. The actual results may therefore differ from those forecast as a resultof several factors: trends in n<strong>at</strong>ural gas demand, supply and price, actual oper<strong>at</strong>ing performance, generalmacro-economic conditions, geopolitical factors such as intern<strong>at</strong>ional tensions, the effect of new energyand environmental legisl<strong>at</strong>ion, the successful development and implement<strong>at</strong>ion of new technologies,changes in stakeholders’ expect<strong>at</strong>ions and other changes in business conditions.
Directors' ReportDirectors’ Report7 Highlights10 Key figuresTrends in the segments of oper<strong>at</strong>ion15 N<strong>at</strong>ural gas transport<strong>at</strong>ion18 Liquefied N<strong>at</strong>ural Gas (LNG) regasific<strong>at</strong>ion19 N<strong>at</strong>ural gas storage22 N<strong>at</strong>ural gas distributionFinancial review and other inform<strong>at</strong>ionFinancial review27 Income st<strong>at</strong>ement34 Reclassified consolid<strong>at</strong>ed balance sheet40 Reclassified consolid<strong>at</strong>ed st<strong>at</strong>ement of cash flows43 Elements of risk and uncertainty50 Outlook51 Post-balance sheet events53 Inform<strong>at</strong>ion on rel<strong>at</strong>ed parties55 Other inform<strong>at</strong>ion57 GlossaryCondensed interim consolid<strong>at</strong>ed financial st<strong>at</strong>ementsCondensed interim consolid<strong>at</strong>ed financial st<strong>at</strong>ements64 Financial st<strong>at</strong>ements68 Notes to the condensed interim consolid<strong>at</strong>ed financial st<strong>at</strong>ements102 St<strong>at</strong>ement from management103 Independent auditors’ <strong>report</strong><strong>Snam</strong> means <strong>Snam</strong> S.p.A. and the companies within its scope of consolid<strong>at</strong>ion.
CORPORATE OFFICERSBOARD OF DIRECTORS (*)Salv<strong>at</strong>ore SardoChairmanCarlo Malacarne Chief Executive Officer (1)Alessandro BerniniDirectorDavide CroffIndependent DirectorElisabetta Oliveri Independent Director (2)Mario Stella Richter Independent Director (2)Massimo MantovaniDirectorRen<strong>at</strong>o SantiniIndependent DirectorRoberto Lonzar Independent Director (2)BOARD OF STATUTORY AUDITORS (*)Massimo G<strong>at</strong>to Chairman (2)Francesco Schiavone Panni Standing auditorRoberto MazzeiStanding auditorGiulio GambaAltern<strong>at</strong>e auditorLuigi Rinaldi Altern<strong>at</strong>e auditor (2)INDEPENDENT AUDITORS (**)Reconta Ernst & Young S.p.A.Inform<strong>at</strong>ion on the powers reserved for the Board of Directors, the powers invested in the Chairman and the CEO, as well asthe composition and duties of Board of Directors’ committees (Control and Risk Committee (formerly the Internal ControlCommittee), the Compens<strong>at</strong>ion Committee and the Nomin<strong>at</strong>ions Committee) are provided in the document entitled “2011Report on Corpor<strong>at</strong>e Governance and Ownership Structure”, available on the Company’s website <strong>at</strong> www.snam.it under thesection “Governance”.(*) Appointed by the Shareholders’ Meeting on 27 April 2010 and in office until the approval of the financial st<strong>at</strong>ements forthe <strong>year</strong> ended 31 December <strong>2012</strong>.(**) Role appointed by the Shareholders’ Meeting on 27 April 2010 for the period 2010-2018.(1) Confirmed by the Board of Directors on <strong>30</strong> April 2010.(2) Appointed from the minority shareholders’ list.
Directors’ Report
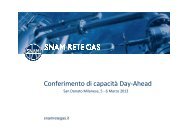
7<strong>Snam</strong> Directors' Report / HighlightsHighlightsFinancial highlights• In the first <strong>half</strong> of <strong>2012</strong>, <strong>Snam</strong> achieved EBIT of €1,013 million, an increase of 2.7% on the first <strong>half</strong>of 2011. The increase mainly reflected higher revenue from regul<strong>at</strong>ed activities across all the mainareas of business, partly absorbed by gre<strong>at</strong>er amortis<strong>at</strong>ion and depreci<strong>at</strong>ion – mainly due to the entryinto service of new infrastructure – and higher oper<strong>at</strong>ing costs. The increase in EBIT reflects a positiveperformance by the storage business segment (+€20 million: +14.4%) and an improvement in then<strong>at</strong>ural gas distribution and transport<strong>at</strong>ion business segments.• The net profit registered in the first <strong>half</strong> of <strong>2012</strong> of €508 million (-11.8%) was significantly affectedby the applic<strong>at</strong>ion of additional IRES (the “Robin Hood Tax”, in force since 13 August 2011) to then<strong>at</strong>ural gas transport<strong>at</strong>ion and distribution business segments, which entailed an increase in tax of€76 million. An increase in net financial expense (-15.2%) also contributed to the reduction, mainlydue to the higher cost of debt and the rise in average debt for the period.• The net cash flow from oper<strong>at</strong>ions (€614 million) allowed us to cover almost entirely the financialrequirements associ<strong>at</strong>ed with net investments for the period of €678 million. The net financial debtof €11,734 million, after the payment to shareholders of the balance of the 2011 dividend of €473million, increased by €537 million compared with 31 December 2011.• In view of the projected results for the full-<strong>year</strong> <strong>2012</strong>, the CEO will recommend to the Board ofDirectors of <strong>Snam</strong> S.p.A., subject to the approval of the independent auditors as referred to in Article2433-bis of the Italian Civil Code, the payment to shareholders of a <strong>2012</strong> interim dividend of €0.10per share (€0.10 per share in 2011) with an ex-dividend d<strong>at</strong>e of 22 October <strong>2012</strong> and a dividend d<strong>at</strong>eof 25 October <strong>2012</strong>.• Investments for the first <strong>half</strong> of <strong>2012</strong> totalled €524 million (€681 million in the first <strong>half</strong> of 2011).Subsidised investments represent 70% of total investments.• The <strong>Snam</strong> share ended the first <strong>half</strong> of <strong>2012</strong> <strong>at</strong> an official listed price of €3.52 per share, 3.8% higherthan the closing price of the share <strong>at</strong> the end of December 2011, outperforming both the Italianstock market (FTSE MIB: -5.4%) and the European utilities sector (Eurostoxx Utilities: unchanged).The European financial markets were on a downward trend in the <strong>half</strong>-<strong>year</strong>, particularly in the secondquarter, due to the intensific<strong>at</strong>ion of the debt crisis in the eurozone and the possible repercussionsof this for the European banking sector. In this context of uncertainty and vol<strong>at</strong>ility, the <strong>Snam</strong> sharebenefited from the positive reception of the new industrial plan and the str<strong>at</strong>egy of foreign expansion,as well as the definition of procedures for the sale of Eni’s controlling investment.<strong>Snam</strong> Half - <strong>year</strong> Report <strong>2012</strong>
<strong>Snam</strong> Directors' Report / Highlights8Oper<strong>at</strong>ing highlights• A total of 40.88 billion cubic metres of n<strong>at</strong>ural gas was injected into the n<strong>at</strong>ional transport<strong>at</strong>ionnetwork, a reduction of 1.03 billion cubic metres (-2.5%) compared with the first <strong>half</strong> of 2011. Thisfall was <strong>at</strong>tributable to reduced domestic demand for n<strong>at</strong>ural gas, essentially as a result of lowerconsumption in the power gener<strong>at</strong>ion sector, partly offset by increased net injection into storage.• In the first <strong>half</strong> of <strong>2012</strong>, the LNG terminal <strong>at</strong> Panigaglia regasified 0.79 billion cubic metres of n<strong>at</strong>uralgas, a reduction of 0.21 billion cubic metres, or 21.0%, compared with the first <strong>half</strong> of 2011 (1.00billion cubic metres).• Available storage capacity alloc<strong>at</strong>ed <strong>at</strong> <strong>30</strong> <strong>June</strong> <strong>2012</strong> was approxim<strong>at</strong>ely 10.7 billion cubic metres, anincrease of 0.7 billion cubic metres (+7.0%) compared with 31 December 2011. The rise is chiefly dueto investments in upgrades and development <strong>at</strong> the Fiume Treste and Sergnano concessions.• As <strong>at</strong> <strong>30</strong> <strong>June</strong> <strong>2012</strong>, the number of active meters loc<strong>at</strong>ed <strong>at</strong> end-user gas redelivery points stood <strong>at</strong>5.907 million units (5.897 <strong>at</strong> 31 December 2011).Key events in the first <strong>half</strong> of <strong>2012</strong>Decree of the President of the Council of Ministers (DPCM) of 25 May <strong>2012</strong> – Implement<strong>at</strong>ion ofownership unbundling between Eni and <strong>Snam</strong>Pursuant to Article 15 of Decree Law 1 of 24 January <strong>2012</strong> (the “Liberalis<strong>at</strong>ion Decree”), converted withamendments into Law 27 of 24 March <strong>2012</strong>, rel<strong>at</strong>ing to “Urgent provisions on competition, infrastructuredevelopment and competition”, the President of the Council of Ministers issued, on 25 May <strong>2012</strong>, thedecree defining the procedures and deadlines for ownership unbundling of <strong>Snam</strong> by Eni, which must takeplace within 18 months of the entry into force of the above conversion law (i.e. by 25 September 2013). Theapproval of the DPCM will complete the regul<strong>at</strong>ory framework for the ownership unbundling of the n<strong>at</strong>uralgas transport<strong>at</strong>ion, distribution, storage and regasific<strong>at</strong>ion activities, as defined by the Liberalis<strong>at</strong>ion Decree.Specifically, Article 1 of the DPCM (“Ownership unbundling”), establishes th<strong>at</strong> Eni must sell a totalportion of no less than 25.1% of the share capital of <strong>Snam</strong> to Cassa Depositi e Prestiti S.p.A. (hereinafterCDP), according to the procedures defined by the Boards of Directors of the two companies. The aim isto maintain a stable core investment in <strong>Snam</strong>’s capital, to ensure the development of str<strong>at</strong>egic activitiesand to safeguard the fe<strong>at</strong>ures of the public utility service provided by <strong>Snam</strong>. By acquiring <strong>at</strong> least 25.1%of <strong>Snam</strong>’s share capital, CDP plans to ensure independence between Eni and <strong>Snam</strong> (the “full impartialityof <strong>Snam</strong>” indic<strong>at</strong>ed in Article 15, paragraph 2 of the Decree Law).To this end, on <strong>30</strong> May <strong>2012</strong>, Eni and CDP announced to the market th<strong>at</strong> they had reached a binding preliminaryagreement for the sale to CDP of an equity investment of <strong>30</strong>% minus one share in the voting capital of <strong>Snam</strong>owned by Eni. Completion of the transaction, possible from 15 October this <strong>year</strong>, is scheduled to take placeby the end of <strong>2012</strong>, provided th<strong>at</strong> certain conditions precedent are met, including, principally, authoris<strong>at</strong>ion bythe Competition Authority. Eni formalised the sale contract with CDP on 15 <strong>June</strong> <strong>2012</strong>.The residual portion of Eni’s equity investment in <strong>Snam</strong> (about 25% of the voting capital) must besold, under the terms set by the DPCM, according to sales procedures which are transparent and do notdiscrimin<strong>at</strong>e between retail and institutional investors.On 18 July <strong>2012</strong>, Eni sold 5% of the share capital (amounting to 5.28% of the voting capital) of <strong>Snam</strong>S.p.A. to institutional investors.Debt refinancingAs part of the general framework set out by the DPCM, with the aim of diversifying sources of fundsby broadening the investor base, the Board of Directors of <strong>Snam</strong> resolved on 4 <strong>June</strong> <strong>2012</strong> to issue oneor more bond loans for placement with institutional investors oper<strong>at</strong>ing in Europe, on the basis of anissue programme of Euro Medium Term Notes (EMTN), for a total maximum amount of €8 billion, to beissued in one or more tranches by 4 <strong>June</strong> 2013.<strong>Snam</strong> Half - <strong>year</strong> Report <strong>2012</strong>
9<strong>Snam</strong> Directors' Report / HighlightsThe following bonds have been issued under the EMTN plan: (i) €1 billion on 11 July <strong>2012</strong> in the firstbond issue. This 4-<strong>year</strong> bond loan will m<strong>at</strong>ure on 11 July 2016 and pays out an annual fixed-r<strong>at</strong>e couponof 4.375%; and (ii) €1 billion on 19 July <strong>2012</strong>. This 6.5-<strong>year</strong> loan will m<strong>at</strong>ure on 18 January 2019 andpays out an annual fixed-r<strong>at</strong>e coupon of 5.0%.On 7 <strong>June</strong> <strong>2012</strong>, <strong>Snam</strong> also signed, with a group of 11 leading n<strong>at</strong>ional and intern<strong>at</strong>ional banks,a mand<strong>at</strong>e for the structuring and underwriting of a pool loan of €11 billion, which will cover thegroup’s requirements, including the refinancing of its current debt to Eni. On 24 July <strong>2012</strong>, <strong>Snam</strong> signedagreements for credit lines totalling €9 billion. The amount of the credit lines was lower than the original€11 billion due to the placement on the capital market of bonds totalling €2 billion.As part of the debt refinancing project, a series of bil<strong>at</strong>eral agreements have also been signed with someof these banks totalling around €3.5 billion, of which €3.2 billion had already been agreed upon <strong>at</strong> thed<strong>at</strong>e of this <strong>report</strong> (€1.5 billion drawn down by <strong>30</strong> <strong>June</strong> <strong>2012</strong>).These agreements will provide <strong>Snam</strong> with short-term financing based primarily on bank credit, but withthe aim of progressively meeting a target debt structure largely made up of bond loans, in line with itsbusiness profile and the regul<strong>at</strong>ory context in which it oper<strong>at</strong>es.In support of the refinancing oper<strong>at</strong>ion, on 13 <strong>June</strong> <strong>2012</strong> <strong>Snam</strong> obtained its first credit r<strong>at</strong>ing fromMoody’s (Baa1 with stable outlook) and from Standard & Poor’s (A- with neg<strong>at</strong>ive outlook, A-2).Due to the downgrade of the debt r<strong>at</strong>ing assigned to the Italian Republic, on 16 July <strong>2012</strong> Moody’sannounced a multiple review of the r<strong>at</strong>ings and/or outlooks of a broad range of Italian companies,including <strong>Snam</strong>. Specifically, <strong>Snam</strong>’s r<strong>at</strong>ing of Baa1 has been placed under review for downgrade.Developing business abroadOn 16 May <strong>2012</strong>, <strong>Snam</strong> and Fluxys signed an agreement for the joint purchase, on an equal basis, of the15.09% stake in Interconnector UK (the oper<strong>at</strong>or th<strong>at</strong> owns the underw<strong>at</strong>er gas pipeline th<strong>at</strong> forms astr<strong>at</strong>egic, bi-directional connection between the UK and the major European gas trading marketplaces)held by E.ON. The transaction is scheduled for completion by the end of <strong>2012</strong>, for €127 million in total.The purchase will strengthen <strong>Snam</strong>’s equity investment in Interconnector UK, which is already sizeable dueto the joint acquisition, with Fluxys, of the shares held by Eni (16.41%), and is part of a str<strong>at</strong>egic alliancebetween <strong>Snam</strong> and Fluxys designed to promote integr<strong>at</strong>ion of gas transport<strong>at</strong>ion networks in Europe.Agreement between Italgas and Acegas-Aps for n<strong>at</strong>ural gas distribution in north-eastern Italy.On 24 April <strong>2012</strong>, Italgas and Acegas-Aps signed a memorandum of understanding to cre<strong>at</strong>e a jointventure for the development of n<strong>at</strong>ural gas distribution activities in north-eastern Italy. The newagreement will enable up to 470 thousand users, spread across 76 municipalities under concession in theprovinces of Padua, Pordenone, Trieste and Gorizia, to be served.The transaction, which will see Italgas and Acegas-Aps holding respective stakes of 49% and 51% in thejoint venture, is scheduled for completion <strong>at</strong> the end of <strong>2012</strong>.<strong>Snam</strong> Half - <strong>year</strong> Report <strong>2012</strong>
<strong>Snam</strong> Directors' Report / Key figures10Key figuresTo improve the economic and financial review, in addition to conventional IAS/IFRS indic<strong>at</strong>ors andfinancial st<strong>at</strong>ements, the interim directors’ <strong>report</strong> also contains reclassified financial st<strong>at</strong>ements andseveral altern<strong>at</strong>ive performance indic<strong>at</strong>ors such as EBITDA, EBIT and net financial debt. The followingtables, the explan<strong>at</strong>ory notes thereto and the reclassified financial st<strong>at</strong>ements <strong>report</strong> these amounts; seethe glossary for a definition of the terms used, where these are not specified.Key financial figuresFinancial <strong>year</strong>First <strong>half</strong>2011 (€ million) 2011 <strong>2012</strong> Change % change3,539 Core business revenue 1,744 1,791 47 2.73,179 Core business revenue net of the effects of IFRIC 12 1,576 1,644 68 4.3993 Oper<strong>at</strong>ing costs 462 505 43 9.3633 Oper<strong>at</strong>ing costs net of the effects of IFRIC 12 294 358 64 21.82,612 EBITDA 1,<strong>30</strong>0 1,358 58 4.51,958 EBIT 986 1,013 27 2.7790 Net profit (a) 576 508 (68) (11.8)978 Adjusted net profit (b) 576 508 (68) (11.8)(a)(b)Net profit is <strong>at</strong>tributable to <strong>Snam</strong>.Adjusted net profit for financial <strong>year</strong> 2011 excludes a deferred tax charge of €188 million rel<strong>at</strong>ing to the adjustment of deferred tax <strong>at</strong> 31 December 2010 by the companies oper<strong>at</strong>ing inn<strong>at</strong>ural gas transport<strong>at</strong>ion and distribution. From 13 August 2011, the additional IRES of 10.5% for three <strong>year</strong>s (2011, <strong>2012</strong> and 2013) applies to these companies, after which a r<strong>at</strong>e of 6.5%will apply from 2014.Key balance sheet and cash flow figuresFinancial <strong>year</strong>First <strong>half</strong>2011 (€ million) 2011 <strong>2012</strong> Change % change1,585 Investments 681 524 (157) (23.1)16,989 Net invested capital <strong>at</strong> period end 16,769 17,529 760 4.55,792 Shareholders' equity including minority interests <strong>at</strong> period end 6,038 5,795 (243) (4.0)5,791 Shareholders’ equity <strong>at</strong>tributable to the Group <strong>at</strong> period end 6,037 5,794 (243) (4.0)11,197 Net financial debt <strong>at</strong> period end 10,731 11,734 1,003 9.3(52) Free cash flow 78 (64) (142)<strong>Snam</strong> Half - <strong>year</strong> Report <strong>2012</strong>
11<strong>Snam</strong> Directors' Report / Key figuresKey share figuresFinancial <strong>year</strong>First <strong>half</strong>2011 2011 <strong>2012</strong> Change % change3,571.2 Number of shares in share capital (millions) 3,571.2 3,571.23,378.6 Number of shares outstanding <strong>at</strong> the end of the period (millions) 3,378.2 3,378.6 0.43,378.0 Average number of shares outstanding during the period (millions) 3,377.5 3,378.6 1.13.39 Official share price <strong>at</strong> period end (€) 4.07 3.52 (0.55) (13.5)3.75 Average official share price during the period (€) 3.98 3.47 (0.51) (12.8)Key profit indic<strong>at</strong>orsFinancial <strong>year</strong>First <strong>half</strong>2011 2011 <strong>2012</strong> Change % change0.580 EBIT per share (a) (€) 0.292 0.<strong>30</strong>0 0.008 2.70.234 Net profit per share (a) (€) 0.170 0.150 (0.020) (11.8)(a)Calcul<strong>at</strong>ed based on the average number of shares in issue during the period.<strong>Snam</strong> Half - <strong>year</strong> Report <strong>2012</strong>
13 <strong>Snam</strong> Directors' Report / Key figuresSNAM AND THE FINANCIAL MARKETS - COMPARISON OF PRICES OF SNAM, FTSE MIB AND EURO STOXX 600 UTILITIES(31 December 2011 – <strong>30</strong> <strong>June</strong> <strong>2012</strong>)120Volume <strong>Snam</strong> FTSEMIB Eurostoxx Utilities Mln8011010060904080702060Jan-12 Feb-12 Mar-12 Apr-12 May-12 <strong>June</strong>-120<strong>Snam</strong> Half - <strong>year</strong> Report <strong>2012</strong>
Trends in the segmentsof oper<strong>at</strong>ion
15<strong>Snam</strong> Directors' Report / N<strong>at</strong>ural gas transport<strong>at</strong>ionN<strong>at</strong>ural gas transport<strong>at</strong>ionIntroductionOn 1 January <strong>2012</strong>, the transaction transferring the “Transport<strong>at</strong>ion, disp<strong>at</strong>ch, remote control andmetering of n<strong>at</strong>ural gas” of <strong>Snam</strong> S.p.A. (formerly <strong>Snam</strong> Rete Gas S.p.A.) to <strong>Snam</strong> Rete Gas S.p.A.(formerly <strong>Snam</strong> Trasporto S.p.A.), a wholly owned company and transport<strong>at</strong>ion system oper<strong>at</strong>or on acontinuing basis from 1 January <strong>2012</strong>, came into effect. The new ownership structure, which came intoforce on 1 January <strong>2012</strong>, places <strong>Snam</strong> S.p.A. <strong>at</strong> the head of the Group, holding 100% of the share capitalof the four oper<strong>at</strong>ing companies (<strong>Snam</strong> Rete Gas S.p.A., Gnl Italia S.p.A., Stogit S.p.A. and Italgas S.p.A.),which are responsible, respectively, for the management and development of n<strong>at</strong>ural gas transport<strong>at</strong>ion,regasific<strong>at</strong>ion, storage and distribution activities. <strong>Snam</strong> S.p.A. is also responsible for str<strong>at</strong>egic planning,management and coordin<strong>at</strong>ion and control.Since 1 January <strong>2012</strong>, inform<strong>at</strong>ion about parent company <strong>Snam</strong> S.p.A. has been <strong>report</strong>ed in the “Corpor<strong>at</strong>e”segment 1 . Until 31 December 2011, this inform<strong>at</strong>ion, not <strong>report</strong>ed separ<strong>at</strong>ely, was included within the“N<strong>at</strong>ural gas transport<strong>at</strong>ion” segment, reflecting the activities hitherto carried out by the parent company.Key performance indic<strong>at</strong>orsFinancial <strong>year</strong>First <strong>half</strong>2011 (€ million) 2011 <strong>2012</strong> Change % change1,945 Core business revenue (*) (**) 970 961 (9) (0.9)1,867 - of which n<strong>at</strong>ural gas transport<strong>at</strong>ion revenue 935 954 19 2.0387 Oper<strong>at</strong>ing costs (*)(**) 176 198 22 12.51,137 EBIT 588 589 1 0.2892 Investments 369 <strong>30</strong>1 (68) (18.4)709 - of which with incentives 296 253 (43) (14.5)183 - of which without incentives 73 48 (25) (34.2)78.<strong>30</strong>N<strong>at</strong>ural gas injected in the n<strong>at</strong>ional gas transport<strong>at</strong>ion network(billions of cubic metres)41.91 40.88 (1.03) (2.5)32,010 Transport<strong>at</strong>ion network (kilometres in use) 31,716 32,108 392 1.29,080 - of which n<strong>at</strong>ional network 8,895 9,158 263 3.022,9<strong>30</strong> - of which regional network 22,821 22,950 129 0.6(*) Before consolid<strong>at</strong>ion adjustments.(**) D<strong>at</strong>a for the first <strong>half</strong> of 2011 include: (i) revenue deriving from the recharge to subsidiaries of the costs incurred for services provided centrally by the parent company (€27 million); and(ii) income deriving from renting and maintaining fibre optic telecommunic<strong>at</strong>ions cables (€5 million). Starting on 1 January <strong>2012</strong> and in line with the new ownership structure of the <strong>Snam</strong>Group, the costs and revenue arising from the management of the businesses are alloc<strong>at</strong>ed to the Corpor<strong>at</strong>e segment.ResultsRevenue from n<strong>at</strong>ural gas transport<strong>at</strong>ion totalled €954 million, up by €19 million (2.0%) comparedwith the first <strong>half</strong> of 2011. This increase was due mainly to the contribution of investments made in2010 (+€46 million), the effects of which were partly offset by tariff upd<strong>at</strong>ing (-€24 million) and lowervolumes of n<strong>at</strong>ural gas transported (-€3 million).1 In accordance with IFRS 8 “Oper<strong>at</strong>ing segments”, the Corpor<strong>at</strong>e segment does not represent an oper<strong>at</strong>ing segment.Therefore, the oper<strong>at</strong>ing segments subject to separ<strong>at</strong>e <strong>report</strong>ing are the same as in the first <strong>half</strong> of 2011 (n<strong>at</strong>ural gastransport<strong>at</strong>ion, regasific<strong>at</strong>ion, storage and distribution).<strong>Snam</strong> Directors' Report
<strong>Snam</strong> Directors' Report / N<strong>at</strong>ural gas transport<strong>at</strong>ion16EBIT 2 of €589 million was largely in line with the first <strong>half</strong> of 2011 (€588 million). Higher transport<strong>at</strong>ionrevenue (+€19 million) were absorbed by gre<strong>at</strong>er amortis<strong>at</strong>ion and depreci<strong>at</strong>ion (-€10 million), mainly dueto the entry into service of new infrastructure, and a decrease in other revenue and income (-€4 million).EBIT was also affected by lower revenue from rental and maintenance of fibre optic telecommunic<strong>at</strong>ionscables (-€5 million), an activity remaining within the scope of <strong>Snam</strong> S.p.A.Oper<strong>at</strong>ing reviewInvestmentsFinancial <strong>year</strong>First <strong>half</strong>2011 (*) (€ million) 2011 (*) <strong>2012</strong> Change % change601 Development 260 202 (58) (22.3)356 Investments with 3% incentive 212 160 (52) (24.5)245 Investments with 2% incentive 48 42 (6) (12.5)291 Maintenance and other 109 99 (10) (9.2)108 Investments with 1% incentive 36 51 15 41.7183 Investments with no incentives 73 48 (25) (34.2)892 369 <strong>30</strong>1 (68) (18.4)(*) Some projects previously included in c<strong>at</strong>egories of investments with 2% incentive were classified as incentives with 3% incentive. The correspondingamounts for 2011 were reclassified accordingly.Investments in the first <strong>half</strong> of <strong>2012</strong> amounted to €<strong>30</strong>1 million, down €68 million, or 18.4%, comparedwith the first <strong>half</strong> of 2011.Investments were classified in accordance with Resolution ARG/gas 184/09 of the Electricity and GasAuthority, which identified various c<strong>at</strong>egories of project with different incentive levels.Investments benefiting from incentive-based return account for 84% of the total. The breakdown ofinvestments by c<strong>at</strong>egory for 2011 and <strong>2012</strong> will be submitted to the Authority when it approves theproposed tariff for 2013 and 2014. The breakdown for 2014 may differ from the tariff in the currentregul<strong>at</strong>ory period, which ends on 31 December 2013.The main investments with a 3% incentive (€160 million) were:• m<strong>at</strong>erials for the Zimella-Cervignano methane pipeline in Veneto and Lombardy and the continu<strong>at</strong>ionof construction work on the Poggio Ren<strong>at</strong>ico-Cremona pipeline in Emilia-Romagna and Lombardy, aspart of the project to upgrade the transport<strong>at</strong>ion infrastructure in the Po Valley (€82 million).• as part of the enhancement of the import infrastructure in Sicily and Calabria (€25 million): (i) renov<strong>at</strong>ionwork and equipment <strong>at</strong> the Enna st<strong>at</strong>ion in Sicily; (ii) the continu<strong>at</strong>ion of construction work and m<strong>at</strong>erialsfor the upgrading of the Montesano st<strong>at</strong>ion in Campania; and (iii) completion works on the sectionsalready in service and construction of the tunnel section of the Montalbano-Messina pipeline in Sicily;• the construction of infrastructure to connect with the Offshore LNG Toscana (OLT) regasific<strong>at</strong>ionterminal <strong>at</strong> Livorno (€15 million) on the coast of Tuscany;• the continu<strong>at</strong>ion of construction work on the main line of the Massafra-Biccari pipeline in Puglia andBasilic<strong>at</strong>a as part of the new transport<strong>at</strong>ion infrastructure project on the Adri<strong>at</strong>ic coast (€13 million);2 EBIT is analysed by considering only those components th<strong>at</strong> have changed it, since the applic<strong>at</strong>ion of the gas sector tariff rulesgener<strong>at</strong>es revenue and cost items th<strong>at</strong> offset each other: modul<strong>at</strong>ion, interconnection and balancing. Specifically, revenue(€46 million) from the balancing business, oper<strong>at</strong>ional since 1 December 2011, in accordance with Resolution ARG/gas45/11 of the Electricity and Gas Authority, rel<strong>at</strong>es to sales of n<strong>at</strong>ural gas made for the purposes of balancing the gas network.The revenue is m<strong>at</strong>ched to oper<strong>at</strong>ing costs linked to withdrawals from the gas storage system.<strong>Snam</strong> Directors' Report
17<strong>Snam</strong> Directors' Report / N<strong>at</strong>ural gas transport<strong>at</strong>ion• the continu<strong>at</strong>ion of construction work on the Palaia-Collesalvetti pipeline in Tuscany (€13 million).The main investments with a 2% incentive (€42 million) rel<strong>at</strong>e to a number of works to upgrade theregional and n<strong>at</strong>ional network and to connect to new redelivery points, including:• construction works on methane pipelines and associ<strong>at</strong>ed connections, as part of the n<strong>at</strong>ural gasconversion project in Calabria (€6 million).• completion of construction works on the methane pipeline connecting the Edison Stoccaggio storagest<strong>at</strong>ion in Collalto, Veneto (€6 million).The main investments with a 1% incentive (€51 million) involved numerous projects aimed <strong>at</strong>maintaining adequ<strong>at</strong>e safety and quality levels <strong>at</strong> the st<strong>at</strong>ions.N<strong>at</strong>ural gas injected into the gas transport<strong>at</strong>ion networkFinancial <strong>year</strong>First <strong>half</strong>2011 (billion m 3 ) 2011 <strong>2012</strong> Change % change8.03 Domestic output 3.85 4.11 0.26 6.870.27 Imports (entry points) 38.06 36.77 (1.29) (3.4)26.45 Tarvisio 13.71 11.58 (2.13) (15.5)21.55 Mazara del Vallo 13.25 12.42 (0.83) (6.3)10.86 Gries Pass 4.82 5.29 0.47 9.87.02 Cavarzere (LNG) 3.85 3.41 (0.44) (11.4)2.34 Gela 1.34 3.17 1.831.89 Panigaglia (LNG) 1.00 0.79 (0.21) (21.0)0.16 Gorizia 0.09 0.11 0.02 22.278.<strong>30</strong> 41.91 40.88 (1.03) (2.5)The amount of n<strong>at</strong>ural gas injected into the n<strong>at</strong>ional gas transport<strong>at</strong>ion network in the first <strong>half</strong> of<strong>2012</strong> was 40.88 billion cubic metres, down by 1.03 billion cubic metres, or 2.5%, compared with the first<strong>half</strong> of 2011. This decrease was due to lower demand for n<strong>at</strong>ural gas in Italy (-2.3%), mainly reflectinglower consumption in the power gener<strong>at</strong>ion sector (-12.3%), partly absorbed by increased demand in theresidential and tertiary sector (+3.9%) due to lower temper<strong>at</strong>ures.N<strong>at</strong>ural gas injected into the n<strong>at</strong>ional network from domestic production fields or their collection andtre<strong>at</strong>ment centres was 4.11 billion cubic metres, up by 0.26 billion cubic metres (6.8%) compared withthe first <strong>half</strong> of 2011.Imports by entry point, which registered a reduction of 1.29 billion cubic metres (-3.4%) compared withthe first <strong>half</strong> of 2011, show lower volumes imported <strong>at</strong> the entry points of Tarvizio (-2.13 billion cubicmetres, or -15.5%) resulting from lower gas imports from Russia; <strong>at</strong> Mazara del Vallo (-0.83 billion cubicmetres, or -6.3%) and <strong>at</strong> the regasific<strong>at</strong>ion terminals of Cavarzere and Panigaglia (-0.44 and -0.21 billioncubic metres respectively), against an increase in imports through the entry points of Gela (+1.83 billioncubic metres), which was neg<strong>at</strong>ively affected by the Libyan crisis in the first <strong>half</strong> of 2011, and Gries Pass(+0.47 billion cubic metres, or +9.8%).<strong>Snam</strong> Directors' Report
<strong>Snam</strong> Directors' Report / Liquefied N<strong>at</strong>ural Gas (LNG) regasific<strong>at</strong>ion18Liquefied N<strong>at</strong>ural Gas (LNG) regasific<strong>at</strong>ionKey performance indic<strong>at</strong>orsFinancial <strong>year</strong>First <strong>half</strong>2011 (€ million) 2011 <strong>2012</strong> Change % change34 Core business revenue (*) (**) 17 1723 - of which LNG regasific<strong>at</strong>ion revenue 12 11 (1) (8.3)23 Oper<strong>at</strong>ing costs (**) 12 14 2 16.77 EBIT 4 2 (2) (50.0)3 Investments 1 (1) (100.0)1.89 Volumes of LNG regasified (billions of cubic metres) 1.00 0.79 (0.21) (21.0)50 Tanker loads (number) 25 23 (2) (8.0)(*) Core business revenue includes the recharging to customers of expenses rel<strong>at</strong>ing to n<strong>at</strong>ural gas transport<strong>at</strong>ion services provided by <strong>Snam</strong> Rete Gas S.p.A. For the purposes of the consolid<strong>at</strong>edfinancial st<strong>at</strong>ement this revenue is cancelled, together with transport costs, within GNL Italia S.p.A. in order to represent the substance of the oper<strong>at</strong>ion.(**) Before consolid<strong>at</strong>ion adjustments.ResultsRevenue from LNG regasific<strong>at</strong>ion totalled €11 million, down €1 million compared with the first <strong>half</strong>of 2011, and rel<strong>at</strong>es to capacity fees 3 (€10 million) and variable sums paid for regasified volumes (€1million).EBIT was €2 million, down by €2 million, or 50.0%, on the first <strong>half</strong> of 2011. The decrease is due to thelower regasific<strong>at</strong>ion revenue and higher oper<strong>at</strong>ing costs.Oper<strong>at</strong>ing reviewVolumes of LNG regasifiedDuring the first <strong>half</strong> of <strong>2012</strong>, the LNG terminal <strong>at</strong> Panigaglia (SP) regasified 0.79 billion cubic metres ofn<strong>at</strong>ural gas (1.00 billion cubic metres in the first <strong>half</strong> of 2011), unloading 23 methane tankers of varioustypes (25 in the first <strong>half</strong> of 2011).Regul<strong>at</strong>ionResolution 237/<strong>2012</strong>/R/gas– “Extension of the criteria for determining regasific<strong>at</strong>ion tariffs for thetransition period October <strong>2012</strong> - December 2013”.With this resolution, which was published on 8 <strong>June</strong> <strong>2012</strong>, the Authority extended the current tariffcriteria for the regasific<strong>at</strong>ion service for the transition period from 1 October <strong>2012</strong> to 31 December2013, specifically providing for the r<strong>at</strong>e of remuner<strong>at</strong>ion of invested capital recognised to be upd<strong>at</strong>edfrom 7.6% to 8.2% in real pre-tax terms, based on the same parameters as those applied to the electricitysector for the fourth regul<strong>at</strong>ory period.3 Capacity fees include revenue rel<strong>at</strong>ed to the regasific<strong>at</strong>ion commitment for an annual volume of LNG and a share ofrevenue rel<strong>at</strong>ed to the activity of docking and unloading methane tankers.<strong>Snam</strong> Directors' Report
19<strong>Snam</strong> Directors' Report / N<strong>at</strong>ural gas storageN<strong>at</strong>ural gas storageKey performance indic<strong>at</strong>orsFinancial <strong>year</strong>First <strong>half</strong>2011 (€ million) 2011 <strong>2012</strong> Change % change372 Core business revenue (*) 192 220 28 14.6372 - of which n<strong>at</strong>ural gas storage revenue 192 220 28 14.664 Oper<strong>at</strong>ing costs (*) 29 <strong>30</strong> 1 3.4255 EBIT 139 159 20 14.4296 Investments 131 63 (68) (51.9)10 Concessions (number) 10 108 - of which oper<strong>at</strong>ional (**) 8 815.31 N<strong>at</strong>ural gas moved through the storage system (billions of cubic metres) 8.37 9.67 1.<strong>30</strong> 15.57.78 - of which injected 4.05 4.74 0.69 17.07.53 - of which withdrawn 4.32 4.93 0.61 14.110.0 Available storage capacity (billions of cubic metres) (***) 10.0 11.2 1.2 12.0(*) Before consolid<strong>at</strong>ion adjustments.(**) With working gas capacity for modul<strong>at</strong>ion services.(***) Working gas capacity for modul<strong>at</strong>ion, mining and balancing services. The figure indic<strong>at</strong>ed represents the maximum available capacity and may not be in line with the maximum filling.ResultsRevenue from n<strong>at</strong>ural gas storage totalled €220 million , up €28 million (+14.6%) compared with thefirst <strong>half</strong> of 2011. The increase was mainly due to the investments made in 2010 (+€15 million). Storagerevenue refers to modul<strong>at</strong>ion storage (€184 million; +15.7%) and str<strong>at</strong>egic storage (€31 million; -6.1%).EBIT came to €159 million in the first <strong>half</strong> of <strong>2012</strong>, an increase of €20 million, or 14.4%, on the sameperiod of 2011. The increase is mainly due to higher storage revenue (+€27 million, minus revenuenetted against costs), as well as control of management costs. These factors were partially offset byincreased amortis<strong>at</strong>ion and depreci<strong>at</strong>ion in the period due to the entry into service of new infrastructure(-€6 million).4 Including payments received from Eni in addition to storage revenue for the thermal <strong>year</strong> from 1 April 2011 - 31 March <strong>2012</strong> (€5million) in respect of the agreement signed by Eni and Stogit rel<strong>at</strong>ing to activities connected to Legisl<strong>at</strong>ive Decree 1<strong>30</strong>/2010.<strong>Snam</strong> Half - <strong>year</strong> Report <strong>2012</strong>
<strong>Snam</strong> Directors' Report / N<strong>at</strong>ural gas storage20Oper<strong>at</strong>ing reviewINVESTMENtSFinancial <strong>year</strong>First <strong>half</strong>2011 (€ million) 2011 <strong>2012</strong> Change % change193 Development of new fields (4% incentive over 16 <strong>year</strong>s) 97 27 (70) (72.2)65 Upgrading of capacity (4% incentive over eight <strong>year</strong>s) 21 27 6 28.638 Maintenance and other 13 9 (4) (<strong>30</strong>.8)296 131 63 (68) (51.9)Investments in the first <strong>half</strong> of <strong>2012</strong> amounted to €63 million, down €68 million, or 51.9%, comparedwith the first <strong>half</strong> of 2011.Investments were classified in accordance with Resolution ARG/gas 119/10 of the Electricity and GasAuthority, which identified various c<strong>at</strong>egories of projects with different incentive levels.A total of 85.7% of these investments are expected to benefit from incentive-based return. The breakdownof investments in 2011 and <strong>2012</strong> by c<strong>at</strong>egory will be submitted to the Authority when the respectivetariff proposals for 2013 and 2014 are approved.Investments with a 4% incentive over 16 <strong>year</strong>s (€27 million) rel<strong>at</strong>e to development activities inprogress <strong>at</strong> the Bordolano storage field, as well as <strong>at</strong> the Fiume Treste storage field, mainly for theinjection of cushion gas 5 .Investments with a 4% incentive over eight <strong>year</strong>s (€27 million) refer to ongoing activities rel<strong>at</strong>ed toprojects to increase pressure, mainly <strong>at</strong> the Sabbioncello, Minerbio and Settala storage fields.N<strong>at</strong>ural gas moved through the storage systemDuring the first <strong>half</strong> of <strong>2012</strong>, 9.67 billion cubic metres of n<strong>at</strong>ural gas was moved through the storagesystem, an increase of 1.<strong>30</strong> billion cubic metres (+15.5%) compared with the same period in the previous<strong>year</strong>. The increase was mainly due to gre<strong>at</strong>er withdrawals from storage (0.61 billion cubic metres, or+14.1%), due to the emergency we<strong>at</strong>her conditions in the first quarter of <strong>2012</strong>, and the consequentgre<strong>at</strong>er injection (+0.69 billion cubic metres, or +17.0%) into storage.Total storage capacity <strong>at</strong> <strong>30</strong> <strong>June</strong> <strong>2012</strong>, including str<strong>at</strong>egic storage, was 15.7 billion cubic metres (+0.7billion cubic metres, or +4.7%), including 10.7 billion cubic metres in available capacity (10 billion cubicmetres in thermal <strong>year</strong> 2011-<strong>2012</strong>), 4.5 billion cubic metres in str<strong>at</strong>egic storage (5 billion cubic metresin thermal <strong>year</strong> 2011-<strong>2012</strong>) and 0.5 billion cubic metres in capacity made available due to reducedstr<strong>at</strong>egic storage.This capacity will be alloc<strong>at</strong>ed as provided for in Legisl<strong>at</strong>ive Decree 93 of 1 <strong>June</strong> 2011, according toprocedures to be put in place by Ministerial Decree, which has not yet been issued, assigning it “tocompanies with integr<strong>at</strong>ed services for transport by means of pipelines outside Italy and regasific<strong>at</strong>ion withn<strong>at</strong>ural gas storage, designed to allow direct procurement of n<strong>at</strong>ural gas from abroad”.5 Cushion gas is the minimum quantity of gas present in or injected into reservoirs during storage, which enables the extractionof the remaining volumes of gas without affecting, over time, the mineral characteristics of the reservoirs themselves.<strong>Snam</strong> Half - <strong>year</strong> Report <strong>2012</strong>
21<strong>Snam</strong> Directors' Report / N<strong>at</strong>ural gas storageRegul<strong>at</strong>ionResolution 185/<strong>2012</strong>/R/gas – “Mechanism for adjustment of site restor<strong>at</strong>ion costs and changes of AnnexA to the resolution of the Electricity and Gas Authority of 3 August 2010, ARG/gas 119/10”.With this resolution, published on 10 May <strong>2012</strong>, the Authority defined a mechanism for adjustment ofany differences arising from the total restor<strong>at</strong>ion provision paid to the storage company and the costsactually sustained for restor<strong>at</strong>ion of the storage sites.<strong>Snam</strong> Half - <strong>year</strong> Report <strong>2012</strong>
<strong>Snam</strong> Directors' Report / N<strong>at</strong>ural gas distribution22N<strong>at</strong>ural gas distributionKey performance indic<strong>at</strong>orsFinancial <strong>year</strong>First <strong>half</strong>2011 (€ million) 2011 <strong>2012</strong> Change % change1,297 Core business revenue (*) 614 619 5 0.81,263 - of which n<strong>at</strong>ural gas distribution revenue 598 601 3 0.5937 Core business revenue net of the effects of IFRIC 12 446 472 26 5.8903 - of which n<strong>at</strong>ural gas distribution revenue 4<strong>30</strong> 454 24 5.6633 Oper<strong>at</strong>ing costs (*) 296 296273 Oper<strong>at</strong>ing costs net of the effects of IFRIC 12 128 149 21 16.4559 EBIT 255 259 4 1.6394 Investments 180 157 (23) (12.8)3,589 Net invested capital <strong>at</strong> period end 3,497 3,707 210 6.07,450 Gas distribution (millions of cubic metres) 4,418 4,547 129 2.950,<strong>30</strong>1 Distribution network (kilometres) 50,422 50,500 78 0.25.897 Active meters (millions) 5.873 5.907 0.034 0.6(*) Before consolid<strong>at</strong>ion adjustments.ResultsN<strong>at</strong>ural gas distribution revenue in the first <strong>half</strong> of <strong>2012</strong> amounted to €601 million, a slight increaseof €3 million or +0.5% compared with the first <strong>half</strong> of 2011. Excluding revenue deriving from applic<strong>at</strong>ionof IFRIC 12, distribution revenue recorded an increase of €24 million or 5.6%. This increase was mainlydue to: (i) tariff upd<strong>at</strong>es (+€14 million); and (ii) applic<strong>at</strong>ion of the gradual increase mechanism (+€10million), introduced by the Electricity and Gas Authority with Resolution 79/09 6 .EBIT achieved in the first <strong>half</strong> of <strong>2012</strong> amounted to €259 million, an increase of €4 million or 1.6%compared with the first <strong>half</strong> of 2011. This increase was due essentially to: (i) increased revenue fromn<strong>at</strong>ural gas distribution (+€24 million); (ii) an increase in other revenue and income (+€13 million), dueprincipally to the sale of plants transferred to municipalities conceding n<strong>at</strong>ural gas distribution mand<strong>at</strong>es;(iii) gre<strong>at</strong>er income from technical distribution services (+€4 million) deriving mainly from recognitionof costs rel<strong>at</strong>ing to switch readers 7 . These factors were partly offset by: (i) increased oper<strong>at</strong>ing costs(-€21 million) <strong>at</strong>tributable mainly to gre<strong>at</strong>er alloc<strong>at</strong>ions to provisions for risks and charges (-€6 million)and to higher net charges arising from the management of Energy Efficiency Certific<strong>at</strong>es (-€5 million);and (ii) increased depreci<strong>at</strong>ion, amortis<strong>at</strong>ion and impairment losses (-€14 million), due to the entryinto service of new infrastructure (-€6 million), and recovery of value in the first <strong>half</strong> of 2011 on certainassets impaired during 2010 (-€8 million).6 In particular, with this resolution which amended the tariff criteria in effect under prior Resolution 159/08, the Authorityintroduced a gradual increase in the amortised tariff component for the new regul<strong>at</strong>ory period, which is in addition to th<strong>at</strong>already provided for returns on invested capital.7 The Electricity and Gas Authority’s Resolution ARG/gas 159/08 provided for the introduction of a specific mechanism forstandardising meter reading costs, which produces breakeven costs for businesses taking account of the fact th<strong>at</strong> readingsfrom switch meters will be compulsory but will be provided free of charge.<strong>Snam</strong> Half - <strong>year</strong> Report <strong>2012</strong>
23<strong>Snam</strong> Directors' Report / N<strong>at</strong>ural gas distributionOper<strong>at</strong>ing reviewINVESTMENTsFinancial <strong>year</strong>First <strong>half</strong>2011 (€ million) 2011 <strong>2012</strong> Change % change215 Distribution 102 109 7 6.9171 Network maintenance and development 79 85 6 7.644 Replacement of cast-iron pipes (2% incentive) 23 24 1 4.3144 Metering (8% remuner<strong>at</strong>ion) 66 38 (28) (42.4)35 Other investments 12 10 (2) (16.7)394 180 157 (23) (12.8)Investments in the first <strong>half</strong> of <strong>2012</strong> amounted to €157 million, down €23 million, or 12.8%, comparedwith the first <strong>half</strong> of 2011.Investments in distribution (€109 million) rel<strong>at</strong>ed mainly to renov<strong>at</strong>ing sections of obsolete pipe,including by replacing cast-iron pipes, and by extending and upgrading the distribution network.Investments in metering (€38 million) primarily concerned the meter replacement programme and theremote meter-reading project.Other investments (€10 million) mainly concerned investments in IT, property and vehicles.In addition to investments, business units were acquired in the first <strong>half</strong> of <strong>2012</strong> for €31 million in total.These units rel<strong>at</strong>ed mainly to gas distribution infrastructure in the municipalities of Cernusco sul Naviglioand Sulmona.Distribution networkAt <strong>30</strong> <strong>June</strong> <strong>2012</strong>, the gas distribution network covered 50,500 kilometres (50,<strong>30</strong>1 kilometres <strong>at</strong> 31 December2011). The change by comparison with 31 December 2011 (+199 kilometres) is <strong>at</strong>tributable to:• the sale to another oper<strong>at</strong>or of facilities in the municipality of Rieti, partly absorbed by the start ofmanaging the gas distribution service in the municipality of Cernusco sul Naviglio (MI);• the construction of new networks;• extensions of networks to meet commitments deriving from concession contracts;• requests by end users (households, businesses, etc.) for access to the service.Gas distributionIn the first <strong>half</strong> of <strong>2012</strong>, 4,547 million cubic metres of gas were distributed, an increase of 129 millioncubic metres or 2.9% compared with the same period in 2011.At <strong>30</strong> <strong>June</strong> <strong>2012</strong>, <strong>Snam</strong> held concessions for gas distribution services in 1,449 municipalities (unchangedfrom 31 December 2011), of which 1,338 were in oper<strong>at</strong>ion and 111 were awaiting the completion and/orconstruction of networks. The number of active meters <strong>at</strong> gas redelivery points to end users (households,businesses, etc.) totalled 5.907 million units, compared with 5.897 million units <strong>at</strong> 31 December 2011.In addition, on 29 <strong>June</strong> <strong>2012</strong>, 14 plants owned by the province of Udine were officially transferred to theComunità Collinare del Friuli, to take effect from 1 July <strong>2012</strong>.Distribution concession in the Municipality of Rome CapitalItalgas manages distribution in the Municipality of Rome Capital, whose concession expired on 31December 2009. On 26 September 2011, the call for tenders was published for the n<strong>at</strong>ural gas distributionservice in the region of Rome Capital.<strong>Snam</strong> Half - <strong>year</strong> Report <strong>2012</strong>
<strong>Snam</strong> Directors' Report / N<strong>at</strong>ural gas distribution24Italgas submitted its bid for the contracting of the distribution service in the municipality of RomeCapital on 23 March <strong>2012</strong> and the envelopes were opened and processed in open session on Monday, 26March <strong>2012</strong>. Italgas was the only bidder.After these procedural steps had been taken, Italgas was called by the Municipality of Rome Capital on 18July <strong>2012</strong> to the open session in which the outcome of the assessment by the adjudic<strong>at</strong>ing commissionof the technical tender submitted by the Company was read out. The envelope containing the financialtender was then opened and the rel<strong>at</strong>ive list was drafted.During the session, the adjudic<strong>at</strong>ing commission declared th<strong>at</strong>:- <strong>at</strong> the outcome of the examin<strong>at</strong>ion of the document<strong>at</strong>ion rel<strong>at</strong>ing to the technical offer, Italgasobtained the maximum score set for the call for tenders;- the financial tender met the requirements stipul<strong>at</strong>ed for the call for tenders.Based on these premises, the adjudic<strong>at</strong>ing commission declared th<strong>at</strong> Italgas was the provisional winnerof the contract; the Company is waiting to receive the rel<strong>at</strong>ive measure.Regul<strong>at</strong>ionResolution 2 February 28/<strong>2012</strong>/R/gas – “Review and adjustment of the tariff regul<strong>at</strong>ion of the meteringservice on the n<strong>at</strong>ural gas distribution networks and of the directives for the commissioning of gas meteringgroups, pursuant to the resolution of the Electricity and Gas Authority of 22 October 2008, ARG/gas 155/08”.With this resolution, published on 3 February <strong>2012</strong>, as supplemented and amended by Resolution 18May 193/<strong>2012</strong>/R/gas (“Urgent amendments to the resolution of the Electricity and Gas Authority of 2February <strong>2012</strong>, 28/<strong>2012</strong>/R/gas and launch of the process for review of measures rel<strong>at</strong>ing to standard costsfor the commissioning of gas meters”, published on 18 May <strong>2012</strong>) and by Resolution 14 <strong>June</strong> 246/<strong>2012</strong>/R/gas (“Amendments to the resolution of the Electricity and Gas Authority of 2 February <strong>2012</strong>, 28/<strong>2012</strong>/R/gas, pursuant to the process launched by Resolution 193/<strong>2012</strong>/R/gas of the Authority, for the review ofmeasures rel<strong>at</strong>ing to standard costs of gas meters in the area of distribution”, published on 15 <strong>June</strong> <strong>2012</strong>),the Authority revised and upd<strong>at</strong>ed the tariff regul<strong>at</strong>ions for the metering service for the period 2013-2016 and amended the oblig<strong>at</strong>ions set out in Resolution ARG/gas 155/08 for the introduction of remotereading/monitoring of gas meters.The Authority introduced measures for calcul<strong>at</strong>ing tariffs for metering services using smart meteringsystems for the period 2013-2016.New investments rel<strong>at</strong>ing to groups of electronic metering loc<strong>at</strong>ions will be assessed on the basis ofstandard costs, supplemented by an incentive mechanism of profit and loss-sharing to intercept anydevi<strong>at</strong>ions in the costs actually sustained by oper<strong>at</strong>ors.Furthermore, from 2013:• the tariff component covering the oper<strong>at</strong>ing costs of installing and maintaining metering groups will bedifferenti<strong>at</strong>ed through the definition of a parametric tariff component to cover extra costs connectedto the extension of oblig<strong>at</strong>ions to check converters and a basic tariff component to be applied to allredelivery points;• costs rel<strong>at</strong>ing to the remote reading/management systems will be covered by two separ<strong>at</strong>e componentsof the tariff in question, respectively to cover centralised costs for the remote reading/managementsystem and to cover the costs of the concentr<strong>at</strong>ors;• coverage of residual amortis<strong>at</strong>ion and depreci<strong>at</strong>ion will be recognised in the event of early disposal ofthe meters, carried out only in compliance with the provisions of the Authority, and not in cases whereit is a consequence of a free corpor<strong>at</strong>e choice, or due to time limit on the metric stamp, pursuant toArticle <strong>30</strong>, paragraph 21, of the “Development” Law 99 of 23 July 2009.<strong>Snam</strong> Half - <strong>year</strong> Report <strong>2012</strong>
25<strong>Snam</strong> Directors' Report / N<strong>at</strong>ural gas distributionJudgement 2521/<strong>2012</strong> of the Council of St<strong>at</strong>eWith Judgement 2521/<strong>2012</strong>, the Council of St<strong>at</strong>e issued a definitive ruling on the appeal submitted bythe Authority and by certain oper<strong>at</strong>ors against the judgements of the Lombardy district court, which hadcensored some points of the Gas Distribution Tariff Regul<strong>at</strong>ion (Annex A of Resolution 159/08).With regard to the points subject to censorship by the Lombardy district court, the judgement insummary confirmed:• the illegitimacy of applying the gradual increase principle to upd<strong>at</strong>e net capital invested based on acriterion applied <strong>at</strong> n<strong>at</strong>ional level;• the illegitimacy of a constant productivity recovery value (X factor) during the regul<strong>at</strong>ory period.To comply with the Council of St<strong>at</strong>e judgement, the Authority:• launched a process, with Resolution 14 <strong>June</strong> <strong>2012</strong> 247/<strong>2012</strong>/R/gas, to adopt amendments to theregul<strong>at</strong>ion of tariffs for gas distribution and metering services for the regul<strong>at</strong>ory period 2009-<strong>2012</strong>;• with Consult<strong>at</strong>ion Document 248/<strong>2012</strong>/R/gas of 14 <strong>June</strong> <strong>2012</strong>, explained its own guidelines fordefining procedures for calcul<strong>at</strong>ing the programmed productivity recovery r<strong>at</strong>e (X factor) to be appliedin regul<strong>at</strong>ory period 2009-<strong>2012</strong>. The Authority also specified th<strong>at</strong> it would recalcul<strong>at</strong>e the tariffs inquestion for the <strong>year</strong>s 2009 and 2010; the tariffs for 2011 and <strong>2012</strong> will be defined by October, ingood time to determine the equalis<strong>at</strong>ion balances for 2011.Decree Law 83 of 22 <strong>June</strong> <strong>2012</strong> – Urgent measures for n<strong>at</strong>ional growthDecree Law 83 of 22 <strong>June</strong> <strong>2012</strong> was published in the Official Gazette of 26 <strong>June</strong> <strong>2012</strong>, rel<strong>at</strong>ing to“Urgent measures for n<strong>at</strong>ional growth”, Article 37 of which (“Rules of n<strong>at</strong>ural gas distribution tenderprocedures”) clarifies the parties th<strong>at</strong> are permitted to take part in tenders for regional areas. Specifically,it stipul<strong>at</strong>es th<strong>at</strong> parties already holding gas distribution mand<strong>at</strong>es or concessions may take part infirst tender procedures for regional areas, following the transition period, across the entire country andwithout regional limit<strong>at</strong>ions. Parties directly mand<strong>at</strong>ed only for local public services th<strong>at</strong> are “different”from n<strong>at</strong>ural gas distribution are also permitted to take part.<strong>Snam</strong> Half - <strong>year</strong> Report <strong>2012</strong>
Financial review
27 <strong>Snam</strong> Directors' Report / Financial reviewFinancial reviewIncome st<strong>at</strong>ementFinancial <strong>year</strong>First <strong>half</strong>2011 (€ million) 2011 <strong>2012</strong> Change % change3,539 Core business revenue 1,744 1,791 47 2.766 Other revenue and income 18 72 543,605 Total revenue 1,762 1,863 101 5.73,245 Total revenue net of the effects of IFRIC 12 (*) 1,594 1,716 122 7.7(993) Oper<strong>at</strong>ing costs (462) (505) (43) 9.3(633) Oper<strong>at</strong>ing costs net of the effects of IFRIC 12 (*) (294) (358) (64) 21.82,612 EBITDA 1,<strong>30</strong>0 1,358 58 4.5(654) Depreci<strong>at</strong>ion, amortis<strong>at</strong>ion and impairment losses (314) (345) (31) 9.91,958 EBIT 986 1,013 27 2.7(313) Net financial expense (145) (167) (22) 15.251 Income (expense) from equity investments 28 24 (4) (14.3)1,696 Profit before taxes 869 870 1 0.1(906) Income taxes (293) (362) (69) 23.5790 Net profit (**) 576 508 (68) (11.8)978 Adjusted net profit 576 508 (68) (11.8)(*) The applic<strong>at</strong>ion of intern<strong>at</strong>ional accounting standard IFRIC 12 “Agreements for service concession arrangements”, in force from 1 January 2010, has not had any effect on the consolid<strong>at</strong>edresults, except for the recording, in equal measure, of revenue and costs rel<strong>at</strong>ed to the construction and upgrading of distribution infrastructure (€168 million and €147 million, respectively,in the first <strong>half</strong> of 2011 and first <strong>half</strong> of <strong>2012</strong>).(**) Net profit is <strong>at</strong>tributable to <strong>Snam</strong>.Net profitNet profit for the first <strong>half</strong> of <strong>2012</strong> came in <strong>at</strong> €508 million, down €68 million, or 11.8%, on the first<strong>half</strong> of 2011. The decrease was due to higher income tax (-€69 million) resulting from higher fiscalcharges due to applic<strong>at</strong>ion of additional IRES (the “Robin Hood Tax”, in force from 13 August 2011) tothe n<strong>at</strong>ural gas transport<strong>at</strong>ion and distribution segments (-€76 million, including €81 million in highercurrent taxes and €5 million in lower deferred taxes). An increase in net financial expense (-€22 million)also contributed to the decrease, mainly due to the rise in the average cost of debt for the period (3.23%,compared with 3.0% in the first <strong>half</strong> of 2011) and higher average debt in the period.<strong>Snam</strong> Half - <strong>year</strong> Report <strong>2012</strong>
<strong>Snam</strong> Directors' Report / Financial review28Analysis of income st<strong>at</strong>ement itemsTotal revenueFinancial <strong>year</strong>First <strong>half</strong>2011 (€ million) 2011 <strong>2012</strong> Change % change3,539 Core business revenue 1,744 1,791 47 2.7Business segments1,945 Transport<strong>at</strong>ion 970 961 (9) (0.9)34 Regasific<strong>at</strong>ion 17 17372 Storage 192 220 28 14.61,297 Distribution 614 619 5 0.8360 - of which effects of IFRIC 12 168 147 (21) (12.5)Corpor<strong>at</strong>e 80 80(109) Consolid<strong>at</strong>ion adjustments (49) (106) (57)66 Other revenue and income 18 72 543,605 Total revenue 1,762 1,863 101 5.7Core business revenue recorded in the first <strong>half</strong> of <strong>2012</strong> (€1,791 million) increased by €47 million,or 2.7%, compared with the first <strong>half</strong> of 2011, and by €68 million, or 4.3%, excluding the effects of theapplic<strong>at</strong>ion of IFRIC 12. The increase was due to higher regul<strong>at</strong>ed revenue across all the main businesssegments.Revenue from the transport<strong>at</strong>ion segment 8 (€961 million) mainly rel<strong>at</strong>es to amounts paid for n<strong>at</strong>uralgas transport<strong>at</strong>ion services (€954 million) and decreased slightly, by €9 million, compared with thefirst <strong>half</strong> of 2011. The increase in transport<strong>at</strong>ion revenue (+€19 million) was partly absorbed by lowerrevenue arising from the recharging to Group companies of costs sustained for services rendered until 31December 2011 by <strong>Snam</strong> Rete Gas (-€29 million). Note th<strong>at</strong>, from 1 January <strong>2012</strong>, with the entry intoforce of the Group’s new ownership structure, these services are carried out by parent company <strong>Snam</strong>and, therefore, the revenue and rel<strong>at</strong>ive costs arising from management of these activities are <strong>at</strong>tributedto the “Corpor<strong>at</strong>e” segment.Revenue from the regasific<strong>at</strong>ion segment totalled €17 million, unchanged from the first <strong>half</strong> of 2011.This concerns LNG regasific<strong>at</strong>ion revenue (€11 million) and the chargeback of the transport<strong>at</strong>ion serviceprovided by <strong>Snam</strong> Rete Gas (€6 million).Storage revenue of €220 million mainly consists of payment for storage services, of which €184 millionand €31 million rel<strong>at</strong>e to modul<strong>at</strong>ion storage and str<strong>at</strong>egic storage respectively.Revenue from the distribution segment of €619 million mainly rel<strong>at</strong>es to payment for the n<strong>at</strong>ural gasdistribution service (€454 million) and revenue gener<strong>at</strong>ed during the construction and upgrading ofdistribution infrastructure used to provide the service (€147 million).8 Core business revenue by business segment is <strong>report</strong>ed before consolid<strong>at</strong>ion adjustments.<strong>Snam</strong> Half - <strong>year</strong> Report <strong>2012</strong>
29 <strong>Snam</strong> Directors' Report / Financial reviewTotal revenue – Regul<strong>at</strong>ed and non-regul<strong>at</strong>ed activitiesFinancial <strong>year</strong>First <strong>half</strong>2011 (€ million) 2011 <strong>2012</strong> Change % change3,522 Regul<strong>at</strong>ed business revenue 1,7<strong>30</strong> 1,827 97 5.61,870 Transport<strong>at</strong>ion 935 1,000 65 7.023 Regasific<strong>at</strong>ion 12 11 (1) (8.3)338 Storage 175 195 20 11.41,291 Distribution 608 621 13 2.1360 - of which effects of IFRIC 12 168 147 (21) (12.5)83 Revenue from non-regul<strong>at</strong>ed activities 32 36 4 12.53,605 1,762 1,863 101 5.7Regul<strong>at</strong>ed business revenue (€1,827 million, net of consolid<strong>at</strong>ion adjustments) rel<strong>at</strong>es to transport<strong>at</strong>ion 9(€1,000 million), distribution (€621 million), storage (€195 million) and regasific<strong>at</strong>ion (€11 million).Revenue from non-regul<strong>at</strong>ed activities (€36 million, net of consolid<strong>at</strong>ion adjustments) mainlycomprises: (i) capital gains from asset disposals (€6 million); (ii) income from rental and maintenance offibre optic telecommunic<strong>at</strong>ion cables (€5 million); (iii) income from property investments (€2 million);and (iv) other income from miscellaneous oper<strong>at</strong>ions (€7 million).Oper<strong>at</strong>ing costsFinancial <strong>year</strong>First <strong>half</strong>2011 (€ million) 2011 <strong>2012</strong> Change % changeBusiness segments387 Transport<strong>at</strong>ion 176 198 22 12.523 Regasific<strong>at</strong>ion 12 14 2 16.764 Storage 29 <strong>30</strong> 1 3.4633 Distribution 296 296360 - of which effects of IFRIC 12 168 147 (21) (12.5)Corpor<strong>at</strong>e 75 75(114) Consolid<strong>at</strong>ion adjustments (51) (108) (57)993 462 505 43 9.39 This includes revenue from the balancing business, oper<strong>at</strong>ional from 1 December 2011 pursuant to Resolution ARG/gas 45/11 ofthe Electricity and Gas Authority. Revenue refers to sales of n<strong>at</strong>ural gas carried out for the purposes of balancing the gas systemand corresponds to oper<strong>at</strong>ing costs connected to withdrawals of gas from storage<strong>Snam</strong> Half - <strong>year</strong> Report <strong>2012</strong>
<strong>Snam</strong> Directors' Report / Financial review<strong>30</strong>Oper<strong>at</strong>ing costs – Regul<strong>at</strong>ed and non-regul<strong>at</strong>ed activitiesFinancial <strong>year</strong>First <strong>half</strong>2011 (€ million) 2011 <strong>2012</strong> Change % change967 Regul<strong>at</strong>ed business costs 449 479 <strong>30</strong> 6.7456 Controllable fixed costs 216 2<strong>30</strong> 14 6.518 Variable costs 8 54 46493 Other costs 225 195 (<strong>30</strong>) (13.3)360 - of which effects of IFRIC 12 168 147 (21) (12.5)26 Non-regul<strong>at</strong>ed business costs 13 26 13 100.0993 462 505 43 9.3Oper<strong>at</strong>ing costs (€505 million) increased by €43 million, or 9.3%, compared with the first <strong>half</strong> of 2011.Excluding the effects of IFRIC 12, oper<strong>at</strong>ing costs increased by €64 million, or 21.8%, compared with thefirst <strong>half</strong> of 2011. The increase mainly reflected costs arising from the balancing business carried out by<strong>Snam</strong> Rete Gas S.p.A. and increased net alloc<strong>at</strong>ions to provisions for risks and charges.The following table shows the workforce in service <strong>at</strong> <strong>30</strong> <strong>June</strong> <strong>2012</strong> (6,056 people) by business segmentand professional st<strong>at</strong>us.Financial <strong>year</strong>First <strong>half</strong>2011 (number) 2011 <strong>2012</strong> Change % changeBusiness segments2,755 Transport<strong>at</strong>ion 2,587 1,979 (608) (23.5)74 Regasific<strong>at</strong>ion 69 75 6 8.7278 Storage 283 295 12 4.23,005 Distribution 3,078 3,037 (41) (1.3)Corpor<strong>at</strong>e 670 6706,112 6,017 6,056 39 0.6Financial <strong>year</strong>First <strong>half</strong>2011 (number) 2011 <strong>2012</strong> Change % changeProfessional st<strong>at</strong>us118 Executives 116 115 (1) (0.9)544 Managers 505 551 46 9.13,277 Office workers 3,186 3,250 64 2.02,173 Manual workers 2,210 2,140 (70) (3.2)6,112 6,017 6,056 39 0.6The increase of 39 units in the number of personnel in service compared with the first <strong>half</strong> of 2011was mainly due to: (i) acquisitions of business units from Eni, specifically the Eni Adfin unit active inaccounting and administr<strong>at</strong>ion and the Eni unit active in ICT services; and (ii) hiring of personnel on themarket. These factors were partly absorbed by personnel departures.<strong>Snam</strong> Half - <strong>year</strong> Report <strong>2012</strong>
31 <strong>Snam</strong> Directors' Report / Financial reviewDepreci<strong>at</strong>ion, amortis<strong>at</strong>ion and impairment lossesFinancial <strong>year</strong>First <strong>half</strong>2011 (€ million) 2011 <strong>2012</strong> Change % change663 Amortis<strong>at</strong>ion and depreci<strong>at</strong>ion 322 345 23 7.1Business segments435 Transport<strong>at</strong>ion 214 224 10 4.75 Regasific<strong>at</strong>ion 2 256 Storage 25 31 6 24.0167 Distribution 81 87 6 7.4Corpor<strong>at</strong>e 1(9) Impairment losses (Recovery of value) (8) 8 (100.0)654 314 345 31 9.9Depreci<strong>at</strong>ion, amortis<strong>at</strong>ion and impairment losses (€345 million) increased by €31 million comparedwith the first <strong>half</strong> of 2011, due to: (i) increased amortis<strong>at</strong>ion and depreci<strong>at</strong>ion (+€23 million) registeredacross all the key business segments, due to the entry into service of new infrastructure; (ii) recovery ofvalue, in the first <strong>half</strong> of 2011, on some of the assets th<strong>at</strong> had been impaired during 2010 (+€8 million).EBITFinancial <strong>year</strong>First <strong>half</strong>2011 (€ million) 2011 <strong>2012</strong> Change % changeBusiness segments1,137 Transport<strong>at</strong>ion 588 589 1 0.27 Regasific<strong>at</strong>ion 4 2 (2) (50.0)255 Storage 139 159 20 14.4559 Distribution 255 259 4 1.6Corpor<strong>at</strong>e 4 41,958 986 1,013 27 2.7EBIT came in <strong>at</strong> €1,013 million in the first <strong>half</strong> of <strong>2012</strong>, up €27 million, or 2.7%, on the first <strong>half</strong> of2011. The increase in EBIT mainly reflected the performance achieved by the n<strong>at</strong>ural gas storage segment(+€20 million, or +14.4%) and the n<strong>at</strong>ural gas distribution segment (+€4 million, or +1.6%). EBITgener<strong>at</strong>ed by n<strong>at</strong>ural gas transport<strong>at</strong>ion (+€1 million, or +0.2%) was largely unchanged compared withthe first <strong>half</strong> of 2011.Analysis of EBIT by business segment is provided in the section “Trends in the segments of oper<strong>at</strong>ion” inthis Report.<strong>Snam</strong> Half - <strong>year</strong> Report <strong>2012</strong>
<strong>Snam</strong> Directors' Report / Financial review32Net financial expenseFinancial <strong>year</strong>First <strong>half</strong>2011 (€ million) 2011 <strong>2012</strong> Change % change262 Financial expense rel<strong>at</strong>ed to net financial debt 118 134 16 13.6262 - Charges on short- and long-term financial debt 118 134 16 13.669 Losses (Gains) on deriv<strong>at</strong>ive contracts 40 43 3 7.569 - Difference in interest accrued in the period 40 43 3 7.519 Other net financial expense 7 712 - Accretion discount 5 7 2 40.07 - Other net financial (income) expense 2 (2) (100.0)(37) Financial expense capitalised (20) (17) 3 (15.0)313 145 167 22 15.2Net financial expense (€167 million) rose by €22 million compared with the first <strong>half</strong> of 2011 due tothe higher average cost of borrowing, which increased from 3.0% in the first <strong>half</strong> of 2011 to 3.23% in thecorresponding period of <strong>2012</strong>, and to higher average debt for the period.Financial expense of €17 million was capitalised in the first <strong>half</strong> of <strong>2012</strong>, compared to €20 million inthe first <strong>half</strong> of 2011.Income from equity investmentsFinancial <strong>year</strong>First <strong>half</strong>2011 (€ million) 2011 <strong>2012</strong> Change % change45 Equity method valu<strong>at</strong>ion effect 28 24 (4) (14.3)4 Capital gains from sale of equity investments2 Net other income (expense)51 28 24 (4) (14.3)Income from equity investments (€24 million) concerns the portion of net profit for the period ofequity-accounted investments in the n<strong>at</strong>ural gas distribution sector. These mainly comprise associ<strong>at</strong>esAzienda Energia e Servizi Torino S.p.A. (€15 million; €16 million in the first <strong>half</strong> of 2011) and ToscanaEnergia S.p.A. (€8 million; €10 million in the first <strong>half</strong> of 2011).<strong>Snam</strong> Half - <strong>year</strong> Report <strong>2012</strong>
33 <strong>Snam</strong> Directors' Report / Financial reviewIncome taxesFinancial <strong>year</strong>First <strong>half</strong>2011 (€ million) 2011 <strong>2012</strong> Change % change786 Current taxes 368 395 27 7.3(Prepaid) deferred taxes(79) Deferred taxes (<strong>30</strong>) (37) (7) 23.311 Prepaid taxes (45) 4 49(68) (75) (33) 42 (56.0)188 Deferred tax adjustment <strong>at</strong> 31 December 2010 (special item)53.4 Tax r<strong>at</strong>e (%) 33.7 41.6 7.9906 293 362 69 23.5Income tax (€362 million) increased by €69 million, due mainly to higher charges arising from the applic<strong>at</strong>ionof additional IRES (“Robin Hood Tax”) to the n<strong>at</strong>ural gas transport<strong>at</strong>ion and distribution segments (€76 million,including €81 million in higher current taxes and €5 million in lower deferred taxes).The introduction of the Robin Hood Tax has led to a significant increase in the consolid<strong>at</strong>ed tax r<strong>at</strong>e,which stands <strong>at</strong> 41.6% (33.7% in the first <strong>half</strong> of 2011).<strong>Snam</strong> Half - <strong>year</strong> Report <strong>2012</strong>
<strong>Snam</strong> Directors' Report / Financial review34Reclassified consolid<strong>at</strong>ed balance sheetThe reclassified consolid<strong>at</strong>ed balance sheet combines the assets and liabilities of the compulsory form<strong>at</strong>included in the annual <strong>report</strong> and the <strong>half</strong>-<strong>year</strong> <strong>report</strong> based on how the business oper<strong>at</strong>es, usually splitinto the three basic functions of investment, oper<strong>at</strong>ions and financing.Management believes th<strong>at</strong> this form<strong>at</strong> presents useful additional inform<strong>at</strong>ion for investors as it allowsidentific<strong>at</strong>ion of the sources of financing (equity and third-party funds) and the applic<strong>at</strong>ion of such fundsfor fixed and working capital.The reclassified consolid<strong>at</strong>ed balance sheet form<strong>at</strong> is used by management to calcul<strong>at</strong>e the key leverageand profitability (ROI and ROE) r<strong>at</strong>ios.Reclassified consolid<strong>at</strong>ed balance sheet (*)(€ million) 31.12.2011 <strong>30</strong>.06.<strong>2012</strong> ChangeFixed capital 18,778 19,185 407Property, plant and equipment 14,053 14,234 181Compulsory inventories 405 405Intangible assets 4,444 4,493 49Equity investments 319 310 (9)Financial receivables held for oper<strong>at</strong>ions 2 2Net payables for investments (445) (259) 186Net working capital (1,698) (1,560) 138Provisions for employee benefits (107) (108) (1)Assets held for sale and directly rel<strong>at</strong>ed liabilities 16 12 (4)NET INVESTED CAPITAL 16,989 17,529 540Shareholders’ equity (including minority interests)- <strong>at</strong>tributable to <strong>Snam</strong> 5,791 5,794 3- <strong>at</strong>tributable to minority interests 1 15,792 5,795 3Net financial debt 11,197 11,734 537COVERAGE 16,989 17,529 540(*) For the reconcili<strong>at</strong>ion of the reclassified consolid<strong>at</strong>ed balance sheets with the compulsory form<strong>at</strong>, please see the paragraph “Reconcili<strong>at</strong>ion of the reclassified consolid<strong>at</strong>ed financial st<strong>at</strong>ementswith the compulsory form<strong>at</strong>s” below.<strong>Snam</strong> Half - <strong>year</strong> Report <strong>2012</strong>
35 <strong>Snam</strong> Directors' Report / Financial reviewFixed capital (€19,185 million) rose by €407 million compared with 31 December 2011, due essentiallyto the reduction in net payables for investments (+€186 million), rel<strong>at</strong>ed mainly to payment trends, andto the increase in property, plant and equipment and intangible assets (+€2<strong>30</strong> million).Changes in property, plant and equipment (€181 million) and intangible assets (+€49 million) areanalysed below:(€ million)Property, plantand equipmentActivityassetsBalance <strong>at</strong> 31 December 2011 14,053 4,444 18,497Investments 356 168 524Depreci<strong>at</strong>ion, amortis<strong>at</strong>ion and impairment losses (255) (90) (345)Transfers, elimin<strong>at</strong>ions and divestments (3) (24) (27)Other changes 83 (5) 78Balance <strong>at</strong> <strong>30</strong> <strong>June</strong> <strong>2012</strong> 14,234 4,493 18,727TotalOther changes (+€78 million) rel<strong>at</strong>e essentially to: (i) the effect of adjustment of the present value ofdisbursements for estim<strong>at</strong>ed charges for the dismantling and restor<strong>at</strong>ion of storage sites (+€63 million),mainly due to the reduction in expected discount r<strong>at</strong>es; and (ii) the purchase of business units (+€31million) in the distribution segment. These factors were partially offset by contribution collections forthe period (€38 million).Equity investmentsThe equity investments item (€310 million) includes the valu<strong>at</strong>ion of equity investments using theequity method and refers in particular to the companies Toscana Energia S.p.A. (€153 million), AziendaEnergia e Servizi Torino S.p.A. (€104 million) and ACAM Gas S.p.A. (€47 million).Net working capital(€ million) 31.12.2011 <strong>30</strong>.06.<strong>2012</strong> ChangeTrade receivables 1,367 1,798 431Inventories 235 240 5Tax receivables 47 124 77Other assets 133 231 98Deferred tax liabilities (901) (851) 50Trade payables (556) (777) (221)Provisions for risks and charges (527) (614) (87)Prepaid income from regul<strong>at</strong>ed activities (358) (368) (10)Deriv<strong>at</strong>ives (266) (324) (58)Tax payables (2<strong>30</strong>) (315) (85)Other liabilities (642) (704) (62)(1,698) (1,560) 138Net working capital (-€1,560 million) increased by €138 million compared with the previous <strong>year</strong>, owingmainly to: (i) an increase in trade receivables (+€431 million) rel<strong>at</strong>ing to the n<strong>at</strong>ural gas transport<strong>at</strong>ion<strong>Snam</strong> Half - <strong>year</strong> Report <strong>2012</strong>
<strong>Snam</strong> Directors' Report / Financial review36segment (+€483 million), due mainly to receivables arising from the balancing service 10 , partly offset bya decrease in receivables in the distribution segment (-€91 million) due mainly to the we<strong>at</strong>her; and (ii)an increase in other assets (€98 million), due mainly to increased receivables in respect of the ElectricityEqualis<strong>at</strong>ion Fund rel<strong>at</strong>ing to n<strong>at</strong>ural gas distribution (+€83 million) and to gre<strong>at</strong>er deferred charges 11owed by parent company <strong>Snam</strong> S.p.A. to its financing banks for debt refinancing (+€35 million).These factors were partly offset by: (i) an increase in trade payables (-€221 million), primarily due to then<strong>at</strong>ural gas transport<strong>at</strong>ion segment (-€211 million), due mainly to payables arising from the balancingservice; (ii) the increase in provisions for risks and charges (-€87 million), due mainly to the change inestim<strong>at</strong>ed charges for dismantling and restoring storage sites (-€63 million) owing to lower expecteddiscount r<strong>at</strong>es; (iii) an increase in other liabilities (-€62 million), mainly due to effects arising from thegas paid in kind by users of the n<strong>at</strong>ural gas transport<strong>at</strong>ion service (-€31 million) and advance paymentsreceived for the disposal of n<strong>at</strong>ural gas distribution plants (-€20 million); and (iv) the decrease in themarket value of deriv<strong>at</strong>ive financial instruments (-€58 million) mainly due to the expected reduction inmarket interest r<strong>at</strong>es.Assets held for sale and directly rel<strong>at</strong>ed liabilitiesAssets held for sale and directly rel<strong>at</strong>ed liabilities of €12 million were down €4 million compared with31 December 2011. The change was principally due to: (i) the reclassific<strong>at</strong>ion of net book value (-€16million, excluding environmental provisions rel<strong>at</strong>ing to charges for reclam<strong>at</strong>ion) to the items “Property,plant and equipment” (-€25 million) and “Provisions for risks and charges” (+€9 million); (ii) thereclassific<strong>at</strong>ion of the net book value (+€10 million) of n<strong>at</strong>ural gas distribution plants in the region ofComunità Collinare del Friuli, for which was signed, with effect from 1 July <strong>2012</strong>, a contract of sale to thesuccessor contractor th<strong>at</strong> won the call for tenders, pursuant to Legisl<strong>at</strong>ive Decree 164/2000.10 With effect from 1 December 2011, n<strong>at</strong>ural gas balancing activities became oper<strong>at</strong>ional pursuant to Resolution ARG/gas 45/11of the Electricity and Gas Authority, which made <strong>Snam</strong> Rete Gas, as the major transmission system oper<strong>at</strong>or (TSO), responsiblefor this service. This role gives <strong>Snam</strong> Rete Gas an oblig<strong>at</strong>ion to acquire, according to criteria of financial merit, the resourcesnecessary to guarantee the safe and efficient movement of gas from entry points to withdrawal points, in order to maintain theconstant equilibrium of the network, procure the necessary storage resources for covering imbalances for individual users, andadjust the relevant income st<strong>at</strong>ement entries. Note th<strong>at</strong> the current regul<strong>at</strong>ions contain specific clauses to ensure the neutralityof the Head of Balancing. For further inform<strong>at</strong>ion, see Note 4, “Trade receivables and other receivables”, to the condensedinterim consolid<strong>at</strong>ed financial st<strong>at</strong>ements.11 Up-front fees and substitute tax are to be regarded as “transaction costs” pursuant to IAS 39; the rel<strong>at</strong>ive charges are spread overthe (expected) life of the financial instrument.<strong>Snam</strong> Half - <strong>year</strong> Report <strong>2012</strong>
37 <strong>Snam</strong> Directors' Report / Financial reviewSt<strong>at</strong>ement of comprehensive income(€ million) First <strong>half</strong> 2011 First <strong>half</strong> <strong>2012</strong>Net profit 576 508Other components of comprehensive incomeChange in fair value of cash flow hedge deriv<strong>at</strong>ives (effective share) 6 (54)Tax effects of the other components of comprehensive income (1) 17Total other components of comprehensive income, net of tax effect 5 (37)Total comprehensive income 581 471<strong>at</strong>tributable to:- <strong>Snam</strong> 581 471- Minority shareholders581 471Shareholders’ equity(€ million)Shareholders’ equity <strong>at</strong> 31 December 2011 5,792Increases owing to:- Comprehensive income for <strong>2012</strong> 471- Other changes 5476Decreases owing to:- Distribution of balance of 2011 dividend (473)(473)Shareholders’ equity including minority interests <strong>at</strong> <strong>30</strong> <strong>June</strong> <strong>2012</strong> 5,795<strong>at</strong>tributable to:- <strong>Snam</strong> 5,794- Minority shareholders 15,795Other changes (+€5 million) rel<strong>at</strong>e to asset equalis<strong>at</strong>ion in favour of <strong>Snam</strong> under price adjustmentmechanisms set out in Eni’s purchase agreement for Italgas. Specifically, the equalis<strong>at</strong>ion rel<strong>at</strong>es toestim<strong>at</strong>ed liabilities already existing <strong>at</strong> the d<strong>at</strong>e of completion of the Italgas purchase agreement.At <strong>30</strong> <strong>June</strong> <strong>2012</strong>, <strong>Snam</strong> had a total of 192,553,051 treasury shares (unchanged from 31 December 2011),equivalent to 5.39% of its share capital. Their market value <strong>at</strong> <strong>30</strong> <strong>June</strong> <strong>2012</strong> was €678 million 12 . At thisd<strong>at</strong>e, 3,003,351 shares were alloc<strong>at</strong>ed to the 2005, 2006, 2007 and 2008 stock option plans for a bookvalue of €12,384,245.12 Calcul<strong>at</strong>ed by multiplying the number of treasury shares by the period-end official price of €3.52 per share.<strong>Snam</strong> Half - <strong>year</strong> Report <strong>2012</strong>
<strong>Snam</strong> Directors' Report / Financial review38On 4 <strong>June</strong> <strong>2012</strong>, the Board of Directors of <strong>Snam</strong> S.p.A. convened the Extraordinary Shareholders’ Meetingfor <strong>30</strong> and 31 July and 1 August <strong>2012</strong>, in first, second and third call respectively, to resolve upon theproposed cancell<strong>at</strong>ion of treasury shares in the portfolio, after elimin<strong>at</strong>ion of the par value of the shares inissue and consequent amendments to the Articles of Associ<strong>at</strong>ion.The Extraordinary Shareholders’ Meeting held on <strong>30</strong> July approved the Board of Directors’ proposals.Net financial debt(€ million) 31.12.2011 <strong>30</strong>.06.<strong>2012</strong> ChangeFinancial liabilities 11,199 11,750 551Short-term financial liabilities 2,787 3,044 257Current share of long-term financial liabilities 1,612 406 (1,206)Long-term financial liabilities 6,800 8,<strong>30</strong>0 1,500Financial receivables and cash and cash equivalents (2) (16) (14)Cash and cash equivalents (2) (16) (14)11,197 11,734 537Net financial debt <strong>at</strong> <strong>30</strong> <strong>June</strong> <strong>2012</strong> amounted to €11,734 million (€11,197 <strong>at</strong> 31 December 2011).The net cash flow from oper<strong>at</strong>ions (€614 million) allowed us to cover almost entirely the financialrequirements associ<strong>at</strong>ed with net investments for the period of €678 million. The increase in net financialdebt, following the payment of the balance of the 2011 dividend to shareholders of €473 million, was€537 million.Long-term financial liabilities of €8,<strong>30</strong>0 million make up approxim<strong>at</strong>ely 71% of financial debt (61% <strong>at</strong>31 December 2011) and have an average dur<strong>at</strong>ion of 3.7 <strong>year</strong>s.The breakdown of debt by type of interest r<strong>at</strong>e <strong>at</strong> <strong>30</strong> <strong>June</strong> <strong>2012</strong> is as follows:(€ million) 31.12.2011 % <strong>30</strong>.06.<strong>2012</strong> % ChangeFlo<strong>at</strong>ing r<strong>at</strong>e 2,587 23 4,344 37 1,757Fixed r<strong>at</strong>e 8,612 77 7,406 63 (1,206)11,199 100 11,750 100 551Financial liabilities reflect payables to Eni (€10,238 million, accounting for 87%) and payables to thirdpartylenders (€1,512 million, amounting to 13%) and are entirely denomin<strong>at</strong>ed in euro.Specifically, payables to other lenders rel<strong>at</strong>e to the disbursement of two tranches of a flo<strong>at</strong>ing-r<strong>at</strong>erevolving credit line falling due on 31 July 2016, for respective amounts of €1,000 million and €500million. The loan of €500 million was converted into a fixed-r<strong>at</strong>e loan via an existing IRS (interest r<strong>at</strong>eswap) contract. This transaction is part of the general debt refinancing plan established by <strong>Snam</strong> 13 .Flo<strong>at</strong>ing-r<strong>at</strong>e liabilities (€4,344 million) show an increase of €1,757 million due to the disbursement ofa tranche of the credit line (+€1,000 million) and the change in the flo<strong>at</strong>ing-r<strong>at</strong>e debt contracted withEni (+€757 million).13 More inform<strong>at</strong>ion on <strong>Snam</strong>’s debt refinancing oper<strong>at</strong>ion is provided on page 8 of this Report.<strong>Snam</strong> Half - <strong>year</strong> Report <strong>2012</strong>
39 <strong>Snam</strong> Directors' Report / Financial reviewFixed-r<strong>at</strong>e financial liabilities (€7,406 million) show a decrease of €1,206 million, chiefly due to the netbalance between repayments in the period (-€1,700 million) of existing loans with parent company Enifalling due, and the disbursement of a tranche of the credit line (+€500 million).Fixed-r<strong>at</strong>e financial liabilities <strong>at</strong> <strong>30</strong> <strong>June</strong> <strong>2012</strong> include 13 loans <strong>at</strong> a flo<strong>at</strong>ing r<strong>at</strong>e converted into fixed-r<strong>at</strong>eloans through IRSs for an overall notional amount of €5,735 million.There were no breaches of loan agreements <strong>at</strong> the <strong>report</strong>ing d<strong>at</strong>e.CovenantsInform<strong>at</strong>ion on covenants in rel<strong>at</strong>ion to financial debt <strong>at</strong> <strong>30</strong> <strong>June</strong> <strong>2012</strong> is provided in Note 16 - “Longtermfinancial liabilities and short-term portion of long-term liabilities” - of the Notes to the condensedinterim consolid<strong>at</strong>ed financial st<strong>at</strong>ements.<strong>Snam</strong> Half - <strong>year</strong> Report <strong>2012</strong>
<strong>Snam</strong> Directors' Report / Financial review40Reclassified consolid<strong>at</strong>ed st<strong>at</strong>ement of cash flowsThe reclassified consolid<strong>at</strong>ed st<strong>at</strong>ement of cash flows set out below summarises the legally requiredform<strong>at</strong>. It shows the connection between the opening and closing cash and cash equivalents and thechange in net financial debt during the period. The two st<strong>at</strong>ements are reconciled through the free cashflow, i.e. the cash surplus or deficit left over after servicing capital expenditure. The free cash flow closeseither: (i) with the change in cash for the period, after adding/deducting all cash flows rel<strong>at</strong>ed to financialliabilities/assets (taking out/repaying financial receivables/payables) and equity (payment of dividends/capital injections); or (ii) with the change in net financial debt for the period, after adding/deducting thedebt flows rel<strong>at</strong>ed to equity (payment of dividends/capital injections).Reclassified consolid<strong>at</strong>ed st<strong>at</strong>ement of cash flows (*)(€ million) First <strong>half</strong> 2011 First <strong>half</strong> <strong>2012</strong>Net profit 576 508Adjusted by:- Amortis<strong>at</strong>ion, depreci<strong>at</strong>ion and other non-monetary components 279 322- Net capital losses on asset sales and elimin<strong>at</strong>ions 6- Interest and income taxes 432 521Change in working capital due to oper<strong>at</strong>ing activities 16 (189)Dividends, interest and income taxes collected (paid) (435) (548)Net cash flows from oper<strong>at</strong>ing activities 874 614Investments (658) (493)Change in consolid<strong>at</strong>ion scope and business units 9 (26)Divestments 5 27Other changes rel<strong>at</strong>ing to investment activities (152) (186)Free cash flow 78 (64)Changes in short- and long-term financial debt 385 551Equity cash flows (468) (473)(5) 14(*) For the reconcili<strong>at</strong>ion of the reclassified consolid<strong>at</strong>ed st<strong>at</strong>ement of cash flows with the compulsory form<strong>at</strong>s, please see the paragraph “Reconcili<strong>at</strong>ion of the reclassified consolid<strong>at</strong>ed financialst<strong>at</strong>ements with the compulsory form<strong>at</strong>s” below.Change in net financial debt(€ million) First <strong>half</strong> 2011 First <strong>half</strong> <strong>2012</strong>Free cash flow 78 (64)Equity cash flows (468) (473)Change in net financial debt (390) (537)<strong>Snam</strong> Half - <strong>year</strong> Report <strong>2012</strong>
41 <strong>Snam</strong> Directors' Report / Financial reviewReconcili<strong>at</strong>ion of the reclassified consolid<strong>at</strong>ed financial st<strong>at</strong>ements with the compulsory form<strong>at</strong>sReclassified consolid<strong>at</strong>ed balance sheet(€ million)Reclassified consolid<strong>at</strong>ed balance sheet items 31.12.2011 <strong>30</strong>.06.<strong>2012</strong>(Where not expressly st<strong>at</strong>ed, the component is taken directly fromReference to notes to Partial amount Amount from Partial amount Amount fromconsolid<strong>at</strong>ed financial from legally reclassified from legally reclassifiedthe legally required form<strong>at</strong>)st<strong>at</strong>ements required form<strong>at</strong> form<strong>at</strong> required form<strong>at</strong> form<strong>at</strong>Fixed capitalProperty, plant and equipment 14,053 14,234Compulsory inventories 405 405Intangible assets 4.444 4,493Equity investments 319 310Financial receivables held for oper<strong>at</strong>ions (see Note 4) 2 2Net payables for investments, consisting of: (445) (259)- Payables for investments (see Note 13) (486) (<strong>30</strong>8)- Receivables for investments/divestments (see Note 4) 41 49Total fixed capital 18,778 19,185Net working capitalTrade receivables (see Note 4) 1,367 1,798Inventories 235 240Tax receivables, consisting of: 47 124- Current income tax assets 3 115- Other current tax assets 5 5- IRES receivables for the n<strong>at</strong>ional tax consolid<strong>at</strong>ion scheme (see Note 4) 35 3- Group VAT credit (see Note 4) 4 1Trade payables (see Note 13) (556) (777)Tax payables, consisting of: (2<strong>30</strong>) (315)- Current income tax liabilities (175) (101)- Other current tax liabilities (16) (13)- IRES payables for n<strong>at</strong>ional tax consolid<strong>at</strong>ion scheme (see Note 13) (19) (176)- Group VAT payables (see Note 13) (20) (25)Deferred tax liabilities (901) (851)Provisions for risks and charges (527) (614)Deriv<strong>at</strong>ives (see Notes 15,19) (266) (324)Other assets, consisting of: 133 231- Other receivables (see Note 4) 96 173- Other current assets (see Note 6) 22 34- Other non-current assets (see Note 10) 15 24Accruals and deferrals from regul<strong>at</strong>ed activities, consisting of: (358) (368)- Accrued income from regul<strong>at</strong>ed activities (see Notes 6,10) 77 88- Prepaid income from regul<strong>at</strong>ed activities (see Notes 15,19) (435) (456)Other liabilities, consisting of: (642) (704)- Other payables (see Note 13) (263) (281)- Other current liabilities (see Note 15) (4) (6)- Other non-current liabilities (see Note 19) (375) (417)Total net working capital (1,698) (1,560)Provisions for employee benefits (107) (108)"Assets held for saleand directly rel<strong>at</strong>ed liabilities consisting of:" 16 12- Assets held for sale (see Note 11) 25 12- Liabilities directly associ<strong>at</strong>ed with assets held for sale (see Note 11) (9)NET INVESTED CAPITAL 16,989 17,529Shareholders' equity including minority interests 5,792 5,795Net financial debtFinancial liabilities, consisting of: 11,199 11,750- Long-term financial liabilities 6,800 8,<strong>30</strong>0- Current share of long-term financial liabilities 1,612 406- Short-term financial liabilities 2,787 3,044Financial receivables, cash and cash equivalents, consisting of: (2) (16)- Other financial assets- Cash and cash equivalents (2) (16)Total net financial debt 11,197 11,734COVERAGE 16,989 17,529<strong>Snam</strong> Half - <strong>year</strong> Report <strong>2012</strong>
<strong>Snam</strong> Directors' Report / Financial review42<strong>Consolid<strong>at</strong>ed</strong> st<strong>at</strong>ement of cash flows(€ million) First <strong>half</strong> 2011 First <strong>half</strong> <strong>2012</strong>Items from the reclassified st<strong>at</strong>ement of cash flows and reconcili<strong>at</strong>ion with thePartial amount Amount from Partial amount Amount fromfrom legally reclassified from legally reclassifiedlegally required form<strong>at</strong>required form<strong>at</strong> form<strong>at</strong> required form<strong>at</strong> form<strong>at</strong>Net profit 576 508Adjusted by:Amortis<strong>at</strong>ion, depreci<strong>at</strong>ion and other non-monetary components: 279 322- Amortis<strong>at</strong>ion and depreci<strong>at</strong>ion 322 345- Net impairment losses on property, plant and equipment and intangible assets (8)- Equity method valu<strong>at</strong>ion effect (28) (24)- Change in provisions for employee benefits 1- Other changes (7)Net capital losses on asset sales and elimin<strong>at</strong>ions 6Interest, income taxes and other changes: 432 521- Interest income (1) (2)- Interest expense 140 161- Income taxes 293 362Changes in working capital due to oper<strong>at</strong>ing activities: 16 (189)- Inventories (7) 35- Trade receivables (153) (431)- Trade payables (86) 221- Change in provisions for risks and charges 182 12- Other assets and liabilities 80 (26)Dividends, interest and income taxes collected (paid): (435) (548)- Dividends collected 29 2- Interest collected 1 3- Interest paid (140) (161)- Income taxes (paid) received (325) (392)Net cash flows from oper<strong>at</strong>ing activities 874 614Investments: (658) (493)- Property, plant and equipment (492) (351)- Intangible assets (166) (142)Investments in companies joining the scope of consolid<strong>at</strong>ion and business units: 9 (26)Divestments: 5 27- Property, plant and equipment 5 27Other changes rel<strong>at</strong>ing to investment activities: (152) (186)- Change in net payables for investments (152) (186)Free cash flow 78 (64)Change in financial payables: 385 551- Taking on long-term financial debt 422 1.521- Repaying long-term financial debt (320) (1,227)- Increase (decrease) in short-term financial debt 283 257Equity cash flows (468) (473)Net cash flow for the period (5) 14<strong>Snam</strong> Half - <strong>year</strong> Report <strong>2012</strong>
43<strong>Snam</strong> Directors' Report / Elements of risk and uncertaintyElements of risk and uncertaintyThe Board of Directors of <strong>Snam</strong> S.p.A., pursuant to the Code of Corpor<strong>at</strong>e Governance for Listed Companiesand in line with best practice in this area, has set up the Control and Risk Committee (formerly theInternal Control Committee), which exclusively comprises non-executive, independent directors. Thiscommittee, with the assistance of the Board of Directors, is responsible for the internal control and riskmanagement system. It aims to establish guidelines for this system, periodically checking their adequacyand effectiveness, and to ensure th<strong>at</strong> the main corpor<strong>at</strong>e risks are identified and appropri<strong>at</strong>ely managed.The main corpor<strong>at</strong>e risks identified, monitored and, where specified below, managed by <strong>Snam</strong> are asfollows: (i) market risk arising from exposure to fluctu<strong>at</strong>ions in interest r<strong>at</strong>es and in the price of n<strong>at</strong>uralgas; (ii) credit risk arising from the possible default of a counterparty; (iii) liquidity risk arising frominsufficient financial resources to meet short-term commitments; (iv) oper<strong>at</strong>ional risk; and (v) risksspecific to the business segments in which the group oper<strong>at</strong>es.Market riskInterest r<strong>at</strong>e riskFluctu<strong>at</strong>ions in interest r<strong>at</strong>es affect the market value of the company’s financial assets and liabilitiesand its net financial expense. <strong>Snam</strong> aims to minimise interest r<strong>at</strong>e risk while pursuing financial structureobjectives laid down in its business plans.The interest r<strong>at</strong>es of some of <strong>Snam</strong>’s loans are indexed to benchmark r<strong>at</strong>es, notably the Europe InterbankOffered R<strong>at</strong>e (Euribor). In order to limit interest r<strong>at</strong>e risk, <strong>Snam</strong> uses deriv<strong>at</strong>ive financial instruments –notably interest r<strong>at</strong>e swaps (IRSs) – to manage the balance between fixed-r<strong>at</strong>e and flo<strong>at</strong>ing-r<strong>at</strong>e debt.The IRSs implemented in this case convert flo<strong>at</strong>ing-r<strong>at</strong>e debt into fixed-r<strong>at</strong>e debt. The fair value of suchinterest-r<strong>at</strong>e deriv<strong>at</strong>ives is calcul<strong>at</strong>ed system<strong>at</strong>ically on the basis of market prices provided by the majorinfo providers. <strong>Snam</strong> does not have deriv<strong>at</strong>ive contracts held for trading or specul<strong>at</strong>ive purposes.As described in the paragraph “Liquidity risk”, <strong>Snam</strong> is mainly financed by its parent company, Eni S.p.A.There is no guarantee th<strong>at</strong>, when Eni S.p.A. cedes control, <strong>Snam</strong> will be able to obtain loans and shortandmedium-to-long-term financing from other sources on the same terms as its existing agreements.N<strong>at</strong>ural gas price riskUp to the end of the second regul<strong>at</strong>ory period on 31 December 2009, the transport<strong>at</strong>ion costs incurredfor the acquisition of gas needed to oper<strong>at</strong>e the compression st<strong>at</strong>ions were included in overall oper<strong>at</strong>ingcosts and therefore upd<strong>at</strong>ed using the price-cap mechanism 14 . As of the start of the third regul<strong>at</strong>oryperiod on 1 January 2010, the Electricity and Gas Authority, enacting the new tariff criteria laid down byResolution ARG/gas 184/09, has defined methods for payment in kind, by service users to transporters,of gas volumes to cover fuel gas, network losses and Unaccounted-For Gas, owed as a percentage of thevolumes respectively injected into and extracted from the transport<strong>at</strong>ion network. As a result of thesemeasures, and taking into account the mechanism for alloc<strong>at</strong>ing gas to service users, change in the priceof n<strong>at</strong>ural gas for hedging fuel gas and network losses no longer represents a risk factor for <strong>Snam</strong>. Pricefluctu<strong>at</strong>ion risk remains from excess quantities of Unaccounted-For Gas and network losses withdrawnvis-à-vis the quantities paid for in kind by service users.14 Under this mechanism, core revenue components rel<strong>at</strong>ing to oper<strong>at</strong>ing costs, amortis<strong>at</strong>ion and depreci<strong>at</strong>ion are upd<strong>at</strong>ed withfinancial st<strong>at</strong>ement figures <strong>at</strong> the start of a regul<strong>at</strong>ory period, while they are upd<strong>at</strong>ed with infl<strong>at</strong>ion and reduced by a productivitycoefficient in the subsequent <strong>year</strong>s..<strong>Snam</strong> Half - <strong>year</strong> Report <strong>2012</strong>
<strong>Snam</strong> Directors' Report / Elements of risk and uncertainty44Credit riskCredit risk is the company’s exposure to potential losses arising from counterparties failing to fulfil theiroblig<strong>at</strong>ions. Default or delayed payment may have a neg<strong>at</strong>ive impact on the financial balance and resultsof <strong>Snam</strong>.The group provides business services to a small number of oper<strong>at</strong>ors in the gas sector, the largest of whichby revenue is Eni S.p.A. The rules for client access to the services offered are established by the Electricityand Gas Authority and set out in the Network Codes. For each type of service, these documents explainthe rules regul<strong>at</strong>ing the rights and oblig<strong>at</strong>ions of the parties involved in providing said services, and havecontractual conditions which minimise the risk of non-compliance by the clients. In particular, the Codesrequire guarantees to be provided to partly cover oblig<strong>at</strong>ions where the client does not possess a creditr<strong>at</strong>ing issued by one of the leading intern<strong>at</strong>ional agencies.It cannot be ruled out, however, th<strong>at</strong> <strong>Snam</strong> may incur liabilities and/or losses due to its customers’ failureto perform payment oblig<strong>at</strong>ions.Please refer to Note 4 to the condensed interim consolid<strong>at</strong>ed financial st<strong>at</strong>ements, “Trade receivablesand other receivables”, for a description of changes in provisions for impairment of trade receivablesduring the period.Liquidity riskLiquidity risk is the risk th<strong>at</strong> new financial resources may not be available (funding liquidity risk) or thecompany may be unable to convert assets into cash on the market (asset liquidity risk), meaning th<strong>at</strong> itcannot meet its payment commitments. This may affect profit or loss should the company be obligedto incur extra costs to meet its commitments or, in extreme cases, lead to insolvency and thre<strong>at</strong>enthe company’s future as a going concern. <strong>Snam</strong>’s objective is to have a financial structure (in termsof leverage r<strong>at</strong>io and r<strong>at</strong>ios of medium- to long-term debt and fixed-/flo<strong>at</strong>ing-r<strong>at</strong>e debt to total debt),which ensures an adequ<strong>at</strong>e level of liquidity for the Group, minimising the rel<strong>at</strong>ed opportunity cost andmaintaining a balance between the term and composition of its debt in line with business objectives.As part of the general framework of the Decree of the President of the Council of Ministers (DPCM) of25 May <strong>2012</strong> (Implement<strong>at</strong>ion of ownership unbundling between Eni and <strong>Snam</strong>), on <strong>30</strong> May <strong>2012</strong> Eniand CDP announced to the market th<strong>at</strong> they had reached a binding preliminary agreement for the saleto CDP of an equity investment of <strong>30</strong>% minus one share in the voting capital of <strong>Snam</strong> owned by Eni.Completion of the transaction, possible from 15 October this <strong>year</strong>, is scheduled to take place by the endof <strong>2012</strong>. On 15 <strong>June</strong> <strong>2012</strong>, Eni formalised the rel<strong>at</strong>ive sale agreement with CDP.In this context, and with the aim of diversifying sources of funds by broadening the investor base, theBoard of Directors of <strong>Snam</strong> resolved on 4 <strong>June</strong> <strong>2012</strong> to issue one or more bond loans for placement withinstitutional investors oper<strong>at</strong>ing in Europe, on the basis of an issue programme of Euro Medium Term Notes(EMTN), for a total maximum amount of €8 billion, to be issued in one or more tranches by 4 <strong>June</strong> 2013.Specifically, two fixed-r<strong>at</strong>e bonds were issued in July for €2 billion, reserved for institutional investors.Subsequently, on 7 <strong>June</strong> <strong>2012</strong>, <strong>Snam</strong> signed, with a group of 11 leading n<strong>at</strong>ional and intern<strong>at</strong>ional banks,a mand<strong>at</strong>e for the structuring and underwriting of a pool loan of €11 billion, which will cover theCompany’s requirements, including the refinancing of its current debt to Eni. On 24 July <strong>2012</strong>, <strong>Snam</strong>signed agreements for credit lines totalling €9 billion. The amount of the credit lines was lower than theoriginal €11 billion due to the placement on the capital market of bonds totalling €2 billion.A series of bil<strong>at</strong>eral agreements have also been defined with some banks for a total amount ofapproxim<strong>at</strong>ely €3.5 billion, of which €1.5 billion had already been released <strong>at</strong> <strong>30</strong> <strong>June</strong> <strong>2012</strong>.These agreements will provide <strong>Snam</strong> with short-term financing based primarily on bank credit, but withthe aim of progressively meeting a target debt structure largely made up of bond loans, in line with itsbusiness profile and the regul<strong>at</strong>ory context in which it oper<strong>at</strong>es.<strong>Snam</strong> Half - <strong>year</strong> Report <strong>2012</strong>
45<strong>Snam</strong> Directors' Report / Elements of risk and uncertaintyIn support of the refinancing oper<strong>at</strong>ion, on 13 <strong>June</strong> <strong>2012</strong>, <strong>Snam</strong> obtained its first credit r<strong>at</strong>ings fromMoody’s and Standard & Poor’s. Credit r<strong>at</strong>ings are an estim<strong>at</strong>e of creditworthiness and thereforeindic<strong>at</strong>e to investors the probability of <strong>Snam</strong> being able to repay the capital invested. The r<strong>at</strong>ing plays adetermining role in defining the financial charges th<strong>at</strong> <strong>Snam</strong> will have to pay for debt contracted on themarket. A downgrade in the r<strong>at</strong>ing would result in a higher interest r<strong>at</strong>e, by increasing the spread applied.One of the potential factors th<strong>at</strong> could lead to deterior<strong>at</strong>ion in creditworthiness, in addition to thosestrictly intrinsic to the business and management situ<strong>at</strong>ion of <strong>Snam</strong>, is a downgrade in the debt r<strong>at</strong>ing ofthe Italian government. <strong>Snam</strong>’s r<strong>at</strong>ings are currently A- with a neg<strong>at</strong>ive outlook (A-2) from Standard andPoor’s and Baa1 with a stable outlook from Moody’s.Due to the downgrade of the debt r<strong>at</strong>ing assigned to the Italian Republic, on 16 July <strong>2012</strong> Moody’sannounced a multiple review of the r<strong>at</strong>ings and/or outlooks of a broad range of Italian companies,including <strong>Snam</strong>. Specifically, <strong>Snam</strong>’s r<strong>at</strong>ing of Baa1 has been placed under review for downgrade.<strong>Snam</strong> is currently financed entirely by its parent company, Eni S.p.A. In the case of a change of control<strong>at</strong> <strong>Snam</strong> by Eni S.p.A., existing agreements between the companies give Eni S.p.A. the right to extinguishthe credit lines granted early. As the situ<strong>at</strong>ion stands, <strong>Snam</strong> believes th<strong>at</strong> cash flows deriving frommanagement of the company, the action taken to refinance its debt and the current structure of itsbalance sheet and cash flows are reasonably certain to provide access to a broad spectrum of financing,sufficient to meet its foreseeable financial needs. However, there are no guarantees th<strong>at</strong> <strong>Snam</strong> would becapable of obtaining loans, short- and medium-to-long-term, and financing from other sources underthe same conditions as current ones.Payments owed contractually on financial debts, including interest payments, as well as the timing ofdisbursements for trade and miscellaneous payables, are set out in Note 22 to the condensed interimconsolid<strong>at</strong>ed financial st<strong>at</strong>ements, “Guarantees, commitments and risks – Liquidity risk”, which shouldbe referred to.Oper<strong>at</strong>ional risk<strong>Snam</strong> is required to comply with rules and regul<strong>at</strong>ions <strong>at</strong> EU, n<strong>at</strong>ional, regional and local level.The expenses associ<strong>at</strong>ed with the actions required to fulfil its oblig<strong>at</strong>ions constitute a significant costitem now and for the <strong>year</strong>s ahead.Complying with rules and regul<strong>at</strong>ions, and minimising oper<strong>at</strong>ional risk, is crucial for obtainingauthoris<strong>at</strong>ions and/or licences th<strong>at</strong> require compliance with applicable laws on health, safety and theenvironment. Viol<strong>at</strong>ion of current regul<strong>at</strong>ions may result in individual criminal and/or civil sanctions, andin specific cases where safety and environmental rules are viol<strong>at</strong>ed companies may be liable on the basisof a European objective liability model adopted in Italy through Legisl<strong>at</strong>ive Decree 231/01. <strong>Snam</strong> mayincur significant costs or liabilities.Current regul<strong>at</strong>ions highlight the value of organis<strong>at</strong>ional models aimed <strong>at</strong> preventing offences in theevent of viol<strong>at</strong>ion of environmental and workplace health and safety laws, specifying corpor<strong>at</strong>e liability.<strong>Snam</strong> uses organis<strong>at</strong>ional instruments and internal regul<strong>at</strong>ions to establish the responsibilities andprocedures to be adopted when designing, constructing, oper<strong>at</strong>ing and disposing of all company assets,thereby ensuring compliance with laws and internal regul<strong>at</strong>ions on health, safety and the environment.<strong>Snam</strong> has implemented environmental and workplace health and safety management systems based onthe principles of its own Health, Safety, Environment and Quality Policy, which has been developed <strong>at</strong>the company for several <strong>year</strong>s.The document<strong>at</strong>ion and applic<strong>at</strong>ion of <strong>Snam</strong>’s management systems are certified in accordance withintern<strong>at</strong>ional standards. More specifically, the company has received ISO 14001 certific<strong>at</strong>ion for themanagement process rel<strong>at</strong>ing to its pipeline network and compression st<strong>at</strong>ions, as well as ISO 9001certific<strong>at</strong>ion for the processes it uses to meter, disp<strong>at</strong>ch and define transport<strong>at</strong>ion capacity for n<strong>at</strong>uralgas. The Workplace Health and Safety Management System is certified in accordance with the BS OHSAS<strong>Snam</strong> Half - <strong>year</strong> Report <strong>2012</strong>
<strong>Snam</strong> Directors' Report / Elements of risk and uncertainty4618001 standard for <strong>Snam</strong>, <strong>Snam</strong> Rete Gas and Italgas. A business plan designed to obtain certific<strong>at</strong>ion bythe end of 2102 has been launched for Stogit and GNL.By adopting management systems and procedures th<strong>at</strong> take into account the specific characteristics ofits business, and by continually improving and modernising its facilities, <strong>Snam</strong> ensures th<strong>at</strong> it can identify,assess and mitig<strong>at</strong>e risks as part of a cycle of continual improvement.<strong>Snam</strong> pays the utmost <strong>at</strong>tention to all its oper<strong>at</strong>ional processes: from designing and constructingplants to oper<strong>at</strong>ing and maintaining them. For the purposes of business management and oper<strong>at</strong>ionalcontrol, the company uses specific techniques th<strong>at</strong> are continually being upd<strong>at</strong>ed and are developed incompliance with intern<strong>at</strong>ional best practice.<strong>Snam</strong> develops and maintains technical regul<strong>at</strong>ions and management systems for the environment andworkplace health and safety based on an annual cycle of planning, implement<strong>at</strong>ion, control, reviewingresults and setting new objectives.Management system control is conducted through monitoring health, safety and environment indic<strong>at</strong>ors,periodic <strong>report</strong>ing and inspections of oper<strong>at</strong>ing sites and the registered office, which involve:- a technical audit, designed to ensure th<strong>at</strong> the management systems are applied correctly in compliancewith the Code of Ethics and Organis<strong>at</strong>ional Model 231;- management system checks on certific<strong>at</strong>ion, maintenance and renov<strong>at</strong>ion (conducted annually by anexternal certifying body);- health, safety and environment checks on outsourced activities.The findings are examined together with the results of the oper<strong>at</strong>ing checks, providing basic inform<strong>at</strong>ionfor planning future activities and setting new targets, in accordance with <strong>Snam</strong> principles.<strong>Snam</strong> has adopted organis<strong>at</strong>ional and regul<strong>at</strong>ory measures for preventing (availability, goods and servicescontracts, training, etc.) and managing any oper<strong>at</strong>ional crises which may impact assets, people and theenvironment, identifying the actions required to limit damage.<strong>Snam</strong> particip<strong>at</strong>es in intern<strong>at</strong>ional working groups which conduct benchmarking activities, draw up guidelinesand carry out studies aimed <strong>at</strong> identifying ways in which gas transport<strong>at</strong>ion processes can be improved.In addition to the risk response, monitoring and management system, as well as to the HSE measuresadopted across the group, <strong>Snam</strong> has taken out insurance to limit the possible neg<strong>at</strong>ive effects on its assetsfrom damage caused to third parties and to industrial property, whether onshore or offshore (Messinastrait). This damage may occur during oper<strong>at</strong>ions and/or investment works. The amount insured variesaccording to the type of event and is determined by current market best practice in risk assessment.Risks connected with failing to meet infrastructure development objectives<strong>Snam</strong>’s effective ability to develop its infrastructure is subject to many unforeseeable events linked tooper<strong>at</strong>ing, economic, regul<strong>at</strong>ory, authoris<strong>at</strong>ion and competition factors which are outside its control.<strong>Snam</strong> is therefore unable to guarantee th<strong>at</strong> the projects to upgrade and extend its network will bestarted, be completed or lead to the expected benefits in terms of tariffs. Additionally, the developmentprojects may require gre<strong>at</strong>er investments or longer timeframes than those originally planned, affecting<strong>Snam</strong>’s financial position and results.Risks deriving from malfunctioning of plantsManaging regul<strong>at</strong>ed gas activities involves a number of risks of malfunctioning and unforeseeableservice disruptions due to factors which are outside <strong>Snam</strong>’s control, such as accidents, breakdowns ormalfunctioning of equipment or control systems, the underperformance of plants and extraordinaryevents such as explosions, fires, earthquakes, landslides or other similar events beyond <strong>Snam</strong>’s control.These events could also cause significant damage to persons, property or the environment.Any service interruptions and subsequent compens<strong>at</strong>ion oblig<strong>at</strong>ions could lead to a decrease in revenueand/or an increase in costs. Although <strong>Snam</strong> has taken out specific insurance policies to cover some of<strong>Snam</strong> Half - <strong>year</strong> Report <strong>2012</strong>
47<strong>Snam</strong> Directors' Report / Elements of risk and uncertaintythese risks, the rel<strong>at</strong>ed insurance cover could be insufficient to meet all the losses incurred, compens<strong>at</strong>ionoblig<strong>at</strong>ions or cost increases.Risks deriving from the need to manage a significant flow of inform<strong>at</strong>ion to oper<strong>at</strong>e regul<strong>at</strong>edservicesThe regul<strong>at</strong>ory framework in which <strong>Snam</strong> oper<strong>at</strong>es involves continually collecting and processinga significant flow of inform<strong>at</strong>ion from its service clients. The inform<strong>at</strong>ion received by <strong>Snam</strong> includes,inter alia, capacity bookings, details of where gas is coming from and going to each day, physical andcommercial balancing mechanisms and forecasts on demand and transport<strong>at</strong>ion capacity usage. Thisflow of inform<strong>at</strong>ion, managed by extensive use of IT systems, is broad and complex. Therefore, <strong>Snam</strong>cannot guarantee th<strong>at</strong> its management will not lead to oper<strong>at</strong>ing and planning difficulties which couldaffect its business.Risks deriving from the seasonal n<strong>at</strong>ure of the business<strong>Snam</strong>’s overall business is not affected by seasonal or cyclical factors which could have a significantimpact on its annual or interim financial position and results. Indeed, on the basis of current tariffs, onlya minimal part of <strong>Snam</strong>’s revenue is exposed to changes in gas demand (around 15% of n<strong>at</strong>ural gastransport<strong>at</strong>ion revenue and around 10% of LNG regasific<strong>at</strong>ion revenue).Specific risks rel<strong>at</strong>ed to the business segments in which <strong>Snam</strong> oper<strong>at</strong>esRegul<strong>at</strong>ion<strong>Snam</strong> oper<strong>at</strong>es in the regul<strong>at</strong>ed gas sector. The relevant directives and legal provisions issued by theEuropean Union and the Italian government, and the resolutions of the Electricity and Gas Authority, mayhave a significant impact on oper<strong>at</strong>ions, results and financial stability. More specifically, Decree Law 138of 13 August 2011, which was converted into Law 148 of 14 September 2011, extended the applic<strong>at</strong>ionof additional IRES to the n<strong>at</strong>ural gas transport<strong>at</strong>ion and distribution business segments, with a tax riseof 10.5% for 2011-2013 and 6.5% as of 2014. Companies are not permitted to pass on the tax rise tocustomers via tariff increases, and the Electricity and Gas Authority has been mand<strong>at</strong>ed to enforce this rule.Future changes to European Union or Italian legisl<strong>at</strong>ive policies, which may have unforeseeable effects onthe relevant legisl<strong>at</strong>ive framework and, therefore, on <strong>Snam</strong>’s oper<strong>at</strong>ions and results, cannot be ruled out.Risks associ<strong>at</strong>ed with the end of gas distribution concessions held by Italgas and its subsidiariesand associ<strong>at</strong>esRisks rel<strong>at</strong>ing to tenders for new gas distribution concessionsAt <strong>30</strong> <strong>June</strong> <strong>2012</strong>, <strong>Snam</strong>, through Italgas, had a portfolio of approxim<strong>at</strong>ely 1,450 n<strong>at</strong>ural gas distributionconcessions spread throughout Italy. On the basis of current regul<strong>at</strong>ions applicable to <strong>Snam</strong>’s concessions,new gas distribution contracts will be awarded not by individual municipality but exclusively by zonesdetermined by the Ministerial Decrees of 19 January 2011 and 18 October 2011, and also according tothe timeframes indic<strong>at</strong>ed in Annex 1 of the Ministerial Decree on bid evalu<strong>at</strong>ion and auction criteria,issued on 12 November 2011.As the tender process unfolds, <strong>Snam</strong> may not be awarded one or more of the new concessions, or it maybe awarded them on less favourable terms than is currently the case. This could have a neg<strong>at</strong>ive impacton <strong>Snam</strong>’s oper<strong>at</strong>ions, results, balance sheet and cash flow, notwithstanding, should the company not beawarded concessions for municipalities it currently manages, the reimbursement to the outgoing oper<strong>at</strong>or.Risks rel<strong>at</strong>ing to the possible request from municipalities to acquire ownership of the gas distributionnetworks and to quantifying reimbursement to the outgoing oper<strong>at</strong>orWith regard to gas distribution concessions where <strong>Snam</strong>, through Italgas, also owns the networks andplants, regul<strong>at</strong>ory changes in the sector determine the legal rules of ownership and the elements required<strong>Snam</strong> Half - <strong>year</strong> Report <strong>2012</strong>
<strong>Snam</strong> Directors' Report / Elements of risk and uncertainty48to calcul<strong>at</strong>e the amount to be reimbursed to the outgoing oper<strong>at</strong>or, both in the first period, i.e. <strong>at</strong> the endof the transition period referred to in Article 15 of Legisl<strong>at</strong>ive Decree 164/100 as subsequently amended,and in subsequent periods.More specifically, the above-mentioned Decree on bid evalu<strong>at</strong>ion and auction criteria stipul<strong>at</strong>es th<strong>at</strong>:• in the first period, the amount to be reimbursed to existing concession and contract holders shall becalcul<strong>at</strong>ed on the basis of wh<strong>at</strong> has been agreed, or, where this is not possible, on the basis of criteriaestablished in Royal Decree 2578 of 15 October 1925 (the “industrial value” criterion);• in the event of a dispute over the amount to be reimbursed to the outgoing oper<strong>at</strong>or, the call fortenders <strong>report</strong>s and the winning oper<strong>at</strong>or pays, upon transfer of ownership of the plants, the higherof the estim<strong>at</strong>e by the awarding local authorities and the value of the local net fixed assets, net ofgovernment grants for capital expenditure and priv<strong>at</strong>e contributions rel<strong>at</strong>ing to local assets, recognisedby the tariff system of the Electricity and Gas Authority (RAB). Once the dispute has been resolved, anydifference will be settled between the incoming oper<strong>at</strong>or and the outgoing oper<strong>at</strong>or;• the incoming oper<strong>at</strong>or will acquire ownership of the plant by paying the outgoing oper<strong>at</strong>or thereimbursement amount, with the exception of any parts owned by the local municipality;• in subsequent periods, the reimbursement to the outgoing oper<strong>at</strong>or shall be the value of local netfixed assets, net of government grants for capital expenditure and priv<strong>at</strong>e contributions rel<strong>at</strong>ing tolocal assets, calcul<strong>at</strong>ed on the basis of criteria used by the Electricity and Gas Authority to determinedistribution tariffs (RAB).There is a risk th<strong>at</strong> resolving the dispute with the local authorities on how to determine the reimbursementwill lead to the amount being less than was indic<strong>at</strong>ed during the tender process and was actually paid to<strong>Snam</strong>, which could have a neg<strong>at</strong>ive impact on the company’s results, balance sheet and cash flow.Risks rel<strong>at</strong>ing to gas storage concession ownershipThrough Stogit, <strong>Snam</strong> holds ten gas storage concessions. Of these, eight (Alfonsine, Brugherio,Cortemaggiore, Minerbio, Ripalta, Sabbioncello, Sergnano and Settala) expire in December 2016, one(Bordolano) expires in November 2021 and the other (Fiume Treste), which was extended for a decadefor the first time during 2011, expires in <strong>June</strong> 2022. Each concession may be extended by the Ministry ofEconomic Development no more than twice for a dur<strong>at</strong>ion of ten <strong>year</strong>s <strong>at</strong> a time, pursuant to Article 1,paragraph 61 of Law 239/2004. If <strong>Snam</strong> is unable to retain ownership of one or more of its concessions orif, <strong>at</strong> the time of the renewal, the concessions are awarded under terms less favourable than the currentones, there may be neg<strong>at</strong>ive effects on the company’s oper<strong>at</strong>ions, results, balance sheet and cash flow.Risk rel<strong>at</strong>ing to uncertainty about n<strong>at</strong>ural gas reservesThere are several uncertainties surrounding estim<strong>at</strong>ions of n<strong>at</strong>ural gas reserves in the storage fieldswhere <strong>Snam</strong> oper<strong>at</strong>es via its subsidiaries, and therefore their future use and necessary investments.The accuracy of these estim<strong>at</strong>ions depends on a certain number of factors, assumptions and variables,among which some of the most important are: (a) the quality of geological, technical and economicd<strong>at</strong>a and their interpret<strong>at</strong>ion and evalu<strong>at</strong>ion; (b) projections for future usage and timeframes for therelevant investment; (c) the stability or otherwise of sector laws and regul<strong>at</strong>ions; and (d) the actualresults of drilling and general production activity in the fields for which <strong>Snam</strong> owns a concession whichare subsequent to the estim<strong>at</strong>ion d<strong>at</strong>e and which may cause said estim<strong>at</strong>ions to be raised or lowered.Factors other than those listed above which may influence reserve estim<strong>at</strong>ions are beyond <strong>Snam</strong>’scontrol, and may therefore vary over time. As a result, there may be differences between estim<strong>at</strong>edreserves and those actually available for use, which may have neg<strong>at</strong>ive effects on oper<strong>at</strong>ions, results, thebalance sheet and cash flow.<strong>Snam</strong> Half - <strong>year</strong> Report <strong>2012</strong>
49<strong>Snam</strong> Directors' Report / Elements of risk and uncertaintyRisks connected with certain socio-political situ<strong>at</strong>ions in n<strong>at</strong>ural gas production and transitcountriesA large part of the n<strong>at</strong>ural gas which travels through the transport<strong>at</strong>ion network of <strong>Snam</strong> does, or may,come from or travel through countries which present risks deriving from certain socio-political situ<strong>at</strong>ions.Importing and transiting n<strong>at</strong>ural gas from or through such countries may present risks such as: highertaxes and excise duties; production, export or transport<strong>at</strong>ion limits; enforced contract renegoti<strong>at</strong>ions;n<strong>at</strong>ionalis<strong>at</strong>ion or ren<strong>at</strong>ionalis<strong>at</strong>ion of assets; changes to n<strong>at</strong>ional political and governing systems;changes to commercial policies; monetary restrictions; and loss or damage owing to the actions of rebelgroups. If shippers are unable to access the n<strong>at</strong>ural gas available in these countries as a result of theaforementioned or similar situ<strong>at</strong>ions or they are damaged in any other way by said situ<strong>at</strong>ions, they maybe unable to fulfil their contractual oblig<strong>at</strong>ions to <strong>Snam</strong> or there may be a reduction in volumes of gastransported. Such events may therefore have a neg<strong>at</strong>ive effect on oper<strong>at</strong>ions, results, the balance sheetand cash flow.Quantit<strong>at</strong>ive inform<strong>at</strong>ion about risks arising from financial instruments as required by IFRS 7 “Financialinstruments: Notes to the financial st<strong>at</strong>ements” is provided in Note 22 to the condensed interimconsolid<strong>at</strong>ed financial st<strong>at</strong>ements, “Guarantees, commitments and risks”.<strong>Snam</strong> Half - <strong>year</strong> Report <strong>2012</strong>
<strong>Snam</strong> Directors' Report / Outlook50OUTLOOKGas demandOn the basis of inform<strong>at</strong>ion currently available, n<strong>at</strong>ural gas demand on the Italian market <strong>at</strong> the end of<strong>2012</strong> will be down slightly on 2011, mainly due to reduced consumption in the thermoelectric sector.InvestmentsThe investment plan for the four-<strong>year</strong> period <strong>2012</strong>-2015 is proceeding according to schedule, with overallprojected expenditure of approxim<strong>at</strong>ely €6.7 billion <strong>at</strong> consolid<strong>at</strong>ed level.Efficiency<strong>Snam</strong> will continue to pay <strong>at</strong>tention to oper<strong>at</strong>ing efficiency in <strong>2012</strong> through initi<strong>at</strong>ives designed to keepemerging costs under control, notably the reorganis<strong>at</strong>ion of the group which took place in 2011.<strong>Snam</strong> Half - <strong>year</strong> Report <strong>2012</strong>
Post-balance sheet events
<strong>Snam</strong> Directors' Report / Post-balance sheet events52The main post-balance sheet events are described in the “Highlights” section.<strong>Snam</strong> Half - <strong>year</strong> Report <strong>2012</strong>
Inform<strong>at</strong>ion on rel<strong>at</strong>ed parties
55 <strong>Snam</strong> Directors' Report / Financial reviewOther inform<strong>at</strong>ion<strong>Snam</strong> Half - <strong>year</strong> Report <strong>2012</strong>
<strong>Snam</strong> Directors' Report / Other inform<strong>at</strong>ion56Disclosure required by Article 37 of Consob Regul<strong>at</strong>ion 16191/07Pursuant to Article 37 of the Market Regul<strong>at</strong>ions, rel<strong>at</strong>ing to controlled companies subject to themanagement and coordin<strong>at</strong>ion of others, there are no conditions preventing the listing of <strong>Snam</strong> S.p.A.shares on the electronic stock exchange organised and managed by Borsa Italiana S.p.A..<strong>Snam</strong> Half - <strong>year</strong> Report <strong>2012</strong>
57 <strong>Snam</strong> Directors' Report / Financial reviewGlossary<strong>Snam</strong> Half - <strong>year</strong> Report <strong>2012</strong>
59<strong>Snam</strong> Directors' Report / GlossaryInvestmentsCosts of long-term assets whose useful life does not expire over one <strong>report</strong>ing period.Net financial expenseNet cost incurred for using third-party capital. Includes other net expense rel<strong>at</strong>ed to financial oper<strong>at</strong>ions.Shareholders’ equityTotal resources contributed by shareholders, plus retained profits and minus losses.EBITDAUsed by the group in its internal (business plan) and external (to analysts and investors) present<strong>at</strong>ions. Unitof measurement to assess the group’s oper<strong>at</strong>ing performance, as a whole and in the individual businesssegments, in addition to EBIT. Determined by the difference between revenue and oper<strong>at</strong>ing costs.Core business revenueIncome from selling goods and/or providing services th<strong>at</strong> are integral to the core business, including allrecurring economic values linked to a company’s typical field of business.Deriv<strong>at</strong>ivesA financial instrument is defined as a deriv<strong>at</strong>ive when its price/yield profile derives from the price/yieldparameters of other major instruments – known as “underlying” – such as commodities, currencies,interest r<strong>at</strong>es, securities and share indices.EBITDifference in a given period between sales and services revenues and other revenue and costs. It istherefore the oper<strong>at</strong>ing result before financial revenue and costs and taxes.Net profitEBIT minus result from financial oper<strong>at</strong>ions and income taxes.<strong>Snam</strong> Half - <strong>year</strong> Report <strong>2012</strong>
<strong>Snam</strong> Directors' Report / Glossary60Transport<strong>at</strong>ion and regasific<strong>at</strong>ionCommercial termsNetwork CodeDocument governing the rights and oblig<strong>at</strong>ions of those involved in providing transport<strong>at</strong>ion andregasific<strong>at</strong>ion services.Regul<strong>at</strong>ory periodPeriod of time (usually four <strong>year</strong>s) for which criteria are defined for setting tariffs for transporting anddisp<strong>at</strong>ching n<strong>at</strong>ural gas and for regasifying liquefied n<strong>at</strong>ural gas. For transport<strong>at</strong>ion, we are currently inthe third regul<strong>at</strong>ory period, which runs from 1 January 2010 to 31 December 2013. For regasific<strong>at</strong>ion, thethird regul<strong>at</strong>ory period runs from 1 October 2008 to <strong>30</strong> September <strong>2012</strong>.Network entry pointEach point or a localised group of physical points on the gas transport<strong>at</strong>ion network <strong>at</strong> which gas isdelivered to the transporter.Regasific<strong>at</strong>ion TariffsUnit prices applied for regasific<strong>at</strong>ion. These include capacity and commodity tariffs, rel<strong>at</strong>ed respectively tothe required regasific<strong>at</strong>ion capacity and to the volumes of gas actually unloaded from methane tankers.Transport<strong>at</strong>ion TariffsUnit prices applied for transporting and disp<strong>at</strong>ching n<strong>at</strong>ural gas. These include capacity and commoditytariffs rel<strong>at</strong>ed, respectively, to the required transport<strong>at</strong>ion capacity and to the volumes of gas actuallyinjected into the network.Technical termsLiquefied n<strong>at</strong>ural gas (LNG)N<strong>at</strong>ural gas essentially comprising methane liquefied by cooling <strong>at</strong> around -160°C, <strong>at</strong> <strong>at</strong>mosphericpressure, to make it suitable for methane tanker transport<strong>at</strong>ion or reservoir storage. In order to beinjected into the transport<strong>at</strong>ion network, the liquid must be reconverted into a gas <strong>at</strong> regasific<strong>at</strong>ionplants and brought to the oper<strong>at</strong>ing pressure of the pipelines.<strong>Snam</strong> Half - <strong>year</strong> Report <strong>2012</strong>
61<strong>Snam</strong> Directors' Report / GlossaryN<strong>at</strong>ural gas storageCommercial termsWithdrawal phasePeriod from 1 November of one <strong>year</strong> to 31 March of the following <strong>year</strong>.Injection phasePeriod from 1 April to 31 October of the same <strong>year</strong>.Regul<strong>at</strong>ory periodPeriod of time (usually four <strong>year</strong>s) for which criteria are defined for setting tariffs for n<strong>at</strong>ural gas storageservices. The third regul<strong>at</strong>ory period commenced on 1 January 2011 and will end on 31 December 2014.Technical termsModul<strong>at</strong>ion storageAims to respond to changing hourly, daily and seasonal demands.Mining storageMining storage is necessary for technical and economic reasons in order to enable optimum cultiv<strong>at</strong>ionof Italy’s n<strong>at</strong>ural gas fields.Str<strong>at</strong>egic storageAims to provide for a lack of or reduction in supplies from non-EU imports or crises in the gas system.<strong>Snam</strong> Half - <strong>year</strong> Report <strong>2012</strong>
<strong>Snam</strong> Directors' Report / Glossary62N<strong>at</strong>ural gas distributionCommercial termsTariff areaThe tariff area is the area used to determine distribution tariffs and consists of all communities served by the samedistribution plant. If several local authorities collectively design<strong>at</strong>e an oper<strong>at</strong>or to perform the distribution service,or declare themselves a single tariff area, the tariff area coincides with the group of municipalities served throughseveral distribution plants by one or more oper<strong>at</strong>ors.End clientConsumer who buys gas for own use.Network CodeDocument governing the rights and oblig<strong>at</strong>ions of those involved in providing gas distribution services.ConcessionAct by which a local authority entrusts to a company the management of a service which falls within the remit ofsaid authority and for which said company assumes the oper<strong>at</strong>ional risk.Regul<strong>at</strong>ory periodPeriod of time (usually four <strong>year</strong>s) for which criteria are defined for setting tariffs for gas distribution services. We arecurrently in the third regul<strong>at</strong>ory period, which runs from 1 January 2009 to 31 December <strong>2012</strong>.Redelivery pointThis is the point of demarc<strong>at</strong>ion between the gas distribution plant and the plant owned or managed by the endcustomer <strong>at</strong> which the distribution company redelivers gas transported for supply to the end customer, and <strong>at</strong> whichmetering occurs.Gas distribution serviceService of transporting n<strong>at</strong>ural gas through networks of local pipelines from one or more delivery points to redeliverypoints, generally <strong>at</strong> low pressure and in urban areas, for delivery to end clients.Technical termsGas distributedAmount of gas delivered to users of the distribution network <strong>at</strong> the redelivery points.Equalis<strong>at</strong>ionDifference between revenues for the period (annual TRL) and those invoiced to retail companies on the basis ofvolumes distributed. The net position with the Equalis<strong>at</strong>ion Fund is established <strong>at</strong> the end of the thermal <strong>year</strong> andsettled over the course of the <strong>year</strong> on the basis of advanced payments.TRL (Total Revenue Limit)Total revenue allowed for distribution companies by the regul<strong>at</strong>ory body to cover costs for providing distributionand metering services.<strong>Snam</strong> Half - <strong>year</strong> Report <strong>2012</strong>
Condensed interimconsolid<strong>at</strong>ed financialst<strong>at</strong>ements
64<strong>Snam</strong> Condensed interim consolid<strong>at</strong>ed financial st<strong>at</strong>ements / Financial st<strong>at</strong>ementsBalance sheet31.12.2011 <strong>30</strong>.06.<strong>2012</strong>(€ million) Notes Totalof which withrel<strong>at</strong>ed partiesTotalof which withrel<strong>at</strong>ed partiesCurrent assetsCash and cash equivalents 2 16Trade and other receivables (4) 1,545 546 2,138 587Inventories (5) 235 240Current income tax assets 3 3Other current tax assets 5 5Other current assets (6) 33 2 461,823 2,448Non-current AssetsProperty, plant and equipment (7) 14,053 14,234Compulsory inventories 405 405Intangible assets (8) 4,444 4,493Equity-accounted investments (9) 319 310Other non-current assets (10) 81 1 100 119,<strong>30</strong>2 19,542Non-current assets held for sale (11) 25 12TOTAL ASSETS 21,150 22,002LIABILITIES AND SHAREHOLDERS’ EQUITYCurrent liabilitiesShort-term financial liabilities (12) 2,787 1,612 3,044 3,032Short-term portion of long-term financial liabilities (16) 1,612 277 406 406Trade and other payables (13) 1,344 1,567 473Current income tax liabilities (14) 175 101Other current tax liabilities (15) 16 78 13Other current liabilities 211 193 1006,145 5,324Non-current liabilitiesLong-term financial liabilities (16) 6,800 6,800 8,<strong>30</strong>0 6,800Provisions for risks and charges (17) 527 614Provisions for employee benefits 107 108Deferred tax liabilities (18) 901 851Other non-current liabilities (19) 869 188 1,010 2259,204 10,883Liabilities directly associ<strong>at</strong>ed with assetsheld for sale 9TOTAL LIABILITIES 15,358 16,207SHAREHOLDERS’ EQUITY (20)<strong>Snam</strong> shareholders’ equityShare capital 3,571 3,571Reserves 2,551 2,498Net profit 790 508Treasury shares (783) (783)Interim dividend (338)Total <strong>Snam</strong> shareholders’ equity 5,791 5,794Minority interests 1 1TOTAL SHAREHOLDERS’ EQUITY 5,792 5,795TOTAL LIABILITIES AND SHAREHOLDERS’ EQUITY 21,150 22,002<strong>Snam</strong> Half - <strong>year</strong> Report <strong>2012</strong>
<strong>Snam</strong> Condensed interim consolid<strong>at</strong>ed financial st<strong>at</strong>ements / Financial st<strong>at</strong>ements65Income st<strong>at</strong>ement(€ million) Notes TotalFirst <strong>half</strong> 2011 First <strong>half</strong> <strong>2012</strong>of which withrel<strong>at</strong>ed partiesTotalof which withrel<strong>at</strong>ed partiesREVENUE (23)Core business revenue 1,744 1,111 1,791 1,160Other revenue and income 18 6 72 25Total revenue 1,762 1,863OPERATING COSTS (24)Purchases, services and other costs (292) (37) (328) (23)Personnel expense (170) (177)Depreci<strong>at</strong>ion, amortis<strong>at</strong>ion and impairment losses (314) (345)EBIT 986 1,013FINANCIAL INCOME (EXPENSE) (25)Financial income 1 2Financial expense (106) (98) (126) (116)Deriv<strong>at</strong>ives (40) (40) (43) (43)(145) (167)INCOME (EXPENSE) ON EQUITY INVESTMENTS (26) 28 24Equity method valu<strong>at</strong>ion effect 28 24PRE-TAX PROFIT 869 870Income taxes (27) (293) (362)Net profit 576 508Attributable to:- <strong>Snam</strong> 576 508- Minority shareholdersEarnings per share- basic (€ per share) (28) 0.17 0.15- diluted (€ per share) (28) 0.17 0.15St<strong>at</strong>ement of comprehensive income(€ million) Notes First <strong>half</strong> 2011 First <strong>half</strong> <strong>2012</strong>Net profit 576 508Other components of comprehensive incomeChange in fair value of cash flow hedge deriv<strong>at</strong>ives (effective share) 6 (54)Tax effects of the other components of comprehensive income (1) 17Total other components of comprehensive income, net of tax effect (20) 5 (37)Total comprehensive income 581 471Attributable to:- <strong>Snam</strong> 581 471- Minority shareholders581 471<strong>Snam</strong> Half - <strong>year</strong> Report <strong>2012</strong>
66<strong>Snam</strong> Condensed interim consolid<strong>at</strong>ed financial st<strong>at</strong>ements / Financial st<strong>at</strong>ementsSt<strong>at</strong>ement of changes in shareholders’ equity<strong>Snam</strong> shareholders’ equity(€ million)Share capitalConsolid<strong>at</strong>ion reserveShare premium reserveShareholders’ equity <strong>at</strong> 31 December 2010 3,570 (1,713) 1,981 418 (49) 791 904 1,106 (789) (<strong>30</strong>4) 5,915 1 5,916Transactions with shareholders:- Dividend distribution (€ 0.14 per shareto balance the 2010 interim dividend of€ 0.09 per share) (777) <strong>30</strong>4 (473) (473)- Alloc<strong>at</strong>ion of 2010 residual net profit 45 284 (329)- Capital increase for stockoption plans 1 1 1- Disposal of treasury shares for stockoption plans 5 (5) 5 5 51 5 45 (5) 284 (1,106) 5 <strong>30</strong>4 (467) (467)Comprehensive income for first <strong>half</strong> 2011 5 576 581 581Other changes in shareholders’ equity:- Impact of Italgas and Stogit acquisition 9 9 9- Difference between book value of sharessold and the strike price of stock optionsexercised by executives (1) (1) (1)9 (1) 8 8Comprehensive income for second <strong>half</strong> 2011 3,571 (1,704) 1,986 463 (44) 786 1,187 576 (784) 6,037 1 6,038Other changes in shareholders’ equity:- Impact of Italgas and Stogit acquisition (338) (338) (338)- Acquisition of business units 1 1 1- Adjustment for prepaid IRES (Robin Hood Tax)charges through increase of share capital1 (1) 1 1 12 (1) 1 (338) (336) (336)Comprehensive income for second<strong>half</strong> 2011(126) 214 88 88Other changes in shareholders’ equity:- Impact of Italgas and Stogit acquisition 3 3 3- Acquisition of business units (2) (2)- Adjustment for prepaid IRES (Robin HoodTax) charges through increase of share capital 1 13 (2) 1 2 2Shareholders’ equity <strong>at</strong> 31 December 2011 (Note 20) 3,571 (1,701) 1,988 463 (170) 783 1,188 790 (783) (338) 5,791 1 5,792Transactions with shareholders:- Dividend distribution (€ 0.14 per shareto balance the 2011 interim dividend of35 (56) (790) 338 (473) (473)€ 0.10 per share)- Reclassific<strong>at</strong>ion to share premium reserve (216) 216(216) 251 (56) (790) 338 (473) (473)Comprehensive income for first <strong>half</strong> <strong>2012</strong> (37) 508 471 471Other changes in shareholders’ equity:- Impact of Italgas and Stogit acquisition 5 5 5- Reclassific<strong>at</strong>ion to IFRS first-timeadoption reserves(19) 195 (19) 19 5 5Shareholders’ equity <strong>at</strong> <strong>30</strong> <strong>June</strong> <strong>2012</strong> (Note 20) 3,571 (1,696) 1,772 714 (207) 764 1,151 508 (783) 5,794 1 5,795Legal reserveCash flow hedge reserveOther reservesRetained earningsNet profitTreasury sharesInterim dividendTotalCapital and reserves <strong>at</strong>tributableto minority interestsTotal shareholders’ equity<strong>Snam</strong> Half - <strong>year</strong> Report <strong>2012</strong>
<strong>Snam</strong> Condensed interim consolid<strong>at</strong>ed financial st<strong>at</strong>ements / Financial st<strong>at</strong>ements67St<strong>at</strong>ement of cash flows(€ million) Notes First <strong>half</strong> 2011 First <strong>half</strong> <strong>2012</strong>Net profit 576 508Adjustments for reconciling profit for the <strong>year</strong> with cash flows from oper<strong>at</strong>ing activities:Amortis<strong>at</strong>ion and depreci<strong>at</strong>ion (24) 322 345Net impairment losses on property, plant and equipment and intangible assets (8)Equity method valu<strong>at</strong>ion effect (26) (28) (24)Net capital losses on asset sales, cancell<strong>at</strong>ions and elimin<strong>at</strong>ions 6Interest income (1) (2)Interest expense 140 161Income taxes (27) 293 362Other changes (7)Changes in working capital:- Inventories (7) 35- Trade receivables (153) (431)- Trade payables (86) 221- Provisions for risks and charges 182 12- Other assets and liabilities 80 (26)Working capital cash flows 16 (189)Change in provisions for employee benefits 1Dividends collected 29 2Interest collected 1 3Interest paid (140) (161)Income taxes paid net of reimbursed tax credits (325) (392)Net cash flows from oper<strong>at</strong>ing activities 874 614- of which with rel<strong>at</strong>ed parties (<strong>30</strong>) 985 1,136Investments:- Property, plant and equipment (492) (351)- Intangible assets (166) (142)- Companies included in the consolid<strong>at</strong>ion scope and business units 9 (26)- Change in payables and receivables rel<strong>at</strong>ing to investments (152) (186)Cash flows from investment activities (801) (705)Divestments:- Property, plant and equipment 5 27- Change in payables and receivables rel<strong>at</strong>ing to divestmentsCash flows from divestments 5 27Net cash flows from investment activities (796) (678)- of which with rel<strong>at</strong>ed parties (<strong>30</strong>) (200) (68)Taking on long-term financial debt 422 1,521Repaying long-term financial debt (320) (1,227)Increase (decrease) in short-term financial debt 283 257385 551Net equity capital injections 5Dividends paid to <strong>Snam</strong> shareholders (473) (473)Net cash flows from financing activities (83) 78- of which with rel<strong>at</strong>ed parties (<strong>30</strong>) 122 (1,224)Net cash flow for the period (5) 14Cash and cash equivalents <strong>at</strong> start of period 8 2Cash and cash equivalents <strong>at</strong> end of period 3 16<strong>Snam</strong> Half - <strong>year</strong> Report <strong>2012</strong>
68<strong>Snam</strong> Condensed interim consolid<strong>at</strong>ed financial st<strong>at</strong>ements / NotesNotes to the condensed interim consolid<strong>at</strong>ed financial st<strong>at</strong>ementsBackground inform<strong>at</strong>ion<strong>Snam</strong> is involved in the regul<strong>at</strong>ed transport<strong>at</strong>ion, storage and distribution of n<strong>at</strong>ural gas and the regasific<strong>at</strong>ion of liquefiedn<strong>at</strong>ural gas (LNG). These activities are carried out via its integr<strong>at</strong>ed infrastructure in Italy.The parent company, <strong>Snam</strong> S.p.A., is an Italian company listed on the Milan Stock Exchange, with its registered office <strong>at</strong> PiazzaSanta Barbara 7, San Don<strong>at</strong>o Milanese (MI). At <strong>30</strong> <strong>June</strong> <strong>2012</strong>, Eni S.p.A. held 52.53% 1 of the share capital of <strong>Snam</strong> S.p.A..1) Basis of present<strong>at</strong>ionThe condensed interim consolid<strong>at</strong>ed financial st<strong>at</strong>ements were prepared in accordance with IAS 34, “Interim Financial Reporting”.The financial st<strong>at</strong>ements are the same as those adopted for the annual <strong>report</strong>. In the condensed interim consolid<strong>at</strong>ed financialst<strong>at</strong>ements, the same consolid<strong>at</strong>ion principles and accounting policies have been used as those used to prepare the annual<strong>report</strong>, except for IFRSs which have entered into force since 1 January <strong>2012</strong>, described in the section of the 2011 annual <strong>report</strong>on “Accounting standards and interpret<strong>at</strong>ions issued by the IASB/IFRIC”. The notes to the financial st<strong>at</strong>ements are in condensedform.Current income taxes are calcul<strong>at</strong>ed by estim<strong>at</strong>ing the taxable income. Receivables and payables for current taxes are recognisedbased on the amount which is expected to be paid/recovered to/from the tax authorities under the prevailing tax regul<strong>at</strong>ionsor those essentially approved <strong>at</strong> the <strong>report</strong>ing d<strong>at</strong>e and the r<strong>at</strong>es estim<strong>at</strong>ed on an annual basis.<strong>Consolid<strong>at</strong>ed</strong> companies, non-consolid<strong>at</strong>ed subsidiaries, companies under joint control, associ<strong>at</strong>es and other significant equityinvestments, <strong>report</strong>ing for which is covered by Article 126 of Consob Resolution 11971 of 14 May 1999, as subsequentlyamended, are indic<strong>at</strong>ed separ<strong>at</strong>ely in the annex “Significant shareholdings, associ<strong>at</strong>es and equity investments of <strong>Snam</strong> <strong>at</strong> <strong>30</strong><strong>June</strong> <strong>2012</strong>”, which is an integral part of these notes.The condensed interim consolid<strong>at</strong>ed financial st<strong>at</strong>ements <strong>at</strong> <strong>30</strong> <strong>June</strong> <strong>2012</strong>, approved by the Board of Directors of <strong>Snam</strong> S.p.A.<strong>at</strong> its meeting of <strong>30</strong> July <strong>2012</strong>, have undergone a limited audit by Reconta Ernst & Young S.p.A.. The limited audit has a muchsmaller scope than a full audit carried out in accordance with established auditing principles.Given their size, amounts in the financial st<strong>at</strong>ements and respective notes are expressed in millions of euros.2) Use of estim<strong>at</strong>esFor a description of the use of accounting estim<strong>at</strong>es, please see the annual <strong>report</strong>.3) Recently issued IFRSRegarding the description of recently issued IFRSs, in addition wh<strong>at</strong> is provided in the annual <strong>report</strong>, the major pronouncementsof the IASB not yet approved by the European Commission are described below.On 28 <strong>June</strong> <strong>2012</strong>, the IASB issued the document “<strong>Consolid<strong>at</strong>ed</strong> Financial St<strong>at</strong>ements, Joint Arrangements and Disclosureof Interests in Other Entities: Transition Guidance (Amendments to IFRS 10, IFRS 11 and IFRS 12)” which provides someclarific<strong>at</strong>ions and simplific<strong>at</strong>ions of the transition requirements of IFRS 10, IFRS 11 and IFRS 12. The measures will takeeffect from financial <strong>year</strong>s starting on or after 1 January 2013.On 17 May <strong>2012</strong>, the IASB issued the document “Annual improvements to IFRSs 2009 – 2011 Cycle”, containing amendments,mainly technical and editorial, to the existing intern<strong>at</strong>ional accounting standards. The provisions will take effect fromfinancial <strong>year</strong>s starting on or after 1 January 2013.At present, <strong>Snam</strong> is analysing the standards mentioned and is assessing whether their adoption will have a significantimpact on the financial st<strong>at</strong>ements.1 On 18 July <strong>2012</strong>, Eni sold 5% of the share capital to institutional investors.<strong>Snam</strong> Half - <strong>year</strong> Report <strong>2012</strong>
<strong>Snam</strong> Condensed interim consolid<strong>at</strong>ed financial st<strong>at</strong>ements / Notes69Current assets4) Trade and other receivablesTrade and other receivables of €2,138 million (€1,545 million <strong>at</strong> 31 December 2011) comprise:(€ million) 31.12.2011 <strong>30</strong>.06.<strong>2012</strong>Trade receivables 1,367 1,798Financial receivables:- Held for oper<strong>at</strong>ions 2 2Other receivables 176 3381,545 2,138Receivables are <strong>report</strong>ed net of the provision for impairment losses of €39 million (the same as <strong>at</strong> 31 December 2011).The change in the provision for impairment losses on receivables during the <strong>half</strong>-<strong>year</strong> is shown below:(€ million)Balance <strong>at</strong>01.01.<strong>2012</strong>ProvisionsUtilis<strong>at</strong>ions forexcessBalance <strong>at</strong><strong>30</strong>.06.<strong>2012</strong>Trade receivables 36 1 (1) 36Other receivables 3 339 1 (1) 39Trade receivables of €1,798 million (€1,367 million <strong>at</strong> 31 December 2011) mainly refer to the n<strong>at</strong>ural gas transport<strong>at</strong>ion(€1,000 million), storage (€560 million) and distribution (€226 million) business segments.Trade receivables rel<strong>at</strong>ing to the n<strong>at</strong>ural gas transport<strong>at</strong>ion segment (€1,000 million) include receivables for n<strong>at</strong>ural gasbalancing services provided (€572 million), in applic<strong>at</strong>ion of Electricity and Gas Authority Resolution ARG/gas 45/11. Under thismeasure, the leading n<strong>at</strong>ural gas transport<strong>at</strong>ion company (<strong>Snam</strong> Rete Gas S.p.A.), takes responsibility for the overall balancingof the n<strong>at</strong>ural gas transport<strong>at</strong>ion system, procures the necessary storage resources to cover imbalances for individual usersand provides for the adjustment of the balance of income st<strong>at</strong>ement entries. In every case the regul<strong>at</strong>ions stipul<strong>at</strong>e th<strong>at</strong> theneutrality of the company responsible for balancing must be guaranteed. Specifically, the current regul<strong>at</strong>ions also stipul<strong>at</strong>e th<strong>at</strong>,if costs arise in rel<strong>at</strong>ion to non-recoverable receivables due to insolvency of users of balancing not covered by the guaranteesystem, <strong>Snam</strong> Rete Gas must notify the Authority, which then defines the procedures for recovery via a special fee. To this end,Resolution ARG/gas 155/11, in rel<strong>at</strong>ion to economic items th<strong>at</strong> have arisen within the system of balance of economic meritsince 1 December 2011, stipul<strong>at</strong>es th<strong>at</strong> the company responsible for balancing to will receive from the Electricity Equalis<strong>at</strong>ionFund the value of unpaid receivables between the end of the month following the month of notific<strong>at</strong>ion 2 .For the storage business segment in particular, trade receivables (€560 million) mainly rel<strong>at</strong>e to fees charged on the use, byusers, of str<strong>at</strong>egic gas (gas not replenished by those users according to the terms of the Storage Code) which, when collectedaccording to the regul<strong>at</strong>ory framework in force, will be paid into the Electricity Equalis<strong>at</strong>ion Fund. Considering the currentregul<strong>at</strong>ory framework (Resolution ARG/gas 119/10, Article 10, paragraph 5 in Annex A) which leaves the storage companyin a neutral position with regard to the effects of the withdrawal of str<strong>at</strong>egic gas by users, against credits for the use of2 The company responsible for balancing will deliver the notific<strong>at</strong>ion, four months after expiry of the unpaid invoices.<strong>Snam</strong> Half - <strong>year</strong> Report <strong>2012</strong>
70<strong>Snam</strong> Condensed interim consolid<strong>at</strong>ed financial st<strong>at</strong>ements / Notesstr<strong>at</strong>egic gas not replenished, the recognition of a liability of equal amount was provided 3 .During the first <strong>half</strong> of <strong>2012</strong>, transfers of trade receivables without recourse or notific<strong>at</strong>ion, including not due, were assumed inthe nominal amount of €117 million with an increase of cash equivalents by the same amount. The transfer concerned tradereceivables rel<strong>at</strong>ing to the n<strong>at</strong>ural gas transport<strong>at</strong>ion segment. By virtue of the contractual provisions agreed, <strong>Snam</strong> providesfor the cash management of the receivables transferred and, within the limits of these, the transfer of the amounts receivedto the factoring company.Other receivables of €338 million (€176 million <strong>at</strong> 31 December 2011) comprise:(€ million) 31.12.2011 <strong>30</strong>.06.<strong>2012</strong>- IRES receivables for the n<strong>at</strong>ional tax consolid<strong>at</strong>ion scheme 35 115- Receivables from investment/divestment activities 41 49- Group VAT credit 4 1Other receivables:- Electricity Equalis<strong>at</strong>ion Fund 26 95- VAT advance 26- Advances to suppliers 26 19- Other 18 5996 173176 338IRES receivables for the n<strong>at</strong>ional tax consolid<strong>at</strong>ion scheme (€115 million) concern: (i) gre<strong>at</strong>er allowances of tax paid (€105million); and (ii) receivables with the parent company Eni (€10 million) rel<strong>at</strong>ing to the IRES refund request for 10% of theregional production tax (IRAP) for the 2004, 2005, 2006 and 2007 tax <strong>year</strong>s (pursuant to Article 6 of Legisl<strong>at</strong>ive Decree 185 of28 November 2008, enacted by Law 2 of 28 January 2009).Receivables from investment/divestment activities (€49 million) concern receivables for priv<strong>at</strong>e grants entered againstinvestment activities (€20 million) and from divestments of property, plant and equipment and intangible assets (€29 million).Receivables from the Electricity Equalis<strong>at</strong>ion Fund (€95 million) mainly concern: (i) receivables for energy efficiency certific<strong>at</strong>es 4(€59 million); and (ii) additional tariff components in the n<strong>at</strong>ural gas distribution segment (€36 million).The residual item, “Other” (€59 million), mainly refers to: (i) receivables for dividends to be received (€<strong>30</strong> million) rel<strong>at</strong>ing toequity particip<strong>at</strong>ions under joint control in the n<strong>at</strong>ural gas distribution segment; and (ii) receivables from public authorities(13 million).The fair value measurement of trade and other receivables has no m<strong>at</strong>erial impact considering the short period of time fromwhen the receivable arises and its due d<strong>at</strong>e.All receivables are in Euros. Receivables from rel<strong>at</strong>ed parties are described in Note <strong>30</strong>, “Rel<strong>at</strong>ed-party transactions”.3 With regard to withdrawals by Stogit users of str<strong>at</strong>egic gas not replenished by these users within the deadlines stipul<strong>at</strong>ed in the Storage Code, <strong>Snam</strong>has been taking action, including legal action, against these parties since 2011.Specifically, the Company has requested and obtained two injunctions for recovery of the sums owed (for one of these, in opposition proceedings,provisional execution has been granted), initi<strong>at</strong>ed ordinary proceedings to obtain an injunction for payment and launched summary proceedings for thereplenishment of the gas withdrawn, for which the judgement of merit is under way.4 Legisl<strong>at</strong>ive Decree 164 of 23 May 2000 stipul<strong>at</strong>es th<strong>at</strong> n<strong>at</strong>ural gas distribution firms set consumption reduction and energy savings targets to be metthrough raising energy efficiency, and th<strong>at</strong> they are awarded Energy Efficiency Certific<strong>at</strong>es (established by the Ministerial Decrees of 20 July 2004)depending on the results achieved. The energy efficiency targets can be met either by implementing energy efficiency policies or by purchasingcertific<strong>at</strong>es from other parties. Once the energy efficiency target is met, cancelling the excess certific<strong>at</strong>es triggers repayment by the ElectricityEqualis<strong>at</strong>ion Fund on the basis of dedic<strong>at</strong>ed funds built up through distribution tariff increases.<strong>Snam</strong> Half - <strong>year</strong> Report <strong>2012</strong>
<strong>Snam</strong> Condensed interim consolid<strong>at</strong>ed financial st<strong>at</strong>ements / Notes715) InventoriesInventories of €240 million (€235 million <strong>at</strong> 31 December 2011) are analysed in the table below:31.12.2011 <strong>30</strong>.06.<strong>2012</strong>(€ million)GrossamountImpairmentlossesNet amountGrossamountImpairmentlosses Net amount ChangeRaw m<strong>at</strong>erials, consumables and supplies 194 (6) 188 212 (6) 206 18Finished products and merchandise 47 47 34 34 (13)241 (6) 235 246 (6) 240 5Inventories of raw m<strong>at</strong>erials, consumables and supplies (€206 million) primarily include: (i) n<strong>at</strong>ural gas used for transport<strong>at</strong>ionactivities (€137 million); and (ii) stock m<strong>at</strong>erials rel<strong>at</strong>ing to the pipeline network (€39 million) and the distribution network(€20 million).The inventories of finished products and merchandise (€34 million) refer to the n<strong>at</strong>ural gas present in the storage system(422 million standard cubic metres; 585 million standard cubic metres <strong>at</strong> 31 December 2011) and do not include compulsoryinventories, recognised under non-current assets on the balance sheet.Inventories are st<strong>at</strong>ed net of the provision for impairment losses of €6 million (unchanged from 31 December 2011), set upto account for slow-moving m<strong>at</strong>erials.Inventories are not coll<strong>at</strong>eralised. Inventories do not secure liabilities, nor are they recognised <strong>at</strong> net realis<strong>at</strong>ion value.6) Other current assetsOther current assets of €46 million (€33 million <strong>at</strong> 31 December 2011) comprise:(€ million) 31.12.2011 <strong>30</strong>.06.<strong>2012</strong>Accrued income from regul<strong>at</strong>ed activities 11 1211 12Other current assets:- Prepayments 22 3422 3433 46Accrued income from regul<strong>at</strong>ed activities of €12 million rel<strong>at</strong>es to: (i) penalties for the 2007-2008 thermal <strong>year</strong> under theResolution ARG/gas 27/10, repaid to users of the transport<strong>at</strong>ion service during 2011 and to be recovered by tariff adjustment(€7 million); (ii) the current portion (€5 million) of assets recorded against the recognition by the Electricity and Gas Authority,of additional expenses borne during the second regul<strong>at</strong>ory period (1 October 2005 - 31 December 2009) for the purchase offuel gas used in the transport<strong>at</strong>ion business 5 .Prepayments of €34 million mainly refer to (i) the current portion of repayments on up-front fees rel<strong>at</strong>ing to the mand<strong>at</strong>e forthe structuring and underwriting of a pool loan of €11 billion, and to up-front fees and substitute tax owned to lending banks5 The recognition of such assets follows Resolutions VIS 8/09, ARG/gas 184/09 and ARG/gas 218/10, whereby the Electricity and Gas Authority recognisedthe additional expenses borne by the Company respectively in the 2005-2006 and 2006-2007 thermal <strong>year</strong>s (€45 million overall), the 2007-2008thermal <strong>year</strong> (€34 million) and the period from 1 October 2008 - 31 December 2009 (€55 million). Pursuant to Article 6 of Resolution ARG/gas184/09, the recognition of the additional costs is subject to equalis<strong>at</strong>ion with the users through tariff adjustment: (i) from 1 January 2010 for theadditional costs sustained in thermal <strong>year</strong>s 2005-2006, 2006-2007 and 2007-2008; and (ii) from 1 January 2011 for the additional costs sustained bythe Company in the period 1 October 2008 - 31 December 2009.<strong>Snam</strong> Half - <strong>year</strong> Report <strong>2012</strong>
72<strong>Snam</strong> Condensed interim consolid<strong>at</strong>ed financial st<strong>at</strong>ements / Notesrel<strong>at</strong>ing to the granting of a revolving credit line of €1.5 billion expiring on 31 July 2016 (€23 million) 6 ; and (ii) equalis<strong>at</strong>ion,to be received in kind from users of the n<strong>at</strong>ural gas transport<strong>at</strong>ion service, calcul<strong>at</strong>ed as the difference between the quantitiesof fuel gas used in 2010 to carry out the service and the quantities alloc<strong>at</strong>ed by users in the same <strong>year</strong>, pursuant to ResolutionARG/gas 184/09 (€8 million).Non-current Assets7) Property, plant and equipmentProperty, plant and equipment of €14,234 million (€14,053 million <strong>at</strong> 31 December 2011) comprise:(€ million)Gross amount <strong>at</strong> 31.12.2011Provisions for amortis<strong>at</strong>ion,depreci<strong>at</strong>ion and impairmentlosses <strong>at</strong> 31.12.2011Net amount <strong>at</strong> 31.12.2011InvestmentsDepreci<strong>at</strong>ion, amortis<strong>at</strong>ion andimpairment lossesDisposalsOther changesNet amount <strong>at</strong> <strong>30</strong>.06.<strong>2012</strong>Gross amount <strong>at</strong> <strong>30</strong>.06.<strong>2012</strong>Provisions for amortis<strong>at</strong>ion,depreci<strong>at</strong>ion and impairmentlosses <strong>at</strong> <strong>30</strong>.06.<strong>2012</strong> (*)Property, plant and equipment 19,476 (5,423) 14,053 356 (255) (3) 83 14,234 19,925 (5,691)(*) Of which €7 million in the provision for impairment losses.Investments during the period amounted to €356 7 million (€488 million in the first <strong>half</strong> of 2011) and mainly refer to then<strong>at</strong>ural gas transport<strong>at</strong>ion (€292 million) and storage (€61 million) business segments.Other changes (€83 million) rel<strong>at</strong>e essentially to: (i) revised estim<strong>at</strong>es of the cost for dismantling and restor<strong>at</strong>ion of n<strong>at</strong>uralgas storage sites (+€63 million) owing to lower expected discount r<strong>at</strong>es; (ii) the reclassific<strong>at</strong>ion (+€25 million) of the item“Non-current assets held for sale” of a property complex owned by Italgas; (iii) the change in the stock of pipes purchased forinvestment and not yet employed in the construction of plants (+€7 million); and (iv) grants for the period (-€12 million).Contractual commitments for the purchase of property, plant and equipment, and the goods and services rel<strong>at</strong>ed to theirconstruction, are disclosed in Note 22, “Guarantees, commitments and risks”.6 Up-front fees and substitute tax are to be regarded as “Transaction costs” pursuant to IAS 39; the rel<strong>at</strong>ive charges are spread throughout the (expected)life of the financial instrument. Inform<strong>at</strong>ion on the debt refinancing is provided in the section “Highlights - Key events in the first <strong>half</strong> of <strong>2012</strong>” in thedirector’s <strong>report</strong>.7 For further inform<strong>at</strong>ion on investments for the period, see the “Business segment oper<strong>at</strong>ing performance” section of the directors’ <strong>report</strong>.<strong>Snam</strong> Half - <strong>year</strong> Report <strong>2012</strong>
<strong>Snam</strong> Condensed interim consolid<strong>at</strong>ed financial st<strong>at</strong>ements / Notes73Property, plant and equipment by business segmentProperty, plant and equipment are broken down by business segment as follows:(€ million) 31.12.2011 <strong>30</strong>.06.<strong>2012</strong>Gross property, plant and equipmentBusiness segments- Corpor<strong>at</strong>e 12- Transport<strong>at</strong>ion 16,225 16,498- Regasific<strong>at</strong>ion 128 128- Storage 2,643 2,766- Distribution 480 521Total 19,476 19,925Provision for amortis<strong>at</strong>ion, depreci<strong>at</strong>ion and impairment losses- Corpor<strong>at</strong>e (10)- Transport<strong>at</strong>ion (4,470) (4,672)- Regasific<strong>at</strong>ion (39) (42)- Storage (659) (687)- Distribution (255) (280)Total (5,423) (5,691)Net property, plant and equipment- Corpor<strong>at</strong>e 2- Transport<strong>at</strong>ion 11,755 11,826- Regasific<strong>at</strong>ion 89 86- Storage 1,984 2,079- Distribution 225 24114,053 14,2348) Intangible assetsIntangible assets of €4,493 million (€4,444 million <strong>at</strong> 31 December 2011) comprise:(€ million)Gross amount <strong>at</strong> 31.12.2011Provisions for amortis<strong>at</strong>ion,depreci<strong>at</strong>ion and impairmentlosses <strong>at</strong> 31.12.2011Net amount <strong>at</strong> 31.12.2011InvestmentsAmortis<strong>at</strong>ion, depreci<strong>at</strong>ion andimpairment lossesDisposalsOther changesNet amount <strong>at</strong> <strong>30</strong>.06.<strong>2012</strong>Gross amount <strong>at</strong> <strong>30</strong>.06.<strong>2012</strong>Provisions for amortis<strong>at</strong>ion,depreci<strong>at</strong>ion and impairmentlosses <strong>at</strong> <strong>30</strong>.06.<strong>2012</strong>Intangible assets:- With a finite useful life 7,784 (3,349) 4,435 168 (90) (24) (5) 4,484 7,885 (3,401)- With an indefinite useful life 9 9 9 9(*) Including impairment losses of €1 million.7,793 (3,349) 4,444 168 (90) (24) (5) 4,493 7,894 (3,401)<strong>Snam</strong> Half - <strong>year</strong> Report <strong>2012</strong>
74<strong>Snam</strong> Condensed interim consolid<strong>at</strong>ed financial st<strong>at</strong>ements / NotesIntangible assets with a finite useful life (€4,484 million) mainly concern: (i) assets recognised in rel<strong>at</strong>ion to concessionagreements pursuant to IFRIC 12 rel<strong>at</strong>ing to the n<strong>at</strong>ural gas distribution business segment (€3,659 million); and (ii) concessionsfor n<strong>at</strong>ural gas storage (€655 million).Indefinite useful-life intangible assets consist only of goodwill recognised following the acquisition by Italgas of 100% of theshares of Siciliana Gas (€9 million).For the purposes of calcul<strong>at</strong>ing recoverable value, goodwill has been alloc<strong>at</strong>ed to the cash-gener<strong>at</strong>ing unit consisting of n<strong>at</strong>uralgas distribution activities. The recoverable amount of the cash-gener<strong>at</strong>ing unit was estim<strong>at</strong>ed by equity/income type valu<strong>at</strong>ionswith reference to the value of the asset recognised for tariff purposes (RAB – regul<strong>at</strong>ed asset base), as well as to additionalincome components deriving from the regul<strong>at</strong>ion, and is gre<strong>at</strong>er than the carrying amount of the cash-gener<strong>at</strong>ing unit.Investments in intangible assets of €168 million (€193 million in the first <strong>half</strong> of 2011) rel<strong>at</strong>e to: (i) the construction and upgradingof n<strong>at</strong>ural gas distribution infrastructure (€155 million); and (ii) internal projects for IT system development (€13 million).Other changes (-€5 million) rel<strong>at</strong>e essentially to: (i) grants for the period (-€26 million); (ii) the reclassific<strong>at</strong>ion to the item“Assets held for sale” of some assets (-€10 million) of n<strong>at</strong>ural gas distribution segment; and (iii) business units acquiredor arising from re-adjudic<strong>at</strong>ed tender procedures (€31 million) rel<strong>at</strong>ing mainly to gas distribution infrastructure in themunicipalities of Cernusco sul Naviglio and Sulmona.Existing contractual commitments for the purchase of intangible assets, and of services rel<strong>at</strong>ed to their development, aredisclosed in Note 22, “Guarantees, commitments and risks”.9) Equity-accounted investmentsEquity-accounted investments of €310 million (€319 million <strong>at</strong> 31 December 2011) refer to equity investments in thedistribution business segment and are broken down as follows:<strong>30</strong>.06.<strong>2012</strong>(€ million)Opening valueCapital gains frommeasurement usingthe equity methodChange inconsolid<strong>at</strong>ion scopeDecrease owing todividendsClosing valueEquity-accounted investments 319 24 (1) (32) 310319 24 (1) (32) 310Capital gains from measurement using the equity method of €24 million mainly rel<strong>at</strong>e to Azienda Energia e Servizi TorinoS.p.A. (€15 million) and Toscana Energia S.p.A. (€8 million).Investments in subsidiaries, jointly controlled entities and associ<strong>at</strong>es can be found in the annex “Significant shareholdings,associ<strong>at</strong>es and equity investments of <strong>Snam</strong> <strong>at</strong> <strong>30</strong> <strong>June</strong> <strong>2012</strong>”, which is an integral part of these notes.10) Other non-current assetsOther non-current assets of €100 million (€81 million <strong>at</strong> 31 December 2011) break down as follows:(€ million) 31.12.2011 <strong>30</strong>.06.<strong>2012</strong>Accrued income from regul<strong>at</strong>ed activities 66 76Other non-current assets:- Prepayments 6 16- Security deposits 6 6- Other assets 3 215 2481 100<strong>Snam</strong> Half - <strong>year</strong> Report <strong>2012</strong>
<strong>Snam</strong> Condensed interim consolid<strong>at</strong>ed financial st<strong>at</strong>ements / Notes75Accrued income from regul<strong>at</strong>ed activities of €76 million mainly reflects the non-current portion (€67 million) of loweramounts invoiced in rel<strong>at</strong>ion to the n<strong>at</strong>ural gas transport<strong>at</strong>ion service compared with the limit set by the Electricity and GasAuthority.Prepayments (€16 million) refer mainly to the non-current portion of prepayments rel<strong>at</strong>ing to up-front fees and substitutetax owed to the lending banks 8 .11) Assets held for saleAssets held for sale of €12 million (€25 million <strong>at</strong> 31 December 2011) mainly refer to plants rel<strong>at</strong>ing to n<strong>at</strong>ural gas distributionconcessions (€10 million) for which was signed, starting on 1 July <strong>2012</strong>, the contract of sale to the successor contractor th<strong>at</strong>won the call for tenders pursuant to Legisl<strong>at</strong>ive Decree 164/2000.In the first <strong>half</strong> of <strong>2012</strong>, respective amounts of €25 million and €9 million were reclassified to the items “Property, plant andequipment” and “Provisions for risks and charges”.Current liabilities12) Short-term financial liabilitiesShort-term financial liabilities of €3,044 million (€2,787 million <strong>at</strong> 31 December 2011) are denomin<strong>at</strong>ed entirely in euros andrel<strong>at</strong>e credit lines with Eni S.p.A..Short-term financial liabilities comprise only flo<strong>at</strong>ing-r<strong>at</strong>e loans. The weighted average interest r<strong>at</strong>e on short-term financialliabilities is 0.63% and 1.17% for the first <strong>half</strong> of 2011 and the first <strong>half</strong> of <strong>2012</strong>, respectively.The market value of short-term financial liabilities is the same as their book value.At <strong>30</strong> <strong>June</strong> <strong>2012</strong>, there were no breaches of loan agreements.13) Trade and other payablesTrade and other payables of €1,567 million (€1,344 million <strong>at</strong> 31 December 2011) comprise:(€ million) 31.12.2011 <strong>30</strong>.06.<strong>2012</strong>Trade payables 556 777Payables for investments 486 <strong>30</strong>8Other payables <strong>30</strong>2 4821,344 1,567Trade payables of €777 million (€556 million <strong>at</strong> 31 December 2011) mainly refer mainly to the n<strong>at</strong>ural gas transport<strong>at</strong>ion(€512 million), distribution (€194 million) and corpor<strong>at</strong>e (€61 million) business segments.Payables for investment activities of €<strong>30</strong>8 million (€486 million <strong>at</strong> 31 December 2011) refer mainly to the n<strong>at</strong>ural gastransport<strong>at</strong>ion (€175 million), distribution (€53 million) and storage (€48 million) business segments.8 For further inform<strong>at</strong>ion, see Note 6, “Other current assets”.<strong>Snam</strong> Half - <strong>year</strong> Report <strong>2012</strong>
76<strong>Snam</strong> Condensed interim consolid<strong>at</strong>ed financial st<strong>at</strong>ements / NotesOther payables of €482 million (€<strong>30</strong>2 million <strong>at</strong> 31 December 2011) break down as follows:(€ million) 31.12.2011 <strong>30</strong>.06.<strong>2012</strong>Payables for n<strong>at</strong>ional tax consolid<strong>at</strong>ion scheme 19 176Payables for Group VAT 20 25Other payables:- Payables to the Electricity Equalis<strong>at</strong>ion Fund 141 150- Payables to employees 51 36- Payables to pension and social security institutions 23 26- Payments on account and advances 5 25- Payables to the government 20 14- Other 23 <strong>30</strong>263 281<strong>30</strong>2 482Payables to the Electricity Equalis<strong>at</strong>ion Fund (€150 million) concern accessory tariff components th<strong>at</strong> mainly rel<strong>at</strong>e to: (i) thetransport<strong>at</strong>ion business segment (special tariffs for gas sector customers experiencing hardship and measures and steps forenergy savings and the development of renewable sources in the n<strong>at</strong>ural gas sector, interruptibility fees and regional networkcapacity fees), pursuant to Electricity and Gas Authority Resolutions ARG/com 93/10 and ARG/gas 177/10, 277/07 and 45/07(€100 million); (ii) to the storage segment (coverage of the equalis<strong>at</strong>ion imbalances account), pursuant to Resolution 50/06(€33 million); and (iii) the distribution segment (energy savings, gas service quality, equalis<strong>at</strong>ion imbalances and disadvantagedcustomers), mainly pursuant to Resolution ARG/gas 159/08 (€16 million).Payables to the government (€14 million) primarily involve payables to municipalities for concession fees for the distributionbusiness.The fair value measurement of trade and other payables has no m<strong>at</strong>erial impact given the short period of time between whenthe payable arises and its due d<strong>at</strong>e.Note <strong>30</strong> “Rel<strong>at</strong>ed-party transactions” contains inform<strong>at</strong>ion about payables due to rel<strong>at</strong>ed parties.14) Current income tax liabilities and other current tax liabilitiesCurrent income tax liabilities of €101 million (€175 million <strong>at</strong> 31 December 2011) rel<strong>at</strong>e to the additional IRES (“Robin HoodTax”), applied to the n<strong>at</strong>ural gas transport<strong>at</strong>ion and distribution business segments (€59 million), and IRAP (€42 million).Other current tax liabilities of €13 million (€16 million <strong>at</strong> 31 December 2011) mainly rel<strong>at</strong>e to IRPEF (personal income tax)withholdings for employees (€9 million) and deferred VAT payables to be paid to public authorities (€3 million).15) Other current liabilitiesOther current liabilities of €193 million (€211 million <strong>at</strong> 31 December 2011) comprise:(€ million) 31.12.2011 <strong>30</strong>.06.<strong>2012</strong>Prepaid income from regul<strong>at</strong>ed activities 129 89Deriv<strong>at</strong>ives:- Fair value of deriv<strong>at</strong>ives 75 90- Accrued interest differentials on deriv<strong>at</strong>ives 3 878 98Other current liabilities:- Deferred and prepaid revenue and income 4 6211 193<strong>Snam</strong> Half - <strong>year</strong> Report <strong>2012</strong>
<strong>Snam</strong> Condensed interim consolid<strong>at</strong>ed financial st<strong>at</strong>ements / Notes77Prepaid income from regul<strong>at</strong>ed activities of €89 million rel<strong>at</strong>es to: (i) the n<strong>at</strong>ural gas storage business segment (€51 million) andconcerns payments for balancing and stock replenishment, which are to be returned to service users based on the provisions ofResolution 50/06 of the Electricity and Gas Authority; and (ii) the transport<strong>at</strong>ion business segment (€38 million) and concernsthe short-term portion of revenues invoiced in excess of the restriction established by the Electricity and Gas Authority, andpenalties charged to users who exceeded the committed capacity, which is to be returned through tariff adjustments pursuantto Resolution 166/05.Inform<strong>at</strong>ion on the fair value of deriv<strong>at</strong>ives <strong>at</strong> <strong>30</strong> <strong>June</strong> <strong>2012</strong> is summarised below:(€ million) 31.12.2011 <strong>30</strong>.06.<strong>2012</strong>Interest r<strong>at</strong>e agreements Assets Liabilities Assets LiabilitiesFair Value Interest R<strong>at</strong>e Swap (263) (316)Less:- Non-current share 188 226Current share (75) (90)The fair value of hedging deriv<strong>at</strong>ives, as well as their classific<strong>at</strong>ion as an asset/liability over 12 months (non-current) or anasset/liability within 12 months (current) have been determined using generally accepted financial valu<strong>at</strong>ion models andmarket prices <strong>at</strong> the balance sheet d<strong>at</strong>e.(€ million)Type of contractStart ofcontract(d<strong>at</strong>e)End ofcontract(d<strong>at</strong>e)Dur<strong>at</strong>ion(<strong>year</strong>s)Nominalvalue(€ million)Sale r<strong>at</strong>ePurchaser<strong>at</strong>eMarket value(€ million)31.12.2011 <strong>30</strong>.06.<strong>2012</strong> 31.12.2011 <strong>30</strong>.06.<strong>2012</strong>Interest r<strong>at</strong>e swap 24.11.2005 24.11.2015 10 500 500 euribor fixed r<strong>at</strong>e (44) (48)Interest r<strong>at</strong>e swap 26.03.2007 26.03.<strong>2012</strong> 5 500 euribor fixed r<strong>at</strong>e (3)Interest r<strong>at</strong>e swap <strong>30</strong>.06.2009 28.01.2016 7 700 700 euribor fixed r<strong>at</strong>e (52) (60)Interest r<strong>at</strong>e swap 02.12.2009 02.12.2013 4 350 350 euribor fixed r<strong>at</strong>e (9) (9)Interest r<strong>at</strong>e swap 02.12.2009 02.12.2015 6 200 200 euribor fixed r<strong>at</strong>e (11) (14)Interest r<strong>at</strong>e swap <strong>30</strong>.07.2010 31.07.2017 7 500 500 euribor fixed r<strong>at</strong>e (25) (38)Interest r<strong>at</strong>e swap 02.08.2010 03.08.2015 5 <strong>30</strong>0 <strong>30</strong>0 euribor fixed r<strong>at</strong>e (10) (14)Interest r<strong>at</strong>e swap 15.09.2010 15.12.<strong>2012</strong> 2 185 185 euribor fixed r<strong>at</strong>e (1) (1)Interest r<strong>at</strong>e swap 16.09.2010 16.09.2015 5 200 200 euribor fixed r<strong>at</strong>e (7) (9)Interest r<strong>at</strong>e swap 20.09.2010 9.05.<strong>2012</strong> 2 200 euribor fixed r<strong>at</strong>eInterest r<strong>at</strong>e swap 27.09.2010 28.09.<strong>2012</strong> 2 <strong>30</strong>0 <strong>30</strong>0 euribor fixed r<strong>at</strong>e (1) (1)Interest r<strong>at</strong>e swap 27.09.2010 28.09.<strong>2012</strong> 2 <strong>30</strong>0 <strong>30</strong>0 euribor fixed r<strong>at</strong>e (1) (1)Interest r<strong>at</strong>e swap <strong>30</strong>.09.2010 28.09.<strong>2012</strong> 2 <strong>30</strong>0 <strong>30</strong>0 euribor fixed r<strong>at</strong>e (1) (1)Interest r<strong>at</strong>e swap 4.10.2010 4.10.<strong>2012</strong> 2 <strong>30</strong>0 <strong>30</strong>0 euribor fixed r<strong>at</strong>e (1) (1)Interest r<strong>at</strong>e swap 4.10.2010 4.10.<strong>2012</strong> 2 <strong>30</strong>0 <strong>30</strong>0 euribor fixed r<strong>at</strong>e (1)Interest r<strong>at</strong>e swap 4.11.2010 7.05.2013 3 <strong>30</strong>0 <strong>30</strong>0 euribor fixed r<strong>at</strong>e (1) (2)Interest r<strong>at</strong>e swap 16.09.2011 16.09.2018 7 200 200 euribor fixed r<strong>at</strong>e (20) (25)Interest r<strong>at</strong>e swap <strong>30</strong>.09.2011 28.09.2018 7 500 500 euribor fixed r<strong>at</strong>e (52) (66)Interest r<strong>at</strong>e swap 19.10.2011 19.10.2016 5 <strong>30</strong>0 <strong>30</strong>0 euribor fixed r<strong>at</strong>e (27) (33)6,435 5,735 (266) (324)Neg<strong>at</strong>ive changes in the fair value deducted from shareholders’ equity in the first <strong>half</strong> of <strong>2012</strong>, net of the rel<strong>at</strong>ed tax effect,amount to €37 million (€121 million <strong>at</strong> 31 December 2011).At <strong>30</strong> <strong>June</strong> <strong>2012</strong>, <strong>Snam</strong> had 17 cash flow hedge deriv<strong>at</strong>ives in place. In the first <strong>half</strong> of <strong>2012</strong>, two deriv<strong>at</strong>ive contracts rel<strong>at</strong>edto two loans expired.<strong>Snam</strong> Half - <strong>year</strong> Report <strong>2012</strong>
78<strong>Snam</strong> Condensed interim consolid<strong>at</strong>ed financial st<strong>at</strong>ements / NotesNon-current LIABILITIES16) Long-term financial liabilities and short-term portions of long-term liabilitiesLong-term financial liabilities, including the short-term portions, of €8,706 million (€8,412 million <strong>at</strong> 31 December 2011)comprise:31.12.2011 <strong>30</strong>.06.<strong>2012</strong>(€ million)Short-termportionLong-termportionTotalShort-termportionLong-termportionTotalBanks 1,500 1,500Parents 1,612 6,800 8,412 406 6,800 7,2061,612 6,800 8,412 406 8,<strong>30</strong>0 8,706Most of <strong>Snam</strong>’s loans are contracted with Eni S.p.A.. The increase in long-term financial liabilities, including the short-termportions, is mainly due to the net balance between the disbursement (€1,500 million) and repayments (€1,200 millionrel<strong>at</strong>ing to loans with Eni). Specifically, payables to other lenders rel<strong>at</strong>e to the disbursement of two tranches of a flo<strong>at</strong>ingr<strong>at</strong>erevolving credit line falling due on 31 July 2016, for respective amounts of €1,000 million and €500 million. The loanof €500 million was converted into a fixed-r<strong>at</strong>e loan via an existing IRS (interest r<strong>at</strong>e swap) contract. This transaction,within the overall framework set out by the DPCM of 25 May <strong>2012</strong>, is part of the general debt refinancing plan establishedby <strong>Snam</strong> 9 .9 More inform<strong>at</strong>ion on <strong>Snam</strong>’s debt refinancing is provided in the section “Highlights - Key events in the first <strong>half</strong> of <strong>2012</strong>” in the director’s <strong>report</strong>.<strong>Snam</strong> Half - <strong>year</strong> Report <strong>2012</strong>
<strong>Snam</strong> Condensed interim consolid<strong>at</strong>ed financial st<strong>at</strong>ements / Notes79The breakdown of long-term financial liabilities, including the short-term portions, (€8,706 million) is as follows:(€ million)Lender Currency AmountFixed r<strong>at</strong>e (F)Flo<strong>at</strong>ingr<strong>at</strong>e (V)Type ofrepaymentDisbursementd<strong>at</strong>eM<strong>at</strong>urityd<strong>at</strong>eResidualdur<strong>at</strong>ion(<strong>year</strong>s/months)Long-term loansEni (a) € 500 F On m<strong>at</strong>urity 24.11.2005 24.11.2015 3y 5mEni (Credit line) (a) € 1,500 F Revolving (b) 24.11.2005 17.11.2014 2y 5mEni (a) € 185 F On m<strong>at</strong>urity 15.12.2005 15.12.<strong>2012</strong> 6mEni € 200 F On m<strong>at</strong>urity 18.07.2007 18.07.<strong>2012</strong> 1mEni € 350 F On m<strong>at</strong>urity 20.12.2007 14.11.2017 5y 4mEni € 400 F On m<strong>at</strong>urity 28.10.2008 14.11.2013 1y 4mEni (a) € 700 F On m<strong>at</strong>urity <strong>30</strong>.06.2009 28.01.2016 3y 7mEni (a) € <strong>30</strong>0 F On m<strong>at</strong>urity <strong>30</strong>.06.2009 28.01.2016 1y 5mEni (a) € 350 F On m<strong>at</strong>urity 02.12.2009 02.12.2013 3y 5mEni (a) € 200 F On m<strong>at</strong>urity 02.12.2009 02.12.2015 3y 7mEni (a) € 500 F On m<strong>at</strong>urity <strong>30</strong>.07.2010 31.07.2017 5y 1mEni (a) € <strong>30</strong>0 F On m<strong>at</strong>urity 02.08.2010 03.08.2015 3y 1 mEni (a) € 200 F On m<strong>at</strong>urity 16.09.2010 16.09.2015 3y 3 mEni € 400 F On m<strong>at</strong>urity 21.03.2011 20.12.2013 1y 6mEni € <strong>30</strong>0 F On m<strong>at</strong>urity 12.07.2011 12.07.2017 5yEni (a) € 200 F On m<strong>at</strong>urity 16.09.2011 16.09.2018 6y 3mEni (a) € <strong>30</strong>0 F On m<strong>at</strong>urity 19.10.2011 19.10.2017 5y 4mOther lenders (credit line) (a) € 500 F Revolving (b) 29.06.<strong>2012</strong> 31.07.2016 4y 1mTotal fixed r<strong>at</strong>e 7,385Other lenders (credit line) € 1,000 V Revolving (b) 28.06.<strong>2012</strong> 31.07.2016 4y 1mEni (c) € <strong>30</strong>0 V Amortised (d) <strong>30</strong>.12.2009 15.12.2029 17y 6mTotal flo<strong>at</strong>ing r<strong>at</strong>e 1,<strong>30</strong>0Total long-term loans 8,685Accrued expenses 218,706(a) Flo<strong>at</strong>ing-r<strong>at</strong>e loans converted by interest r<strong>at</strong>e swaps into fixed-r<strong>at</strong>e loans.(b) Revolving credit lines are those which provide for the reconstitution of the credit limit in line with repayments.(c) Borrowed from the European Investment Bank (EIB).(d) Loan to be repaid in equal instalments with a grace period.At <strong>30</strong> <strong>June</strong> <strong>2012</strong> the revolving credit lines were fully drawn (the same as <strong>at</strong> 31 December 2011). There were no breaches ofloan agreements <strong>at</strong> the <strong>report</strong>ing d<strong>at</strong>e.<strong>Snam</strong> has entered into a €<strong>30</strong>0 million loan agreement with Eni funded by the European Investment Bank (EIB), which is basedon Eni maintaining a minimum r<strong>at</strong>ing. This condition has been met.<strong>Snam</strong> Half - <strong>year</strong> Report <strong>2012</strong>
80<strong>Snam</strong> Condensed interim consolid<strong>at</strong>ed financial st<strong>at</strong>ements / NotesThe breakdown of long-term financial liabilities by type of interest r<strong>at</strong>e is as follows:31.12.2011 <strong>30</strong>.06.<strong>2012</strong>(€ million) Amount % Amount %At fixed r<strong>at</strong>e 8,112 96 7,406 85At flo<strong>at</strong>ing r<strong>at</strong>e <strong>30</strong>0 4 1,<strong>30</strong>0 158,412 100 8,706 100The market value of long-term financial liabilities, including the short-term portions, is €8,869 million and was obtained bydiscounting future cash flows using a discount r<strong>at</strong>e of between 0.37% and 1.21% (between 1.0% and 1.9% <strong>at</strong> 31 December 2011).Below are details on net financial debt showing rel<strong>at</strong>ed-party transactions:31.12.2011 <strong>30</strong>.06.<strong>2012</strong>(€ million) Current Non current Total Current Non current TotalA. Cash and cash equivalents 2 2 16 16B. Securities not held for oper<strong>at</strong>ionsC. Cash (A+B) 2 2 16 16D. Financial receivables not held for oper<strong>at</strong>ionsE. Short-term financial liabilities to banks 12 12F. Long-term financial liabilities to banks 1,500 1,500G. BondsH. Short-term financial liabilities to rel<strong>at</strong>ed parties 2,787 2,787 3,032 3,032I. Long-term financial liabilities to rel<strong>at</strong>ed parties 1,612 6,800 8,412 406 6,800 7,206L. Other short-term financial liabilitiesM. Other long-term financial liabilitiesN. Gross financial debt (E+F+G+H+I+L+M) 4,399 6,800 11,199 3,450 8,<strong>30</strong>0 11,750O. Net financial debt (N-C-D) 4,397 6,800 11,197 3,434 8,<strong>30</strong>0 11,73417) Provisions for risks and chargesProvisions for risks and charges of €614 million (€527 million <strong>at</strong> 31 December 2011) are broken down in the table below:(€ million)31.12.2011Opening balanceChanges inestim<strong>at</strong>esProvisionsIncreases due topassing of timeagainstchargesUtilis<strong>at</strong>ionsfor excessOther changes<strong>30</strong>.06.<strong>2012</strong>Provision for site dismantlement and restor<strong>at</strong>ion <strong>30</strong>6 65 6 377Provision for environmental risk and charges 63 10 1 (2) 9 81Provision for litig<strong>at</strong>ion 77 5 (7) 75Other provisions 81 5 (6) 1 81527 65 20 7 (8) (7) 10 614The provision for site dismantlement and restor<strong>at</strong>ion (€377 million) was recognised primarily due to charges which areexpected to be borne for the removal of n<strong>at</strong>ural gas storage facilities and for site restor<strong>at</strong>ion (€362 million). Changes inestim<strong>at</strong>es (€65 million) rel<strong>at</strong>e maily to revision of estim<strong>at</strong>ed costs of withdrawing from and restoring n<strong>at</strong>ural gas storage sitesdue to lower expected discount r<strong>at</strong>es (€63 million).Other changes (€10 million) rel<strong>at</strong>e mainly to the reclassific<strong>at</strong>ion (€9 million) from the item “Liabilities directly associ<strong>at</strong>ed withassets held for sale” of provisions for environmental charges on a property complex owned by Italgas.<strong>Snam</strong> Half - <strong>year</strong> Report <strong>2012</strong>
<strong>Snam</strong> Condensed interim consolid<strong>at</strong>ed financial st<strong>at</strong>ements / Notes8118) Deferred tax liabilities(€ million) 31.12.2011 Provisions Utilis<strong>at</strong>ions Other changes <strong>30</strong>.06.<strong>2012</strong>Deferred tax liabilities 1,452 4 (41) 27 1,442Prepaid tax assets (551) (24) 28 (44) (591)901 (20) (13) (17) 851Deferred tax liabilities of €851 million (€901 million <strong>at</strong> 31 December 2011) are st<strong>at</strong>ed net of offsettable deferred tax assets of€591 million (€551 million <strong>at</strong> 31 December 2011). There are no prepaid tax assets which cannot be offset.Other changes (€17 million) refer mainly to the change in the fair value of hedging deriv<strong>at</strong>ives.19) Other non-current liabilitiesOther non-current liabilities of €1,010 million (€869 million <strong>at</strong> 31 December 2011) comprise:(€ million) 31.12.2011 <strong>30</strong>.06.<strong>2012</strong>Prepaid income from regul<strong>at</strong>ed activities <strong>30</strong>6 367Deriv<strong>at</strong>ives:- Fair value of deriv<strong>at</strong>ives 188 226188 226Other non-current liabilities:- Deferred and prepaid revenue and income 317 316- Prepaid contributions for connecting to the transport<strong>at</strong>ion network 3 3- Other liabilities 55 98375 417869 1,010Prepaid income from regul<strong>at</strong>ed activities (€367 million) rel<strong>at</strong>es to: (i) the non-current portion of transport<strong>at</strong>ion revenue invoicedin excess of the restriction established by the Regul<strong>at</strong>or and penalties charged to service users th<strong>at</strong> exceeded the committedcapacity (€200 million); this amount is to be adjusted based on the provisions of Resolution 166/05 of the Electricity and GasAuthority; and (ii) the non-current portion of payments for penalties, balancing and stock replenishment (€167 million) to bereturned to service users based on the provisions of Resolution 50/06 of the Electricity and Gas Authority.Deferred and prepaid revenue and income (€316 million) refer to: (i) fees for the use of str<strong>at</strong>egic gas withdrawn and not replenishedunder the terms of the Storage Code (€297 million); and (ii) the non-current portion of the prepaid fee for the concession to usefibre-optic cables given to a telecommunic<strong>at</strong>ions oper<strong>at</strong>or (€19 million).Other liabilities (€98 million) refer mainly to the non-current portion of the adjustment, to be repaid in kind to users of then<strong>at</strong>ural gas transport<strong>at</strong>ion service, of the quantity of fuel gas used in 2011 to oper<strong>at</strong>e the service with the quantities alloc<strong>at</strong>ed byusers during the same <strong>year</strong>, pursuant to Resolution ARG/gas 184/09 (€85 million).For inform<strong>at</strong>ion about deriv<strong>at</strong>ives, see Note 15 “Other current liabilities”.<strong>Snam</strong> Half - <strong>year</strong> Report <strong>2012</strong>
82<strong>Snam</strong> Condensed interim consolid<strong>at</strong>ed financial st<strong>at</strong>ements / Notes20) Shareholders’ equityShareholders’ equity of €5,795 million <strong>at</strong> <strong>30</strong> <strong>June</strong> <strong>2012</strong> (€5,792 million <strong>at</strong> 31 December 2011) breaks down as follows:(€ million) 31.12.2011 <strong>30</strong>.06.<strong>2012</strong><strong>Snam</strong> shareholders’ equityShare capital 3,571 3,571Legal reserve 463 714Share premium reserve 1,988 1,772Consolid<strong>at</strong>ion reserve (1,701) (1,696)Cash flow hedge reserve (170) (207)Other reserves 783 764Retained earnings 1,188 1,151Net profit 790 508Less:- Treasury shares (783) (783)- Interim dividend (338)5,791 5,794Capital and reserves <strong>at</strong>tributable to minority interestsNapoletanagas 1 15,792 5,795Share capitalAt <strong>30</strong> <strong>June</strong> <strong>2012</strong>, the fully subscribed and paid-up share capital of <strong>Snam</strong> S.p.A. consisted of 3,571,187,994 ordinary shares witha nominal value of €1 (the same number as <strong>at</strong> 31 December 2011).Legal reserveThe legal reserve <strong>at</strong> <strong>30</strong> <strong>June</strong> <strong>2012</strong> was €714 million, compared with €463 million <strong>at</strong> 31 December 2011. The increase of €251million is mainly due to: (i) the alloc<strong>at</strong>ion of 5% of the profit for 2011 of parent company <strong>Snam</strong> S.p.A., pursuant to Article 24<strong>30</strong>of the Italian Civil Code (€35 million); and (ii) the reclassific<strong>at</strong>ion from the share premium reserve of the amount required tomeet the limit stipul<strong>at</strong>ed in Article 24<strong>30</strong> of the Italian Civil Code (€216 million), resolved upon by the Shareholders’ Meetingof 26 April <strong>2012</strong>.2.Share premium reserveThe share premium reserve <strong>at</strong> <strong>30</strong> <strong>June</strong> <strong>2012</strong> totalled €1,772 million (€1,988 million <strong>at</strong> 31 December 2011). The decrease of€216 million is due to the reclassific<strong>at</strong>ion to the legal reserve (€216 million).Consolid<strong>at</strong>ion reserveThe neg<strong>at</strong>ive consolid<strong>at</strong>ion reserve (€1,696 million compared with €1,701 million <strong>at</strong> 31 December 2011) includes the valuederived from the difference between the acquisition cost of the Italgas and Stogit holdings (€4,623 million, including the additionaltransaction charges and price adjustment following the agreements reached <strong>at</strong> transaction closing) and the rel<strong>at</strong>ive shareholders’equity <strong>at</strong>tributable to the Group on the transaction completion d<strong>at</strong>e (€2,004 million and€923 million, respectively, for Italgasand Stogit).<strong>Snam</strong> Half - <strong>year</strong> Report <strong>2012</strong>
<strong>Snam</strong> Condensed interim consolid<strong>at</strong>ed financial st<strong>at</strong>ements / Notes83Cash flow hedge reserve(€ million) Gross reserve Tax effect Net reserveReserve <strong>at</strong> 31 December 2011 (262) 92 (170)Transfer to income st<strong>at</strong>ement 43 (16) 27Changes in the first <strong>half</strong> of <strong>2012</strong> (97) 33 (64)Reserve <strong>at</strong> <strong>30</strong> <strong>June</strong> <strong>2012</strong> (316) 109 (207)The cash flow hedge reserve (-€207 million) includes the valu<strong>at</strong>ion, net of the rel<strong>at</strong>ed tax effect, of the fair value of cash flowhedge deriv<strong>at</strong>ives rel<strong>at</strong>ing to interest r<strong>at</strong>e swaps used by the Company to convert flo<strong>at</strong>ing-r<strong>at</strong>e loans into fixed-r<strong>at</strong>e loans.Other reservesOther reserves of €764 million (€783 million <strong>at</strong> 31 December 2011) rel<strong>at</strong>e to the reserve cre<strong>at</strong>ed against the cost of192,553,051 treasury shares. The reduction of €19 million refers to the reclassific<strong>at</strong>ion to the retained earnings reserve ofthe amount of the available balances rel<strong>at</strong>ing to the first adoption of the IFRSs after implement<strong>at</strong>ion of Decree Law 38/2005.Retained earningsRetained earnings totalled €1,151 million (€1,188 million <strong>at</strong> 31 December 2011) and decreased by €37 million, due essentiallyto the payment of the balance of the dividend for 2011 (€56 million).Treasury sharesAt <strong>30</strong> <strong>June</strong> <strong>2012</strong>, <strong>Snam</strong> had a total of 192,553,051 treasury shares (unchanged from 31 December 2011), equivalent to 5.39%of its share capital. The total cost was €783 million, corresponding to an average unit purchase price of €4.06.At <strong>30</strong> <strong>June</strong> <strong>2012</strong>, the company had commitments to grant 3,003,351 shares under stock option plans.The market value of the treasury shares <strong>at</strong> the end of the first <strong>half</strong> of <strong>2012</strong> was approxim<strong>at</strong>ely €678 million 10 .On 4 <strong>June</strong> <strong>2012</strong>, the Board of Directors of <strong>Snam</strong> S.p.A. convened the Extraordinary Shareholders’ Meeting for <strong>30</strong> and 31 July and1 August <strong>2012</strong>, in first, second and third call respectively, to resolve upon the proposed cancell<strong>at</strong>ion of treasury shares in theportfolio, after elimin<strong>at</strong>ion of the par value of the shares in issue and consequent amendments to the Articles of Associ<strong>at</strong>ion.The Extraordinary Shareholders’ Meeting held on <strong>30</strong> July approved the Board of Directors’ proposals.DividendsThe shareholders of <strong>Snam</strong> S.p.A. authorised the distribution of an ordinary dividend of €0.14 per share <strong>at</strong> the OrdinaryShareholders’ Meeting of 26 April <strong>2012</strong> to pay the balance of the interim 2011 dividend of €0.10 per share. The remainingdividend (€473 million) was paid from 24 May <strong>2012</strong>, with an ex-dividend d<strong>at</strong>e of 21 May <strong>2012</strong>.For the current <strong>year</strong>, the Board of Directors <strong>at</strong> its meeting of <strong>30</strong> July <strong>2012</strong> prepared the <strong>report</strong> in accordance with Article 2433-bis, paragraph 5 of the Italian Civil Code and, subject to the approval of the independent auditors, will be called on to authorisethe payment of an interim dividend of €0,10 per share, excluding treasury shares held on the ex-dividend d<strong>at</strong>e, to be drawnfrom <strong>2012</strong> profits with payment on 25 October <strong>2012</strong> and an ex-dividend d<strong>at</strong>e of 22 October <strong>2012</strong>.21) Other inform<strong>at</strong>ionOn <strong>30</strong> <strong>June</strong> <strong>2012</strong>, 3,151,851 options existed (unchanged compared with 31 December 2011), to acquire 3,151,851 ordinaryshares of <strong>Snam</strong>, with a nominal value of €1.10 Calcul<strong>at</strong>ed by multiplying the number of treasury shares by the period-end official price of €3.52 per share.<strong>Snam</strong> Half - <strong>year</strong> Report <strong>2012</strong>
84<strong>Snam</strong> Condensed interim consolid<strong>at</strong>ed financial st<strong>at</strong>ements / Notes22) Guarantees, commitments and risksGuarantees, commitments and risks of €5,165 million (€4,181 million <strong>at</strong> 31 December 2011) comprise:31.12.2011 <strong>30</strong>.06.<strong>2012</strong>(€ million)OtherpersonalguaranteesCommitmentsand risksTotalOtherpersonalguaranteesCommitmentsand risksTotalOther personal guarantees givenon its own be<strong>half</strong>:- Parents 65 65 73 73- Other 8 8 8 873 73 81 81CommitmentsCommitments for the purchase of goods and services 1,723 1,723 2,393 2,393Commitments to make equity investments 75 75 139 139Other 4 4 4 41,802 1,802 2,536 2,536Risks:- Third-party assets on deposit 2,<strong>30</strong>0 2,<strong>30</strong>0 2,545 2,545- Litig<strong>at</strong>ion 6 6 3 32,<strong>30</strong>6 2,<strong>30</strong>6 2,548 2,54873 4,108 4,181 81 5,084 5,165GuaranteesOther personal guarantees given on own be<strong>half</strong> of €81 million (€73 million <strong>at</strong> 31 December 2011) essentially rel<strong>at</strong>e to: (i) holdharmlessletters issued to Eni S.p.A. (€44 million) and third parties (€8 million) for sureties issued in favour of <strong>Snam</strong>, mainlyperformance bonds and to particip<strong>at</strong>e in tenders; (ii) hold-harmless letters issued to Eni S.p.A. (€23 million) for guaranteesissued in favour of <strong>Snam</strong> for equity investments and concessions rel<strong>at</strong>ing to the n<strong>at</strong>ural gas distribution service; and (iii)guarantees issued to the Municipality of San Don<strong>at</strong>o Milanese (€4 million) to cover the commitments deriving from a projectto construct a property complex in San Don<strong>at</strong>o Milanese for office use.CommitmentsAt <strong>30</strong> <strong>June</strong> <strong>2012</strong>, commitments with suppliers to purchase property, plant and equipment and provide services rel<strong>at</strong>ing toinvestments in property, plant and equipment and intangible assets under construction totalled €2,393 million (€1,723million <strong>at</strong> 31 December 2011).Commitments to make equity investments (€139 million) refer to: (i) the joint agreement between <strong>Snam</strong> and Fluxys G withEni (€75 million) for the purchase from Eni of 16.41% of Interconnector (UK) Ltd, the owner and oper<strong>at</strong>or of the underw<strong>at</strong>erpipeline linking the United Kingdom (Bacton) and Belgium (Zeebrugge), of 51% of Interconnector Zeebrugge Terminal SCRL,which includes the terminal and compression plants th<strong>at</strong> link the Interconnector pipeline with the gas transport<strong>at</strong>ion systemin Belgium, and of 10% in Huber<strong>at</strong>or S.A., a company controlled by Fluxys G and oper<strong>at</strong>or of the gas trading hub <strong>at</strong> Zeebrugge.The transaction involves the two purchasers acquiring the aforesaid investments in equal shares, for a total consider<strong>at</strong>ion of€150 million. Completion of the transaction is scheduled for the second <strong>half</strong> of <strong>2012</strong>, pending authoris<strong>at</strong>ion by the relevantauthorities; and (ii) the joint agreement between <strong>Snam</strong> and Fluxys G to purchase (€64 million), on an equal basis, 15.09% ofE.ON’s holding in Interconnector UK. The transaction is scheduled for completion by the end of <strong>2012</strong>, for €127 million in total.<strong>Snam</strong> Half - <strong>year</strong> Report <strong>2012</strong>
<strong>Snam</strong> Condensed interim consolid<strong>at</strong>ed financial st<strong>at</strong>ements / Notes85RisksRisks rel<strong>at</strong>ed to third-party assets on deposit, equal to €2,545 million (€2,<strong>30</strong>0 million <strong>at</strong> 31 December 2011) rel<strong>at</strong>e to about 6.7billion cubic metres of n<strong>at</strong>ural gas deposited in the storage plants by customers of the service. This amount was determined byapplying the estim<strong>at</strong>ed unit repurchase cost of approxim<strong>at</strong>ely €0.38 per standard cubic metre to the quantities of gas deposited.Litig<strong>at</strong>ion risks (€3 million) refer to possible but not probable litig<strong>at</strong>ion charges rel<strong>at</strong>ing to legal disputes.Liquidity riskFuture payments for financial liabilities, trade and other payablesThe table below shows the amounts of payments contractually owed for financial payables, including interest payments, andthe timing of expenditure rel<strong>at</strong>ed to trade and miscellaneous payables.Year of m<strong>at</strong>urity(€ million) <strong>2012</strong> 2013 2014 2015 2016 Over 2016 TotalFinancial liabilitiesLong-term financial liabilities 385 1,150 1,500 1,220 2,520 1,910 8,685Short-term financial liabilities 3,043 3,043Deriv<strong>at</strong>ive liabilities/(assets) 51 86 67 54 16 7 281Interest on financial debt 108 190 170 173 128 160 9293,587 1,426 1,737 1,447 2,664 2,077 12,938Trade and other payablesTrade payables 777 777Other payables and advances 589 5891,366 1,3664,953 1,426 1,737 1,447 2,664 2,077 14,<strong>30</strong>4Other inform<strong>at</strong>ion on financial instrumentsMarket value of financial instrumentsBelow is a comparison between the book value of long-term financial liabilities and their respective fair value. This inform<strong>at</strong>ionis not <strong>report</strong>ed for other financial assets/liabilities because the book value is almost equivalent to the fair value.31.11.2011 <strong>30</strong>.06.<strong>2012</strong>(€ million) Book value Market value Book value Market valueFinancial liabilities 8,412 8,589 8,706 8,869The market value was determined on the basis of the current value of future cash flows, using discount r<strong>at</strong>es between 0.37%and 1.21% (1.0% and 1.9% <strong>at</strong> 31 December 2011). This inform<strong>at</strong>ion is not <strong>report</strong>ed for other financial assets/liabilities becausethe book value is almost equivalent to the market value.Below is the classific<strong>at</strong>ion of financial assets and liabilities measured <strong>at</strong> fair value on the balance sheet in accordance with thefair value hierarchy defined on the basis of the significance of the inputs used in the measurement process. More specifically, inaccordance with the characteristics of the inputs used for measurement, the fair value hierarchy comprises the following levels:a) level 1: prices quoted (and not amended) on active markets for the same financial assets or liabilities;b) level 2: measurements made on the basis of inputs differing from the quoted prices referred to in the previous point, which,for the assets/liabilities submitted for measurement, are directly (prices) or indirectly (price deriv<strong>at</strong>ives) observable;c) level 3: inputs not based on observable market d<strong>at</strong>a.<strong>Snam</strong> Half - <strong>year</strong> Report <strong>2012</strong>
86<strong>Snam</strong> Condensed interim consolid<strong>at</strong>ed financial st<strong>at</strong>ements / NotesWith regard to the above, the classific<strong>at</strong>ion of the financial assets and liabilities measured <strong>at</strong> fair value on the balance sheetaccording to the fair value hierarchy concerned deriv<strong>at</strong>ive financial instruments <strong>at</strong> <strong>30</strong> <strong>June</strong> <strong>2012</strong> classified <strong>at</strong> level 2 andentered under “Other current liabilities” (€90 million) and “Other non-current liabilities” (€226 million).Litig<strong>at</strong>ion<strong>Snam</strong> is involved in civil and administr<strong>at</strong>ive proceedings and legal actions rel<strong>at</strong>ed to its normal business activities. The following isa summary of the most significant proceedings and significant changes in the situ<strong>at</strong>ion <strong>report</strong>ed in the 2011 annual <strong>report</strong>; unlessindic<strong>at</strong>ed otherwise, no alloc<strong>at</strong>ion has been made for the litig<strong>at</strong>ion described below because the company believes it improbableth<strong>at</strong> these proceedings will have an unfavourable outcome or because the amount of the alloc<strong>at</strong>ion cannot be reliably estim<strong>at</strong>ed.Criminal casesItalgas S.p.A. - Judiciary investig<strong>at</strong>ions into gas meteringIn May 2007 Italgas received notice of a local search and seizure proceeding within the framework of case no. 11183/06 RGNRbrought by the public prosecutor of the Milan district court. The document was also served upon the Chairman of the company.The charge alleged unlawful conduct starting in 2003 rel<strong>at</strong>ing to the use of gas metering equipment, the payment of exciseduties, the billing of customers and rel<strong>at</strong>ions with the supervisory authority.Among other things, the charges rel<strong>at</strong>e to offences established in Legisl<strong>at</strong>ive Decree 231 of 8 <strong>June</strong> 2001, which provides foradministr<strong>at</strong>ive liability of a company for crimes committed by its employees in the interest or to the advantage of the company itself.In December 2010 a notice of conclusion of preliminary investig<strong>at</strong>ions was received rel<strong>at</strong>ing only to the specific m<strong>at</strong>terof using Venturi-type metering equipment installed in various Milan municipalities, <strong>at</strong> the connection st<strong>at</strong>ions between then<strong>at</strong>ional n<strong>at</strong>ural gas transport<strong>at</strong>ion networks and the local n<strong>at</strong>ural gas distribution networks. It should be noted th<strong>at</strong> the publicprosecutor of Milan presented (under the scope of case no. 11183/06) a Request for Dismissal.At the same time it was learnt th<strong>at</strong> the Milan public prosecutor transferred the jurisdiction of the prosecution rel<strong>at</strong>ing to themetering systems installed in the province of Monza (alleged viol<strong>at</strong>ion pursuant to Article 472 of the Italian Criminal Code) tothe Monza public prosecutor. Lastly, the Judge for the preliminary investig<strong>at</strong>ions <strong>at</strong> the Court of Monza extended the term forthe preliminary investig<strong>at</strong>ions (criminal case no. 14477/10 RGNR).On 14 <strong>June</strong> <strong>2012</strong>, following an applic<strong>at</strong>ion filed by the public prosecutor the preliminary investig<strong>at</strong>ions judge <strong>at</strong> the Milandistrict court dismissed the case against the then Chairman of the company concerning the use of Venturi-type meteringequipment installed in various Milan municipalities, whilst <strong>at</strong> the same time providing for the documents to be sent to thePrefecture of Milan, which was responsible for issuing administr<strong>at</strong>ive fines. The preliminary investig<strong>at</strong>ions judge also providedfor the aforementioned metering lines to be released from seizure.The company is cooper<strong>at</strong>ing with the appropri<strong>at</strong>e authorities in this investig<strong>at</strong>ion.<strong>Snam</strong> Rete Gas S.p.A. - Tresana incidentThe public prosecutor <strong>at</strong> the Massa district court has initi<strong>at</strong>ed criminal proceedings against unknown persons in rel<strong>at</strong>ion to anincident th<strong>at</strong> occurred on 18 January <strong>2012</strong> in the Municipality of Tresana (MS). Specifically, the event in question was a fireresulting from a gas leak, presumably caused by a broken dielectric fitting. The fire resulted in the de<strong>at</strong>h of a manual worker whowas working for the contracting company and injuries to ten people, as well as damage to houses and possessions.The part of the plant affected by the fire and the surrounding area have been seized following an order from the PublicProsecutor <strong>at</strong> the Massa district court, who has also appointed a court expert witness. <strong>Snam</strong> Rete Gas has appointed its ownparty expert witnesses.The activities of the court expert witness and the party expert witnesses are in progress and theories on the causes of the firehave not yet been formul<strong>at</strong>ed.It should also be pointed out th<strong>at</strong>, obviously without prejudice to the ascertainment of liability, <strong>Snam</strong> Rete Gas has alreadytaken action to s<strong>at</strong>isfy, via its insurance company, the initial demands made by the Municipal Council in question and thepriv<strong>at</strong>e parties involved.<strong>Snam</strong> Half - <strong>year</strong> Report <strong>2012</strong>
<strong>Snam</strong> Condensed interim consolid<strong>at</strong>ed financial st<strong>at</strong>ements / Notes87<strong>Snam</strong> Rete Gas S.p.A. – Criminal proceeding No. 7448/11R.G.R.N.The preliminary investig<strong>at</strong>ions judge <strong>at</strong> the Florence district court has set a d<strong>at</strong>e of 4 July <strong>2012</strong> for the preliminary hearing in rel<strong>at</strong>ionto the proceeding pursuant to Article 589 of the Italian Criminal Code in connection with the de<strong>at</strong>h of a farmer on his property inLastra a Signa (FI) on 20 July 2008.This hearing was subsequently postponed until 27 September <strong>2012</strong>.According to the findings of the public prosecutor upon the conclusion of the preliminary investig<strong>at</strong>ions, the incident th<strong>at</strong> causedthe de<strong>at</strong>h was the result of a failure by certain <strong>Snam</strong> Rete Gas managers and employees <strong>at</strong> the time to comply with the technicalregul<strong>at</strong>ions for affixing and maintaining signs around the n<strong>at</strong>ural gas transport<strong>at</strong>ion pipeline.Competition AuthorityItalgas - Investig<strong>at</strong>ion of the gas distribution sector in ItalyThrough measures taken on 14 December 2011, the Competition Authority concluded the investig<strong>at</strong>ion launched against Italgasto determine the existence of an abuse of dominant position involving the alleged obstruction of the municipalities of Romeand Todi in the prepar<strong>at</strong>ion of the calls for tenders for the contracting of the gas distribution service. Though these measures, theCompetition Authority issued Italgas with a fine of around €5 million. The Competition Authority accuses Italgas of having been l<strong>at</strong>ein supplying some of the inform<strong>at</strong>ion requested by the municipalities of Rome and Todi and of having completely refused to supplysome inform<strong>at</strong>ion, particularly certain sections of the tariff schedule and, in rel<strong>at</strong>ion to the municipality of Todi, also d<strong>at</strong>a on priv<strong>at</strong>econtributions to the network. The Company had made sufficient provisions for risks and charges.Italgas has appealed to the administr<strong>at</strong>ive court against the measures. A d<strong>at</strong>e of 20 February 2013 has been set for the hearing onthe merits of the case.Furthermore, in compliance with the measures, on 16 March <strong>2012</strong> d<strong>at</strong>a on priv<strong>at</strong>e contributions received were submitted to themunicipality of Todi, proof of which was subsequently provided in a notific<strong>at</strong>ion to the Competition Authority.<strong>Snam</strong> Half - <strong>year</strong> Report <strong>2012</strong>
88<strong>Snam</strong> Condensed interim consolid<strong>at</strong>ed financial st<strong>at</strong>ements / Notes23) RevenueThe key items comprising revenue are described below. The reasons for m<strong>at</strong>erial differences are described in the “Financialreview” section of the directors’ <strong>report</strong>.(€ million) First <strong>half</strong> 2011 First <strong>half</strong> <strong>2012</strong>Core business revenue 1,744 1,791Other revenue and income 18 721,762 1,863Core business revenue is <strong>report</strong>ed net of the following items:(€ million) First <strong>half</strong> 2011 First <strong>half</strong> <strong>2012</strong>Additional fees for the distribution service 122 128Additional fees for the transport<strong>at</strong>ion service:- GS Tand RE Tfees referred to in Resolutions ARG/gas 93/10 and 177/10 (*) 120 94- Interruptibility fee as per Resolution 277/07 and other fees (**) 8 36- Regional network capacity fee as per Resolution ARG/gas 45/07 - Equalis<strong>at</strong>ion 1 1129 131251 259(*) Electricity and Gas Authority Resolutions 93/10 and 177/10 introduce, with effect from 1 January 2011, the accessory tariff components GS Tand RE T, intended to finance, respectively, the“Account to offset subsidised tariffs for disadvantaged gas customers” (GS Account) and the “Fund for calcul<strong>at</strong>ing and implementing energy savings and developing renewable sources in then<strong>at</strong>ural gas sector” (RE Account). Amounts collected from <strong>Snam</strong> Rete Gas are paid to the Electricity Equalis<strong>at</strong>ion Fund.(**) These payments regard: (i) fees arising from applic<strong>at</strong>ion of the incentive mechanism for limiting n<strong>at</strong>ural gas consumption; (ii) fees arising from applic<strong>at</strong>ion of factor-guarantee revenues forthe regasific<strong>at</strong>ion service; and (iii) equalis<strong>at</strong>ion imbalances in regional transport<strong>at</strong>ion revenues; (iv) fees arising from applic<strong>at</strong>ion of guaranteed revenues for the storage service.Core business revenue of €1,791 million mainly consists of regul<strong>at</strong>ed revenue from transport<strong>at</strong>ion (€954 million), distribution (€612million), storage (€195 million) and LNG regasific<strong>at</strong>ion (€11 million) services.Core business revenue is analysed by business segment in Note 29, “Segment inform<strong>at</strong>ion”. <strong>Snam</strong> gener<strong>at</strong>es all of its revenue in Italy.Other revenue and income (€72 million) break down as follows:(€ million) First <strong>half</strong> 2011 First <strong>half</strong> <strong>2012</strong>Income from the sale of gas for the balancing service (*) 46Capital gains from disposals of property, plant and equipment and intangible assets 1 6Plant safety inspection fee and compens<strong>at</strong>ion for missed readings 2 5Contractual penalties and other income rel<strong>at</strong>ing to commercial contracts 1 5Income from property investments 3 3Insurance compens<strong>at</strong>ion 1 1Revenues from the sale of Energy Efficiency Certific<strong>at</strong>es 1Other income 9 618 72(*) Revenue from the balancing business, oper<strong>at</strong>ional since 1 December 2011, in accordance with Resolution ARG/gas 45/11 of the Electricity and Gas Authority, rel<strong>at</strong>es to sales of n<strong>at</strong>ural gasmade for the purposes of balancing the gas network. The revenue is m<strong>at</strong>ched to oper<strong>at</strong>ing costs linked to withdrawals from the gas storage system.<strong>Snam</strong>’s business is not affected by seasonal factors which would have a significant impact on its annual or interim financialresults.<strong>Snam</strong> Half - <strong>year</strong> Report <strong>2012</strong>
<strong>Snam</strong> Condensed interim consolid<strong>at</strong>ed financial st<strong>at</strong>ements / Notes8924) Oper<strong>at</strong>ing costsThe key items under oper<strong>at</strong>ing costs are described below. The reasons for m<strong>at</strong>erial differences are described in the “Financialreview” section of the directors’ <strong>report</strong>.(€ million) First <strong>half</strong> 2011 First <strong>half</strong> <strong>2012</strong>Purchases, services and other costs 292 328Personnel expenses 170 177462 505Oper<strong>at</strong>ing costs include the costs of constructing and upgrading distribution infrastructure in accordance with IFRIC 12 (€168million and €147 million in the first <strong>half</strong> of 2011 and first <strong>half</strong> of <strong>2012</strong> respectively).Purchases, services and other costsPurchases, services and other costs (€328 million) break down as follows:(€ million) First <strong>half</strong> 2011 First <strong>half</strong> <strong>2012</strong>Costs incurred for raw m<strong>at</strong>erials, consumables, supplies and goods 79 101Costs for services 212 220Costs for the use of third-party assets 26 26Change in raw m<strong>at</strong>erials, consumables, supplies and goods (16) 29Net accrual to provisions for risks and charges 6 13Other oper<strong>at</strong>ing expenses 18 23325 412Less:Raw m<strong>at</strong>erials, consumables, supplies and goods:Increase on internal work - purchases (21) (60)(21) (60)Services:Increase on internal work - services (12) (24)(12) (24)292 328Costs for services of €196 million rel<strong>at</strong>e to:(€ million) First <strong>half</strong> 2011 First <strong>half</strong> <strong>2012</strong>Construction, planning and coordin<strong>at</strong>ion of work 82 79Purchase of transport<strong>at</strong>ion capacity (interconnection) 25 21Technical, legal, administr<strong>at</strong>ive and professional services 17 18IT (inform<strong>at</strong>ion technology) services 15 18Maintenance 17 16Personnel-rel<strong>at</strong>ed services 13 12Telecommunic<strong>at</strong>ions services 9 11Utilities 11 10Insurance 6 10Other services 17 25212 220less:Increase on internal work capitalised in non-current assets - services (12) (24)(12) (24)200 196<strong>Snam</strong> Half - <strong>year</strong> Report <strong>2012</strong>
90<strong>Snam</strong> Condensed interim consolid<strong>at</strong>ed financial st<strong>at</strong>ements / NotesThe costs of construction, planning and coordin<strong>at</strong>ion of work (€79 million) rel<strong>at</strong>e mainly to the construction and upgrading ofconcession infrastructure for n<strong>at</strong>ural gas distribution activities.The purchase of transport<strong>at</strong>ion capacity (€21 million) rel<strong>at</strong>es to the transport<strong>at</strong>ion service provided by other oper<strong>at</strong>ors on theirnetworks (interconnection).Technical, legal, administr<strong>at</strong>ive and professional services (€18 million) rel<strong>at</strong>e mainly to accounting, administr<strong>at</strong>ive, consultancy andlegal services.Maintenance services (€16 million) rel<strong>at</strong>e mainly to plant maintenance services.Personnel-rel<strong>at</strong>ed services (€12 million) chiefly consist of reimbursements of travel expenses, meals and training costs.Other services (€25 million) are primarily composed of security and caretaker services, cleaning services, marketing services, meteringservices and aerial pipeline monitoring services.Costs for the use of third-party assets of €26 million mainly concern fees for the n<strong>at</strong>ural gas distribution concession (€17 million), inaddition to leasings and rentals (€6 million), which essentially consist of charges for oper<strong>at</strong>ing leases on office premises.Alloc<strong>at</strong>ions to the provisions for risks and charges (€13 million) mainly refer to the provision for environmental charges (€10 million).Personnel expensePersonnel expense of €177 million break down as follows:(€ million) First <strong>half</strong> 2011 First <strong>half</strong> <strong>2012</strong>Wages and salaries 138 141Social security contributions (pensions and healthcare assistance) 43 44Employee benefits 3 3Other expenses 9 11Less:Increase on internal work - personnel expense (23) (22)170 177The average number of payroll employees included in the scope of consolid<strong>at</strong>ion, broken down by st<strong>at</strong>us, is as follows:Professional st<strong>at</strong>us <strong>30</strong>.06.2011 31.12.2011 <strong>30</strong>.06.<strong>2012</strong>Executives 117 119 117Managers 509 516 552Office workers 3,225 3,227 3,266Manual workers 2,213 2,207 2,1496,064 6,069 6,084The average number of employees is calcul<strong>at</strong>ed as the average monthly figure.<strong>Snam</strong> Half - <strong>year</strong> Report <strong>2012</strong>
<strong>Snam</strong> Condensed interim consolid<strong>at</strong>ed financial st<strong>at</strong>ements / Notes91Depreci<strong>at</strong>ion, amortis<strong>at</strong>ion and impairment lossesDepreci<strong>at</strong>ion, amortis<strong>at</strong>ion and impairment losses amount to €345 million and break down as follows:(€ million) First <strong>half</strong> 2011 First <strong>half</strong> <strong>2012</strong>Amortis<strong>at</strong>ion and depreci<strong>at</strong>ionProperty, plant and equipment 240 255Intangible assets 82 90322 345Impairment lossesIntangible assetsLess:Recovery of value (8)314 345Amortis<strong>at</strong>ion and depreci<strong>at</strong>ion (€345 million) rel<strong>at</strong>e to the n<strong>at</strong>ural gas transport<strong>at</strong>ion (€224 million), distribution (€87million), storage (€31 million) and regasific<strong>at</strong>ion (€2 million) segments.25) Financial expenses (income)Financial expenses (income) amount to €167 million, broken down as follows:(€ million) First <strong>half</strong> 2011 First <strong>half</strong> <strong>2012</strong>Financial income (1) (2)Financial expense 106 126105 124Deriv<strong>at</strong>ives 40 43145 167The net value of financial income and expense (€124 million) breaks down as follows:(€ million) First <strong>half</strong> 2011 First <strong>half</strong> <strong>2012</strong>Financial expense rel<strong>at</strong>ed to net financial debt 118 134- Interest and other expenses from banks and other lenders 118 134Other financial (income) expense- Accretion discount (*) 5 7- Other financial expense 3 2- Other financial income (1) (2)7 7Financial expense capitalised (20) (17)105 124(*) This item refers to the increase in provisions for risks and charges, which are <strong>report</strong>ed <strong>at</strong> discounted value under non-current liabilities on the balance sheet.Expenses associ<strong>at</strong>ed with net financial debt (€134 million) rel<strong>at</strong>e to interest on loans received from the ultim<strong>at</strong>e parent, EniS.p.A.. Other financial income and expense (€7 million) rel<strong>at</strong>e mainly to the accretion discount and to interest income andexpense on tariff components in the transport<strong>at</strong>ion business segment.The financial expenses capitalised (€17 million) rel<strong>at</strong>es to the part of financial expense absorbed by investments.<strong>Snam</strong> Half - <strong>year</strong> Report <strong>2012</strong>
92<strong>Snam</strong> Condensed interim consolid<strong>at</strong>ed financial st<strong>at</strong>ements / NotesDeriv<strong>at</strong>ivesLosses on deriv<strong>at</strong>ives (€43 million) rel<strong>at</strong>e to differential interest accrued during the period on deriv<strong>at</strong>ive contracts hedging interestr<strong>at</strong>e risk. The 17 deriv<strong>at</strong>ive contracts outstanding <strong>at</strong> <strong>30</strong> <strong>June</strong> <strong>2012</strong> were with the ultim<strong>at</strong>e parent, Eni S.p.A.. Details on the fair valueof these contracts can be found in Note 15, “Other current liabilities”.26) Income from equity investmentsIncome from equity investments (€24 million) is analysed below:(€ million) First <strong>half</strong> 2011 First <strong>half</strong> <strong>2012</strong>Capital gains from measurement by the equity method 28 2428 24Details of capital gains from measurement by the equity method (€24 million) can be found in Note 9, “Equity-accountedinvestments”.27) ) Income taxesIncome taxes (€362 million) break down as follows:(€ million) First <strong>half</strong> 2011 First <strong>half</strong> <strong>2012</strong>Current taxes:- IRES 299 332- IRAP 69 63368 395Deferred and prepaid taxes:- Deferred (<strong>30</strong>) (37)- Prepaid (45) 4(75) (33)293 362The tax r<strong>at</strong>e was 41.6% (to 33.7% in the first <strong>half</strong> of 2011), compared with a theoretical r<strong>at</strong>e of 33%. The increase by comparisonwith the theoretical r<strong>at</strong>e is mainly due to higher charges arising from applic<strong>at</strong>ion of additional IRES (Robin Hood Tax) to then<strong>at</strong>ural gas transport<strong>at</strong>ion and distribution segments, implementing Decree Law 138 of 13 August 2011, converted into Law148 of 14 September 2011.28) Earnings per shareBasic earnings per share are determined by dividing net profit for the period by the weighted average number of <strong>Snam</strong> sharesin issue during the period, excluding treasury shares.Diluted earnings per share are determined by dividing net profit by the weighted average number of shares in issue during theperiod, excluding treasury shares, increased by the number of shares which could potentially be issued following the alloc<strong>at</strong>ionor disposal of treasury shares held under stock option plans.The weighted average number of shares in issue used to calcul<strong>at</strong>e diluted earnings per share is 3,377,946,774 and 3,378,679,890respectively for the first <strong>half</strong> of 2011 and the first <strong>half</strong> of <strong>2012</strong>.<strong>Snam</strong> Half - <strong>year</strong> Report <strong>2012</strong>
<strong>Snam</strong> Condensed interim consolid<strong>at</strong>ed financial st<strong>at</strong>ements / Notes93The reconcili<strong>at</strong>ion of the weighted average number of shares in issue used to determine basic and diluted earnings per shareis set out below:First <strong>half</strong> 2011 First <strong>half</strong> <strong>2012</strong>Weighted average number of outstanding shares used to calcul<strong>at</strong>e basic earnings per share 3,377,497,325 3,378,634,943Number of potential shares following stock option plans 449,449 44,947Weighted average number of outstanding shares used to calcul<strong>at</strong>e diluted earnings per share 3,377,946,774 3,378,679,890Net profit <strong>at</strong>tributable to <strong>Snam</strong> (€ million) 576 508Basic earnings per share (€ per share) 0.17 0.15Diluted earnings per share (€ per share) 0.17 0.1529) Segment inform<strong>at</strong>ion(€ million)Corpor<strong>at</strong>eTransport<strong>at</strong>ionand disp<strong>at</strong>chDistributionStorageRegasific<strong>at</strong>ionTotalFirst <strong>half</strong> 2011Net core business revenue (a) 970 614 192 17 1.793less: inter-segment revenue (27) (17) (5) (49)Revenue from third parties 943 614 175 12 1.744Other revenue and income 8 8 1 1 18Depreci<strong>at</strong>ion, amortis<strong>at</strong>ion and impairment losses (214) (73) (25) (2) (314)EBIT 588 255 139 4 986Equity method valu<strong>at</strong>ion effect 28 28Directly <strong>at</strong>tributable current assets 750 299 655 15 1,719Directly <strong>at</strong>tributable non-current assets 11,599 4,152 2,622 88 18,461Of which:- Equity-accounted investments <strong>30</strong>6 <strong>30</strong>6Directly <strong>at</strong>tributable current liabilities 3,977 760 1,026 18 5,781Directly <strong>at</strong>tributable non-current liabilities 5,699 1,466 1,194 17 8,376Capital expenditure 369 180 131 1 681First <strong>half</strong> <strong>2012</strong>Net core business revenue (a) 80 961 619 220 17 1,897less: inter-segment revenue (74) (5) (1) (20) (6) (106)Revenue from third parties 6 956 618 200 11 1,791Other revenue and income 49 22 1 72Net accrual to provisions for risks and charges (13) (13)Depreci<strong>at</strong>ion, amortis<strong>at</strong>ion and impairment losses (1) (224) (87) (31) (2) (345)Income from measurement <strong>at</strong> equity 24 24EBIT 4 589 259 159 2 1,013Directly <strong>at</strong>tributable current assets 148 1,220 462 605 13 2,448Directly <strong>at</strong>tributable non-current assets 22 11,977 4,<strong>30</strong>1 3,155 87 19,542Of which:- Equity-accounted investments 310 310Directly <strong>at</strong>tributable current liabilities 184 2,701 1,215 1,210 14 5,324Directly <strong>at</strong>tributable non-current liabilities 1,526 6,493 1,340 1,508 16 10,883Capital expenditure 3 <strong>30</strong>1 157 63 524(a)Before elimin<strong>at</strong>ion of inter-segment revenue.<strong>Snam</strong> Half - <strong>year</strong> Report <strong>2012</strong>
94<strong>Snam</strong> Condensed interim consolid<strong>at</strong>ed financial st<strong>at</strong>ements / NotesInter-segment revenue is gener<strong>at</strong>ed by applying regul<strong>at</strong>ed tariffs or market conditions. Revenue of the Company is gener<strong>at</strong>edentirely in Italy; costs are incurred almost entirely in Italy.<strong>30</strong>) Rel<strong>at</strong>ed party transactions<strong>Snam</strong> S.p.A. is a company controlled by Eni S.p.A., which <strong>at</strong> <strong>30</strong> <strong>June</strong> <strong>2012</strong> held 52.53% of its shares.The rel<strong>at</strong>ed-party transactions conducted by <strong>Snam</strong> mainly involve the provision of services, the exchange of goods, and theprovision and utilis<strong>at</strong>ion of financial resources, including the arrangement of deriv<strong>at</strong>ive contracts for hedging interest r<strong>at</strong>e riskwith the ultim<strong>at</strong>e parent, Eni S.p.A., and its subsidiaries, as well as with associ<strong>at</strong>es and entities under common control, and withEnel S.p.A., a st<strong>at</strong>e-controlled company, and its subsidiaries.All transactions are part of ordinary business activities and are generally settled on the basis of market conditions, i.e. underconditions th<strong>at</strong> would be applied for two independent parties, and are performed in the interests of <strong>Snam</strong> companies.In accordance with the disclosure requirements introduced by Consob Regul<strong>at</strong>ion 17221 of 12 March 2010, the followingrel<strong>at</strong>ed-party transactions were conducted in the first <strong>half</strong> of <strong>2012</strong>:- On 22 March <strong>2012</strong>, two contracts were signed between Stogit S.p.A. and Saipem S.p.A. to provide retail engineering servicesfor the new gas storage centre in Bordolano (for an estim<strong>at</strong>ed sum of approxim<strong>at</strong>ely €27 million) and the centres <strong>at</strong> FiumeTreste, Minerbio and Cortemaggiore (for an estim<strong>at</strong>ed sum of approxim<strong>at</strong>ely €11 million);- On 14 May <strong>2012</strong>, a contract was signed between Eni and Stogit to cre<strong>at</strong>e new storage capacity for 4 billion Sm3 of n<strong>at</strong>uralgas by 31 August 2015 in rel<strong>at</strong>ion to the implement<strong>at</strong>ion of measures set out in Legisl<strong>at</strong>ive Decree 1<strong>30</strong>/2010;- On 24 April <strong>2012</strong>, a memorandum of understanding was signed between Italgas S.p.A. and Acegas-Aps S.p.A. to cre<strong>at</strong>e ajoint venture to develop gas distribution activities in the provinces of Padua, Pordenone, Trieste and Gorizia (the transactionspecifically rel<strong>at</strong>es to the acquisition from Eni by Italgas of 50% of the share capital of Isontina Reti Gas for €8.7 million);- extension from <strong>30</strong> March to <strong>30</strong> <strong>June</strong> of a short-term loan of €500 million contracted with Eni, on the existing terms (spreadof 310 bps).Under Article 13 of the Consob Regul<strong>at</strong>ion, these contracts are classed as ordinary transactions concluded under marketequivalentor standard conditions since: (i) they fall within the scope of normal business oper<strong>at</strong>ions and the associ<strong>at</strong>ed financialactivities; and (ii) the terms are similar to those usually practised with non-rel<strong>at</strong>ed parties for transactions of an equivalentn<strong>at</strong>ure, size and risk.The amounts of rel<strong>at</strong>ed party transactions of a commercial and financial n<strong>at</strong>ure for the first <strong>half</strong> of 2011 and the first <strong>half</strong> of<strong>2012</strong> are <strong>report</strong>ed below. The n<strong>at</strong>ure of the most significant transactions is also st<strong>at</strong>ed.<strong>Snam</strong> Half - <strong>year</strong> Report <strong>2012</strong>
<strong>Snam</strong> Condensed interim consolid<strong>at</strong>ed financial st<strong>at</strong>ements / Notes95Commercial and other transactionsName 31.12.2011 First <strong>half</strong> 2011Receivables Payables Guarantees Costs (a) Revenue (b)(€ million) Goods Services Other Goods Services OtherUltim<strong>at</strong>e parentEni S.p.A. 452 121 65 77 16 908 5452 121 65 77 16 908 5Eni subsidiaries- Eni Adfin S.p.A. 10 12 7- Eni Hellas S.p.A.- Eni Insurance Ltd. 4- Enicorpor<strong>at</strong>e University S.p.A. 3 1- EniServizi S.p.A. 3 14 7- Saipem Energy Services S.p.A.- Saipem S.p.A. 64 36- Serfactoring S.p.A. 40- Syndial S.p.A. 1- Other (c) 2 2 1 115 136 56 1Entities under common control and associ<strong>at</strong>es of Eni- Cepav (Consorzio Eni per l'Alta Velocità) 2- Other (c) 1 1 (..) (..)3 1 (..) (..)Entities under common control and associ<strong>at</strong>es- A.E.S. S.p.A. 1 3- Servizi Territori Aree Penisole S.p.A. 2- Toscana Energia S.p.A. 2 1- Other (c) 3 18 4 1St<strong>at</strong>e-owned or -controlled companies- Anas group 3 5- Enel group 64 5 201- Ferrovie dello St<strong>at</strong>o group 1 4 1- Finmeccanica group 1- Other (c) 168 15 1 202Total 546 277 65 77 73 1,111 6(a)(b)(c)Includes costs for goods and services to be used in investing activities.Before tariff components which are offset in costs.Individually less than €1 million.<strong>Snam</strong> Half - <strong>year</strong> Report <strong>2012</strong>
96<strong>Snam</strong> Condensed interim consolid<strong>at</strong>ed financial st<strong>at</strong>ements / NotesName <strong>30</strong>.06.<strong>2012</strong> First <strong>half</strong> <strong>2012</strong>Receivables Payables Guarantees Costs (a) Revenue (b)(€ million) Goods Services Other Goods Services OtherUltim<strong>at</strong>e parent- Eni S.p.A. 446 353 73 4 12 2 944 23446 353 73 4 12 2 944 23Eni subsidiaries- Eni Adfin S.p.A. 2 3- Eni Insurance Ltd. 2- Enicorpor<strong>at</strong>e University S.p.A. 1- EniServizi S.p.A. 3 13 3- Saipem S.p.A. 54 36- Serfactoring S.p.A. 16- Syndial S.p.A. 1- Other (c) 1 3 1 1 16 91 1 42 1Entities under common controland associ<strong>at</strong>es of Eni- Cepav (Consorzio Eni per l'Alta Velocità) (..) (..)- Other (c) (..) (..)Entities under common control and associ<strong>at</strong>es- A.E.S. S.p.A. 21 3- Servizi Territori Aree Penisole S.p.A. 3- Toscana Energia S.p.A. 12 1 1- Other (c) 2 1 138 4 2 1St<strong>at</strong>e-owned or -controlled companies- Anas group 2 4- Enel group 92 21 212- Ferrovie dello St<strong>at</strong>o group 3 2- Other (c)97 25 214Total 587 473 73 5 54 2 1,160 25(a)(b)(c)Includes costs for goods and services to be used in investing activities.Before tariff components which are offset in costs.Individually less than €1 million.<strong>Snam</strong> Half - <strong>year</strong> Report <strong>2012</strong>
<strong>Snam</strong> Condensed interim consolid<strong>at</strong>ed financial st<strong>at</strong>ements / Notes97Ultim<strong>at</strong>e parentCommercial transactionsThe most important active commercial transactions with the ultim<strong>at</strong>e parent, Eni S.p.A., concern the provision of regul<strong>at</strong>ed gasservices rel<strong>at</strong>ing to transport<strong>at</strong>ion, regasific<strong>at</strong>ion, distribution and storage, on the basis of tariffs established by the Electricityand Gas Authority.The principal passive commercial transactions mainly concern the supply of electricity used for business activities and n<strong>at</strong>uralgas used in the cre<strong>at</strong>ion of storage infrastructure. These transactions are governed by contracts entered into under normalmarket conditions.<strong>Snam</strong> also has transactions in place in connection with contracts for the provision of consultancy and technical/oper<strong>at</strong>ionalsupport services rel<strong>at</strong>ing to storage fields. These transactions are governed by service agreements on the basis of the costsincurred.Other transactionsAs established by the contract for the purchase of Italgas and Stogit from Eni, signed on <strong>30</strong> <strong>June</strong> 2009, the price determined forthe acquisition of the two companies is subject to adjustment mechanisms, to be applied if necessary after the d<strong>at</strong>e of executionof the contract, based on commitments assumed when the acquisition was finalised. As a result of such commitments, in thefirst <strong>half</strong> of <strong>2012</strong> asset adjustments in favour of <strong>Snam</strong> (owed by Eni) were recognised in the amount of €5 million in rel<strong>at</strong>ionto the measurement of liabilities on events already in existence on the contract completion d<strong>at</strong>e.Finally, transactions exist with Eni within the context of the n<strong>at</strong>ional tax consolid<strong>at</strong>ion scheme, which is subscribed to by allcompanies within the scope of consolid<strong>at</strong>ion of the <strong>Snam</strong> Group, and the VAT consolid<strong>at</strong>ion scheme. These transactions aregoverned by the appropri<strong>at</strong>e legally binding contracts.Subsidiaries of EniThe key transactions with Eni’s subsidiaries rel<strong>at</strong>e to:- Saipem S.p.A., for design and project supervision services in rel<strong>at</strong>ion to the construction of n<strong>at</strong>ural gas transport<strong>at</strong>ioninfrastructure, governed by contracts entered into <strong>at</strong> normal market conditions;- Serfactoring S.p.A. for factoring transactions performed by <strong>Snam</strong> suppliers.Entities under common control and associ<strong>at</strong>esTransactions with entities under common control and associ<strong>at</strong>es rel<strong>at</strong>e to the provision of IT services governed by contractsentered into <strong>at</strong> normal market conditions.St<strong>at</strong>e-owned or -controlled companiesTransactions with st<strong>at</strong>e-owned or -controlled companies rel<strong>at</strong>e mainly to the Enel Group and concern n<strong>at</strong>ural gas transport<strong>at</strong>ion,regasific<strong>at</strong>ion, distribution and storage services. These transactions are governed on the basis of tariffs established by theElectricity and Gas Authority.<strong>Snam</strong> Half - <strong>year</strong> Report <strong>2012</strong>
98<strong>Snam</strong> Condensed interim consolid<strong>at</strong>ed financial st<strong>at</strong>ements / NotesFinancial transactionsName 31.12.2011 First <strong>half</strong> 2011(€ million)PayablesOtherliabilities (a)Expense(b) (c)Ultim<strong>at</strong>e parent- Eni S.p.A. 11,199 266 15811,199 266 158(a)(b)(c)Includes assets and liabilities deriving from the measurement of deriv<strong>at</strong>ive contracts.Includes financial expense for investments.Includes €40 million rel<strong>at</strong>ing to expenses on deriv<strong>at</strong>ives.Name <strong>30</strong>.06.<strong>2012</strong> First <strong>half</strong> <strong>2012</strong>(€ million)PayablesOtherliabilities (a)Expense(b) (c)Ultim<strong>at</strong>e parent- Eni S.p.A. 10,238 324 17610,238 324 176(a)(b)(c)Includes assets and liabilities deriving from the measurement of deriv<strong>at</strong>ive contracts.Includes financial expense for investments.Includes €43 million rel<strong>at</strong>ing to expenses on deriv<strong>at</strong>ives.Ultim<strong>at</strong>e parentDealings with the parent company, Eni S.p.A., rel<strong>at</strong>e to the hedging of financial requirements, utilis<strong>at</strong>ion of liquidity and interestr<strong>at</strong>e risk hedging using deriv<strong>at</strong>ive contracts.<strong>Snam</strong> Half - <strong>year</strong> Report <strong>2012</strong>
<strong>Snam</strong> Condensed interim consolid<strong>at</strong>ed financial st<strong>at</strong>ements / Notes99Impact of rel<strong>at</strong>ed party transactions or positions on the balance sheet, income st<strong>at</strong>ement and st<strong>at</strong>ement of cashflowsThe effect of transactions or positions with rel<strong>at</strong>ed parties on the balance sheet is summarised in the following table:31.12.2011 <strong>30</strong>.06.<strong>2012</strong>(€ million) TotalRel<strong>at</strong>edpartiesShare(%) TotalRel<strong>at</strong>edpartiesShare(%)Trade and other receivables 1,545 546 35.3 2,138 587 27.5Other current assets 33 2 6.1 46Other non-current assets 81 1 1.2 100 1 1.0Short-term financial liabilities 2,787 2,787 100.0 3,044 3,032 99.6Long-term financial liabilities 8,412 8,412 100.0 8,706 7,206 82.8Trade and other payables 1,344 277 20.6 1,567 473 <strong>30</strong>.2Other current liabilities 211 78 37.0 193 100 51.8Other non-current liabilities 869 188 21.6 1,010 225 22.3The effect of transactions or positions with rel<strong>at</strong>ed parties on the income st<strong>at</strong>ement is summarised in the following table:First <strong>half</strong> 2011 First <strong>half</strong> <strong>2012</strong>(€ million) TotalRel<strong>at</strong>edpartiesShare(%) TotalRel<strong>at</strong>edpartiesShare(%)Core business revenue 1,744 1,111 63.7 1,791 1,160 64.8Other revenue and income 18 6 33.3 72 25 34.7Purchases, services and other costs 292 37 12.7 328 23 7.0Financial expense 106 98 92.5 126 116 92.1Losses on deriv<strong>at</strong>ive contracts 40 40 100.0 43 43 100.0<strong>Snam</strong> Half - <strong>year</strong> Report <strong>2012</strong>
100<strong>Snam</strong> Condensed interim consolid<strong>at</strong>ed financial st<strong>at</strong>ements / NotesThe principal cash flows with rel<strong>at</strong>ed parties are shown in the following table:(€ million) First <strong>half</strong> 2011 First <strong>half</strong> <strong>2012</strong>Revenue and income 1,117 1,185Cost and expense (37) (23)Change in trade and other receivables 74 74Change in trade and other payables (60) 53Dividends collected 29 2Interest collectedInterest paid (138) (155)Net cash flows from oper<strong>at</strong>ing activities 985 1,136Investments:- Property, plant and equipment and intangible assets (133) (55)- Companies entering the scope of consolid<strong>at</strong>ion 9 5- Change in payables and receivables rel<strong>at</strong>ing to investments (76) (18)Cash flows from investment activities (200) (68)Divestments:- Equity investmentsCash flows from divestmentsNet cash flows from investment activities (200) (68)Taking on long-term financial debt 422 21Repaying long-term financial debt (320) (1,227)Increase (decrease) in short-term financial debt 283 245Dividends paid (263) (263)Net cash flows from financing activities 122 (1,224)Total cash flows with rel<strong>at</strong>ed parties 907 (156)The effect of cash flows with rel<strong>at</strong>ed parties is shown in the following table:First <strong>half</strong> 2011 First <strong>half</strong> <strong>2012</strong>(€ million) TotalRel<strong>at</strong>edpartiesShare(%) TotalRel<strong>at</strong>edpartiesShare(%)Cash flow from oper<strong>at</strong>ing activities 874 985 614 1,136Cash flow from investment activities (796) (200) 25.1 (678) (68) 10.0Cash flow from financing activities (83) 122 78 (1,224)<strong>Snam</strong> Half - <strong>year</strong> Report <strong>2012</strong>
<strong>Snam</strong> Condensed interim consolid<strong>at</strong>ed financial st<strong>at</strong>ements / Notes10131) Significant non-recurring events and transactionsNo significant non-recurring events and/or transactions took place in the first <strong>half</strong> of <strong>2012</strong>.32) Positions or transactions deriving from <strong>at</strong>ypical and/or unusual transactionsNo positions or transactions deriving from <strong>at</strong>ypical and/or unusual transactions are <strong>report</strong>ed for the first <strong>half</strong> of <strong>2012</strong>.33) Post-balance sheet eventsPost-balance sheet events are described in the “Post-balance sheet events” section of the directors’ <strong>report</strong>.<strong>Snam</strong> Half - <strong>year</strong> Report <strong>2012</strong>
102Certific<strong>at</strong>ion of the condensed interim financial st<strong>at</strong>ements required pursuantto Article 81-ter of Consob Regul<strong>at</strong>ion 11971 of 14 May 1999, as subsequentlyamended and supplemented1. The undersigned Carlo Malacarne and Antonio Paccioretti, as Chief Executive Officer and Chief Financial Officer of <strong>Snam</strong>S.p.A. respectively, certify, taking into account Article 154-bis, paragraphs 3 and 4 of Legisl<strong>at</strong>ive Decree 58 of 24 February1998:- the adequacy, considering the group’s characteristics, and- the effective implement<strong>at</strong>ionof the administr<strong>at</strong>ive and accounting procedures for the prepar<strong>at</strong>ion of the condensed interim financial st<strong>at</strong>ements <strong>at</strong> <strong>30</strong><strong>June</strong> <strong>2012</strong>, during the first <strong>half</strong> of <strong>2012</strong>.2. The administr<strong>at</strong>ive and accounting procedures for the prepar<strong>at</strong>ion of the condensed interim financial st<strong>at</strong>ements <strong>at</strong> <strong>30</strong> <strong>June</strong><strong>2012</strong> and the assessment of their adequacy were carried out using the rules and methods set out in line with the InternalControl - Integr<strong>at</strong>ed Framework model issued by the Committee of Sponsoring Organis<strong>at</strong>ions of the Treadway Commission, abenchmark framework for the internal control system generally accepted intern<strong>at</strong>ionally.3. It is also certified th<strong>at</strong>:3.1 The condensed interim financial st<strong>at</strong>ements <strong>at</strong> <strong>30</strong> <strong>June</strong> <strong>2012</strong>:a) were prepared in accordance with the applicable intern<strong>at</strong>ional accounting standards recognised in the EuropeanCommunity pursuant to Regul<strong>at</strong>ion (EC) No 1606/2002 of the European Parliament and of the Council of 19 July2002;b) are consistent with the accounting records and ledgers;c) are able to provide a true and fair view of the financial position, results of oper<strong>at</strong>ions and cash flows of the issuerand of the companies included in the scope of consolid<strong>at</strong>ion.3.2 The directors’ <strong>report</strong> includes a fair review of the references to key events which occurred during the first six monthsof the <strong>year</strong> and their impact on the condensed interim financial st<strong>at</strong>ements, together with a description of the mainrisks and uncertainties for the remaining six months of the <strong>year</strong>. The directors’ <strong>report</strong> also includes a fair review of theinform<strong>at</strong>ion about significant transactions with rel<strong>at</strong>ed parties.<strong>30</strong> July <strong>2012</strong>/sign<strong>at</strong>ure/Carlo Malacarne___________________Carlo MalacarneChief Executive Officer/sign<strong>at</strong>ure/Antonio Paccioretti_____________________Antonio PacciorettiDirector of Planning, Administr<strong>at</strong>ion, Finance and Control<strong>Snam</strong> Half - <strong>year</strong> Report <strong>2012</strong>
103Independent auditors’ <strong>report</strong><strong>Snam</strong> Half - <strong>year</strong> Report <strong>2012</strong>
Piazza Santa Barbara, 720097 San Don<strong>at</strong>o Milanese (MI)Tel +39.0237031Limited CompanyFull paid-up capital 3,571,187,994.00Milan Company Register - Tax code and VAT No 13271390158R.E.A. (Economic-Admin. Roll) No 1633443Company controlled and coordin<strong>at</strong>ed by Eni S.p.A.
www.snam.it