Hydraulic Fracturing Market (2011-2020)
The global hydraulic fracturing market was estimated at USD 37.5 billion in 2012 and is expected to grow at over 11% from 2014 to 2020!
The global hydraulic fracturing market was estimated at USD 37.5 billion in 2012 and is expected to grow at over 11% from 2014 to 2020!

Create successful ePaper yourself
Turn your PDF publications into a flip-book with our unique Google optimized e-Paper software.
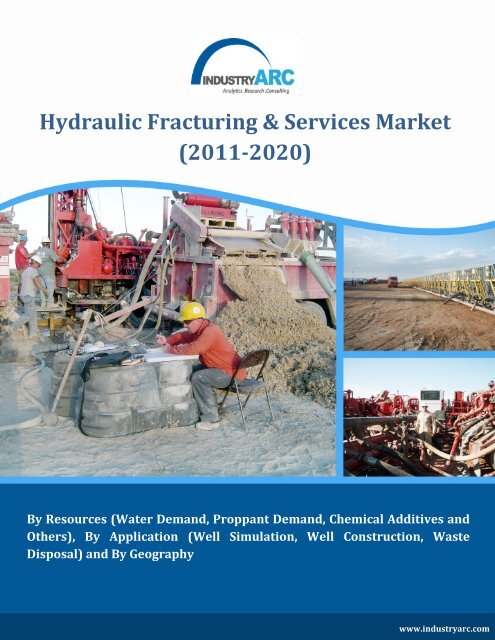
<strong>Hydraulic</strong> <strong>Fracturing</strong> & Services <strong>Market</strong><br />
(<strong>2011</strong>-<strong>2020</strong>)<br />
By Resources (Water Demand, Proppant Demand, Chemical Additives and<br />
Others), By Application (Well Simulation, Well Construction, Waste<br />
Disposal) and By Geography<br />
www.industryarc.com
To Enquire About<br />
the Report Click<br />
Here<br />
TABLE OF CONTENTS<br />
1. Global <strong>Hydraulic</strong> <strong>Fracturing</strong> and Services - <strong>Market</strong> Overview<br />
2. Executive Summary<br />
3. Global <strong>Hydraulic</strong> <strong>Fracturing</strong> and Services - <strong>Market</strong> Landscape<br />
3.1. <strong>Market</strong> Share Analysis<br />
3.2. Comparative Analysis<br />
3.2.1. Financial Analysis of the top 5players<br />
4. Global <strong>Hydraulic</strong> <strong>Fracturing</strong> and Services - <strong>Market</strong> Forces<br />
4.1. <strong>Market</strong> Drivers<br />
4.2. <strong>Market</strong> Constraints<br />
4.3. <strong>Market</strong> Challenges<br />
4.4. <strong>Hydraulic</strong> <strong>Fracturing</strong> and Services<br />
4.4.1. Power of Suppliers<br />
4.4.2. Power of Customers<br />
4.4.3. Threat of New entrants<br />
4.4.4. Threat of Substitution<br />
4.4.5. Degree of Competition<br />
5. Global <strong>Hydraulic</strong> <strong>Fracturing</strong> and Services – Strategic Analysis<br />
5.1. Value Chain Analysis<br />
5.2. Pricing Analysis<br />
5.3. <strong>Hydraulic</strong> <strong>Fracturing</strong> Life Cycle Analysis<br />
5.4. Service Companies Competitive Landscape
To Enquire About<br />
the Report Click<br />
Here<br />
6. Global <strong>Hydraulic</strong> <strong>Fracturing</strong> -Analysis and Forecast (<strong>2011</strong> – <strong>2020</strong>)<br />
6.1. Global <strong>Hydraulic</strong> <strong>Fracturing</strong> <strong>Market</strong> - Overview by Region<br />
6.1.1. APAC<br />
6.1.1.1. Australia<br />
6.1.1.2. China<br />
6.1.1.3. Indonesia<br />
6.1.1.4. Pakistan<br />
6.1.1.5. Others<br />
6.1.2. North America<br />
6.1.2.1. Canada<br />
6.1.2.2. Mexico<br />
6.1.2.3. U.S<br />
6.1.3. South America<br />
6.1.3.1. Argentina<br />
6.1.3.2. Brazil<br />
6.1.3.3. Colombia<br />
6.1.3.4. Chile<br />
6.1.3.5. Paraguay<br />
6.1.3.6. Venezuela<br />
6.1.3.7. Others<br />
6.1.4. Europe<br />
6.1.4.1. France
To Enquire About<br />
the Report Click<br />
Here<br />
6.1.4.2. Netherlands<br />
6.1.4.3. Poland<br />
6.1.4.4. Russia<br />
6.1.4.5. Ukraine<br />
6.1.4.6. U.K<br />
6.1.4.7. Others<br />
6.1.5. Africa<br />
6.1.5.1. Algeria<br />
6.1.5.2. Egypt<br />
6.1.5.3. Libya<br />
6.1.5.4. Others<br />
6.2. <strong>Hydraulic</strong> <strong>Fracturing</strong> <strong>Market</strong> Split by Resources<br />
6.2.1. Water Demand<br />
6.2.2. <strong>Hydraulic</strong> <strong>Fracturing</strong> Proppant Demand<br />
6.2.2.1. <strong>Fracturing</strong> Sand Demand (Includes resin coated)<br />
6.2.2.2. Bauxite Demand<br />
6.2.3. Chemical Additives and other Materials Demand<br />
6.2.3.1. Friction reducers<br />
6.2.3.2. Biocides<br />
6.2.3.3. Solvents<br />
6.2.3.4. Surfactants<br />
6.2.3.5. Scale inhibitors
To Enquire About<br />
the Report Click<br />
Here<br />
6.2.3.6. Acids<br />
6.3. <strong>Hydraulic</strong> <strong>Fracturing</strong> <strong>Market</strong> Cost Analysis<br />
6.3.1. Well Simulation<br />
6.3.2. Well Construction – By Number of <strong>Fracturing</strong> Stages<br />
6.3.3. Waste Disposal<br />
6.4. Global <strong>Hydraulic</strong> <strong>Fracturing</strong> Service <strong>Market</strong> by Region<br />
6.4.1. APAC<br />
6.4.1.1. China<br />
6.4.2. North America<br />
6.4.2.1. U.S<br />
6.4.2.2. Canada<br />
7. <strong>Market</strong> Entropy<br />
7.1. M&As, Collaborations, JVs and Partnerships<br />
8. Global <strong>Hydraulic</strong> <strong>Fracturing</strong> Service <strong>Market</strong> Share Analysis<br />
8.1. Halliburton Co. (HAL)<br />
8.2. Baker Hughes Inc.(BHI)<br />
8.3. FTS International Inc.<br />
8.4. Schlumberger Ltd.<br />
8.5. Superior Well Services<br />
8.6. Cudd Energy Services<br />
8.7. Canyon Services Group Inc<br />
8.8. Trican Well Service Ltd.
To Enquire About<br />
the Report Click<br />
Here<br />
8.9. Calfrac Well Services Ltd. (CFW)<br />
8.10. China National Petroleum Corporation (CNPC)<br />
8.11. 8.11.Weatherford International Ltd<br />
8.12. United Oilfield Services<br />
8.13. Others<br />
9. Appendix<br />
9.1. Abbreviations<br />
9.2. Sources<br />
9.3. Research Methodology<br />
9.4. Bibliography<br />
9.5. Compilation of Expert Insights<br />
10. Disclaimer
To Enquire About<br />
the Report Click<br />
Here<br />
KEY MARKET INSIGHTS<br />
<strong>Hydraulic</strong> fracturing demand slowed down in the U.S due to excess supply of oil and gas<br />
domestically and limited number of exploration projects. As a result price of oil and gas dropped<br />
marginally in the last two quarters.<br />
<strong>Fracturing</strong> cost per well is expected to decrease on an annual basis in U.S but will continue to<br />
increase in Canada for the next two years.<br />
Majority of the European countries continue to support the ban on hydraulic fracturing.<br />
Globally fracturing service cost stood in the range of $2.0 – 3.5 million per well ( for wells<br />
greater than 15 and less than 30 frac stages)<br />
The hydraulic fracturing has been witnessing high growth due to the increase in the shale gas<br />
exploration activities<br />
China is expected to increase its shale gas production by 2015, which in turn fuels the hydraulic<br />
fracturing and services market in the Asian region<br />
Growth prospects are expected to increase in APAC and Middle East markets as the regions<br />
there are in their early stages<br />
Globally, if usage of this technique is permitted then the recovery of resources is expected to<br />
increase. Hence use of hydraulic fracturing is effective for developing countries like China, India<br />
and Australia<br />
The market is expected to grow at a CAGR of over 12% from 2014-<strong>2020</strong>
To Enquire About<br />
the Report Click<br />
Here<br />
RESEARCH METHODOLOGY<br />
The quantitative and qualitative data collected for the <strong>Hydraulic</strong> <strong>Fracturing</strong> & Services report is from<br />
a combination of secondary and primary sources. Research interviews were conducted with senior<br />
executives and/or mangers in the <strong>Hydraulic</strong> <strong>Fracturing</strong> & Services Industry. These Key Opinion<br />
Leaders (KOLs) were then provided a questionnaire to gather quantitative and qualitative inputs on<br />
their operations, performance, strategies and views on the overall market, including key<br />
developments and technology trends. Data from interviews is consolidated, checked for consistency<br />
and accuracy, and the final market numbers are again validated by experts. The global market was<br />
split by product types and geography based on different factors like primary and secondary sources,<br />
understanding of the number of companies operating in each segment and also KOL insights.<br />
We have used various secondary sources such as directories, articles, white papers, newsletters,<br />
annual reports and paid databases such as OneSource, Hoovers and Factiva to identify and collect<br />
information for extensive technical and commercial study of the <strong>Hydraulic</strong> <strong>Fracturing</strong> & Services<br />
market.<br />
The key players in the market and its value chain were identified through secondary research and<br />
their market opinions were also gathered in a similar way through telephonic interviews and<br />
questionnaires. We have also studied the annual reports of these top market players. Interviews with<br />
key opinion leaders such as directors, managers, and marketing personnel were used extensively in<br />
understanding the need and emergence of <strong>Hydraulic</strong> <strong>Fracturing</strong> & Services market.<br />
We also have extensive database of contacts which were used to conduct primary interviews and<br />
also to get their inputs using questionnaires.
To Enquire About<br />
the Report Click<br />
Here<br />
THE ARC ADVANTAGE<br />
An analytical model lies at the core of our process, ensuring logical consistency throughout<br />
our research. We complement the model with secondary data and interviews with industry<br />
experts to reflect the latest trends. With our final expert validation, we provide you with<br />
only the most accurate and actionable intelligence.<br />
THE ARC PROCESS<br />
Analytical<br />
Method<br />
Base Method<br />
Consolidation<br />
Method<br />
Delphi<br />
Verification<br />
1. Granular<br />
breakdown of<br />
drivers into<br />
factors<br />
2. Validate all<br />
factors in terms<br />
of their present<br />
impact on the<br />
market<br />
3. Assign weights<br />
to these factors in<br />
terms of their<br />
relevance and<br />
impact on the<br />
market<br />
1. Get a topdown<br />
estimate of<br />
the market<br />
2. Follow it up<br />
with a bottom-up<br />
estimate of the<br />
market<br />
3. Check<br />
forconsistency<br />
and new growth<br />
factors that are<br />
relevant over the<br />
next 10 Years<br />
1. Granular<br />
breakdown of<br />
drivers into<br />
factors<br />
2. Validate all<br />
factors in terms<br />
of their present<br />
impact on the<br />
market.<br />
3. Assign weights<br />
to these factors in<br />
terms of their<br />
relevance and<br />
impact on the<br />
market.<br />
1. Verify the<br />
findings of the<br />
model with<br />
experts from<br />
across the value<br />
chain<br />
2. Verify the<br />
findings with<br />
players across<br />
small and large<br />
enterprises<br />
3. Tweak the<br />
model and add<br />
new factors<br />
4. Build the<br />
Analytical Model<br />
4. Build the Base<br />
model<br />
4. Build the<br />
Consolidated<br />
Model<br />
4. Finalize the<br />
ARC Model<br />
ANALYTICAL MODEL BASE MODEL CONSOLIDATED MODEL ARC MODEL
To Enquire About<br />
the Report Click<br />
Here<br />
ABOUT US<br />
IndustryARC was started by a group of young, passionate professionals along with extensively<br />
experienced industry veterans across various business segments. Our focus and expertise is<br />
mainly in the field of analytics, market research and consulting. Our singular goal is to provide<br />
accurate and affordable research to our clients.<br />
Our research team has expertise in diverse fields like Automotive, Chemicals, Consumer<br />
Product & Services, Electronics, Food & Beverages, Healthcare etc., However diverse the<br />
expertise maybe, everyone in our team shares one common trait - we love data and we love<br />
providing solutions to clients using that data even more! Seeing your business flourish based<br />
on our solutions and strategy is what we love the most!<br />
IndustryARC publishes more than 30 reports on an annual basis in the mentioned Industries.<br />
Our reports are in-depth and high quality reports that can help decision makers frame better<br />
strategies for their business requirements. These reports can be further customized as per your<br />
needs.<br />
Disclaimer:<br />
• The reports sold by IndustryARC are limited publications containing valuable market<br />
information provided to a select group of customers in response to orders.<br />
• Our customers acknowledge and agree that any report bought from IndustryARC is for<br />
their own internal use and not for general publication or disclosure to third parties.<br />
• Our reports or part of the reports, information contained in the report, cannot be<br />
shared or resold to any other third party.<br />
• Disclosure to third parties, usage of data in a public document, article or blog by the<br />
customer can be done with prior permission taken from IndustryARC.<br />
For information regarding permissions and sales, contact:<br />
sales@industryarc.com | sanjay.matthews@industryarc.com
To Enquire About<br />
the Report Click<br />
Here<br />
IndustryARC<br />
+1 614 - 588 - 8538<br />
sales@industryarc.com<br />
Copyright ©2015 IndustryARC<br />
All Rights Reserved. This document contains highly confidential information and is the sole<br />
property of IndustryARC. No part of it may be circulated, copied, quoted, or otherwise reproduced<br />
without the approval of IndustryARC.