Use of Radar and Other Data for Forecasting - UCAR Africa Initiative
Use of Radar and Other Data for Forecasting - UCAR Africa Initiative
Use of Radar and Other Data for Forecasting - UCAR Africa Initiative

You also want an ePaper? Increase the reach of your titles
YUMPU automatically turns print PDFs into web optimized ePapers that Google loves.
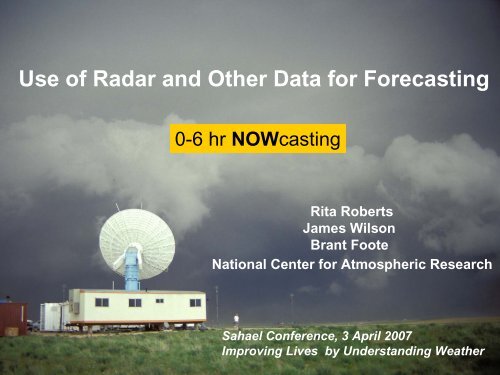
<strong>Use</strong> <strong>of</strong> <strong>Radar</strong> <strong>and</strong> <strong>Other</strong> <strong>Data</strong> <strong>for</strong> <strong>Forecasting</strong>0-6 hr NOWcastingRita RobertsJames WilsonBrant FooteNational Center <strong>for</strong> Atmospheric ResearchSahael Conference, 3 April 2007Improving Lives by Underst<strong>and</strong>ing Weather
How to Make the Most <strong>of</strong><strong>Radar</strong> <strong>for</strong> 0-6 hr Nowcasting•For Water Management <strong>and</strong> Agriculture•For Prediction <strong>of</strong> Thunderstorms•For Warning <strong>of</strong> Flash Flooding <strong>and</strong> Severe Weather•For Avoidance <strong>of</strong> Weather-Related Aviation HazardsAnd Terminal <strong>and</strong> Enroute Aviation PlanningWomen in Burkina Faso prepare anearthen bund to slow rain run-<strong>of</strong>f <strong>and</strong>prevent erosion <strong>of</strong> the topsoil.B. Lamptey TalkTuesday at 12:00
Aviation Weather• Weather is a contributing or causal factorin– 90% <strong>of</strong> General Aviation accidents– 25% <strong>of</strong> commercial aircraft accidents• Causes 75% <strong>of</strong> the airline delays• Need <strong>for</strong> Decision SupportSystemsDallas/Ft Worth
Air Traffic Flow In <strong>and</strong> Out <strong>of</strong> New York City
OutlineThunderstorm -• Predictability• Basic underst<strong>and</strong>ing <strong>of</strong> evolution• Nowcasting System
OutlineThunderstorm -• Predictability• Basic underst<strong>and</strong>ing <strong>of</strong> evolution• Nowcasting System
Thunderstorm LifetimeSingle cell storms live < 30 minSingle cell storms live < 30 minMulti-cell storm systems live> 30 min(Henry 1993; Battan 1953; Foote <strong>and</strong> Mohr 1979)
Example Evolution <strong>of</strong> a Single Cell <strong>and</strong> a Convective SystemsSIZESingle-cell ThunderstormConvective Storm System1 2 3 4 5TIME (hr)There are frequent <strong>and</strong> rapid changes in storm size <strong>and</strong>intensity.
Nowcasting by extrapolationEcho at Time-1Time-2Time-3NorthTime-4Nowcast <strong>for</strong>Time-5TITANEast
Predictability1InitiationExtrapolationForecast SkillGrowthDecayNWP02 46 8Forecast Length (hr)
Predictability using <strong>Radar</strong><strong>Radar</strong>Reflectivity5 hr elapsedtime
OutlineThunderstorm -• Predictability• Basic underst<strong>and</strong>ing <strong>of</strong> evolution• Nowcasting System
Basic Underst<strong>and</strong>ing Of Evolution Using <strong>Radar</strong>Factors important in determining storm initiation• Convergence lines (boundaries)• Orography <strong>and</strong> Terrain Features• Boundary relative cell motion• Boundary collision•Climatology – Preferred regions
Basic Underst<strong>and</strong>ing Of Evolution Using <strong>Radar</strong>Factors important in determining storm initiation• Convergence lines• Orography <strong>and</strong> Terrain FeaturesBoundary relative cell motion• Boundary collision•Climatology – Preferred regions
Boundary Influences on Thunderstorm EvolutionBoundary layer convergence lines (boundaries) frequentlyinfluence the evolution <strong>of</strong> thunderstorms. These boundariescan <strong>of</strong>ten be observed in:1. Satellite cloud imagery.Note the N-S line <strong>of</strong>cumulus associated witha sea breeze along theFlorida east coast.2. Clear-air radar features.Note enhanced N-S line<strong>of</strong> reflectivity associatedwith a boundary. Redarrows are wind directionfrom surface stations.
15:41Reflectivity15:41DopplerRadial Velocity16:48Reflectivity17:21Reflectivity
Basic Underst<strong>and</strong>ing <strong>of</strong> Evolution Using <strong>Radar</strong>Factors important in determining storm initiationConvergence lines• Boundary collision• Boundary relative cell motion• Orography <strong>and</strong> Terrain Features• Climatology – Preferred regions
Basic Underst<strong>and</strong>ing <strong>of</strong> Evolution Using <strong>Radar</strong><strong>Radar</strong>ReflectivityTime Lapse= 5 hr120 km
Basic Underst<strong>and</strong>ing <strong>of</strong> Evolution Using <strong>Radar</strong>Factors importantin determiningstorm initiation• Orography• Boundary relativecell motion• Boundary collisionAmazonBenignenvironmentCourtesy <strong>of</strong>Andrea Lima
Basic Underst<strong>and</strong>ing <strong>of</strong> Evolution Using <strong>Radar</strong>Factors importantin determiningstorm initiation• Orography• Boundary-relativecell motion• Boundary collisionAmazon (Brazil)Satellite visibleimagesCourtesy <strong>of</strong>Andrea Lima
Basic Underst<strong>and</strong>ing <strong>of</strong> Evolution Using <strong>Radar</strong>Factors importantin determiningstorm initiation• Orography• Boundary-relativecell motion• Boundary collisionAmazon (Brazil)<strong>Radar</strong> reflectivityCourtesy <strong>of</strong>Andrea Lima
Basic Underst<strong>and</strong>ing <strong>of</strong> Evolution Using <strong>Radar</strong>Factors importantin determiningstorm initiation• Orography• Boundary-relativecell motion• Boundary collisionConceptual model <strong>of</strong> storm evolution over the Amazon
29 August 2006 Cartesian Image at 1.75 kmBamako<strong>Radar</strong> & Airport15:57
29 August 2006 Cartesian Image at 1.75 km16:09
29 August 2006 Cartesian Image at 1.75 km16:22
29 August 2006 Cartesian Image at 1.75 km16:35
29 August 2006 Cartesian Image at 1.75 km17:09
29 August 2006 Cartesian Image at 1.75 km17:35
29 August 2006 Cartesian Image at 1.75 km18:09
29 August 2006 Cartesian Image at 1.75 km18:44
Basic underst<strong>and</strong>ingFactors important in determining storm initiationConvergence lines• Boundary collision• Boundary relative cell motion• Orography <strong>and</strong> Terrain Features• Climatology – Preferred regions
<strong>Radar</strong> Climatology <strong>for</strong> a Specific Region(Diurnal Cycle <strong>of</strong> Storm Locations – 7 Years <strong>of</strong> <strong>Radar</strong> <strong>Data</strong>)9-10 Local 10-11 Local 11-12 Local 12-13 Local 13-14 Local14-15 Local15-16 Local 16-17 Local 17-18 Local18-19 Local19-20 Local 20-21 Local21-22 Local22-23 Local23-24 LocalPercentage <strong>of</strong> radar volumes that had greater than 35 dBZ observed.
<strong>Radar</strong> Climatology <strong>for</strong> a Specific RegionDiurnal Cycle <strong>of</strong> Storm Locations: Winds from Southerly Direction9-10 Local10-11 Local11-12 Local12-13 Local13-14 Local14-15 Local15-16 Local 16-17 Local 17-18 Local18-19 Local19-20 Local 20-21 Local 21-22 Local 22-23 Local 23-24 LocalPercentage <strong>of</strong> radar volumes that had greater than 35 dBZ observed. Saxen, 2005
<strong>Radar</strong>ReflectivityMosaics <strong>of</strong> 2 ormore radars
Hourly average frequency <strong>of</strong> radar echo <strong>for</strong> June, July & Aug1996-2003FrequencyDavid Ahijevych NCAR
OutlineThunderstorm Storm -• Predictability• Basic underst<strong>and</strong>ing <strong>of</strong> evolution• Nowcasting System
NCAR Thunderstorm System (Auto-Nowcaster)is unique in its ability to provide nowcasts <strong>of</strong> storm initiationby…..Detection <strong>and</strong>extrapolation <strong>of</strong>surface convergenceboundaries ….….that triggerthunderstorm initiation<strong>and</strong> impact stormevolution.
NCAR Thunderstorm Nowcast System (Auto-Nowcaster)• Produces 0-1 hr time <strong>and</strong>place specific <strong>for</strong>ecast• Expert system utilizes fuzzylogic• Ingest multiple data sets• 4-D Variational Doppler<strong>Radar</strong> Analysis System(VDRAS)• Extrapolates radar echos• Forecast storm initiation,growth <strong>and</strong> dissipation• Algorithms derive <strong>for</strong>ecastparameters based on thecharacteristics <strong>of</strong> theboundary-layer, storms, <strong>and</strong>clouds.
Nowcasting Methodology• Boundary layer structure– convergence line position– colliding boundaries– strength <strong>of</strong> theconvergence– low-level shear– boundary-relative steeringflow– stabilityConvergence LineLifting ZoneConvergence strength
Boundary Influences on Thunderstorm EvolutionBoundary Characteristics That Influence StormEvolution• Low-level Shear Relative to BoundaryThe low-level shear is the vectordifference, normal to the boundary,<strong>of</strong> the surface wind minus the2.5 km wind. It can varyconsiderable along the boundary.This parameter is indicative <strong>of</strong>How tilted the updrafts will be.Values < -8 m/s favor erectUpdrafts <strong>and</strong> thus more intense<strong>and</strong> long lived storms.(Thorpe et al. 1982, Rotunno et al., 1988, Weisman <strong>and</strong> Klemp 1986)
Stability Influences on Thunderstorm EvolutionSoundings are <strong>of</strong> limited use <strong>for</strong> thunderstormnowcasting because <strong>of</strong> small-scale variability inwater vapor.CONVERGENCE LINE MODIFIESIn this example threesimultaneous soundingsshow there are largevariations in theconvective availablepotential energy(orange area) overshort distances in thevicinity <strong>of</strong> aconvergence line.THE WATER VAPOR FIELDWilson et al., 1992
Nowcasting Methodology• Boundary layer structure– convergence line position– colliding boundaries– strength <strong>of</strong> theconvergence– low-level shear– boundary-relative steeringflow– stability• Cloud characteristics-cloud type-cloud growth-cloud top temperatures-new cloud motionCumulus Cloud GrowthAbove Boundary
Infrared Satellite Cloud Top Temperatures<strong>Use</strong>d as Predictor <strong>of</strong> Storm GrowthVisibleInfrared2 June 2000
Satellite-based, Feature DetectionAlgorithms• Cross-correlation tracker(CTREC) on GOES-IR• Upstream thresholding <strong>of</strong> satellitedata (satThresh)• IR Temperature Change(RateOfChange)• Shortwave Reflectance(satDerive)• Cloud classification (CloudClass)• Atmospheric Stability CTRECCloudClassRateOfChange satThresh satDerive (satellite (ROC) reflectance)High CAPELowCAPE
Nowcasting Methodology• Boundary layer structure– convergence line position– colliding boundaries– strength <strong>of</strong> theconvergence– low-level shear– boundary-relative steeringflow– stability• Cloud characteristics-cloud type-cloud growth-cloud top temperatures-new cloud motion• Storm Characteristics- position <strong>and</strong> motion- growth rate - stormstructure- storm merger- storm-boundary interaction- storm decay
Thunderstorm Characteristics:<strong>Radar</strong> can provide time trends <strong>of</strong> thunderstormmovement, size, height, intensity, etc.TITAN(
ExtrapolatedGrowth Maximum <strong>Radar</strong> Storm Reflectivity Area RateStorms Reflectivity
Nowcasting Methodology• Boundary layer structure– convergence line position– colliding boundaries– strength <strong>of</strong> theconvergence– low-level shear– boundary-relative steeringflow– stability• Cloud characteristics-cloud type-cloud growth-cloud top temperatures-new cloud motion• Storm Characteristics- position <strong>and</strong> motion- growth rate - stormstructure- storm merger- storm-boundary interaction- storm decayWhat do you do with all this in<strong>for</strong>mation???
Produce 1-2 hr Nowcasts <strong>of</strong> Storm Initiation, Growth <strong>and</strong> Decay• Environmental conditions (NumericalModel)– Frontal <strong>for</strong>cing– CAPE/CIN– CAPE– Relative humidity• Boundary-layer– Convergence/vertical shear alongboundary– Colliding boundaries– Vertical velocity along boundary– Boundary-relative steering flow– New storms along boundary60 min Storm InitiationLikelihood FieldProcess a lot <strong>of</strong> in<strong>for</strong>mation quickly.Nowcasts produced every 6-10 min• Clouds– Clear sky or cumulus clouds– Cloud growth observed with cloud topcooling rateBlue Regions - Little chance <strong>of</strong> storm developmentGreen Regions - Moderate likelihood <strong>for</strong> thunderstormsRed Regions - Areas <strong>of</strong> <strong>for</strong>ecast storm initiation
Auto-Nowcaster SystemProvides 1 hr Nowcasts <strong>of</strong>:Thunderstorm Initiation, Extrapolation, Growth <strong>and</strong> Decay1 hour <strong>for</strong>ecast VerificationStorm InitiationnowcastsExtrapolated nowcasts
Future Nowcast SystemsBlended Nowcast SystemsExtrapolationNWPForecast LengthForecast Skill
6 hr Blended ForecastsNumerical Model6 hr ForecastObservations6 hr ExtrapolationsIssued at July 14, 2004 at 19:00, Valid July 15, 2004 01:00Green Contour - 35 dBZ radar reflectivity at valid time
What is needed to get started?Build Infrastructure:• Well-calibrated radar• High Speed communications (mosaic’ingin real-time)• <strong>Data</strong> quality algorithms• <strong>Radar</strong> detection <strong>and</strong> <strong>for</strong>ecast algorithms• Forecasters trained in very short period<strong>for</strong>ecasting
End