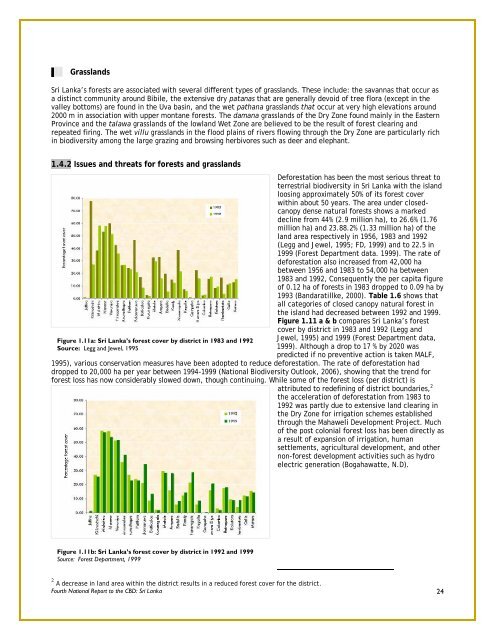
.11 GrasslandsSri Lanka’s forests are associated with several different types of grasslands. These include: the savannas that occur asa distinct community around Bibile, the extensive dry patanas that are generally devoid of tree flora (except in thevalley bottoms) are found in the Uva basin, and the wet pathana grasslands that occur at very high elevati<strong>on</strong>s around2000 m in associati<strong>on</strong> with upper m<strong>on</strong>tane forests. The damana grasslands of the Dry Z<strong>on</strong>e found mainly in the EasternProvince and the talawa grasslands of the lowland Wet Z<strong>on</strong>e are believed to be the result of forest clearing andrepeated firing. The wet villu grasslands in the flood plains of rivers flowing through the Dry Z<strong>on</strong>e are particularly richin biodiversity am<strong>on</strong>g the large grazing and browsing herbivores such as deer and elephant.1.4.2 Issues and threats for forests and grasslandsFigure 1.11a: Sri Lanka’s forest cover by district in 1983 and 1992Source: Legg and Jewel, 1995Deforestati<strong>on</strong> has been the most serious threat toterrestrial biodiversity in Sri Lanka with the islandloosing approximately 50% of its forest coverwithin about 50 years. The area under closedcanopydense natural forests shows a markeddecline from 44% (2.9 milli<strong>on</strong> ha), to 26.6% (1.76milli<strong>on</strong> ha) and 23.88.2% (1.33 milli<strong>on</strong> ha) of theland area respectively in 1956, 1983 and 1992(Legg and Jewel, 1995; FD, 1999) and to 22.5 in1999 (Forest Department data. 1999). The rate ofdeforestati<strong>on</strong> also increased from 42,000 habetween 1956 and 1983 to 54,000 ha between1983 and 1992, C<strong>on</strong>sequently the per capita figureof 0.12 ha of forests in 1983 dropped to 0.09 ha by1993 (Bandaratillke, 2000). Table 1.6 shows thatall categories of closed canopy natural forest inthe island had decreased between 1992 and 1999.Figure 1.11 a & b compares Sri Lanka’s forestcover by district in 1983 and 1992 (Legg andJewel, 1995) and 1999 (Forest Department data,1999). Although a drop to 17 % by 2020 waspredicted if no preventive acti<strong>on</strong> is taken MALF,1995), various c<strong>on</strong>servati<strong>on</strong> measures have been adopted to reduce deforestati<strong>on</strong>. The rate of deforestati<strong>on</strong> haddropped to 20,000 ha per year between 1994-1999 (Nati<strong>on</strong>al Biodiversity Outlook, 2006), showing that the trend forforest loss has now c<strong>on</strong>siderably slowed down, though c<strong>on</strong>tinuing. While some of the forest loss (per district) isattributed to redefining of district boundaries, 2the accelerati<strong>on</strong> of deforestati<strong>on</strong> from 1983 to1992 was partly due to extensive land clearing inthe Dry Z<strong>on</strong>e for irrigati<strong>on</strong> schemes establishedthrough the Mahaweli Development Project. Muchof the post col<strong>on</strong>ial forest loss has been directly asa result of expansi<strong>on</strong> of irrigati<strong>on</strong>, humansettlements, agricultural development, and othern<strong>on</strong>-forest development activities such as hydroelectric generati<strong>on</strong> (Bogahawatte, N.D).Figure 1.11b: Sri Lanka’s forest cover by district in 1992 and 1999Source: Forest Department, 19992 A decrease in land area within the district results in a reduced forest cover for the district.Fourth Nati<strong>on</strong>al Report to the CBD: Sri Lanka 24
TABLE 1.7: Trends in detecti<strong>on</strong> of illicit forest encroachments(in areas managed by the Forest Department)Year2002Area encroached(ha)517.56Detecti<strong>on</strong>s1218Between 2002 and 2005, <strong>on</strong>lyabout 2394.24 ha of forestencroachments <strong>on</strong> forest reserveswere recorded despite 3680detecti<strong>on</strong>s of illicit clearing(Table 1.7). Past deforestati<strong>on</strong>and c<strong>on</strong>tinuing illegal timber2003 950.42 960felling has already reduced thebiodiversity of Dry Z<strong>on</strong>e forests,2004 567.09 805so that mature individuals ofvaluable timber species have2005 359.17 697become exceedingly rare. Many ofthese species were listed asthreatened during successiveSource: Nati<strong>on</strong>al Envir<strong>on</strong>mental Outlook (2006)threat listing process (IUCN, 2000;IUCN and MoENR, 2007). Whilerelatively large forests tracts do still remain in the Dry Z<strong>on</strong>e, clearing to establish reservoirs for hydropowergenerati<strong>on</strong>, human settlements and agriculture has c<strong>on</strong>siderably depleted the forest cover in this regi<strong>on</strong> during the lastcentury. This has in turn increased the threat status of the large and charismatic mammalian fauna, particularly theelephant, by reducing their preferred habitats, increasing vulnerability to poaching and disrupting wildlife migrati<strong>on</strong>routes with a c<strong>on</strong>sequent increase in human-wildlife c<strong>on</strong>flicts. Forest loss due to chena or slash and burn cultivati<strong>on</strong> isstill a major threat to Dry Z<strong>on</strong>e forests, while cattle grazing degrades Dry Z<strong>on</strong>e forests and results in loss of fodder forwildlife such as elephants and other large herbivores.Birds such as the orange-billed Babbler (Turdoides rufescens) are suspected to have become locally extinct from some degraded and fragmentedforest patches, and the endemic Whistling Thrush (Myoph<strong>on</strong>us blighi) is affected by the extensive clearance and degradati<strong>on</strong> of m<strong>on</strong>tane forests forc<strong>on</strong>versi<strong>on</strong> to timber plantati<strong>on</strong>s and agriculture. The adverse impacts of forest loss and forest fragmentati<strong>on</strong> have also had its toll <strong>on</strong> the uniqueand threatened shrub frogs of the genus Philautus that are restricted to the Wet Z<strong>on</strong>e. Several of these species are now extinct.Source: IUCN and MoENR, 2008The loss of natural habitats has caused several species to undergo local extincti<strong>on</strong>s in the Western Province of SriLanka during the last three decades. The nati<strong>on</strong>al Red List of 2007 states that am<strong>on</strong>gst those most affected have beenseveral arboreal endemic mammals: the purple-faced leaf m<strong>on</strong>key (Semnopithecus vetulus), the golden palm civet(Paradoxurus zeyl<strong>on</strong>ensis) and the red slender loris (Loris tardigradus).Due to selective removal, mature trees of several valuable timber species such as satin wood and eb<strong>on</strong>y are now veryrare, despite adequate natural regenerati<strong>on</strong>. The nature and extent of forest resource use varies according to locati<strong>on</strong>and socio-ec<strong>on</strong>omic level of the local communities. However, depleti<strong>on</strong> of n<strong>on</strong>-timber forest resources occurred in allclimatic z<strong>on</strong>es due to over exploitati<strong>on</strong> of species of commercial or subsistence value. This demand for forest productssuch as wood for poles and posts, food items, resins, rattan and bamboo, biomass for fuelwood and medicinal plantswas a major cause of forest degradati<strong>on</strong> through to the 1990s. As a result, all ten species of rattans in the country, andseveral bamboo and medicinal plants of commercial value, are now nati<strong>on</strong>ally threatened (MALF, 1995; IUCN andMoENR, 2007). Fuelwood collecti<strong>on</strong> has been particularly damaging to forests *IUCN, 1994), due to debarking of treesto increase dead wood for collecti<strong>on</strong>, and this is c<strong>on</strong>tinuing in some regi<strong>on</strong>s even now.Alien invasive species have been identified to reach threat proporti<strong>on</strong>s in several natural forests, such as Lantana sp.at Uda Walawe Nati<strong>on</strong>al Park; Ulex europeus at Hort<strong>on</strong> Plains Nati<strong>on</strong>al Park and Prosopis julifolra at the BundalaNati<strong>on</strong>al Park.Fourth Nati<strong>on</strong>al Report to the CBD: Sri Lanka 25
- Page 1 and 2: Fourth Country Report from Sri Lank
- Page 3: Cover photo credits•••• Gra
- Page 6 and 7: Chapter 22.1 Introduction ……392
- Page 8: List of figuresFigure 1.1 Map of Sr
- Page 11 and 12: Baseline Biodiversity Survey (BBS)
- Page 13 and 14: through skills building for reporti
- Page 15: Chapter 11.1 IntroductionThis chapt
- Page 19 and 20: Figure 1.2: Major climatic zones ba
- Page 21 and 22: Evolutionary significance of Sri La
- Page 23 and 24: 1.3 Species diversity1.3.1 StatusSr
- Page 25 and 26: .11 Coastal and marine ecosystemsTA
- Page 27 and 28: wetland habitats (MALF, 1995; IUCN
- Page 29 and 30: Dry monsoon forests (Figure 1.3) lo
- Page 31: woody species and faunal diversity
- Page 35 and 36: Bank, 2008), and are distributed th
- Page 37 and 38: salt marshes occur along the coast
- Page 39 and 40: Sri Lanka also has a range of cerea
- Page 41 and 42: TABLE 1.8: Germplasm Collection Sta
- Page 43 and 44: Soil erosion is extremely high in t
- Page 45 and 46: 1.8.5 Impact of changes in biodiver
- Page 47 and 48: Chapter 22.1 IntroductionSri Lanka
- Page 49: • The importance of Communication
- Page 53 and 54: 2.2.5 Institutional arrangements fo
- Page 55 and 56: problem for non-implementation of t
- Page 57 and 58: Key threats Specific issue Statusco
- Page 59 and 60: Key threats Specific issue StatusSp
- Page 61 and 62: TABLE 2.2: Major donor funded proje
- Page 63 and 64: Chapter 33.1 IntroductionThe Confer
- Page 65 and 66: Primary Stakeholders*Secondary stak
- Page 67 and 68: laws concerning access to genetic r
- Page 69 and 70: TABLE 3.3: Integration of biodivers
- Page 71 and 72: Area of purviewPolicies / plans/ la
- Page 73 and 74: Overall, biodiversity consideration
- Page 75 and 76: SectorInstitutions, mandates and na
- Page 77 and 78: Planning and policydevelopmentMonit
- Page 79 and 80: oth western and traditional (i.e. A
- Page 81 and 82: the need for a mechanism to impleme
- Page 83 and 84:
Stockholm Convention</stron
- Page 85 and 86:
Chapter 44.1 Introduction4.1.1 The
- Page 87 and 88:
4.2.4. Evaluation of achieving targ
- Page 89 and 90:
for declaration of PAs, and adoptio
- Page 91 and 92:
• Programmes for ex-situ conserva
- Page 93 and 94:
The crop wild relatives projectThe
- Page 95 and 96:
WetlandsUnder the Wetland Conservat
- Page 97 and 98:
active in detecting such illegal ex
- Page 99 and 100:
ecause of anthropogenic factors suc
- Page 101 and 102:
• Systematic gathering of atmosph
- Page 103 and 104:
egion for over a week (Arulpragrasa
- Page 105 and 106:
FOCAL AREA: MAINTAIN GOODS AND SERV
- Page 107 and 108:
FisheriesThe national marine fisher
- Page 109 and 110:
• Health and well being of rural
- Page 111 and 112:
• The MoENR has formulated a nati
- Page 113 and 114:
4.3 Impact of NBSAPs and related se
- Page 115 and 116:
Strategic goalsScale ofagreementSri
- Page 117 and 118:
Strategic goalsScale ofagreementSri
- Page 119 and 120:
Ministry of Environment & Natural R
- Page 121 and 122:
Appendix II - Further sources of in
- Page 123 and 124:
62. Fernando, N. (1997) A Personnal
- Page 125 and 126:
133. MoENR, 2007b. The Thematic Ass
- Page 127 and 128:
Appendix IIIProgress towards Target
- Page 129 and 130:
.2.1 Protected Areas under the DWLC
- Page 131 and 132:
National Target (NCSA 3 5.7, 2007)I
- Page 133 and 134:
disturbance by over-visitation and
- Page 135 and 136:
PoWPA Target: By 2008, sufficient f
- Page 137 and 138:
Project (2001-2008)Other Policies,
- Page 139 and 140:
There is no overall policy to guide
- Page 141 and 142:
The ADB funded Forest Resources Man
- Page 143 and 144:
Status of actions taken/in progress
- Page 145 and 146:
The Community Participation Project
- Page 147 and 148:
B.4.8 PoWPA Goal 3.2 - To build cap
- Page 149 and 150:
B.5 Overview of obstacles for imple