GREENING UCSB: DEVELOPMENT OF AN ASSESSMENT ...
GREENING UCSB: DEVELOPMENT OF AN ASSESSMENT ...
GREENING UCSB: DEVELOPMENT OF AN ASSESSMENT ...

Create successful ePaper yourself
Turn your PDF publications into a flip-book with our unique Google optimized e-Paper software.
UNIVERSITY <strong>OF</strong> CALIFORNIASanta Barbara<strong>GREENING</strong> <strong>UCSB</strong>: <strong>DEVELOPMENT</strong> <strong>OF</strong> <strong>AN</strong> <strong>ASSESSMENT</strong> PROTOCOL <strong>AN</strong>DPOLICY STATEMENT TO IMPROVE CAMPUS SUSTAINABILITYA Group Project submitted in partial satisfactionof the requirements for the degree ofMaster’s in Environmental Science and Managementfor theDonald Bren School of Environmental Science & ManagementbyTarlie HarrisJeff MeiserHeather RosenbergAutumn SalamackCommittee in charge:Professor Jeff DozierJune 2001
<strong>GREENING</strong> <strong>UCSB</strong>: <strong>DEVELOPMENT</strong> <strong>OF</strong> <strong>AN</strong> <strong>ASSESSMENT</strong> PROTOCOL <strong>AN</strong>DPOLICY STATEMENT TO IMPROVE CAMPUS SUSTAINABILITYAs authors of this Group Project report, we are proud to archive it in DavidsonLibrary so the results of our research are available for all to read. Our signatures onthe document signify our joint responsibility to fulfill the archiving standards set byGraduate Division, Davidson Library, and the Donald Bren School of EnvironmentalScience & Management.Tarlie HarrisJeff MeiserHeather RosenbergAutumn SalamackThis mission of the Donald Bren School of Environmental Science & Management isto produce professionals with unrivaled training in environmental science andmanagement who will devote their unique skills to the diagnosis, assessment,mitigation, prevention, and remedy of the environmental problems of today and thefuture. A guiding principal of the School is that the analysis of environmentalproblems requires quantitative training in more than one discipline and an awarenessof the physical, biological, social, political, and economic consequences that arisefrom scientific or technological decisions. The Group Project is required of allstudents in the Master’s of Environmental Science and Management (MESM)Program. It is a three-quarter activity in which small groups of students conductfocused, interdisciplinary research on the scientific, management, and policydimensions of a specific environmental issue. This Final Group Project Report isauthored by MESM students and has been reviewed and approved by:Professor Jeff DozierApril 2001Dean Dennis Aigner
DEDICATIONWhen we first embarked on this project, we had no real inkling of the complexities ofthe organism that is <strong>UCSB</strong>. Like most students, we were unaware of the tremendousamount of equipment and resources required to make the campus run. Nor did wehave any concept of the number of creative and dedicated people who work behindthe scenes to bring the campus to life. In many ways the real work involved inmaking a sustainable campus will rest on their shoulders, and will come from theirhearts. We are indebted to them for all of their patient help with our research for thisproject, and for the jobs they do everyday to make our education possible. It is tothem that we dedicate this report.iii
ACKNOWLEDGEMENTSWe received extensive help from many members of the campus and surroundingcommunity. In particular, we would like to thank the following for providingnumerous interviews, data, editing skills, support for our research and an in-depthlook at campus operations:Ali Aghana, Environmental Health Program Manager; Curtis Anderson, Professor,Chemistry Department; Ray Aronson, Civil Engineer; Ken Bowers, Director, <strong>UCSB</strong>Bookstore and Collegiate Licensing; Karl Brown, UCOP Program Manager--Building Systems; Bruce Carter, Hazardous Waste Program Coordinator; Meta Clow,Assistant to VC Sheldon; Andrea Cohen, Bren School Student; Jon Cook, Sr.Superintendent of Grounds; Joe Dandona, Zone Lead; Jim Dewey, Energy Manager;Jeff Dozier, Bren School Professor; Jeri DuBoux, Sr. Buyer, Furniture Specialist;Wayne Ferren, Executive Director, Museum of Systematics & Ecology,Ecology,Evolution & Marine Biology; David Gonzales, Director, Physical Facilities;Paul Gritt, Zone 3 Co-Lead; Mary Ann Hopkins, Administrative Analyst; SteveHowson, Central Stores Manager; David Inouye, Grounds Operations Manager;Laura Jensen, AS Recycling Outreach Coordinator; Kevin Kaboli, Campus IndustrialHygenist; Mo Lovegreen, Assistant Dean of Planning & Administration, Bren School;Gary Matteson, UCOP Associate Director-Energy & Utility Services; Marla Mazur,Graduate Program Assistant, Bren School; Paul Relis, ES Professor; Tye Simpson,Director of Physical and Environmental Planning; The Sustainability Project; JamesWagner, TAP Coordinator; and Jack Wolever, Director- Design & Construction.iv
<strong>GREENING</strong> <strong>UCSB</strong>: <strong>DEVELOPMENT</strong> <strong>OF</strong> <strong>AN</strong> <strong>ASSESSMENT</strong> PROTOCOL <strong>AN</strong>DPOLICY STATEMENT TO IMPROVE CAMPUS SUSTAINABILITYGroup MembersTarlie Harris, Jeff Meiser, Heather Rosenberg and Autumn SalamackFaculty AdvisorProfessor Jeff DozierThis project provides a framework for increasing the sustainability of <strong>UCSB</strong> and theUC system, and is composed of two core components: an environmental assessmentand a policy framework. The environmental assessment contains both anenvironmental survey of campus operations and an analysis of the subsequentfindings in six core areas: building design, energy, waste management, air quality andtransportation, water management and landscape management. The results of thisassessment were then converted into a subjective grading scheme to identify theprogressiveness of each campus sector and to provide recommendations forimprovement. The final component of this report, the policy framework, contains adraft policy statement on sustainability and a feasibility study for policy adoption.The policy framework identifies both institutional and external barriers to campussustainability and provides a sense of the feasibility of the adoption andimplementation of such a policy at <strong>UCSB</strong>. This framework is transferable to otheruniversities as a model for hands-on application of sustainability principles. It is ourhope that this work will spur a dedicated commitment to sustainability by the UCsystem and result in improved environmental performance.v
EXECUTIVE SUMMARYIntroductionThe design and construction of Bren Hall may herald a new era of sustainability forthe University of California, Santa Barbara and the UC system. This “green” buildingincorporates the fundamental principles of sustainability: waste minimization,conservation of the natural environment and minimization of resource consumption.However, the Bren building represents only one building on a campus with manybuildings, in a system of nine campuses. Thus, the greening of Bren Hall is importantand useful only if the lessons learned apply to the <strong>UCSB</strong> campus and the UC systemin general. Two important questions arise: (1) What is the overall environmentalperformance of the campus? (2) How do we adhere to these principles ofsustainability, whose definitions and metrics change over time? With these questionsin mind, Greening <strong>UCSB</strong> was commissioned as a graduate project for the BrenSchool of Environmental Science and Management.Bren Hall has opened a window of opportunity for the University to address the issueof campus sustainability. The University educates not only in the classroom, but alsothrough physical and social interactions within and outside the campus community.Therefore, the University is uniquely positioned to influence the behaviors and valuesof individuals both on campus and in the surrounding community by demonstratingits commitment to sustainability. <strong>UCSB</strong> is located in the center of a diverse andsensitive ecological area that is surrounded by wetlands and coastal bluffs andimpacted by the large number of people and the range of activities carried out oncampus. Thus, actions taken by the University can have important implications for thesurrounding habitat.In addition to environmental benefits, campus greening efforts often result insubstantial cost savings, although in many cases, substantial capital investments arerequired. The principles of sustainability must become a focus of campus operationsand policy for the campus to realize concurrent environmental and economic benefits.Greening efforts will require changes in campus planning, operations, and practices.Increased spending associated with these changes can be justified in two ways:• Technology that is more efficient results in lower operating andmaintenance costs over time. When initial design and constructioncosts are the primary consideration, inefficient design, materials orequipment may be chosen to ensure that projects remain withinallotted budgets. However, life cycle cost analysis validates investmentin more efficient options that conserve both financial andenvironmental resources.vi
• Universities have a responsibility to promote social welfare. Themandate of a university is to invest in the future through research,education and training. Efforts to increase sustainability complementthis mandate.We structured this report to highlight the environmental and economic impactsassociated with campus operations, and to identify targets and means forimprovement. This report consists of two core components: a comprehensiveenvironmental assessment and a policy framework.Comprehensive Environmental AssessmentThe environmental assessment contains both an environmental survey of campusoperations and an analysis of the subsequent findings. The survey is composed of aseries of questions and answers centered on the principles of sustainability thatcharacterize campus operations in six key areas: Building Design, Energy Use, WasteManagement, Air Quality and Transportation, Water Management and LandscapeManagement. The analysis evaluates the environmental performance of <strong>UCSB</strong> andmakes recommendations for improvement. The information obtained from theassessment provides baseline data that can be used for future evaluations and servesas the justification for potential changes in policy and operations. The indicators ofsustainability that surface in this assessment are consistent with previous researchdone on campus sustainability.These indicators surfaced from our environmental assessment and were put into a‘test’ format. This ‘test’ used a binary grading scheme (yes or no), so that if theindicator was present on campus, it received a point, and if it was not present it didnot receive a point. The percentage of indicators present on campus correlated to agrade, which was then assigned to each key area of campus operations. We designedthis indicator framework for determining the level of sustainability on a collegecampus to be flexible and adjustable for changing priorities in evaluatingenvironmental responsibility. In addition, this framework is transferable to otherinstitutions. It is important to recognize that our evaluative indicators used in thisreport are oriented towards determining a measure of proactive efforts to embracesustainability that are currently underway on campus. The absence of these effortsdoes not that mean that the campus is a poor environmental performer; rather, itsuggests that the campus is not especially progressive in incorporating the principlesof sustainability into operations.Policy FrameworkThe policy framework contains a draft policy statement on sustainability and afeasibility study for policy adoption. The draft policy statement identifies overarchinggoals of campus sustainability, identifies corrective actions the University couldvii
undertake to improve the “trouble areas” identified by the environmental assessment,and serves to generate discussion of such issues at all levels of the University. Thefeasibility study contains a brief analysis of institutional and external barriers tocampus sustainability and provides potential strategies for overcoming these barriers.This framework is transferable to other universities as a model for hands-onapplication of sustainability principles.Campus Assessment ResultsThe campus has noted an increase in resource use in all campus sectors over the pastdecade. The major quantitative and qualitative findings from our environmentalsurvey are listed below by campus sector. The figure below describes quantitativefindings. A qualitative analysis of the assessment follows.• ~ 5500 tons of solidwaste generated annually• 40% of solid wasterecycled annually• Annual solid wastedisposal costs = $675K• ~128 tonshazardous wastegenerated annually• 62% of hazardouswaste is landfilledannually• 133,600 vehicle milestraveled daily• ~5300 gallons of gasolineconsumed daily• ~106,000 lbs. of carbondioxide emitted dailyfrom transportation• < 50% of the paperproducts purchasedand sold have recycledcontent• Environmentalpurchasing policy forfurniture• Natural areas occupy10% of the total campus• IPM policy developedin 1994 resulted indecreased pesticideuse• 80 million kWh ofelectricity coming consumed-annuallyline• 2.8 million th erms ofnatural gas consumedannually• Annual electricity costs =$5M• Annual natural gas costs =>$600K• Totalcampuscovers 3M ft 3• 6 newbuildings online by 2006• 204,351,356 gallons ofwater consumedannually• Reclaimed water =25% of total waterusage• ~400,000 gallons ofwastewater generateddailyEnvironmental survey results: Quantitative summary of campus environmentalperformanceviii
Building DesignSince the establishment of the Bren project, the Office of Design and Constructionhas added a statement to all “requests for qualifications” from architects expressingthe campus’s commitment to sustainability. Several upcoming new building projects,including the new engineering and life sciences buildings, will incorporate greenbuilding features. However, demand for green features in these projects has comefrom the future occupants; no current policies mandate green building practices. Acampus wide commitment to sustainability is required to ensure that greening effortswill continue in a cost-effective manner on all future campus projects.EnergyThe campus Energy Team has been working to reduce energy demand and tomaximize the efficiency of campus systems. However, more could be done to limitthe overall environmental impact of the campus from energy use by continuinginvestment in system upgrades, increasing investment in on-site co-generationthrough alternative sources (solar, wind and fuel cells), providing training to staff onthe proper use of efficiency equipment, and increasing user awareness on ways tolimit energy demand. Energy Team staff can also increase their involvement in thebuilding design process to ensure that energy efficiency is incorporated into all newcampus structures. In order for full energy savings to be realized, investment inenergy projects must be prioritized.Waste ManagementSolid Waste and Recycling<strong>UCSB</strong> has focused intensively on recycling efforts, with only a minimal effortdirected towards source reduction. The University could work to alleviate theenvironmental and financial costs associated with solid waste disposal by:maximizing paper reuse, establishing a formal budget for the recycling program,increasing the use of recycled paper on campus, and undertaking a massive sourcereduction campaign. In addition, substantial source reduction could allow theUniversity to reclaim a significant share of its $675,000 annual costs for solid wastedisposal.Hazardous WasteThe University has implemented a hazardous waste reduction program, although avital component of this program, the Chemical Exchange Program (CEP), has beenstymied due to a lack of funding. The University could decrease impacts associatedwith hazardous waste by: seeking means for fully developing the CEP and theaccompanying on-line hazardous waste management program, reviewing the currentix
hazardous waste pick-up system, developing a tracking system for wastes exiting thesystem, and providing guidelines and management for hazardous waste and chemicalpurchases to ensure that no more is purchased than is actually needed.PurchasingImproved environmental performance could be achieved with respect to allUniversity purchases by: incorporating environmental/sustainable criteria intopurchasing contracts, devising minimum recycled content criteria for all Universityemblematic paper products, contacting suppliers to gain awareness of recycledcontent product offerings beyond paper, and increasing education of Universitypersonnel. In addition, cost savings on recycled content products could be realized viamembership in the Recycled Products Purchasing Cooperative.Transportation and Air QualityThe parking and transportation department at <strong>UCSB</strong> has a well-developedTransportation Alternatives Program (TAP) to provide alternative commutingoptions for <strong>UCSB</strong> faculty, staff, and students. Participation in TAP has been steadilyincreasing over the past few years. However, the two necessary aspects ofenvironmentally friendly transportation policy on campus – influencing individualbehavior from the bottom up (TAP) and setting campus priorities from the top down(Budget and Planning) – are not well coordinated. The environmental impact oftransportation to/from <strong>UCSB</strong> could be reduced through revised parking permitdesignations, pertinent use of the permit revenues to subsidize alternativetransportation, an employee and student MTD subsidy, a stabilized TAP budget andadministration, and coordinated efforts between TAP and campus budget andplanning to curb single occupancy vehicle commuting to/from campus.Water UseWater ManagementWater conservation is acknowledged as an important campus goal of FacilitiesManagement but is not encoded in specific policy directives. Possible improvementsin water management include reducing or ending the use of potable water forirrigation, tracking water use by building and by use categories to identify areas forimprovement, ensuring the use of water efficient appliances in all new buildings, anddeveloping a schedule for retrofitting all existing water appliances.Water PollutionStorm water runoff is generated in unknown quantities with an unknownenvironmental impact on local ecosystems. Storm water, which is primarily untreated,runs directly into the Pacific Ocean, Campus Lagoon, and Goleta Slough. <strong>UCSB</strong>x
established an integrated pest management policy (IPM) in 1995, which reducedpesticide use on campus. <strong>UCSB</strong> could further reduce its environmental impact byassessing and treating the water quality effects of storm water runoff.Landscape Management<strong>UCSB</strong> is a highly developed campus, with only 10% remaining as natural areas.Landscaped portions of campus are populated by a wide variety of native and exoticplant species. There is no campus policy guiding the vegetative components ofcampus; rather, the “taste” of the campus is determined on a project-by-project basis.Improvements in landscape management could be made by establishing a set ofcriteria for new projects, developing a long-term vision for the campus landscape, andincreasing cooperation with local conservation groups to integrate <strong>UCSB</strong> naturalareas with the regional ecology.Campus Environmental Report CardUsing the binary grading scheme previously described, we evaluated each keycampus sector and obtained the following grades measuring campus environmentalperformance.Campus SectorCampus environmental report cardBuilding DesignGradeEnergy Use B-Waste Management C-Air Quality & Transportation C+Water ManagementLandscape Management C-CDThe Policy StatementThe final component of our report is a draft policy statement and a general feasibilitystudy for increasing the sustainability of University operations. The draft policyprovides language to make sustainability a core priority of the campus and identifiesways that this priority can be incorporated into all campus operations. In the processof conducting our campus audit, it became clear that any sustainability goals met on aproject-by-project basis result mainly from the effort of dedicated staff members,xi
ather than from a broad campus initiative or intent. Assurance that sustainabilitymeasures will continue to be maximized and prioritized over time requires acomprehensive top-down/ bottom-up policy.Our goal is to offer a springboard for the development of such a campus-widesustainability policy to be adopted by the Chancellor and Academic Senate. Thepolicy statement addresses energy conservation, building design, water conservation,waste minimization and alternative transportation, and provides a starting point forimplementing ideas and creating departmental procedures. The draft was discussedwith several key personnel in the upper and lower tiers of the University to determinethe feasibility of such a policy at <strong>UCSB</strong>. By evaluating assessment and policy on acampus-wide scale, we add to the growing body of campus greening literature anddevelop a model for the hands-on application of sustainability in other largeinstitutions.ConclusionOur study of the environmental performance of <strong>UCSB</strong> highlights two major trends:(1) an increased use of our natural resources, waste generation, and pollution of theenvironment, and (2) the development of important innovations in some areas ofcampus operations. These innovations, such as the IPM policy, the use of reclaimedwater, the formation of the Energy Team and the Recycling Committee, and the TAPprogram, have all had positive impacts on campus sustainability. We hope that theseinnovations mark the beginnings of a campus-wide move toward sustainability.However, to date, the first trend has been dominant. As a result, <strong>UCSB</strong> scored fairlylow marks on our sustainability scorecard: one B-, one C+, one C, two C-’s, and oneD. Individuals with a vision of cost savings, efficient operations and environmentalperformance are leading the progressive effort toward sustainability. However, theirability to significantly increase the sustainability of the campus is severely hamperedby a lack of overall, institutional support. We have identified two core institutionalbarriers to sustainability at <strong>UCSB</strong>:• Lack of a clear commitment to sustainability. There currently existsno clear commitment to sustainability in the institutional framework ofthe University, as is demonstrated by the absence of a policy statementon sustainability. Although efforts undertaken by individuals withinthe University are important for initiating and sustainingenvironmental initiatives, they cannot replace a commitment from thepresident or chancellor of a university (Smith, 1993).• Lack of funding for environmental technologies and initiatives.Funding is a clear barrier to sustainability efforts, given that morexii
efficient technologies generally have higher up-front costs. Forexample, conservation projects must compete with capital projects (i.e.new buildings, parking lots) for funding and are rarely given priority.However, this report demonstrates that installing such equipment andfunding environmental initiatives can result in drastic savings overtime. The need to fully consider life-cycle costs should thus become acore component of all campus operations.It is our contention that these barriers will continue to hinder sustainability efforts oncampus unless adequately dealt with. Our policy statement provides a building blockfor addressing these issues by establishing sustainability as a priority in all campusoperations. Adopting this policy statement may have repercussions beyond the <strong>UCSB</strong>campus, given that UC Santa Barbara may serve as a model for the entire UC system.In addition, a new UC campus will be completed in 2004 in Merced. This policystatement could have a profound influence on the sustainability of this campus byensuring green building design, an environmentally friendly campus lay out and theinstallation of the most efficient equipment right from the start.The University of California, Santa Barbara is facing a choice that is analogous to thefamous poem by Robert Frost: The Road Not Taken. Two roads do diverge ahead ofus, one path leads to an acknowledgement of our responsibility to both present andfuture generations to take action to protect our natural resources and establish asociety that is truly sustainable. The other is the well-worn path resistant to change,leading to a future of dwindling resources and possible drastic changes to the naturalenvironment. When we “shall be telling this with a sigh, somewhere ages and ageshence” will we be secure in the knowledge that we made the correct choice or will weregret the lost opportunities of the past?xiii
Table of ContentsDedication....................................................................................................................iiiAcknowledgements .....................................................................................................ivExecutive Summary ....................................................................................................viIntroduction...............................................................................................................viComprehensive Environmental Assessment ............................................................. viiPolicy Framework.................................................................................................. viiCampus Assessment Results....................................................................................viiiBuilding Design ...................................................................................................... ixEnergy.................................................................................................................... ixWaste Management................................................................................................. ixTransportation and Air Quality ..................................................................................xWater Management ..................................................................................................xLandscape Management........................................................................................... xiCampus Environmental Report Card........................................................................xiThe Policy Statement................................................................................................xiConclusion............................................................................................................... xii1. Introduction..............................................................................................................11.1. The Concept of Sustainability.......................................................................11.2. Role of Universities in Sustainability...........................................................31.3. Project Overview...........................................................................................31.3.2 Comprehensive Environmental Assessment ...................................................41.3.3 Policy Framework........................................................................................71.4. Importance of Research................................................................................72. Campus Context.......................................................................................................82.1. Location ........................................................................................................82.2. Natural Setting ..............................................................................................82.3. Site History...................................................................................................92.4. The Campus Today.......................................................................................92.5. Planning Goals ..............................................................................................92.6. Development Pressures...............................................................................103. Building Design and Construction.......................................................................113.1. Introduction.................................................................................................113.2. Background .................................................................................................113.2.1 Environmental Impacts............................................................................... 123.2.2 Economics ................................................................................................. 153.2.3 Campus Issues ........................................................................................... 163.3. Results.........................................................................................................163.4. Analysis of Results .....................................................................................193.4.1 Current Progress/Trends ............................................................................. 19xiv
3.4.2 Environmental Impact ................................................................................ 203.4.3 Institutional Framework.............................................................................. 213.4.4 Financial Support ....................................................................................... 213.4.5 Innovativeness ........................................................................................... 223.4.6 Community/Education................................................................................ 233.5. Environmental Report Card ........................................................................243.6. Recommendations:......................................................................................253.6.1 Infrastructure ............................................................................................. 253.6.2 Building Construction................................................................................. 253.6.3 Indoor Air Quality ...................................................................................... 254. Energy Use at <strong>UCSB</strong>..............................................................................................274.1. Introduction.................................................................................................274.2. Background .................................................................................................274.2.2 Environmental Impacts............................................................................... 314.2.3 Economic Issues......................................................................................... 334.2.4 Campus Issues ........................................................................................... 344.3. Results.........................................................................................................344.4. Analysis of Results .....................................................................................404.4.1 Current Progress/Trends ............................................................................. 404.4.2 Environmental Impact ................................................................................ 464.4.3 Institutional Framework.............................................................................. 464.4.4 Financia l Support ....................................................................................... 474.4.5 Innovativeness ........................................................................................... 494.4.6 Community/Education................................................................................ 504.5. Environmental Report Card ........................................................................514.6. Recommendations .......................................................................................524.6.1 Promote Outreach, Education and Innovation ............................................... 524.6.2 Use Energy Efficient Equipment and Alternative Sources of Energy.............. 524.6.3 Continue Energy Retrofits........................................................................... 525. Waste Management ...............................................................................................545.1. Introduction.................................................................................................545.2. Background .................................................................................................545.2.2 Waste Management.................................................................................... 545.2.3 Legislation ................................................................................................. 565.2.4 Environmental Impacts............................................................................... 565.2.5 Economics ................................................................................................. 585.2.6 Campus Issues ........................................................................................... 605.3. Results.........................................................................................................625.3.2 Solid Waste................................................................................................ 625.3.3 Hazardous Waste........................................................................................ 635.3.4 Recycling................................................................................................... 655.3.5 Procurement............................................................................................... 675.4. Analysis of Results .....................................................................................695.4.1 Current Progress / Trends (Solid Waste) ...................................................... 69xv
5.4.2 Environmental Impacts (Solid Waste).......................................................... 715.4.3 Institutional Framework (Solid Waste)......................................................... 725.4.4 Financial Issues (Solid Waste)..................................................................... 735.4.5 Innovativeness (Solid Waste)...................................................................... 745.4.6 Community & Education (Solid Waste)....................................................... 765.4.7 Current Progress / Trends (Hazardous Waste) .............................................. 775.4.8 Environmental Impacts (Hazardous Waste).................................................. 775.4.9 Institutional Framework (Hazardous Waste)................................................. 785.4.10 Financial Issues (Hazardous Waste) ......................................................... 795.4.11 Innovativeness—Microscale Experiments with Hazardous Waste............... 805.4.12 Community & Education (Hazardous Waste)............................................ 805.4.13 Current Progress / Trends (Procurement Practices).................................... 815.4.14 Environmental Impacts (Procurement Practices)........................................ 825.4.15 Institutional Framework (Procurement Practices) ...................................... 825.4.16 Financial Issues (Procurement Practices) .................................................. 835.4.17 Innovativeness (Procurement Practic es).................................................... 855.4.18 Community & Education (Procurement Practices)..................................... 865.5. Environmental Report Card ........................................................................865.5. Recommendations for Improvement...........................................................895.5.1 Solid Waste................................................................................................ 895.5.2 Hazardous Waste........................................................................................ 905.5.3 Recycling Efforts ....................................................................................... 915.5.4 Procurement Practices ................................................................................ 926. Air Quality and Transportation at <strong>UCSB</strong>...........................................................946.1. Introduction.................................................................................................946.2. Background .................................................................................................946.2.1 Environmental Impacts............................................................................... 966.2.2 Economic Impacts...................................................................................... 986.2.3 Campus Issues ......................................................................................... 1006.3. Results.......................................................................................................1006.4. Analysis of Results ...................................................................................1076.4.1 Current Progress and Trends ..................................................................... 1076.4.2 Environmental Impacts............................................................................. 1086.4.3 Institutional Framework............................................................................ 1096.4.4 Financial Issues........................................................................................ 1106.4.5 Innovativeness ......................................................................................... 1116.4.6 Community/Education.............................................................................. 1126.5. Environmental Report Card ......................................................................1126.6. Recommendations .....................................................................................1146.6.1 Transportation .......................................................................................... 1146.6.2 Air Quality............................................................................................... 1157. Water Management .............................................................................................1167.1. Introduction...............................................................................................1167.2. Background ...............................................................................................116xvi
7.2.1 Water ...................................................................................................... 1167.2.2 Environmental Impacts............................................................................. 1207.2.3 Economics ............................................................................................... 1227.2.4 Campus Issues ......................................................................................... 1247.3. Results.......................................................................................................1257.4. Analysis of Results ...................................................................................1307.4.1 Current trends .......................................................................................... 1307.4.2 Environmental Impact .............................................................................. 1317.4.3 Institutional Framework............................................................................ 1327.4.4 Financial Issues........................................................................................ 1337.4.5 Innovation ............................................................................................... 1337.4.6 Community/Education.............................................................................. 1347.5. Environmental Report Card ......................................................................1347.6. Recommendations .....................................................................................1357.6.1 Water Use................................................................................................ 1357.6.2 Water Pollution ........................................................................................ 1358. Landscape Management .....................................................................................1368.1. Introduction...............................................................................................1368.1.2 Background ............................................................................................. 1368.1.3 Environmental Impacts............................................................................. 1378.1.4 Economics ............................................................................................... 1388.1.5 Campus Issues ......................................................................................... 1398.2. Results.......................................................................................................1418.3. Analysis of Results ...................................................................................1438.3.1 Current trends .......................................................................................... 1438.3.2 Environmental Impact .............................................................................. 1448.3.3 Institutional Framework............................................................................ 1458.3.4 Financial Issues........................................................................................ 1478.3.5 Innovation ............................................................................................... 1488.3.6 Community/Education.............................................................................. 1498.4. Environmental Report Card ......................................................................1498.5. Recommendations .....................................................................................1509. Policy Framework................................................................................................1519.1. Empirical & Theoretical Rationale ...........................................................1519.2. <strong>UCSB</strong> Draft Policy ...................................................................................1529.3. Feasibility & Institutional Barriers ...........................................................1559.4. Successful Policy Adoption & Implementation........................................15610. Conclusion..........................................................................................................15810.1 Overall Campus Assessment.....................................................................15810.2 Research in Campus Greening..................................................................15910.3 General Recommendations .......................................................................15910.4 Choosing a Path........................................................................................161xvii
Glossary ....................................................................................................................162Appendix A: Energy Consumption Calculations..................................................164Appendix B: Carbon Dioxide Emission Calculations...........................................166Appendix C: Draft Policy On Sustainability for <strong>UCSB</strong>.......................................167Appendix D: Talloires Declaration: University Presidents for a SustainableFuture........................................................................................................................170Bibliography .............................................................................................................172List of FiguresFigure 1-1. Project framework.......................................................................................5Figure 3-1. Environmental impacts from building materials.......................................13Figure 4-1. Sources of California’s energy supply......................................................28Figure 4-2. Partitioning of campus energy use............................................................37Figure 4-3. Electricity use among the UC campuses...................................................38Figure 4-4. Natural gas consumption among the UC campuses..................................39Figure 4-5. <strong>UCSB</strong> annual electricity consumption. .....................................................43Figure 4-6. <strong>UCSB</strong> electricity consumption per unit area ............................................43Figure 4-7. <strong>UCSB</strong> electricity consumption per capita.................................................43Figure 4-8. <strong>UCSB</strong> natural gas consumption................................................................44Figure 4-9. <strong>UCSB</strong> natural gas consumption per unit area ...........................................44Figure 4-10. <strong>UCSB</strong> natural gas consumption per capita .............................................45Figure 6-1. California Air Resources Board air quality zones ....................................95Figure 7-1. U.S. water use for 1995...........................................................................118Figure 7-2. South Coast water use for 1995 ..............................................................119Figure 7-3. Historical <strong>UCSB</strong> annual water use .........................................................126Figure 7-4. Reclaimed water use as a percent of total use.........................................128Figure 9-1. Balanced view of sustainability..............................................................155xviii
1. INTRODUCTIONThe accelerating forces of over-consumption and waste generation worldwide haveled to looming environmental threats that are unprecedented within the history of thehuman race. In order to limit the damage to Earth’s ecosystems, we will have toidentify and move towards ways of living that are in balance with the Earth’s abilityto provide resources and absorb waste. Universities can play an integral role inhelping to achieve this balance. On the one hand, universities are microcosms ofsociety, in that they are not only places where people learn, but also where they work,live and play. On the other hand, universities play a special role in addressing theissue of sustainability given their focus on education, both inside and outside theclassroom. By acknowledging the limits of our planet and addressing head-on theenvironmental challenges that the world currently faces, universities can becomeliving laboratories leading the way toward environmental sustainability.1.1. The Concept of SustainabilityThe concept of sustainability has gained attention in recent years on many college anduniversity campuses, complemented by a growing body of literature addressing thisissue. However, sustainability itself is still somewhat of a difficult concept to fullydefine. There are various definitions of sustainability in the literature ranging fromthe purely technical to the purely philosophical, and focusing on environmental,economic and social factors (Goodland and Daly, 1996). The most often citeddefinition, developed by the Brundtland Commission in 1987, describes sustainabilityas “development that meets the needs of the present without compromising the abilityof future generations to meet their own needs” (WCED, 1987). Although this is agenerally accepted definition of sustainability, there is no clear consensus as to whatit may mean in practical terms. There are no clearly defined numbers or goals to beachieved, nor is there a clear-cut end goal for what constitutes “sustainability.” Inaddition, the definition changes as a function of place, time and setting. Thus,sustainability is most useful when thought of not as an end goal, but as a mindset, away of thinking holistically and responsibly when we approach new projects orissues. We can identify ways to improve sustainability, even without a goal that tellsus when we can stop. Given this approach, we determined the most importantprinciples to be:• Enhanced environmental performance: This involves minimizingthe major sources of anthropogenic impact on the environment.Mitigation of these impacts underlies the framework for moreexpansive definitions of sustainability.1
• Emphasis on Environmental Education: Educational experiencesthat foster an understanding and appreciation of the natural world canserve to emphasize the power of a focused, collective effort. Thus,schools, literature and awareness groups will all play important rolesin pursuing sustainability. However, the types of problems that wecurrently face cannot be solved by traditional, single-disciplinaryeducation. Education that crosses departmental boundaries is needed tofoster increased environmental education. Ecological literacy involvessystems thinking, being able to see a range of problems and solutions,and should be stressed as a clear goal in all educational institutions.• Thinking in terms of generations: The word sustainability impliesthat we sustain something over time. The way that we define the timecomponent affects the types of decisions that we make. Thinking interms of generations rather than years reminds us that the people whohave to deal with the consequences of our actions are our owndescendants, and therefore an extension of ourselves. This helps uspersonalize our considerations and encourages us to act responsibly,providing motivation beyond short-term financial gain.• An expanded sense of community: Not only should we consider theimpacts of a project on our own community, we should also be awareof the impacts it has around the world. Looking through the lens ofsustainability, we see our connections not just to people around us orto future generations, but also to people and places far away. Asustainable project should not benefit one community at the cost ofanother. One key element of achieving this expanded sense ofcommunity lies in education.The determination of what constitutes a “sustainable” campus is still not astraightforward task. We considered each principle of sustainability in the evaluationof campus environmental performance. In particular, we focused on the three mostmeasurable aspects of campus sustainability: minimization of resource consumption,minimization of waste and pollution, and conservation of the natural environment.Therefore, our assessment focuses on analyzing campus infrastructure and operationsand the institutional and financial provision for those operations, rather than on issuessuch as educational curriculum. The consideration of an expanded sense ofcommunity, environmental education and thinking in terms of generations all dictatehow well each of the three core components of sustainability can be realized in ourassessment. We defined a sustainable campus as one that incorporates sustainabilityinto all of its practices and policies, and by doing so cultivates a faculty and studentbody that is mindful of how these principles can be translated into everyday actionsand attitudes.2
1.2. Role of Universities in SustainabilitySustainability is an important issue for universities to tackle for a number of reasons.University and college campuses consume large amounts of natural resources, whilealso creating significant quantities of waste and pollution. The diverse range ofactivities carried out on university campuses result in the consumption and disposal ofa wide variety of resources, with significant environmental impacts. This is anespecially worrisome factor for a campus such as the University of California, SantaBarbara (<strong>UCSB</strong>), which is adjacent to diverse and rich marine, aquatic and terrestrialecosystems. These factors make the campus ideal for the study of sustainability, whilealso presenting some of the greatest challenges.Universities influence a wide variety of surrounding entities including: thesurrounding community, local businesses, government organizations, industry,environmental professions, contractors and consultants, other universities, employers,large organizations and the international community (Sharp, 1998). Therefore, a clearcommitment to sustainability at the university level will influence sectors far beyondthe boundaries of a single university. Universities can extend this web of influencevia education, research and development partnerships, the development anddistribution of case studies, publications and presentations, conferences and seminars,consulting partnerships, training programs, and economic drivers.1.3. Project OverviewThe design and construction of Bren Hall, to house the Donald Bren School ofEnvironmental Science and Management, heralds a new era of sustainability for theUniversity of California, Santa Barbara and the UC system. This “green” buildingincorporates fundamental principles of sustainability: waste minimization,conservation of the natural environment and minimization of resource consumption.However, the Bren building represents only one building on a campus with manybuildings in a system of nine campuses. Thus, the greening of Bren Hall is importantand useful only if the lessons learned apply to the <strong>UCSB</strong> campus and the UC systemin general. Two important questions arise: (1) What is the overall environmentalperformance of the campus? (2) How do we adhere to principles of sustainabilitywhose definitions and metrics change over time?Our report, Greening <strong>UCSB</strong>, evaluates these questions in order to prompt institutionalchange that empowers graduates with the values, knowledge, and skills to realize theprinciples and practices of environmental sustainability in their professional and civiclives. This project targets sustainability on both a campus and system wide level. Wehope to ignite this process by first, clearly portraying University policies andpractices as they impact the environment and relate to the principles of sustainability3
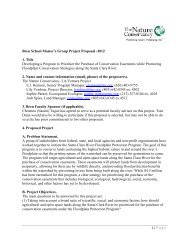
and second, by proposing a policy statement on sustainability to be adopted by theUniversity.There are a growing number of resources available for college and universitycampuses tackling the issue of sustainability. One such resource is the CampusEcology program, established in 1989 by The National Wildlife Federation (NWF).Campus Ecology provides outreach to campuses via publications and conferencesaddressing environmental issues and practices that are specific to universities andcolleges. One important component of this program is the environmental audit, whichprovides information for assessing, recommending and implementing sustainablepractices (Smith, 1993). <strong>UCSB</strong> participated in a general environmental auditadministered by the NWF Campus Ecology program in 1989. However, theinformation obtained was scant at best and provides a limited view of thesustainability of campus operations. No comprehensive assessment of campusoperations, infrastructure or areas for improvement was obtained. Given this lack of adetailed assessment of campus operations and infrastructure, we hope our research,methodology and conclusions will contribute to the growing body of availableresources for universities wishing to undergo a similar process.By developing a series of directed questions in six topic areas of campusinfrastructure and operation—Building Design, Energy Use, Waste Management, AirQuality and Transportation, Water Management and Landscape Management—weattempted to identify areas where and to what extent the principles of sustainabilityare being incorporated into campus operations, and areas where significant change isdesirable. Some of these questions focused on obtaining straightforward informationsuch as the amount of solid waste generated and carbon dioxide emitted on campus,while other questions attempted to get at the more fundamental issues of institutionaland financial support of sustainable practices. Figure 1-1 depicts the conceptualframework for our project, including the principles of sustainability as we defined it,the topic areas of our environmental assessment and how those relate to the formationof the policy statement.We structured this report to highlight the environmental and economic impactsassociated with campus operations, identify means for improvement and developindicators of campus sustainability. It consists of two core components: acomprehensive environmental assessment and a policy framework.1.3.2 Comprehensive Environmental AssessmentThe information obtained from the assessment provides baseline data that can be usedfor future comparisons with other universities and serves as the justification forpotential changes in policy and operations. The assessment is organized as follows:4
Principles of SustainabilityMinimizePollutionMinimizeResourceConsumptionConserve theNaturalEnvironmentBuildingDesignEnergy UseWasteManagementCampusEnvironmentalAssessmentInstitutionalObjectivesAir Quality &TransportationWaterManagementLandscapeManagementRecommendations and Policy StatementFigure 1-1. Project framework• A survey of campus environmental performance: A series ofquestions and answers centered on the three principles of sustainabilityto characterize campus operations in six key areas: Building Design,Energy Use, Waste Management, Air Quality and Transportation,Water Management and Landscape Management.• An analysis of the subsequent findings: A qualitative evaluation ofthe environmental performance of <strong>UCSB</strong> in terms of trends,environmental impacts, financial and institutional issues,innovativeness and community outreach in each key area. Eachevaluation is followed by a list of recommendations for improvement.• A grading scheme for campus performance: A grading scheme tomeasure campus sustainability. These indicators surfaced from our5
environmental assessment and were put into a “test” format. This“test” used a binary grading scheme (yes or no), so that if the indicatorwas present on campus, it received a point, and if it was not present itdid not receive a point. The percentage of indicators present oncampus correlated to a certain grade, which was then assigned to eachkey area of campus operations.Table 1-1. Grading schemePercentageGrade100-94 A93-90 A-89-83 B+82-75 B76-70 B-69-63 C+62-57 C56-50 C-49-43 D+42-37 D36-30 D-29-0 FAny indicator framework for determining the level of sustainability on a collegecampus should be flexible and adjustable for changing priorities in evaluatingenvironmental responsibility. In addition, this framework was designed to betransferable to other institutions. It is important to recognize that our evaluativeindicators used in this report are oriented towards determining the measure ofproactive efforts to embrace sustainability that are currently underway on campus.The absence of these efforts does not reflect poor performance by individuals oncampus; rather, it suggests that the campus is not especially progressive inincorporating the principles of sustainability into operations.6
1.3.3 Policy FrameworkThe policy framework developed in this report is transferable to other universities asa model for hands-on application of sustainability principles. The framework isorganized as follows:• A draft policy statement on sustainability: This statement identifiesoverarching goals of campus sustainability, identifies correctiveactions the University could undertake to improve the “trouble areas”identified by the environmental assessment and justifies prioritizingsustainability principles at the university level.• A discussion of the feasibility of policy adoption: A brief analysis ofinstitutional and external barriers to campus sustainability is providedalong with a discussion of the conditions conducive to the adoption ofsuch a policy at <strong>UCSB</strong>. The feasibility study also provides potentialstrategies for overcoming these barriers.1.4. Importance of ResearchGreening efforts on the <strong>UCSB</strong> campus are important for a many reasons. First, thenumber of people and the range of activities carried out on university campuses resultin a significant amount of environmental stress. <strong>UCSB</strong> is located in the center of adiverse and sensitive ecological area that is surrounded by wetlands and coastalbluffs. Therefore, actions taken by the campus can have important implications forthe surrounding habitat. In addition to environmental benefits, campus greeningefforts can result in substantial cost savings. However, innovative technologies orpractices often require an initial capital investment before savings can be realized.Increased use of public funds for green technology and practices must be justified inorder to reach environmental goals in a cost-effective manner. Thoroughdocumentation of cost savings and environmental protection will help set a precedentfor future greening efforts in public institutions.A policy that promotes environmental protection can have substantial environmentalbenefits, while also setting a positive example for student, staff and faculty. As apublic university, <strong>UCSB</strong> can help set a new standard for making environmentalconcerns a core priority of all campus operations, while stimulating the market forgreen technologies. The methodology that we have developed is transferable to otheruniversities and institutions, enabling greening practices to become more easilyimplemented in other places. An early commitment to sustainability can put <strong>UCSB</strong> atthe forefront of the greening movement, while also aiding in the development of amore sustainable campus.7
2. CAMPUS CONTEXTIn order to understand the details of an environmental assessment of <strong>UCSB</strong>, it isimportant to recognize the role of the physical setting, site history, currentinfrastructure, and population and development pressures. These characteristics formthe foundation of Campus activity, and provide both opportunities and constraints forachieving sustainability. This chapter provides basic background information on the<strong>UCSB</strong> campus in order to provide a context for our assessment and to allow forcomparisons with other institutions. The majority of information for this section wasobtained from the 1990 Campus Long Range Development Plan * , which was createdby the Campus Planning Committee to guide future campus development through2005/6.2.1. LocationThe <strong>UCSB</strong> campus is located along the Pacific Ocean, 10 miles west of the city ofSanta Barbara and less than 1 mile south of the community of Goleta, in anunincorporated area of Santa Barbara County. Three sections of the campus (MainCampus, Storke Campus, and West Campus) border Isla Vista, where most of thestudents live. The area surrounding the Campus contains a mixture of suburbanresidential, agricultural and commercial areas, with the Santa Barbara MunicipalAirport directly to the north.2.2. Natural SettingThe natural setting of coastal bluffs, lagoons, marshes and wetlands, comprises thecampus’s most striking feature. Wetland and coastal backwater areas, includingGoleta Slough to the north and Devereux Slough on West Campus, provide habitatfor a wide range of native plants and animals, and a high diversity of migratory andcoastal bird species. In fact, the area has the highest richness of bird species of anyarea in California of similar size (Ferren and Thomas, 1995). Coal Oil Point Reserveon West Campus is home to many indigenous populations, including federally listedthreatened and endangered species. Due to the campus’ coastal location and thenumber of sensitive ecosystems, development on campus is subject to review by theCalifornia Coastal Commission.* For more information, please see the Campus Planning, 2000b. <strong>UCSB</strong> Long Range DevelopmentPlan at http://bap.ucsb.edu/planning/3.planning.stuff/lrdp/01.Preface&Intro.pdf.8
2.3. Site HistoryBefore World War II, the site that now houses <strong>UCSB</strong> was used primarily foragriculture, with some asphalt mining occurring near the lagoon (Campus Planning,2000a). At that time, rows of Eucalyptus trees were planted as wind breaks. Thesetrees form a major feature on campus today, and play an important role in orientingthe physical design and development of the campus. During World War II, the sitefunctioned as a marine air base on Goleta Point. The Campus was designated as a“general campus” of the University of California in 1958. At that point, it contained75 mostly wood frame structures, many of which are still part of the campus today(Campus Planning, 2000b).2.4. The Campus Today<strong>UCSB</strong> is a California public university and is part of the larger UC System. Thecampus is divided into three main sections. Main Campus occupies 405 acres andcontains the majority of campus development. Storke and West Campuses togethercomprise another 410 acres, which includes playfields and open spaces, as well as165 acres of sloughs, wetlands and wooded slopes (Campus Planning, 2000b).The campus contained close to 360 buildings and nearly 5 million total square feet ofbuilding space in 1999 * , with additional buildings being added every year. Campusbuildings serve a broad range of functions including academic instruction, scientificresearch, office space, computer facilities, library space, food service, residences,parking structures, and sports and recreation facilities. Seventy-five percent of theexisting instructional buildings are 25 years or older and 25 percent are more than 40years old (Campus Planning, 2000b). The deferred maintenance backlog of thecampus now totals more than $149 million in estimated costs, and includes projectsranging from energy retrofits, building repairs, seismic retrofits and a replacement ofthe entire campus sewer system, according to Physical Facilities Director DavidGonzales.2.5. Planning GoalsThe mandate of the University is to provide excellence in academic instruction andresearch. Academic planning goals include “improving instructional resources,development of undergraduate and graduate programs, and expanding and improvingthe quality of research” according the Campus Planning and Physical DevelopmentGuidelines. Physical planning goals include upgrading aged facilities and “preserving* Estimate includes Managed Gross Square Footage plus all on-campus dormitories, the MarineResearch Laboratory and ITP.9
and enhancing [the campus’s] unique environment, architecture and open space,”(Campus Planning, 2000c).2.6. Development PressuresSince opening its doors in 1956, enrollment at <strong>UCSB</strong> has increased from 2,500 tomore than 20,000 students. While the number of students has remained relativelyconstant for the past several years, increasing population in California is expected toput severe pressures on the entire UC system. Campus growth has been capped at thecurrent level due to the sensitivity of the campus site. In order for <strong>UCSB</strong> to meet theneeds of both undergraduate and graduate students and to achieve its academic goals,the number of faculty and staff will also have to increase. Thus, additional buildingspace is needed for housing, offices and research facilities.In addition to the demands for more space, the University also faces demands forhigher quality facilities. Advances in technologies and expansion in researchactivities necessitate the development of laboratories that are more sophisticatedalong with other resources. In addition, many of the existing facilities are in need ofupgrades and repairs.Some of the departments that are growing most quickly are also the departments thatput the most strain on the environment. In particular, the engineering department is inthe process of planning two new buildings, an Engineering Sciences building and aNano-Sciences building. The new Engineering II building, which was completed in1996, currently accounts for almost 12% of total campus energy use. The addition ofthese two new buildings, along with several other buildings that are currently beingplanned, will dramatically increase the environmental impact of the campus in allcategories.10
3. BUILDING DESIGN <strong>AN</strong>D CONSTRUCTION3.1. IntroductionMost buildings are made to last—to withstand earthquakes, resist fires and maintainstructural integrity. However, most buildings do not meet the sustainability goals thatwe have outlined in this report. Buildings require huge amounts of materials, causeecological damage, and require inputs of resources over time. In this section, weexamine current building design, construction, use, operation and upgradingpractices, and then make recommendations to make campus buildings better for theenvironment, as well as for the people who live and work in them.3.2. BackgroundEnvironmental impacts can be traced to all phases of building construction, as well asto building use, operation and maintenance. Buildings require enormous inputs ofresources. Each year, building construction requires the use of 25% of the globalwood harvest and 40% of all the materials entering the global economy (Sharp,1998). Approximately 136 million tons of building material becomes waste fromconstruction, renovation and demolition projects (U.S. EPA, 1998). In addition,building operations account for 35% of total energy consumption (Sharp, 1998).Virtually all buildings, new and old, commercial and domestic, put some strain on theenvironment. There are major impacts associated with a building’s footprint, directecological disruption from construction and use, energy demand, materialsconsumption and indoor air quality. While there is no way to construct a building thathas no impact, the techniques of “green building” can be used to decrease theirseverity.Green Building: the use of efficient designs and technologies todecrease the total environmental impacts of construction, operationand maintenance of a building.Green building techniques can be used on both new and existing buildings. If a newbuilding can be designed and constructed as a green building, a great deal can be doneto limit its environmental impact by orienting the building in ways that utilize theheating, cooling and ventilation properties of the natural setting, and by choosingmaterials that are the least demanding of natural resources (e.g. recycled and nontoxicmaterials, sustainably grown wood, alternative energy systems, etc.). However,a great deal can also be done in existing buildings, particularly through energyretrofits, which can reduce the energy demand of a building dramatically.11
Due to the economic and environmental benefits associated with green building,many cities have mandated green building practices for all government buildings.While no such mandate currently exists in Santa Barbara, California Governor GrayDavis issued Executive Order D-16-00 last summer to establish a “state sustainablebuilding goal.” This order states that it is the goal of the administration to “site,design, deconstruct, construct, renovate, operate, and maintain state buildings that aremodels of energy, water, and materials efficiency; while providing healthy,productive and comfortable indoor environments and long-term benefits toCalifornians.” Buildings in the UC system are primarily state funded and thereforeare encouraged to incorporate such green building practices.In order to verify that buildings do in fact meet greening goals, the United StatesGreen Building Council has developed the Leadership in Energy and EnvironmentalDesign (LEED) rating system. The LEED system is a “voluntary, consensus-based,market-driven building rating system based on existing proven technology (U.S.Green Building Council, 2001).” It is designed to evaluate projects from a “wholebuilding perspective” and to reward institutions that invest in green building features.Buildings earn points for each feature that they incorporate, and receive medalscorresponding to different point levels. Bren Hall will be the first building in the UCsystem to receive LEED certification and on completion will receive a minimum of agold medal.In addition to certification through the LEED system, greening goals can be assuredby the use of third party building commissioning. Building commissioners arecontracted to inspect building projects periodically and to verify that greening andefficiency features are being installed properly. The combination of third partycertification (such as through the LEED system) and building commissioning canensure that the resulting building will achieve the greening objectives of resourceconservation, energy efficiency and indoor air quality.3.2.1 Environmental ImpactsAll phases of a building’s life—including construction, use, operation andmanagement—can cause some environmental impacts. Buildings consume space,materials and energy over time.Building FootprintThe construction of any building on previously undeveloped land will have anecological impact. The physical footprint of a building (the number of square feet ofground that the building covers) not only destroys any habitat that once occupied thearea, but also permanently creates a surface that is impermeable to water. Becauserainwater can no longer percolate into the ground, groundwater recharge can be12
educed, and flooding and water pollution can potentially increase. These effects areexacerbated by walkways, roads and parking lots associated with new buildings.Building MaterialsBuildings use large quantities of resources such as metals, wood, concrete, drywalland finishing materials. Each year, buildings consume 3 billion tons of raw materials(Sharp, 1998). The extraction, processing, manufacturing, transportation, and disposalof these materials can put a significant strain on the environmental (see Figure 3-1).The components of building materials are derived from natural (often non-renewable)resources, which must be mined or logged and then shipped to manufacturing orprocessing plants. Manufacturing generally requires large energy and resource inputsand often produces large quantities of waste. In addition, some building materials,including concrete and finishing materials, contain components that are toxic orotherwise environmentally destructive. After the manufacturing process is complete,materials must be transported to the building site, which requires the use of fossilfuels. During building construction, excess materials must be transported to landfills,Extraction of raw materialsProcessing, manufacturing andpackaging of materialsMaterialsandEnergyTransportation and distribution ofbuilding materialsConstruction, renovation, operation andmaintenance of finished buildingsPollutionandWasteDisposal, recycling or reuse of wasteEnvironmental ImpactsFigure 3-1. Environmental impacts from building materials13
where they make up 25% of total solid waste. Once a building is completed, many ofthe toxins contained within building materials continue to off-gas, causing indoor airpollution.The analysis of the total environmental impact of a material or product over its entirelifetime (as described above) is known as “cradle to grave” analysis. This techniquecan be used to sum all of the sources of environmental harm from the time thematerial is extracted to the time it is finally disposed of. Cradle to grave analysis canalso be used to determine the amounts of “embodied energy” of different materials—that is, the total amount of energy the material requires over its lifetime for extraction,manufacturing, transportation, installation, use, etc. Comparison between materials isoften difficult due to the variety and complexity of processes involved. Third partycertification provides an important way to identify materials that are the leastdamaging. Other factors to consider in evaluating materials include the distance theproduct had to travel to reach the building site, how long the material will last beforeit needs to be replaced, and whether the material is actually necessary in the firstplace.EnergyBuildings require large energy inputs in order to maintain comfortable indoorconditions. The largest energy consuming building component is the HVAC (heating,ventilation and air conditioning) system. Most large buildings draw in outside air,which is then heated, cooled, humidified or dehumidified depending on conditions,and then transported throughout the building. The biggest determinant of HVACrequirements is the type of building. Commercial buildings, which include offices,classrooms and laboratories, are generally occupied during the day and can contain arange of lighting and electrical demands. Therefore, these buildings generate a largeamount of heat, which must be dealt with through operation of the HVAC systemcombined with any natural ventilation. Residential buildings such as houses anddormitories, on the other hand, are generally occupied from evenings to mornings,and tend to have less lighting and electrical equipment as well as lower densities ofoccupants (number of people per square foot of building space). Thus, residentialbuildings have higher heating requirements than commercial buildings. (See Chapter4 for more information).Indoor Air QualityIndoor air pollution can result from the off-gassing of building materials, from moldor dust accumulation, combined with a lack of proper ventilation. Impaired indoor airquality may cause a range of human illnesses, decrease worker productivity, and leakpollutants into the outdoor environment. Indoor air pollutants include volatile organiccompounds (VOCs), formaldehyde, lead, asbestos, combustion products, radon, moldand dust. Pollution levels can reach up to 100 times higher indoors than out, posing a14
particularly high health risk, since most people spend up to 90% of their time indoors(U.S. EPA, 2001a). According to Occupational Health and Safety Organization, morethan 20 million office workers in the U.S. are exposed to unhealthy levels of indoorair pollution (OSHA, 2000.)3.2.2 EconomicsAs with most environmental issues, the ecological costs of buildings are largelyexternalized—that is, they are not born by the suppliers of building components, themakers of the building, or the building occupants. For this reason, environmentallyresponsible building alternatives that require additional expense have often beenviewed as luxuries that yield little return on investment. However, when the costsover the full life of the building are considered, economic and environmental goalsbecome highly compatible. The key to meeting both sets of goals in buildings is todecrease consumption of natural resources throughout the life of the building.Life-Cycle Cost AnalysisBuilding costs can be divided into two main categories—initial and long-term costs.Initial costs are the one-time expenditures on design, construction and materials.Long-term costs include money spent on building operation and maintenance over thelifetime of the building. When initial costs are the primary consideration, inefficientdesign, materials or equipment may be chosen to ensure that a project remains withinits allotted budget. However, when the full cost of the building over time isconsidered, investment in more efficient options can be rationalized. This type ofaccounting is called life-cycle cost analysis or life-cycle costing.Life-cycle costing—an analysis of the full cost of a product, includingthe initial purchase price and the costs of usage over time.Life-cycle costing for buildings can ensure that economic and environmental goalsare met in three main ways—by reducing energy consumption, by reducing materialrequirements, and by increasing worker productivity. In many cases, these threebenefits can be achieved simultaneously. For example, passive solar design reducesnot only energy consumption, but also reduces the need for extensive HVAC(heating, ventilation and air conditioning) systems and ducting, which reduces bothinitial and long term costs. In addition, proper ventilation, lighting and reducedmechanical equipment can improve indoor air quality, which has been shown toincrease worker productivity (Romm and Browning, 1994). Employees who work inenvironments with optimal air quality and lighting have been shown to have a fasterproductivity rate, higher quality of production, and fewer sick days. All of theseeconomic benefits can be gained most effectively when life cycle costing isincorporated into the early design stages, before the building has been constructed.15
However, life cycle costing can also be used to maximize returns on investments inbuilding renovation and retrofit projects.Value EngineeringBecause each building project generally has a fixed budget, decisions must be madeto avoid the over-allocation of funds. In order to do this, representatives of buildingprojects will meet and find ways to cut costs. These meetings are known as valueengineering sessions, and they are an important part of project planning and design.Unfortunately, the result of these sessions is often the elimination of greening orefficiency elements of the building. Green building elements may require initialinvestments that cannot be covered by the project budget. Therefore, even if greeningfeatures are cost-effective in the long run, typical value engineering sessions do nottake into account life cycle costs, since they are concerned primarily with the bottomline. Greening and efficiency attributes can only be protected in value engineeringsessions if they are established as priorities from the inception of the project. Onlywhen value-engineering sessions incorporate life cycle costing into the decisionmaking process can economic and environmental goals be met over the long run.3.2.3 Campus IssuesWith population growth and advances in technology, university campuses across thecountry face strong development pressures. Increases in student and faculty numbersnecessitate expanded classroom, research, office and housing facilities. Thus, theneed for new buildings, with their associated space, material and electrical demands,will create additional environmental impacts and higher utility bills. Green buildingpractices offer campuses methods for limiting both impacts and costs.Several campuses have made early commitments to green building and designpractices, and are already reaping the benefits. For example, Oberlin College in Ohiohas established green building criteria for all campus projects, and has completedconstruction on an emission-free environmental studies center (NWF, 1998). Energyretrofits at SUNY Buffalo cut costs by $3 million per year, or 15% of the totalelectricity bill. Payback on initial investments was only 3.76 years (Keniry andEagan, 1998). <strong>UCSB</strong> is joining in this movement toward efficient buildings with theconstruction of Bren Hall and other green projects planned on campus.3.3. ResultsA series of questions were taken and adapted from the campus environmental auditformat in April Smith’s book, “Campus Ecology.” Interviews were held with EnergyProgram Manager Jim Dewey, Director of Facilities Management David Gonzalezand Zone Leader Paul Gritt, Assistant Dean of Planning & Administration MoLovegreen, Professor and former Bren School Dean Jeff Dozier, Industrial Hygienist16
Kevin Kaboli and others. All data included were derived from these sources, althoughadditional library and Internet research was also performed regarding specific issues.The following questions were asked to gauge <strong>UCSB</strong>’s status with respect to buildingdesign and construction efforts.1. Is the University subject to local governmental building codes?<strong>UCSB</strong> is subject to state and federal regulations, but is not subject to city or countycodes and regulations. <strong>UCSB</strong> is responsible for writing its own codes.2. Are there any campus-wide policies that encourage environmentally soundbuilding? Are there any such policies at the University of California level?Currently there are no such regulations on the campus or government levels.However, this year California Governor Gray Davis issued an Executive order callingfor all state buildings to be designed according to “a sustainable building goal”(Executive Order D-16-00). The University of California is currently consideringsimilar initiatives.3. Are there any “green” buildings on campus?The Bren Building will be the first green building on campus and the greenestbuilding in the UC system when it is completed.4. What are the current procedures used to select architects and contractors?Are environmental issues considered during the selection process?When architects are required for campus projects, the campus advertises a Requestfor Qualifications and interested architects respond by submitting proposals. TheDesign Review Committee (DRC) then puts these proposals through a rigorousevaluation process. The DRC makes it’s final decision based on “Responsiveness ofpresentation to campus and project; experience of candidates who will be responsiblefor project; and appropriateness of design professional team for campus and project“(Executive Architect Selection Process, January 1993).In the past year, a clause has been added to all Requests for Qualifications stating thatsustainability is a priority on campus and will be considered in the selection process.Architects must respond to this statement in their proposals, indicating the experiencethey have had with green building and demonstrating how they will incorporatesustainability into their project proposal. By law, the campus is required to selectcontractors that have the lowest bid. Therefore, firms that use environmentallyresponsible construction practices cannot be given priority on these criteria.5. How are building materials, finishing materials and mechanical systemsselected?17
Building materials, finishing materials and mechanical systems are selected bycontractors in accordance with specifications outlined in project proposals. Becausethe law requires the campus to select contractors with the lowest bid, it is difficult toensure that the most efficient/environmentally sound/sustainable products are chosen.Contractors have an incentive to choose materials with the lowest initial cost, ratherthan those with the lowest life-cycle costs, unless required by project specifications.Indoor Air Pollution6. What indoor air pollutants have been identified on campus?Indoor air pollutants have occasionally caused problems in some campus buildings.The Office of Environmental Health and Safety has been working with PhysicalFacilities to respond to occupant complaints and remove pollution sources.Mold—There was a major problem with mold in the HVAC system of the libraryin 1993, which resulted in several workers compensation claims. A few otherbuildings have also had mold problems in the last several years.Radon—The Environmental Health and Safety Radiation Safety Office begantesting for radon in 1997. So far no building has been found to have radon levelsin excess of EPA standards.Asbestos and Lead—Both asbestos and lead exist in many of the older buildingson campus. Inspections are conducted regularly and required precautions aretaken to avoid air quality problems.VOCs—There have been complaints about VOCs and other toxic fumes fromcarpet and finishing materials in several buildings. In one case, recently installedcarpeting had to be removed and replaced due to fumes from the adhesives thatwere used.Dust—Dust has occasionally been a problem in buildings undergoingrenovations.7. What are the policies or guidelines regulating the use of indoor air pollutants?The Campus Integrated Pest Management Policy was signed by the Vice Chancellorof Administrative Services in 2000. This policy prohibits the use of toxic pesticidesindoors, limits the amounts of pesticides used outside, and calls for least toxicmethods of pest control on campus.In addition, the EPA has specific guidelines for the handling and removal of asbestosand lead, and for testing and handling radon contamination that the University must18
comply with. The Office of Environmental Health and Safety (EH&S) oversees suchprocedures to ensure that EPA guidelines are followed and indoor air pollution isminimized. Although no formal campus-wide policies exist for other indoorpollutants, EH&S does have guidelines for handling most indoor air pollutants, andrequires that their office be notified when polluting material is used. There are noofficial guidelines or procedures for limiting the amount of indoor air pollutionsources from building and finishing materials or furniture.3.4. Analysis of ResultsBren Hall3.4.1 Current Progress/TrendsWith the completion of plans for a green building to house the Bren School ofEnvironmental Science and Management, <strong>UCSB</strong> ushered in what could be a new erain environmentally responsible building development. The greening of Bren Halloccurred due to demand from the campus community, which called attention to theirony of an Environmental Sciences and Management building that was not itselfenvironmentally sound. The administration responded to this demand by establishingsustainability goals as a top priority for the project, and revamping the initial designsdespite the added expense of change orders. This change was an important pioneeringstep in the right direction.Student Affairs and Administrative Services BuildingThe Student Affairs and Administrative Services Building (SAASB) was completedin 1996 and has had problems since then. Instead of utilizing the natural features ofthe site for heating, cooling and ventilation, the building is pressurized and relies onmechanical systems for these functions. In addition, in order to accommodate certaindesign features, the architect sacrificed sufficient space for the HVAC system. Thus,the existing mechanical systems require enormous amounts of energy to run and arestill not sufficient to meet the air requirements of the building. This has resulted indecreased occupant comfort and $500,000 in maintenance costs. The UC Regents arecurrently suing the architect for damages.The SAASB stands in stark contrast to the future Bren Hall, and underscores the needfor an institution-wide commitment to sustainability. The problems associated withSAASB could have been avoided if sustainable building practices, particularly the useof passive solar design, had been utilized. Unfortunately, once a building isconstructed it cannot easily be remade. SAASB will continue to consume largeamounts of energy and will to require excessive maintenance for years to come.19
Future ProjectsFortunately, other building projects that are currently in the planning phases seem tobe following in the footsteps of Bren Hall. Two new building projects, EngineeringScience and Life Sciences, are incorporating green elements into their design. This isparticularly significant given that engineering and life sciences are the two mostenergy consumptive departments on campus. It is important to note that the additionof these new buildings will increase the overall energy demand of the campussignificantly. However, green building features can limit this increase dramatically.Other changes on campus also indicate that <strong>UCSB</strong> is on the right track. Retrofits andupgrades of older buildings to increase energy efficiency are well underway, and callsfor proposals (“Requests for Qualifications”) from architects now contain a clausestating that sustainability is a priority on campus. 1 However, because there is noofficial commitment to green building, uncertainty remains as to the future of greenbuilding on campus. There is a growing consensus that green building practices andretrofits make sense for environmental as well as economic reasons. However,without high-level support, the possibility remains that other buildings could facesimilar problems to SAASB, and that Bren Hall could become merely ademonstration building, rather than the beginning of a broader campus-widemovement.3.4.2 Environmental ImpactCampus development is slow, and the introduction of greening principles to <strong>UCSB</strong> isrelatively recent. Therefore, it is too soon to determine to what degree these effortshave affected the environmental impact of the campus. The construction of any newbuilding, no matter how green, involves at least some environmental impact throughthe building footprint and the resources consumed in construction. Greening effortsfor new buildings therefore serve primarily to limit environmental degradation asmuch as possible compared to conventional buildings. Plans for development incurrently undeveloped areas around the campus periphery have the greatest potentialto increase environmental degradation, particularly on a local level, while retrofits ofinefficient equipment in older buildings have the greatest potential for reducingenvironmental degradation, both locally and globally.1 This clause is clearly a step in the right direction. However, because this inclusion is so new,its impact on the selection of architects or on the development of projects remains unclear.No new architects have been selected since the clause was added.20
3.4.3 Institutional FrameworkGreen BuildingAlthough green building practices have gained in popularity in recent years, there iscurrently no campus-wide policy supporting these efforts. Thus, the overall campuscommitment to environmentally sound design and construction could become apassing fad. According to both the Director of Facilities Management, DavidGonzales, and Campus Architect, Jack Wolever, the future of green buildings restswith the end users. Only if future building occupants continue to express interest in—and pursue funding for—green buildings will the current trend toward sustainabilitycontinue. Without user demand or a campus wide mandate, support for greeningefforts will likely fall by the wayside, leaving the Bren Building as a soledemonstration building.Campus Zone SystemIn 1998, Physical Facilities divided the campus into four zones in order to better meetthe needs of building occupants. Zones are divided geographically, and each has itsown maintenance team, which sets priorities based on requests from users. Thiscustomer service approach ensures that complaints and concerns are responded toefficiently, and allows individual staff members to become intimately familiar withparticular buildings. This structure may also allow for better identification ofimprovements that would increase individual buildings’ environmental performance.Because users set priorities, building occupants could be a driving force inenvironmental retrofits. In addition to the campus zoning structure, Physical Facilitiesalso has an energy team, which is responsible for identifying and implementingimprovements to energy systems (See Chapter 4). It appears that the currentinstitutional framework is well suited to meeting sustainability goals, provided thatthese goals become institution-wide priorities and that sufficient funding is securedfor improvements and investment in environmentally sound/energy efficientmaterials, equipment and design.3.4.4 Financial SupportLessons from the Bren BuildingThe Bren building illustrates two main financial issues involved with greening efforts.The first is that green building can be accomplished economically, and can produceconsiderable savings over the life of the building. Many of the efficiency features ofthe building could be achieved at little or no additional cost, and the investment inenergy saving equipment will save the campus thousands of dollars each year onutility bills. The second lesson is that for green building to be accomplished in the21
most cost-effective manner, greening must be established as a priority from the initialdesign stages. Because architects were hired and plans were established before thedecision to green the building, all improvements had to be made through changeorders. Change order costs for Bren Hall totaled over $686,000, a cost that could havebeen avoided if green features had been incorporated into initial specifications. Ingeneral, green building affects the cost of building projects in the following ways:• If goals and priorities are made explicit from the inception of theproject, green design should not result in any additional cost.• The cost of construction and materials cost could increase, due to thedemand for higher quality and efficiency, and to the fact that manygreen materials are still considered specialty items and are thereforemore expensive at this point.• Investment in efficiency features such as insulation, window glazing,and mechanical equipment should produce cost savings as well associal benefit over time.• Hiring consultants for modeling, commissioning, and certificationdocumentation results in additional cost, which may be offset by theinsurance of an efficient building.• Additional investment in training for building occupants and managersmay be necessary in order to receive full cost savings over timeLife Cycle CostingWhile life cycle costing illustrates that investment in energy efficient equipmentsaves money over time, building projects generally have fixed budgets and thereforemay lack the ability to cover the costs of larger initial investments. Becausemechanical equipment and other energy conserving or environmentally soundmaterials are installed later in the construction on a building, they are more likely tobe cut or reduced through the practice of value engineering if a building is in dangerof exceeding its budget. In such cases, initial costs outweigh life cycle cost savings.Building planners have no way of integrating life cycle cost savings into the initialbudget. The extent to which this has been a serious factor in preventing maximumefficiency at <strong>UCSB</strong> remains controversial. However, flexibility in this area couldensure that sustainability goals are met if they are established as core priorities of thecampus.3.4.5 InnovativenessThe entire field of green building is spawning new and innovative technologies thatreduce environmental impact. The incorporation of innovative features requires acareful balance between selecting proven systems and experimenting with new22
technologies. The designers of Bren Hall have selected a number of new andinnovative features that have been well tested to ensure that they are highly functionalas well as resource conserving. Some of these features include:• Passive solar design and natural ventilation in offices.• Fly ash, an industrial waste product, in the concrete.• Reclaimed water in the first floor toilets and waterless urinals.Innovation spurred by buildings such as Bren Hall could provide <strong>UCSB</strong> with anopportunity to be on cutting edge of the green building movement. By experimentingwith new technologies, the campus can serve as a living laboratory for sustainabledesign.3.4.6 Community/EducationNot only did the greening of Bren Hall open the door to green building on campus, italso created an opportunity to create bridges to the community. The initial demand forgreening came from the surrounding community, and the administration wasresponsive to this demand. In the process of greening the building plans, experts froma range of non-profit groups such as the Rocky Mountain Institute and the SantaBarbara Sustainability Project were called in for consultation. These connectionsoffer new opportunities for partnerships between the University and the surroundingcommunity, which can be called on for developing future projects.Because the field of green building is relatively new, Bren Hall also is functioning asa living laboratory of green design, and is itself an educational resource. Efforts arebeing made to incorporate monitoring and evaluation capabilities into the buildingitself, so that it can provide information on what works and doesn’t work in reachingsustainability goals. The actual construction process of Bren Hall is being broadcastover the Internet from two live video cameras. Other greening features of the buildingare also published on the Bren School website. In addition, the Sustainability Projectwill feature Bren Hall as one of its case studies in its forthcoming green buildingguidelines for Santa Barbara County. Because the push for a green building camefrom the community, there is reason to believe that there is interest in the greenfeatures of the project, suggesting that more could be done to improve the websiteand provide more information to the public about the decision making processesinvolved.Beyond Bren Hall, more could be done on campus to promote awareness ofconservation issues relating to buildings. For example, efficiency features in existingbuildings could be labeled with educational signs. In addition, building occupants canbe better educated as to how to minimize the resource consumption resulting tobuilding use, particularly in terms of energy and water.23
3.5. Environmental Report CardQuestion Answer ScoreDoes the campus have a long-range developmentplan?Does the development plan explicitly state anyenvironmental or sustainability goals?Are there any campus policies that mandate greenbuilding practices?Are there any completed buildings on campus thatincorporate any green building attributes?Are there any campus buildings that are third partycertified green buildings? (LEED or other program)Are any of the buildings in construction or planningphases green buildings?Are there any requirements for green buildingexpertise in requests for qualifications fromarchitects?Are there any required specifications for greenbuilding materials for new buildings or renovationprojects?Does the campus ever use building commissioning toensure that sustainability goals are met?Is building commissioning required by any campuspolicy or guideline?Do any policies govern the introduction of indoor airpollutants from building materials?Have there ever been any serious air quality problemson campus?Yes 1No 0No 0Yes 1Yes 1Yes 1Yes 1No 0Yes 1No 0No 0Yes 1Total: 7/12Percentage: 58%Grade: C24
3.6. Recommendations:3.6.1 Infrastructure• Prioritize funding for energy conservation efforts.• Use “life-cycle costing” and “cradle to grave analysis” when decidingwhich materials, mechanical and electrical equipment to use.• Incorporate life-cycle analysis into value engineering sessions.• Provide continuing educational opportunities for campus staff onsustainable operations and maintenance.• Provide easy to use manuals for building occupants that outline properuse of building features for optimal environmental performance.• Label environmentally sound building features with educational signswherever possible to increase education and awareness of thesefeatures on campus.3.6.2 Building Construction• Select architects with experience in green building.• Utilize passive solar techniques in building design, taking advantage ofthe mild coastal climate of Santa Barbara for natural lighting, heating,cooling and ventilation needs.• Use computer models to maximize efficiency features of buildingdesign.• Utilize third party building commissioning to ensure that buildingsmeet standards for quality, efficiency and sustainability throughout allstages of construction.• Consider building smaller buildings that use space more efficiently tominimize building footprint, materials consumption and energydemand.• Use permeable surfaces instead of concrete or asphalt in walk ways,fire roads or other paved surfaces.• Include specifications for green building materials when requestingbids for building contractors.3.6.3 Indoor Air Quality• Prioritize indoor air quality in building design.25
• Specify low emission alternatives for building and finishing materials,furniture and carpeting.• Conduct periodic checks of exhaust systems of all machinery andappliances regularly to make sure that all vents are working properlyand that no back-drafting is occurring. Check regularly for leaks,standing water, mold growth or damaged insulation material withinHVAC systems.(For Recommendations regarding energy use related to buildings, see Chapter 4.)26
4. ENERGY USE AT <strong>UCSB</strong>4.1. IntroductionEnergy forms the backbone of modern society in many respects. A reliable andaffordable supply of energy is necessary to support the existing global economy, andit plays an integral role in our daily lives. Without energy, the University would beunable to meet its mandate of supplying world-class academic instruction andresearch. At the same time, energy use is associated with some of the world’s mostpressing environmental problems. This section examines the environmental andeconomic costs of energy production, transportation, and usage. In the assessment andanalysis sections we explore the ways that energy is used on campus and themeasures that are being taken to conserve energy. Finally, we make recommendationson how the environmental and economic costs of energy consumption on campus canbe limited.4.2. BackgroundAccording to the Energy Information Administration, the United States is the world’slargest energy producer, consumer and net importer (U.S. EIA, 2000a). The averageAmerican consumes 1.15 trillion kilowatt-hours of energy each year, 85% of which isderived from fossil fuel sources (U.S. EIA, 2000b). In California, a smallerpercentage of energy comes from fossil fuels. California has the most diverseelectricity generation system in the world, with power generated from a range ofsources including coal, natural gas, nuclear power and hydroelectric plants (CaliforniaEnergy Commission, 2001). Each source is associated with different types anddegrees of environmental impact and economic cost. Overall, California consumesapproximately 600 million barrels of petroleum, 2 million short tons of coal and 1.9trillion cubic feet of natural gas per year (U.S. EIA, 2001) (see Figure 4-1).The management and distribution of energy resources is complex. Over the pastcentury, an energy infrastructure based on large centralized power plants anddistribution systems has lead to the establishment of regulated monopolies. Becausepower cannot be stored, a match must be made between the amount of demand at anygiven time and the amount of power released onto the distribution grid. Energyderegulation in California, which began in 1998, has allowed for an open market inenergy production, but not in energy distribution. Under this current system, thewholesale price of electricity has risen sharply, but the retail price for consumers hasbeen capped by regulations. This discrepancy has plunged California’s electricutilities into economic hardship, leaving them on the verge of bankruptcy.27
California Energy Supply17% 1% coal30%nuclearlarge hydro29%renewable23%otherFigure 4-1. Sources of California’s energy supplyAt the same time, energy demand has increased considerably throughout the WesternU.S. over the past few decades due to increases in population and the growth of thehigh-tech industry. However, generating plants and distribution lines have notincreased at the same rate. Energy in California is now being consumed at themaximum rate that it can be supplied. The combination of economic consequences ofderegulation and a lack of sufficient production and distribution capacities havethrown California into an energy crisis. The number of emergencies declared by theCalifornia Independent Operating System (CAISO) can illustrate the degree of crisis.Emergencies indicate that the state is operating at close to full capacity, with only avery small reserve of electricity.Table 4-1. CAISO declared emergenciesYear Stage 1 days Stage 2 days Stage 3 days1998 7 5 01999 4 1 02000 55 36 12001 (as of 2/13) 36 35 31Stage 1 indicates that power supplies are below Minimum Operating ReliabilityCriteria.Stage 2 indicates that operating reserve is less than 5%.Stage 3 indicates that operating reserve is less than 1.5%.Source: Wetherall, 2000When reserves fall below 1.5%, the state is at risk of rolling blackouts. The presenceof sensitive research equipment on college campuses such as <strong>UCSB</strong> makes themvulnerable to such losses in power. College campuses are large consumers of energy,which is required for virtually all campus functions. Therefore, Governor Gray Davis28
has called on schools in the UC and Cal State systems to reduce both energyconsumption and demand drastically by summer 2001.Consumption vs. DemandWhen calculating the amount of energy used, there are two main aspects to consider.The first is energy consumption, or the total number of kilowatt-hours used over agive period. The second is energy demand, which refers to the maximum amount ofenergy consumed at any one point within a given time period. Demand is important toconsider because it determines the amount of generating capacity that is required tomeet energy needs. Peak demand occurs during the times of day and year when themost energy is used (e.g. on hot summer weekdays, when both electrical equipmentand air conditioning are most needed). During off-peak demand times, only the mostefficient generating facilities can be used to supply power to the grid. However,during peak hours, all generating facilities, including the most polluting plants, mustbe on line to provide enough power to the grid. Therefore, peak demand times areassociated with the greatest amount of environmental impact, due both to the totalamount of energy consumed, and to the use of polluting sources. Load management(the shifting of demand from peak to off-peak times) can be an important part ofenergy-related pollution prevention, even though the total consumption of kilowatthoursremains the same.Electricity vs. GasPower is supplied to buildings in two ways—through electricity and through naturalgas. The biggest difference between the two is where the fuel is burned. Electricity,measured in kilowatt-hours, is produced through the burning of fossil fuels (includingnatural gas) or other sources and is transmitted to the site where it will be used viapower lines. Natural gas, on the other hand, is measured in therms and is transmittedthrough underground pipelines, and is burned on site. Natural gas produces far feweremissions of CO 2 and other pollutants, and is therefore considered a better choiceenvironmentally for powering mechanical equipment. Supplies of natural gas werethought to be cheaper and more plentiful than other power sources. However, recentshortages have caused rates to increase from an average of $0.33/therm in 2000 to$1.85/therm in January 2001. Conservation efforts often encourage the conversionfrom electric to gas power where possible, but the conservation of natural gas itself isalso important.Energy ConservationIn order for institutions to both decrease their environmental impact and ensure theavailability of clean, reliable and affordable electricity, a number of measures can betaken. There are three main means of reducing reliance on non-renewable energysources:29
• Incorporate energy efficiency into building design. Low energyprices over the past several decades have taken focus away fromenergy efficiency. The trend has been toward buildings that rely onmechanical systems rather than sound design principles. Risingenvironmental and economic costs are causing builders to questionthese practices and to find ways to utilize the natural properties of thesite to meet energy demands. Energy efficiency can be achieved mosteffectively when integrated into the initial building plans. Passive solardesign principles incorporate the natural heating, cooling and lightingcapabilities of sun and wind to minimize reliance on mechanicalequipment. 2Passive solar design—building orientation and design that utilize thenatural lighting, heating and cooling properties of sun and windinstead of or supplemental to mechanical systems.• Retrofit existing equipment. Even in existing buildings, efficient andappropriately sized appliances, lighting and machinery cansignificantly reduce energy demand. Many buildings that wereconstructed even a few years ago contain equipment such as chillersand boilers that are much bigger than required to effectively cool orheat the building. In addition, these machines often only operate at asingle speed or setting, and therefore consume large amounts of energyeven when it is not required. Retrofits of excessive or inefficientequipment and the installation of variable speed capacities and remotemonitoring and control systems allow building operators to runsystems optimally to meet the building’s needs, and at the same timereduce both energy consumption and cost.• Generate electricity on-site from renewable sources. On-site powergeneration from renewable sources has become increasingly feasibledue to advances in technology and increases in production. Commonlyreferred to as “micropower,” these small-scale technologies rely onsolar or wind power, fuel cells or geothermal energy. The cost ofrenewable energy equipment has decreased dramatically over the past2 Consideration of many aspects of building layout and structure play a role in passive solar design. Forexample, the orientation of the building itself and the location of the windows determine how muchwind, heat and light can enter the building. The types of building insulation and window glazing used,as well as the amount of thermal mass in the physical structure, determine the amount of heat thebuilding will retain. Landscaping outside the building also plays a role. Deciduous trees provide shadein summer and sunlight in winter, which can help regulate building temperature, while evergreen treesprovide year round shade and may be appropriate in areas with high heat loads. Computer models canhelp builders estimate the impacts of various design features.30
five years, and is likely to continue decreasing as demand increases(Dunn, 2000). Funding from utilities and tax incentives can furtherreduce first costs of purchasing equipment. In addition, net meteringagreements can be established with power companies so thatelectricity in excess of what is needed on site can be sold back onto thepower grid to reduce electric bills. Another way that efficiency of onsitesystems can be maximized is through “co-generation,” thetrapping and reuse the waste heat for building heating or hot water.It should be noted that just because electricity is generated on-site does not meanthat it is cleaner or more environmentally sound. On-site generation doeseliminate losses associated with transmission over power lines, but an on-sitegenerator that burns fossil fuels and is inefficient can be just as polluting as acentralized plant. Therefore, the emphasis in terms of sustainability is generallyon generation through renewable sources.Micropower—the small-scale generation of electrical power closer towhere it is used through renewable energy sources.Net metering—an agreement with a utility company to sell powerfrom on site generators in excess of what is needed back onto thepower grid. When power is supplied onto the grid, electricity metersrun backwards and result in an offset of electricity bills equal to amaximum of what the customer would normally use without the use ofon-site generation.Co-generation—the trapping and utilization of waste heat from onsitegeneration systems for supplying heat or hot water to buildings.4.2.2 Environmental ImpactsEnergy ConsumptionAccording to a World Watch Institute report, energy use is one of the largest causesof global environmental impact (Brown and Ayres, 1998). Impacts result from allphases of energy production and consumption, including extraction, processing,generation, transportation, utilization and waste. Different sources cause differenttypes and amounts of damage. In order to compare the impacts of the various sources(such as fossil fuels, nuclear power, hydroelectric power, and renewable sources) acradle to grave analysis must be conducted. Each energy source used in California hasits own set of environmental impacts. A few of these are listed below.31
Table 4-2. Energy and pollutionSource Pollution Habitat Destruction Global WarmingCoal High emissions ofSO x , NO x andparticulatesStrip mining High CO 2emissionsOilNaturalGasHydroelectricNuclearHigh emissions ofSO x , NO x andparticulatesSome emissions ofSO x , NO x andparticulates. Lowestof the fossil fuels.NoneProduction of nuclearwaste, thermalpollution of waterwaysDrilling, oil spills High CO 2emissionsExtraction andpipelinesLost river systems andriparian areasPlutonium mining,waste storageSolar None None. Largegenerating facilitieshave high spacerequirementsWind None None. Largegenerating facilitieshave high spacerequirements.Windmills may bethreat to birds.Some CO 2emissionsNoneNo GHGs,Possibly someincrease inthermal energyNoneNoneCalculating the overall environmental impact of energy consumption of a particularset of buildings is quite complicated. The same amount of energy for the sameactivity in the same location can have different levels of impact depending on thetime of day and year. For example, on summer nights, when total demand ofelectricity from the grid is low, only the most efficient power plants are running. Onthe other hand, on hot summer days or cold winter evenings, when people require themost energy, all power plants, even the most polluting ones, will be on line to meetthe demand. In order to determine the amount of carbon dioxide or other pollutantsresulting from energy consumption, it is important to consider when the energy isused (see Appendix A). In addition, an important part of reducing the environmentalcost of energy demand for large institutions means shifting demand from peak to nonpeakhours.32
The amount of emissions from the burning of all fossil fuels has decreasedconsiderably over the past few decades as emission control technologies have beendeveloped and enforced. In addition, many power plants have switched from oil tonatural gas. However, overall energy consumption has increased, and so the amountof energy-related environmental impact is still enormous.4.2.3 Economic IssuesCost of Fossil FuelsSince the end of the oil crisis of the 1970’s, the economic cost of non-renewablefossil fuel-based energy has remained relatively inexpensive. The assumption haslong been that supplies of fossil fuels are virtually unlimited and that energy priceswill remain low. Under these assumptions, energy conservation became a low priorityin most sectors. The California energy crisis calls the assumption of an unlimitedsupply of inexpensive fuel into question. While rising energy prices have frustratedmany consumers, the current economic costs of fossil fuels do not internalize the truecost to human health and environmental degradation.The future of fossil fuel prices will depend largely on a number of factors, includinginternational politics, the construction of new power plants, and the potential for taxesfrom fees for carbon dioxide emissions under the Kyoto Protocol. Current estimatespredict that today’s elevated prices of both electricity and natural gas will remain highfor at least several years. The impact of these energy price increases can be profoundat the local level. The high level of energy consumption at large institutions makesthem vulnerable to availability and price fluctuations at the international level as wellas the state level. Therefore, there is a strong incentive to explore ways to reduceenergy consumption and utilize alternative sources.Cost of Renewable Energy SourcesAccording to the Union of Concerned Scientists, California is one of the states withthe highest amount of funding dedicated to renewable energy sources (Clemmer et.al., 2000). Still, the majority of energy in the state comes from fossil fuels. Therehave been several barriers to development of renewable energy sources. The first hasbeen that investment in renewable sources has been cost prohibitive when comparedto relatively inexpensive fossil fuels. As long as there has been a steady supply ofcoal, oil and natural gas from both domestic and international sources, there has beenlittle financial incentive to invest alternative sources. In addition, subsidies for fossilfuel energy, which total at least $120 billion annually, make it difficult for alternativesources to compete (Dunn, 2000).Another barrier to alternative energy sources has been the adherence to the traditionalcentralized monopoly of power generation and distribution (Dunn, 2000). This modelwas adopted at the beginning of the 1900s because it was the most efficient way to33
produce large quantities of energy at the lowest cost. Larger plants could producemore electricity at a lower marginal cost, the so-called “economies of scale.” Whencompared at these large scales, solar and wind power have the disadvantage ofrequiring large amounts of space to provide the same levels of electricity. However,environmental regulations, construction costs and rising fuel prices have caused thereduction in marginal cost to level off over the past two decades. At the same time,the equipment required for on-site generation from solar, wind, fuel cells ormicroturbines, has been cost prohibitive for many consumers. However, withadvances in technology, combined with increased consumer demand, the cost per unitof small-scale equipment has dropped dramatically over the past five years, andprices are expected to continue decreasing through “economies of production.” Onsitegeneration provides an alternative to this model, which is advantageous not onlybecause it is cleaner and more reliable, but also more efficient, as no power is lost intransmission over long distances. Thus, experts are predicting a replacement ofeconomies of scale with economies of production and a movement away from a largecentralized electricity system to a decentralized system of micropower (Dunn, 2000).4.2.4 Campus IssuesEvery campus activity—from laboratory research and theater productions to showersin the dorm rooms and light in the classrooms—requires energy. An enormousamount of energy is needed to meet the research, computing, teaching and residentialneeds of a campus, resulting in significant local and global environmental impacts.On any campus, providing and managing energy is a huge and multi-faceted task,typically consuming about 30 percent of an institution’s operations budget (Keniryand Eagan, 1998). Energy costs account for almost 80% of the total campusexpenditure on utilities (Design, Construction and Physical Facilities, 2001).Laboratories, essential to the research capabilities of universities, are particularly highenergy users, with energy demands as much as 4-5 times higher than office buildings.Clean rooms have energy demands that can be 10-100 times higher than offices(Mills et. al, 1996).As energy market deregulation goes into full effect in California, campus managersare faced with the task of ensuring that there is a sufficient power supply at anaffordable cost to keep the campus running. Uncertainty in the energy market,resource scarcity and environmental concerns make the need for energy conservationmeasures and alternatives crucial for the long-term life any institution.4.3. ResultsA series of questions were taken and adapted from the campus environmental auditformat in April Smith’s book, “Campus Ecology.” Energy Program Manager JimDewey, Director of Facilities Management David Gonzalez and Zone Leader Paul34
Gritt, and from Facilities Maintenance historical utility bill records. Additionalinformation comes from the California Energy Commission, and from a draft energyaudit conducted by the Enron Corporation in 1999. Energy data for the UC systemcampuses is provided courtesy of Gary Matteson. All data included were derivedfrom these sources, although additional library and Internet research was alsoperformed regarding specific issues. The following questions were asked to gauge<strong>UCSB</strong>’s status with respect to energy use.1. How much energy does the campus use each year? What is the amount ofenergy used each year per square foot of building space? Per capita of campuspopulation?The campus consumes more than 80 million kilowatt-hours of electricity and about2.8 million therms of natural gas each year. This equals approximately 25 kWh ofelectricity and 0.8 therms of natural gas per square foot of managed building space.FiscalYear1999/2000Table 4-3. Summary of campus electricity consumptionMGSF* Campus Electricity KWH/ KWH/Population (KWH) MGSF person3,191,000 25,387 83,014,663 25.78 3270Includes recharge amounts*MGSF: Managed gross square feet of building space.FiscalYear1999/2000Table 4-4. Summary of campus natural gas consumptionMGSF*CampusPopulationNaturalGas(Therms)Therms/MGSFTherms/person3,191,000 25,387 3,031,218 949.9 119.42. What are the main sources of electricity on campus? What percentages comefrom each source?All of the schools in the UC and Cal State system, including <strong>UCSB</strong>, buy energy fromthe Enron Corporation under a 4-year contract that expires in 2002. The preciseamount of energy consumed by the campus that is derived from different types ofpower plants is difficult to determine precisely due to the inherent complexities of theenergy grid. See Figure 4-1 for power received from each source are based on35
California statewide averages (Wetherall, 2000). The campus also has 37 dieselgenerators, which only supply energy during emergencies.3. How much money does the campus spend on energy each year?Costs associated with annual energy expenditures are listed in Table 4-5.Year1999/2000*Includes recharge costsTable 4-5. Summary of campus energy costsElectricity(KWH)ElectricityCost *Natural Gas(therms)NaturalGas Cost83,014,663 $5,487,911 3,031,218 $1,050,1124. Does the campus have any on-site generation facilities? If so, what is theenergy source? Do these facilities use co-generation capabilities?Only a minimal amount of energy is produced on site using solar panels. No other onsitegeneration occurs, and therefore no co-generation facilities exist. The only on-siteenergy source is the solar array located on top of one of the dormitories for supplyingdomestic hot water. The solar panels significantly reduce the amount of natural gasrequired for this purpose.Other attempts at installing alternative energy sources on campus have been lesssuccessful. <strong>UCSB</strong>, in partnership with Southern California Edison, installed a 200 kWfuel cell behind the old Gym pool to supplement energy demands. Because highmaintenance costs made the unit inefficient to run, the unit was retired in 1998, andwas removed from the campus in 2000.Proposals have been approved for State funding to purchase a new 200 kW fuel cellfor Bren Hall. The fuel cell uses natural gas and will serve Bren Hall exclusively,although a co-generation system to recover the waste heat to provide hot water to thedorms has been proposed. There is currently no funding available for the cogenerationsystem. In addition, State funding for the purchase of a 40 kWphotovoltaic array for Bren Hall has also been approved.5. How much carbon dioxide is emitted into the atmosphere from campus energyconsumption?Calculation of CO 2 emissions that the campus is responsible for is complicated by thefact that the amount of emissions varies with time or day and year and with the36
efficiencies of individual power plants. * The following numbers are rough estimationsthat are most useful for suggesting orders of magnitude rather than actual amounts(see Appendix A for calculations and assumptions).CO 2 emissions fromelectricity:CO 2 from natural gas:Total:68,146,736 lbs CO 2 /year36,071,494 lbs CO 2 /year104,218,230 lbs CO 2 /yearIn addition, we calculated the marginal amount of CO 2 emissions, or the amount ofCO 2 emission reduction that would occur from the reduction of energy use by 1 kWhduring peak loads (see Appendix B for assumptions and calculations). Reducingelectricity demand by 1 kWh would reduce CO 2 emissions by: 1.79 lbs/kWh in thesummer, and 1.31 lbs/kWh in the winter. In other words, if <strong>UCSB</strong> reduced its energydemand by 1 kW during peak demand in the summer, it would prevent 1.79 lbs ofCO 2 from being emitted every hour.6. What are the main uses of energy on campus?The biggest use of energy on campus is the operation of HVAC (heating, cooling andair conditioning) systems, and the second largest (non-HVAC) use is lighting. Theseuses are typical or commercial buildings.Campus Electricity UsesCampus Natural Gas Use5%12%20%41%CombinedHVACLightingPlug loadsProcess15%5%HeatingHot WaterOther22%Other80%Figure 4-2. Partitioning of campus energy use7. What buildings on campus use the most energy? The least?* It is possible to determine emissions with more precision using sophisticated computer models.However, these models are generally quite expensive, and were therefore not used for this project.37
The engineering buildings are by far the largest consumers of energy on campus. Twonew engineering buildings are scheduled for construction in the next 5 years, whichwill have a large impact on total campus energy consumption. Engineering II uses themost energy (10% of total campus power demand). Other science buildings includingPhysical Sciences North, Physics and Biology II also have high energy demands.Humanities and Social Sciences Building, which is one of the newest buildings oncampus, uses the least amount of energy of all the major campus buildings.8. How does <strong>UCSB</strong>’s energy consumption compare to other UC campuses?<strong>UCSB</strong> ranks 6 th among the UC campuses in electricity consumption. Both UCRiverside and UC Santa Cruz consume less electricity (See Figure 4-3). In addition,<strong>UCSB</strong> uses the least amount of natural gas of any UC campus (See Figure 4-4).250200KWh x10^6150100500BerkeleyDavisIrvineRiversideSan DiegoSan FranciscoSanta BarbaraSanta CruzFigure 4-3. Electricity use among the UC campuses38
Therms x10^5160140120100806040200BerkeleyDavisIrvineRiversideSan DiegoSan FranciscoSanta BarbaraSanta CruzFigure 4-4. Natural gas consumption among the UC campuses9. What campus programs or policies (if any) exist to encourage energyconservation? When were these policies implemented?Energy efficiency in California is mandated through Title 24 Section 6, which wasimplemented in 1978 and updated most recently in 1998. There is currently nocampus-wide policy that is backed by the Administration or the Academic Senate toencourage energy efficiency at <strong>UCSB</strong>. An Energy Program, run by the Energy Team,was established in 1998 through Facilities Management to find ways for the campusto increase energy efficiency, manage peak demands and reduce costs. Energyefficiency measures taken on campus have been the result of efforts by Facilitiesstaff, funded by bonds from the State.10. What types of energy conservation projects have been completed on campus?How are these projects funded?The Energy Team has completed a range of conservation and efficiency retrofits,including:• Installation of a central chilled water loop to meet the cooling needs of7 campus buildings.39
• Installation of a computerized Energy Management Control System foreffective management of energy loads.• Replacement of inefficient mechanical equipment such as pumps andfans with high efficiency models.• Replacement of two-thirds of campus lighting with high efficiencyfluorescent lighting.Other projects are currently underway or are planned for the near future:• Expansion of the central chilled water loop to service the majority ofthe buildings on the main campus, and to switch demand times byproducing ice at night for daytime cooling.• Expansion of the Energy Management Control System.• Retrofits of the remaining one-third of campus lighting.• Installation of efficient fume hoods in campus laboratories.State bonds, through the Energy Efficiency Revenue Bond Program, have fundedcampus energy-conservation projects. So far, conservation projects prevent the use ofmore than approximately 43 million kWh and save the University more than $3million annually in avoided utility costs.4.4. Analysis of Results4.4.1 Current Progress/Trends<strong>UCSB</strong> currently uses more than 86 million kilowatt-hours of electricity per year at acost of more than $5,000,000. The majority of this energy comes from coal andnatural gas sources, with additional power derived from nuclear and hydroelectricpower. Estimates based on projected infrastructure and population increases predictthat the campus will be using 135,572,000 kilowatt-hours per year by 2020, a 64%increase (Enron, 2000). As we have seen from rising energy costs in the past year,fossil fuel supply is finite and low energy costs are not guaranteed. Therefore, theUniversity has a strong incentive to invest in both conservation measures andalternative sources.Strategic Energy Plan<strong>UCSB</strong> served as a pilot campus for the development of a Strategic Energy Planprepared by Enron Energy Services. This alone indicates that <strong>UCSB</strong> is preparing toaddress its energy situation in a proactive way, according to Karl Brown, DeputyDirector of the California Institute for Energy Efficiency.40
According to the Strategic Energy Plan Report (the Report), the current peak demandof the campus is 14 megawatts. With projected growth in campus population andfacilities, that level is projected to increase to 22 mw by 2010 using a “business asusual” scenario. However, the report outlines a series of strategies for reducingenergy demand, and predicts that demand could actually be reduced to as little as 12mw by 2010 (Enron, 2000). While the Report does take into account the majority ofplanned future campus development, it does not consider several projects. Therefore,demand will likely be higher than the estimates predict. However, the potential fordrastic improvement still exists in the areas discussed in the Report.Conservation ProjectsProjects that have been completed or are in progress to improve energy efficiency at<strong>UCSB</strong> indicate that the school is on the right track. The Energy Project staff hascompleted retrofits on a number of buildings and has recently installed the chilledwater loop in the library to serve the majority of campus buildings with efficientcooling capabilities. Energy efficient lighting upgrades have been completed on twothirdsof the campus so far, and efforts are continuing to upgrade the remaining third.The computerized Energy Management Control System has been installed in manyareas of campus, and it is in the process of being expanded so that eventually theentire energy system of the campus will be automated. The results of these effortshave been a significant avoidance of energy usage and cost.Electricity ConsumptionWhile conservation projects are effective, they must be viewed in context with theincreasing energy demands of the campus as a whole. Figure 4-7 shows that the totalamount of energy consumed per person increased steadily, indicating that the drivingforce behind increasing energy demand is from building space and plug load ratherthan rising campus population. The decreasing trend in energy consumption,beginning in 1997-98, noted in all three energy figures correlates with the onset ofconservation measures described above, particularly the new chilled water loop andthe lighting retrofits. While the trend of the last few years is promising, more must bedone to limit energy consumption form non-renewable sources on campus.41
100KWH x10^680604020087/88*89/90*91/92*93/94*95/9697/9899/00Fiscal yearFigure 4-5. <strong>UCSB</strong> annual electricity consumption.20KWH/sq. ft.15105087/88*89/90*91/92*93/94*95/9697/9899/00Fiscal YearFigure 4-6. <strong>UCSB</strong> annual energy consumption per square foot.42
KWH/total campuspopulation40003500Figure 3000 4-11. <strong>UCSB</strong> electricity consumption per capita2500200015001000500088/89*90/91*92/93*94/95*96/9798/99Fiscal YearFigure 4-7. <strong>UCSB</strong> annual energy consumption per capita.Natural Gas ConsumptionMost of the conservation projects on campus have focused on electricity rather thannatural gas. Natural gas consumption remained nearly constant between 1988 and1993, when it averaged around 2,390,000 therms per year. In 1995 gas consumptionpeaked and has remained high since then, averaging around 2,870,000 per year (seeFigure 4-8). This is about 20% higher than previous years. Gas consumption persquare foot of building square footage has remained relatively constant (Figure 4-9).Figure 4-10 shows that per capita consumption of natural gas on campus alsoincreased over the past decade. This increase is primarily attributed to the additionalheating loads associated with new buildings.43
Therms x10^53530252015105087/88*89/90*91/92*93/94*95/9697/9899/00Fiscal YearFigure 4-8. <strong>UCSB</strong> natural gas consumptionTherms/MGSF0.70.60.50.40.30.20.1087/88*89/90*91/92*93/94*95/9697/9899/00Fiscal YearFigure 4-9. <strong>UCSB</strong> natural gas consumption per unit area44
Therms/total campuspopulation12010080604020088/89*90/91*92/93*94/95*96/9798/99Fiscal YearFigure 4-10. <strong>UCSB</strong> natural gas consumption per capitaAlthough natural gas is less environmentally destructive than electricity generated byother fossil fuels, it still does have an environmental impact. Furthermore, theeconomic cost of using natural gas has skyrocketed unexpectedly over the past year,with rates increasing more than 500% between 1999 and 2000, according to theCalifornia Energy Commission. Therefore, the University should consider ways toreduce natural gas consumption by making systems more efficient and possiblyinstalling alternative heat generating sources. Some solar panels have been installedon the roofs of dormitories to provide domestic hot water, which has decreased theamount of natural gas consumption. While these panels are a good first step in usingsolar power, much more can be done in this area.Future ProjectsIt is promising that conservation measures have in fact begun to bring consumptionlevels down. However, consumption is still high, and will continue to rise still higherin the next several years as at least four new buildings come on line. According to arecent survey by Gary Matteson, electricity demands are scheduled to increase by29% over the next five years (Matteson, 2001). Thus, the University is going to needto expand the types of conservation projects it invests in order to ensure the reliable45
and affordable electricity supply that is essential for achieving the University’smandate of academic excellence.The California energy crisis may provide both the impetus and opportunity forinvestment in such projects. Gov. Davis has emphasized the role of State colleges inconserving energy, and has identified funds through the California EnergyCommission to finance projects that could result in energy savings by summer 2001.<strong>UCSB</strong> has submitted proposals for a broad range of energy projects includingimprovements in infrastructure, expanded equipment and lighting retrofits, andinstallation of fuel cells and photo voltaic cells for on-site power generation.4.4.2 Environmental ImpactDespite the fact that campus electricity consumption has begun to decrease over thepast few years in response to conservation projects, the total amount of consumptionhas remained high. Campus electricity use alone causes around 63 million tons ofCO 2 emissions each year, which contributes to global warming. In addition, thecampus contributes to some extent to all of the environmental impacts that werepreviously outlined in Table 4-2.It is important to note that most of these impacts do not occur on campus directly, andare therefore not within direct control of the University. Instead, the Campus putsdemand on a larger system of energy provision, which causes both global and localenvironmental impacts. Some of these impacts have direct impacts on <strong>UCSB</strong>’scampus, such as oil spills in the Santa Barbara Channel, while others do not directlyaffect the campus at all, but harm places in other parts of the world. By reducingenergy demand and investing in alternative forms of energy production, theUniversity lessons impacts at all scales and also helps open up markets for lessenvironmentally damaging technologies.Funding4.4.3 Institutional FrameworkThe main obstacles associated with energy efforts on campus result from a lack offunding. Unless paid for by bonds, energy projects must compete for funds with othercampus projects, including new building construction and an extensive deferredmaintenance budget. Alternative energy source equipment generally requires higherfirst costs than traditional equipment. Therefore funding is often difficult to obtain forthese types of projects when life cycle costs are not prioritized.Energy TeamIn 1989, <strong>UCSB</strong> took over the responsibility of campus energy management from theUC Office of the President. Since that time it has conducted a complete energy survey46
and begun a series of conservation projects. <strong>UCSB</strong>’s Energy Team, comprised by sixfull time staff members, is able to look comprehensively at energy use on Campus inorder to identify the most effective ways to improve on all energy issues. The goals ofthe Energy Team are to increase efficiency and reliability while reducing costs andpromoting awareness across Campus. No environmental goals are specificallyidentified, but many of the methods for increasing energy efficiency also yieldenvironmental benefits.The Energy Team at <strong>UCSB</strong> is well structured to work toward sustainability onCampus. The main constraint that they face is lack of funds, which often getchanneled to other projects because of a lack of a clearly stated commitment tosustainability from the administration.Zone StructureFacilities Management has divided Campus operations into separate Zones (Chapter 3for more details). Zones allow managers to become familiar with specific parts ofcampus in order to ensure the most efficient operations. This system is also wellsuited to optimizing energy efficiency, as long as staff members are properly trainedin efficiency measures. The fact that some staff members do not feel comfortable withthe new computerized Energy Management Control System prevents the potentialadvantages of this system to be realized.4.4.4 Financial SupportEnergy ContractThe UC and Cal State systems signed a four-year electricity contract with HoustonbasedEnron Energy Services in 1998. According to the LA Times (Peabody, 2001),the deal has buffered the schools from rate increases and therefore has saved them atleast $20 million across all schools over the four-year period. While signing a longtermcontract was seen as somewhat of a risk because it could have prevented savingsif rates had dropped significantly, it was signed to bring security to these large energyconsumers in the face of uncertainty under deregulation. The California universitysystem (including both UC and Cal State schools) consumes 1% of the state’selectricity (Peabody, 2001). The deal with Enron represents one of the few cases ofusers taking advantage of direct access to energy providers under State energyderegulation.Availability of FundsOne of the main reasons that the most energy efficient equipment is not always usedon campus is lack of funding for initial investment. Because new building projectshave fixed budgets, value engineering is often required to ensure that projects do notoverspend. Energy efficiency is not a primary priority in value engineering efforts;47
thus, efficient equipment is sometimes eliminated form projects, even though theinitial investment could result in cost savings over time. Energy conservation projectsmust compete with other capital projects for funding, and priority is often given tonew buildings and construction, rather than energy retrofits or equipment upgrades.Cost SavingsBecause energy bills constitute such a large expense for the campus (more than $5million per year), the campus does have a strong incentive to reduce energyconsumption. Projects that increase energy efficiency make sense economically aswell as environmentally. For example, energy retrofits on campus (including lightingand mechanical equipment upgrades) save the campus more than $3 million per yearin avoided utility costs. Energy saving features of Bren Hall will save $32,000 peryear. A cost benefit analysis of the Bren Hall features reveals an initial investment of$148,000, which should yield a net present value benefit of $88,000 over 10 years(Dozier, 2000).On-Site GenerationInvestment in on-site energy generation can be more difficult to justify on economicgrounds. Up front costs of fuel cells and photovoltaic cells can be quite high, althoughthese costs are quickly declining in the face of increased demand. While investmentin solar water heaters and photovoltaic arrays can pay for themselves in energysavings within 3-7 years, investment in fuel cells still have a longer payback time. Forexample, the 200-kilowatt fuel cell being considered for Bren Hall will costapproximately $950,000 to install, including infrastructure. The unit would save thecampus $46,000 in electricity costs each year based on 1999 electricity prices. At thatrate, it would take more than 20 years for the campus to earn back its investment. Inan institution where funds are limited and competition for resources is intense, thistype of investment is unlikely to be prioritized. However, there are considerations thatmake investments in on-site generation more attractive.First, the onset of the California energy crisis will undoubtedly result in energy priceincreases that could be as much as 40% higher. Natural gas prices have already shotup by approximately 200%. Thus, the payback time for investments in alternativesource on-site generation could have dramatically lower payback times. Second,alternative energy sources such as fuel cells and PV cells are clean running, resultingin very little pollution or CO 2 emissions. Current economic evaluations do notconsider these advantages, but there is still some value for the university to limit itsoverall contribution to environmental problems, and this alone could justify theexpense. Third, by utilizing co-generation technologies, waste heat can be harnessedto provide heat or hot water to other buildings, thus increasing total annual savings,particularly because of the rise in natural gas prices. Fourth, if the campus is able togenerate more electricity than needed to meet its own needs, it can sell the excess48
ack onto the grid at market price. In addition, organizations such as the CaliforniaEnergy Commission and Southern California Edison often provide direct funding orfinancing programs in order to bring down the initial price of on-site generationequipment. Lastly, advances in technology and increases in consumer demand arecontinuing to bring the price for alternative energy sources down, making things likefuel cells more affordable.Other campuses in the UC system have already begun to benefit from on-site powergeneration. UCLA, UC Davis, UC San Francisco, UC Berkeley and UC San Diego allhave on-site co-generation plants, which generate a total of 100 megawatts plusadditional building heating (Peabody, 2001). Several funding sources, which havebeen created since the onset of the California energy crisis, will likely provideopportunities to schools to increase power-generating capacity. Most notably,Assembly Bill 970, passed by the California Legislature and signed by Gov. GrayDavis in November 2000, makes available $50 million to the California EnergyCommission to fund projects that reduce peak energy demands by summer 2001. TheEnergy Team at <strong>UCSB</strong> has written proposals for 12 projects to be submitted, whichwould fund a range of projects ranging from continued lighting retrofits to thepurchase of fuel cells and PV cells. If funded, these projects could significantlyreduce both the financial burdens and environmental impacts of campus operationsfrom energy use.4.4.5 Innovativeness<strong>UCSB</strong>’s Energy Team and other Physical Facilities staff members have been hard atwork for the past few years identifying efficient ways of reducing energy demand.The two largest areas in this endeavor represent innovative uses of new technologies.The new chilled water loop allows for effective cooling of many campus buildingswith a minimal amount of energy input. The system was designed specifically for thecampus.The campus energy team has embarked on a number of projects to increase energyefficiency. Projects include the installation of energy-efficient lighting, thereplacement of old motors with energy efficient models, the installation of variableair volume HVAC capabilities, the modification and/or replacement of laboratoryfume hoods with energy efficient models, the increase of thermal energy storagecapacity, and other miscellaneous projects.One of the most ambitious energy saving projects on campus has been the installationof a highly efficient chilled water loop in the basement of the library. The chillercurrently provides cooling for 7 buildings, and several more will be added to thesystem in the next few years. When the new chiller became operational, it replaced 13older and less efficient chillers, as well as associated pumps and fans. New, efficient,variable-frequency models replaced old pumps, so that building temperature can be49
controlled most efficiently. Plans to expand the system include extending the loop tothe majority of buildings on campus, and to use the chiller to make ice at night inorder to provide cooling during the day while shifting high demand to off-peak hours.Another important energy project on campus is the installation of an EnergyManagement Control System. This system provides real-time data and allows energymanagers to assess and control operating systems around campus by computer inorder to manage energy loads. This tool has become important during the Californiaenergy crisis, when the school has been called on to reduce energy demands in orderto prevent rolling blackouts in the State.The installation of the Energy Monitoring Control System represents anotherimportant innovation for the campus. The system allows energy managers to have alevel of precise control that was never possible in the past. The system has played anextremely important role during the energy crisis, when campuses were called on tolimit energy consumption by up to 7%. Energy managers have been able to shut offdifferent HVAC systems on a rolling basis to cut down on consumption withoutbuilding users even noticing. By carefully balancing energy decreases with occupantcomfort levels, the campus has been able to reduce demands dramatically. This hasenabled <strong>UCSB</strong> energy managers to volunteer to reduce power by 1,750 kilowatts atthe request of the California Independent Systems Operator under the ISO DemandRelief Program, one of the highest levels committed by any UC school.Staff Training4.4.6 Community/EducationOne major area in need of improvement for campus energy operations is continuingeducation for energy personnel on effective ways to operate new computer-basedmonitoring equipment. No amount of investment in high-tech equipment can beworthwhile without a staff that is trained to take advantage of it. In addition, trainingcan help boost moral of the staff and encourage them to actively engage with and findways to maximize sustainability on campus.Campus OutreachDuring the recent energy crisis, Facilities Management sent out emails to alldepartments on campus notifying them of the ISO declared emergencies andrequesting assistance in conserving energy. Many departments have responded byturning off hallway lights and computer monitors in order to decrease energy demand.Other outreach projects include presentation to campus departments andadministration, and the formation of a campus energy committee. These efforts are inthe process of being expanded in order to increase conservation by campus users.50
4.5. Environmental Report CardQuestion Answer ScoreDoes the University have an energy conservationprogram?Yes 1Is the total amount of energy consumptiondecreasing?Is the amount of energy per square foot buildingspace decreasing?Is the amount of energy use per capitadecreasing?Does the University meet at least 10% of itsenergy needs from the use of alternative sourceson-site?Has the University begun to replace lightingfixtures and bulbs to increase energy efficiency?Has at least 75% of inefficient lighting beenreplaced?Has the campus begun replacement of inefficientmechanical equipment?Has at least 75% of inefficient mechanicalequipment been replaced?Do new buildings exceed Title 24 standards forenergy efficiency?Is there a campus-wide policy on energyconservation?Are there any outreach programs to increaseenergy conservation on campus?Yes 1Yes 1Yes 1No 0Yes 1No 0Yes 1Yes 1Yes 1No 0Yes 1Total: 9/12Percentage: 75%Grade B-51
4.6. Recommendations4.6.1 Promote Outreach, Education and Innovation• Increase continuing education for campus energy managers.• Encourage energy managers to find innovative ways to conserveenergy.• Educate building occupants, especially office, laboratory, andcomputer center staff, on ways to conserve energy.• Use information reporting of departmental performance on energyconservation by publishing consumption statistics on a campus website.• Provide incentives for departments to conserve energy.• Educate students living in dorms on the importance of energyconservation.4.6.2 Use Energy Efficient Equipment and Alternative Sourcesof Energy• Adopt campus-wide building standards for energy efficiency thatexceed Title 24 standards.• Conduct a comprehensive study on the feasibility of alternative energy(solar, wind, fuel cell, microturbines, geothermal, etc.) generation oncampus. Employ these options wherever possible.• Require a minimum percentage of electrical generation purchasedfrom the provider to come from renewable sources (must be UC andCal State system wide.)• Require that all campus appliances and electrical equipment haveEnergy Star labels or meet minimum energy efficiency standards (asoutlined by the American Council on an Energy Efficient Economy’sannual publication on appliance ratings.)4.6.3 Continue Energy Retrofits• Continue efforts to upgrade aging mechanical and electrical equipmentsuch as chillers, boilers, fans, pumps, lighting, etc. with high efficiencyalternatives.52
• Use high efficiency lighting and fixtures and bulbs (including outdoorlighting and exit signs.)• Use task lighting to supplement ambient daylighting in work areas.Provide variable and automated daylight-actuated controls so that onlythe amount of light needed is used.• Replace older laboratory fume hoods with energy efficient models.53
5. WASTE M<strong>AN</strong>AGEMENT5.1. IntroductionThis chapter investigates waste management efforts focusing on: solid wastemanagement, recycling efforts, hazardous waste management, and purchasingpractices. The background, environmental impacts, economic issues and campusissues are investigated for each topic. The solid waste, recycling and purchasingpractices sections focus primarily on paper and paper goods and office supplies, giventheir immense presence on university campuses. Although it would be quite useful tolook at the environmental standards surrounding the purchase of non-paper itemssuch as computers, photocopiers and other electronic equipment in more detail, it wasbeyond the scope of the present report.5.2. BackgroundAmericans generate approximately 208 million tons of trash each year, or more than4.3 pounds of solid waste per person, per day (U.S. EPA, 1996a). This figure is twiceas much as any other country, and waste generation in the US is expected to increasefurther due to increased population and reliance upon disposable goods. The U.S.EPA predicts that waste generation will increase to 253 million tons of waste by theyear 2010 (U.S. EPA, 1996a). There are two primary sources of solid waste in theUS: residential waste (which includes single and multi-family dwellings) andcommercial waste (which includes schools, industrial sites and some businesses).College campuses primarily fall in the commercial waste sector, with waste generatedfrom a diverse array of activities, including scientific research, the food sector, andoffice operations. Although the commercial waste sector generated less than half ofall U.S. municipal solid waste in 1995, reductions here can still have a major impacton the surrounding ecological integrity.5.2.2 Waste ManagementCommunities all over the country generate large amounts of waste, much of whichcould be prevented, reused or recycled. Effective waste management is a vitalfunction for any community given concerns regarding environmental harm associatedwith the generation and disposal of waste, limited landfill space, and economicfactors. There are three primary steps involved in successful waste management:reduction, reuse and recycling.54
ReduceReuseRecycleFigure 5-1. Principles of waste management• Step One: Waste prevention: “Any action undertaken by anindividual or organization to eliminate or reduce the amount ortoxicity of materials before they enter the municipal waste stream. Thisaction is intended to conserve resources, promote efficiency, andreduce pollution (CIWMB, 1995).”Waste prevention (also referred to as source reduction) includes a range of activities,from reduced packaging to preferential purchasing. Waste prevention plays animportant role in waste management efforts as it has the potential to reduce thevolume of solid waste generated, and thus the amount of waste that needs to bedisposed of. This could result in substantial environmental and economic gains forcommunities at all levels. Waste prevention is generally considered the mostimportant step in waste management, as there will be less need for recycling anddisposal if there is less waste generated to begin with.• Step Two: Reuse: “The recovery or reapplication of a package orproduct for uses similar or identical to its originally intendedapplication, without manufacturing or preparation processes thatsignificantly alter the original package or product (CIWMB, 1995).”The concept of reuse is extremely important as a means for aiding in wasteprevention/ minimization programs, as people can reuse products rather thandisposing of them. There are numerous opportunities for reuse to occur, given thatmany products are simply thrown away before they reach the end of their usefullifespan. However, at some point these products will still need to be disposed of,which suggests that reuse should be paired with other steps to ensure for effectivewaste management.• Step Three: Recycling: “The process of collecting, sorting, cleansing,treating and reconstituting materials that would otherwise becomesolid waste, and returning them to the economic mainstream in theform of raw material for new, reused, or reconstituted products which55
meet the quality standards necessary to be used in the marketplace(CIWMB, 1995).”Recycling is a two-toned issue, for which both positive and negative arguments havebeen made. On the one hand, recycling conserves resources by decreasing relianceupon virgin materials. However, recycling is not an entirely ‘clean’ process, as it stillrequires the use of significant quantities of resources and energy. Recycling is abeneficial way to manage materials that would otherwise become waste, and forwaste that cannot be prevented, recycling is the next best choice.This discussion suggests that an effective waste management strategy will typicallyincorporate one or more of these steps. However, experts agree that waste preventionis the most effective way to control municipal solid waste, and thus all wastemanagement programs should begin with a focus here.5.2.3 LegislationSolid waste legislation has been implemented on both the federal and state level. Ofutmost importance to <strong>UCSB</strong> is State Legislature Bill AB675 (AB75), which tookeffect on January 1, 2000. This bill states that municipalities, including <strong>UCSB</strong>, mustreduce landfill weights by: 25% by the year 2002, and 50% by the year 2004. Thisbill is a continuation of AB 939, which called for similar landfill reductions by 1995and 2000. Many communities in California failed to meet regulated waste reductionlevels mandated by AB939, and had to ask for extensions to avoid $10,000/day fines.Therefore, a new challenge now lies in meeting solid waste reduction levels asmandated by AB75.Over the years, the disposal of hazardous materials has become more stringentlyregulated. <strong>UCSB</strong> currently has two key legislative considerations: RCRA andCalifornia SB-14. The Resource Conservation and Recovery Act (RCRA), managedby federal authorities, requires ‘cradle to grave’ tracking of hazardous wastes. In1991, the U.S. EPA authorized the State of California to implement RCRA in thisstate. In fact, the California program is more stringent than the federal program inmany respects. Lastly, “right-to-know” laws at both the federal and state levelsrequire users of hazardous materials to submit information regarding materials usedand accidental releases of hazardous substances to regulatory agencies (Smith, 1993).5.2.4 Environmental ImpactsThe high energy and materials requirements of today’s industrial societies mayseriously impact the environment over time, both in terms of product manufacturing(use of non-renewable resources) and product disposal. Universities have animportant relationship with these two areas, given the large amount of goodspurchased and disposed of by students, faculty and staff. However, the trueenvironmental impacts associated with the use of a product from cradle to grave are56
not fully understood. An overall assessment of environmental impacts associated withboth waste generation and disposal is outlined below.Waste GenerationThere are significant environmental costs associated with the extraction of materialsand the manufacturing of products that are used in substantial quantities by largeinstitutions. The manufacturing of products and materials results in the depletion ofminerals, the use of large quantities of energy, the depletion of native forests, the nonrenewableuse of petroleum, and water and air pollution. The environmental concernsassociated with the continued increase in waste generation spill over into any futurewaste-management efforts. With less generation of waste to begin with, there is lessof a need to address treatment and disposal issues. Therefore, taking steps to targetthe waste problem at the first step, waste generation, will yield the greatest futurereturns.Waste DisposalThe generation of large quantities of waste subsequently makes it necessary for moremeans of waste disposal to be identified, which in itself is an extremely timeconsuming, controversial and costly activity. Each year, approximately 130 tons ofmunicipal solid waste (MSW) ends up in landfills across the country (Earth Work’sGroup, 1990). There are great uncertainties regarding the effects/impacts of thedisposal of such large quantities of waste. No one knows what kinds of hazards wewill face in the future from the garbage, some of it toxic, that is already buried in theground (Rafthje and Murphy, 1992). In addition, landfill space is limited and otherdisposal methods have not proven popular. Landfill disposal is dangerous for manyreasons:• Landfills commonly release gasses that consist of naturally occurringmethane and carbon dioxide. These gases form inside the landfill asthe waste decomposes. As the gases form, pressure builds up inside alandfill, forcing the gases to move. Some of the gases escape throughthe surrounding soil or simply move upward into the atmosphere,where they drift away. Typically, landfill gases that escape from alandfill will carry along toxic chemicals from sources such as paintthinner, solvents, pesticides and other hazardous volatile organiccompounds (VOCs), many of them chlorinated (Montague, 1998).While there are no solid data regarding the true amount of greenhousegasses emitted by landfills, EPA models estimate that they maycontribute as much as 35% of total U.S. greenhouse gas emissions,thus posing a significant threat (Phillips, 1998). The release ofmethane gas, in particular, is a serious issue, as methane has beenrecognized as a greenhouse gas contributing to global climate change.57
Landfills typically generate methane for decades, gradually releasingthe gas into the atmosphere. Although technological innovations havebeen designed to deal with this problem in new landfills, existinglandfills are still a potential source of danger.• In addition to gas emissions, landfills also have the potential tocontaminate groundwater supplies due to leakage contaminated withtoxic materials. The U.S. EPA estimates that approximately 75% ofthe 55,000 landfills in the U.S. are polluting groundwater reserves(Jones-Lee and Lee, 1993). Municipal solid waste (MSW) landfillleachate contains a wide variety of hazardous chemicals, conventionalcontaminants, and non-conventional contaminants. Contamination ofgroundwater by such leachate renders it, and the associated aquifer,unreliable for domestic water supply and other uses (Jones-Lee andLee, 1993). Numerous studies have revealed a significant correlationbetween the contamination of groundwater supplies and public healthrisks, such as cancer, birth defects, and mutations. Thus, greatattention must be placed on the prevention of groundwater pollution byMSW landfill leachate.5.2.5 EconomicsIn general, economics provide a common forum for the discussion of costs andbenefits associated with environmental issues. However, deriving the true costs andbenefits associated with any activity is rarely a straightforward activity. For example,measuring the costs associated with purchasing recycled-content products may beeasier to determine than the benefits associated with the decreased use of virginproducts. The waste sector, however, does provide some useful sources for measuringeconomic impacts such as the price of disposal (land filling vs. recycling) for variousgoods and materials.Cost of Waste and Waste ManagementAs was noted with respect to the environment, there are significant fiscal costsassociated with the extraction of materials and the manufacturing of products. Wastegeneration results in large fiscal costs, due to the increased use of non-renewableenergy and material sources, resulting business inefficiencies, and the mere fact thatby wasting more, you get less out of what you produce and/or purchase. Wastemanagement itself is an activity that amounts in significant costs for individuals,communities and regional authorities due to labor, equipment, facility and temporalcosts.58
Municipal Solid WasteWaste collection is the single most expensive component of a solid wastemanagement system, representing ~2/3’s of the cost of managing MSW (APWA,1976). By decreasing the amount of waste generated to begin with and concurrentlyincreasing recycling efforts, there exists a great possibility to note significantmonetary savings. Although recycling is more expensive than traditional solid wastemanagement methods, many industry leaders have proven that it is possible to doright by the environment and still make a profit. For example, the nations’ threelargest solid waste companies, which offer collection, hauling and disposal services,produced total revenues in excess of $17 billion in 1994 (Phillips, 1998).Hazardous WasteHazardous waste notes fiscal issues similar to those of MSW, although the majorityof costs here relate to disposal. Hazardous waste is very expensive to dispose of,given the serious environmental and health impacts associated with exposure. Findingan area to dispose of hazardous waste is a difficult, costly and time-consuming task initself. Most hazardous waste is disposed of in states such as Arkansas, Louisiana andUtah. The safe transport of hazardous waste across thousands of miles to these areasresults in large fiscal costs. In addition, there are significant liability concerns forthose who use and dispose of hazardous waste. Should hazardous waste leak from itsdisposal site to contaminate the surrounding air, water or soil, those who sent theirwaste to the disposal site could face large monetary fines. Although these costs maynot be incurred for several years, they could cause great financial stress for aninstitution such as a university, and should thus be considered carefully. By reducingan institution’s reliance upon and quantitative use of hazardous materials, there isthus a great opportunity to reduce that institution’s fiscal burdens.Costs Associated with Recycled-Content Products, etc.In the past, most companies that shied away from the use of recycled-contentproducts did so for economic reasons (i.e., recycled-content goods cost significantlymore than virgin goods). However, in recent years, the market has noted a smallerprice difference between these goods. In addition, many programs have now beeninstituted to encourage the use of recycled goods. Although recycled-content goodsstill cost more than virgin goods for most products, the economic theory of economiesof scale suggests that as demand for a product grows, supply will grow, therebylowering the price. Thus, increased demand for recycled-content goods by institutionswith great purchasing power (such as universities) will likely help drive the pricedown for such goods.59
Solid Waste5.2.6 Campus IssuesWaste management is a serious issue at institutions such as universities, wherethousands of people live and visit daily. The average college student produces 640pounds of solid waste each year, including 500 disposable cups and 320 pounds ofpaper (Earth Works Group, 1990). Given this average, <strong>UCSB</strong> alone is estimated togenerate more than 16.2 million pounds of waste each year. 3 Serious human healthand ecological threats may be associated with the generation and disposal of suchlarge quantities of waste.Hazardous WasteAmericans discard more than 2 million tons of hazardous waste each year,approximately 2/3 of which makes its way to a landfill. This is a serious concerngiven that significant environmental and human health hazards may be associatedwith landfill leakage. Although educational institutions typically produce lesshazardous waste than industrial facilities, a 1990 EPA report estimated that collegesand universities generate 4,000 metric tons of a wide variety of hazardous substanceseach year (Keniry and Egan, 1998). Large universities offer a diverse array ofacademic programs, many of which are rooted in the sciences and include the use ofhazardous chemicals and substances in laboratories. Laboratory chemicals create thelargest category of university hazardous waste, although toxic substances are alsoused in art, architecture, photography and theatre departments (Smith, 1993). Inaddition, maintenance work, grounds keeping and university research activities alsoadd to the mix. Most chemical use in laboratories is tightly regulated, whilemiscellaneous use for arts-and-crafts and maintenance may lack proper handling anddisposal procedures. In general, the disposal of hazardous materials has become morestringently regulated and more expensive in recent years. This trend, combined withthe notion that hazardous waste found on college campuses may pose a significantthreat to both the natural environment and to human health, demonstrates the need forproper hazardous waste management.Waste Management EffortsThere are two clear solutions to the waste dilemma faced on university campuses.One solution involves generating less waste to begin with, while the other emphasizesdiverting waste from landfills via reuse and recycling. Reduced waste generation istypically achieved in conjunction with recycling efforts, indicative of a strongpartnership between the two waste management efforts. By reusing and recycling oldmaterials, there will be less of a need to procure new ones. Thus, the depletion of3 Calculated as 640 pounds multiplied by approximately 25,000 students.60
non-renewable resources may be lessened in accordance with the principles ofsustainability.RecyclingRecycling on college campuses has grown tremendously in recent years in an effort toprotect natural resources via the transformation of solid waste into a valuablecommodity. There are currently four “R’s” associated with campus recycling effortsto “close the loop”: Reduce, Reuse, Recycle and Buy Recycled. Recycling is oftenseen as an extremely viable option for campuses, as many goods may be sold for asmall monetary gain. In addition, recycling is a highly visible activity that isrelatively easy for people to engage in. This makes the chance of success more likelythan for other less tangible aspects of waste management. Although recycling hasserved a vital role in waste management efforts to date, there is a growing sense thatrecycling efforts may have reached their peak capacity. While recycling is anessential part of any campus waste management plan, a stronger focus on wasteprevention and reuse to begin with would greatly reduce the amount of materials to berecycled.PurchasingAlthough recycling has made great headway in recent years, it is clear that recyclingalone will not ensure sustainability. There is a great need to ‘close the loop’, bycreating a demand for recycled products. Purchasing marks the entry of most goodsand services into the campus system, making this gateway one of the best sites forenvironmental innovation. Through careful purchasing policies, universityprocurement staff can support a range of environmental practices, while also closingthe recycling loop. Due to the large amount of money spent and the large quantities ofgoods purchased, institutions of higher education can play a key role in developingthe market for environmentally friendly goods and services. Higher educationexpenditures in the U.S. exceeded $186 billion in 1992-93; college students spentanother $45 billion and college bookstore sales in the U.S. reached $6.5 billion in thesame year (Keniry, 1995). Although these figures are somewhat outdated, it is clearthat college campuses engage in large amounts of purchasing which could drive themarket for recycled products via their exercising of “purchasing power.” There aremany economical options available today for the use of recycled products, which willgreatly complement waste prevention efforts.Inherent in purchasing decisions is not only recycled-content, but also generalenvironmental concerns. For example, the transport of products from far away hassignificant environmental costs. By choosing to purchase goods from local vendors,universities can cut down on the transport of goods from far away. This will thusreduce emissions of CO 2 , a significant contributor to the greenhouse effect and global61
warming. These problems, with both local and global implications, need to beseriously considered when making purchasing decisions.Recycled-contentproducts are made frommaterials that wouldotherwise have beendiscarded. Items in thiscategory are made totallyor partially from materialdestined for disposal orrecovered from industrialactivities.Post-consumercontent refers tomaterial fromproducts that wereused by consumersor businesses andwould otherwise bediscarded as waste.Recyclable products can becollected and remanufacturedinto new products afterthey’ve been used. Theseproducts do not necessarilycontain recycled materials andonly benefit the environmentif recycled after their use.5.3. ResultsA series of questions were taken and adapted from the campus environmental auditformat in April Smith’s book, “Campus Ecology.” Interviews were held withmembers of Mary Ann Hopkins from Facilities Management, Steve Howson and JeriDuBoux from Central Stores, Ken Bowers from the UCen Bookstore, Bruce Carterfrom Environmental Health and Safety, Lara Jensen from Associated StudentsRecycling and the Santa Barbara Community Environmental Council. All dataincluded were derived from these sources, although additional library and Internetresearch was also performed regarding specific sections. The following questionswere asked to gauge <strong>UCSB</strong>’s status with respect to waste management efforts.5.3.2 Solid Waste1. How much solid waste does <strong>UCSB</strong> generate annually?In 1999, <strong>UCSB</strong> disposed of 5,536.19 tons of solid waste.2. What are the sources and types of this waste?According to a waste-composition-study administered by Facilities Management, thetypes of waste generated at <strong>UCSB</strong> may be classified in Table 5-1. However, it is notpossible to break down trash generation by source at this time.62
Table 5-1. Types of waste at <strong>UCSB</strong>MaterialCardboard ChairsOffice Pack Wooden PalletsShredded Paper Electric MotorsNewspress AC & ConcreteAluminum ComputersClear Glass WireBrown Glass AntifreezeGreen Glass BatteriesMixed Glass RadiatorsCo-mingled TiresMagazines MetalSteel Cans Green WasteMasonry Blocks Recycle Refuse*3. How much solid waste was landfilled last year and what were the associatedcosts?<strong>UCSB</strong> landfilled approximately 3,299.35 tons in 1999-00. Although no specific costsare available for landfilled waste, associated costs for total trash services provided byMarborg totaled $675,000/year, and Facilities Management considers this a goodestimate for the cost of landfilled waste.5.3.3 Hazardous Waste4. How much hazardous waste does the campus generate annually?Approximately 128 tons of hazardous waste were generated in 1999-2000. Thisconsisted of 42 tons of laboratory waste and 86 tons of asbestos abatement.5. How is the hazardous waste disposed of?Table 5-2 shows the breakdown hazardous waste disposal.6. What are the total hazardous-waste disposal costs in a single academic year?Costs associated with the disposal and transport of hazardous wastes on campusamount to approximately $106,600 / year, excluding asbestos. Most University63
MaterialTable 5-2. Hazardous waste disposalAmount Disposed(lbs)Disposal MethodFlammable Liquid 31302 Reused as fuelFlammable Liquid/Corrosive 3842 Incinerated / TreatedCorrosive 6377 IncinerationOxidizer 1386 IncinerationToxic Organic 3638 IncinerationToxic Inorganic 2731 IncinerationFlammable Solid 207 IncinerationMisc, non-RCRA 1 5053 Recycled / LandfilledBatteries 1023 Recycled / LandfilledPhoto Waste 1679 Recycled / TreatedMercury 184 RecycledGas Cylinders 231 TreatedOil 805 gallons RecycledPCB 33999 Incinerated / LandfilledAsbestos 102936 LandfilledScintillation Fluid 2 3058Recycled / Poured downdrain1 This category includes waste subject to California state regulations, but not to federalregulations.2 Scintillation fluid is used as a medium to detect radiation and is typically one of two types; one isan alcohol and the other is biodegradable.wastes average about $2.82/lb. with the more reactive or toxic chemicals reaching asmuch as $45/lb.7. Does the campus have a history of violating hazardous waste disposalregulations?The campus does not have a history of any hazardous waste violations.64
8. Has the campus initiated a hazardous waste reduction program?Yes, Senate Bill SB-14 outlines the need to reduce waste. On campus, EnvironmentalHealth and Safety makes an effort to educate people as well in the following areas:conducting microscale experiments, using less hazardous chemicals, purchasing onlywhat is needed, and participating in the campus Chemical Exchange Program.9. When was the hazardous waste reduction program implemented and whathave savings been to date?The program was established in 1989 in response to SB-14. It is not possible to obtaindata on savings generated.10. Is there a system in place for tracking and inventorying hazardous chemicalsbought and used? If so, please describe.<strong>UCSB</strong> developed a tracking system for chemicals and hazardous waste brought intothe campus system in 1989. This system has since undergone two new versions;however, it does not have capabilities for tracking waste exiting the <strong>UCSB</strong> system.5.3.4 Recycling11. Does the University currently have a recycling program?Yes, the <strong>UCSB</strong> Recycling Committee was formed by Vice Chancellor David Sheldonin 1989. This committee brought together the key players that were affected byrecycling and committed to its success on campus. The Committee was created inresponse to the need for a coordinated program or collection strategy to handle thelarge volumes of recyclable material generated on campus. The committee iscomposed of staff, faculty, and students; representatives from the offices of Budgetand Planning, Facilities Management, University Center (UCen) Dining Services,UCen Operations, Central Stores, Housing Environmental Office, A.S. RecyclingProgram, Community Environmental Council, and the County of Santa Barbara.Associated Students (AS) recycling is also involved in the collection of waste fromrecycling bins around campus, as well as outreach to faculty, staff and othercampuses.12. What is the budget for the <strong>UCSB</strong> recycling program? How is it funded?There is no official budget in place for Facilities Management and the <strong>UCSB</strong>Recycling Program; however, and some money is obtained from the Refuse Bill and65
the Grounds Department (total amount not specified). In addition, A.S. recyclingreceives ~$0.75 per student per quarter, for an annual budget of approximately$15,750.13. What types of goods are recycled on campus? How many tons of eachmaterial were recycled during the last year? What are the associated costs?See Table 5-3.Table 5-3. Quantities recycled in 1999Material Tons Recycled in Cost of Recycling1999Cardboard 250.02 FREEOffice Pack 158.75 FREEShredded Paper 2.64 FREENewspress 135.93 FREEAluminum 0.26 FREEClear Glass 4.76 FREEBrown Glass 2.07 FREEGreen Glass 3.05 FREEMixed Glass 27.67 FREECo-mingled 18.94 FREEMagazines 0.44 FREESteel Cans 10.53 FREETelephone4.15 FREEDirectoriesMasonry Blocks 8.65 FREEChairs 1.86 FREEWooden Pallets 15.28 FREEElectric Motors 7.64 FREEAC & Concrete 264.00 FREEComputers 9.67 FREEPaint 1.05 FREEWire 615 (lb.) FREEAntifreeze 220 (gallons) FREEBatteries 480 (lb.) FREERadiators 200 (lb.) FREETires 1,820 (lb.) FREE66
Material Tons Recycled in Cost of Recycling1999Metal 314.32 $125 per ton + DumpsterRentalGreen Waste 96.22 $33 per tonRecycleRefuse*896.86 $45 per ton*Recycle refuse includes both trash and recyclables that are sorted through at Marborg’sMaterial Reclamation Facility for recycling.14. How does this compare to past performance?The Campus recycled 40.4% of its solid waste in 1999, which is an increase of~2000% since 1992-93. However, the Campus has also noted a 7.4% increase inlandfilled waste from 1993-1999.5.3.5 Procurement15. What percentage of recycled paper and goods does the university currentlypurchase? What are the associated costs?Table 5-4. Central stores recycled product purchasingYear * Virgin Paper ** Recycled Paper1997-1998 59,073 11,0281998-1999 52,934 20,2971999-2000 48,305 25,739Change 97-00 - 18.23% + 133.40%Cost 1999 $3.26/ream $3.56/ream*July 1 – June 30.** All information presented in reams of paper (~500 sheets per ream).Central Stores: Central Stores purchased 25,739 reams of recycled paper in 1999-00.Costs, which includes price with tax and delivery, are slightly higher for recycledpaper vs. virgin paper.University Bookstore: The Bookstore does not have a tracking system in place forpurchases of individual items, which makes it difficult to quantify the amount ofrecycled content goods purchased by the Bookstore. The head of recycled productpurchasing estimates that recycled content products occupy approximately 10% of67
total Bookstore shelf space for paper products. In addition, the gifts department’sshelves contain ~20% recycled content cards.16. What types of recycled paper products does the campus purchase?Central Stores: Central Stores purchases recycled paper for photocopiers, writingneeds, printers, etc.The University Bookstore: The Bookstore offers a variety of recycled paper products,including notebooks, loose-leaf paper, sketchbooks, note cards, greeting cards andsome stationary. In general, the Bookstore attempts to offer at least one recycledalternative for each paper product it sells.17. Who are the University’s major suppliers?Central Stores: Office Supplies: Central Stores purchases office supplies from avariety of sources including: Boise Cascade, Corporate Express, and Office Depot.Paper: Central Stores gets the best price on paper directly through manufacturers.<strong>UCSB</strong> has been using Xerox for the last 8-10 years (#3R2047). However, alldepartments have funds at their discretion that allow them to purchase from anyoutside vendor without tracking.University Bookstore: The Bookstore is composed of three main sectors: 1) the coreacademic department (managing textbooks, supplies, computers and general books),2) the gift department (offering cards, stationary, wrapping paper, etc.) and 3) theemblematic department (which offers clothing, stickers, mugs, etc. with the <strong>UCSB</strong>insignia). The core academic department is fed by a variety of suppliers including:McGraw Hill, Prentice Hall, Thompson, Ampad, Top Flight, Esselte, Strathmore andMacintosh. The gift department is supplied by ~250 vendors including Hallmark,Sherman and the Recycled Content Paper Company. Finally, the emblematicdepartment is fed by 20-50 different suppliers.18. Do suppliers offer any products made from post-consumer recycledmaterials?Central Stores: Boise offers many recycled products for departments to buy from.3M also offers a recycled post-it-note pad, although high costs now preclude CentralStores from purchasing them. Xerox offers a 30% post consumer waste recycledcontent paper, which appears to be as high as they go right now. They recentlyupgraded from 20% about 6-8 months ago without even telling their customers aboutit.68
University Bookstore: Paper product suppliers Ampad, Top Flight, Esselte andStrathmore all offer recycled content products. In general, approximately 75-80% ofBookstore paper suppliers offer recycled content products, although suppliers forother products do not. The gift department was unaware of any suppliers offeringrecycled content products.19. What is the campus purchasing policy for furniture?<strong>UCSB</strong> is part of a UC system-wide agreement for purchasing furniture, which has acurrent contract with Steelcase. Thus, departments are supposed to buy all furniturethrough Central Stores. This agreement significantly lowers the costs of purchases. Infact, we get lower prices on furniture purchases than anyone else in the nation.However, this contract is due to expire on 12/31/00. The contract will then be put outto bid and the results of that bid will determine the next contract vendor. (The BrenSchool was able to get out of this contract by demonstrating their need to purchaseenvironmentally sound materials).5.4. Analysis of Results5.4.1 Current Progress / Trends (Solid Waste)In general, material consumption and disposal on campus has increased over the past7 years (see Figure 5-2). Solid waste to be disposed of on campus has increased by74% since 1993, although some of this may be attributed to an increase in populationand construction on campus. It is encouraging to note that although solid wastegeneration has increased in the past decade, the amount of solid waste being recycledhas also increased by ~2000%.The overall increase in waste generation from 1992-93 on may be partially attributedto increased construction on campus, large volumes of green waste resulting from ElNiño events during that period, and a 10% increase in campus population. It isunclear why 1997-98 registered a dip for both waste generation and recycling.Per capita waste generation has increased by ~57% since 1993 or an average of 8%per year (See Figure 5-3). However, there was only a 10% increase in campuspopulation during this time period. This suggests an overall trend towards increasedper capita waste generation, and points to the need for a strong source reductioncampaign at <strong>UCSB</strong>. There are three primary components of source reduction:1. Create products that use fewer material and energy resources.2. Design merchandise for longer life and greater durability.3. Reuse materials rather than discarding them.69
6000Tons5000400030002000Solid WasteGeneratedSolid WasteLandfilled100001992-931993-941994-951996-971997-981998-991999-00Solid WasteRecycledFigure 5-2. Waste generation, landfilling and recycling (92-93 to 99-00).Tons0.250.200.150.100.050.001993-94 1994-95 1995-96 1996-97 1997-98 1998-99 1999-00Figure 5-3. Waste generation per person at <strong>UCSB</strong>Although some of these components will have to be addressed at the point of productdesign and manufacturing, <strong>UCSB</strong> can strive to selectively contract with vendors thatadhere to these principles whenever possible. Consumers (such as universities) havean opportunity to drive the marketplace due to the large influence of “consumerpurchasing power.” Students, faculty and staff can choose to purchase those productsthat are manufactured in an environmentally conscious manner and to boycott thoseproducts that are not (See Purchasing Practices). Such actions would result in anincreased presence of products on campus with lesser environmental impacts.70
Legislative IssuesMany terms of regulation have been created in recent years to deal specifically withthe issue of waste reduction. In 1990, State Legislature Bill AB939 was put intoeffect. This bill required all municipalities to reduce landfill weights by 25% by 1995and by 50% by the year 2000. This deadline has come and gone, leading to theformation of State legislature bill AB675 (or AB75), which took effect on January 1,2000. This bill states that municipalities must reduce landfill weights by:• 25% by the year 2002;• 50% by the year 2004.Although Santa Barbara as a whole failed to meet regulated waste reduction levelsmandated by State Legislature Bill AB939, <strong>UCSB</strong> exceeded AB939 levels by 10.1%from 1995-1999. However, a new challenge now lies in meeting solid waste reductionlevels as mandated by State Legislature Bill AB75. Although this law is not entirelyunderstood by members of the solid waste community, it is generally believed topertain to waste reduction with respect to landfill weights from the year 2000. Thus,current landfill weights will serve as a baseline for improvement over the next fouryears. Although <strong>UCSB</strong> has made great strides in terms of reducing the amount oftrash making its way to the landfill, the amount of waste generated on campus is stillincreasing. It is clear that solid waste is still a major issue on this campus, and thatmaterial consumption needs to be cut drastically in order for sustainable efforts toproceed.5.4.2 Environmental Impacts (Solid Waste)Office Pack – A Never Ending ChallengeIn 1999, <strong>UCSB</strong> kept 161.39 tons of ‘office pack’ from the landfill. However, a 1999waste stream audit showed that office pack is the main ingredient (~67%) of ourlandfilled trash. This is a serious concern, given that the items falling under the officepack category are fully recyclable. In addition, preventing office pack from enteringthe landfill results in significant savings across many realms. The 161.39 tons of‘office pack’ that <strong>UCSB</strong> kept from the landfill in 1999 (via recycling) saved:• 1,106,00 gallons of water• 316 gallons of oil,• 9,400 pounds of air pollution,• 474 cubic yards of landfill space,• 663,600 hours of electricity (about 79 years of electricity for a twobedroom house,)71
• 2,686 trees, and• more recycled paper products were produced (Facilities Management,2001).Although we are recycling more office pack today than ever before, it is important toremember that there is still room for great improvement by further reducing the 67%of office pack making its way into the landfill each year. Office pack can be recycledback to its high quality content many times. For example, a piece of un-shreddedpaper can be recycled back to paper seven times before being recycled to a lessergrade of product such as cardboard fill (Facilities Management, 2001). In general,although we have done a good job in the recycling arena, we are simply going to haveto do better.Landfill Issues<strong>UCSB</strong> currently sends its waste to be landfilled to Tajiguas Landfill. This 80-acrelandfill, located in a confined canyon, provides landfill disposal for theunincorporated areas of the south coast of Santa Barbara County, the City of SantaBarbara, and the Cuyama Valley. The Tajiguas Landfill is located 26 miles west ofSanta Barbara, immediately north of Highway 101 along the California coast, andbegan accepting waste in the late 1960’s as a County-owned and operated venture. Itwas slated to reach its permitted capacity early in the year 2000 unless measures aretaken to extend its life and usefulness. This date has come and gone, and the Countyis still investigating an expansion of the current landfill space or a move to analternate location. The County must prepare an Environmental Impact Report (EIR)to initiate either of the proposed expansion projects or an alternative project.However, either choice raises objection from interested parties and will result insignificant fiscal costs. Both the expansion of the existing landfill or the move to analternate site will result in environmental damage. Therefore, any efforts undertakenby <strong>UCSB</strong> to reduce its amount of landfilled waste could result in a substantialenvironmental gain.5.4.3 Institutional Framework (Solid Waste)Committees & PartnershipsRecycling efforts at <strong>UCSB</strong> have increased drastically since the creation of theRecycling Committee in 1989. These efforts are primarily responsible for thedecreased landfill loads noted in recent years. There are many key personnel involvedin the actual pick-up and management of recyclable goods disposed of on campus.The A.S. Recycling staff collects materials from the exterior recycling clusters,custodians collect ‘office pack’ from the interior of the buildings, and groundskeeperscollect trash in the fourth section of the recycling clusters. The A.S. Recycling staff72
also provides educational outreach to University departments regarding purchasingpractices, by promoting the following ideals: purchase recycled paper, look for "postconsumercontent" when making a purchase, and support recycling by initiating abuy-recycled policy throughout the department. The networking of many key playerson campus has contributed to the formation of a strong recycling program.University FocusMost waste management efforts undertaken by <strong>UCSB</strong> to date have focused on the endproducts (i.e., product disposal). While the University has a strong recycling programin place, no such source reduction campaign has yet to be developed. This is a seriousomission on the part of the University given that waste prevention is generally viewedas the most effective way to control municipal solid waste. With the generation ofless waste to begin with, the University could note the following benefits: decreaseddisposal weights, reduced environmental impacts associated with manufacturing anddisposal, reduced waste disposal costs, savings in material and supply costs, savingsfrom more efficient work practices, and the use of fewer resources in dealing withwaste disposal issues. Therefore, a strong source reduction campaign would result indecreased environmental damage as a direct result of University operations.5.4.4 Financial Issues (Solid Waste)In 1994, the Associated Students (A.S.) Recycling Committee, which is a member ofthe <strong>UCSB</strong> Recycling Committee, brought momentum to campus recycling bysuccessfully presenting the spring (1994) General Elections ballot with a lock-in feeof $.75 per student per quarter. This now funds the A.S. Recycling Program. In justtwo years, the A.S. Recycling Program was able to provide the campus with a grant topurchase much needed outdoor containers for collecting glass, newspaper, aluminum,and plastic. This grant has also provided jobs and invaluable experience for manyinterested students. However, no formal budget is in place for recycling effortsundertaken by Facilities Management on campus. They receive some money from theGrounds budget, but this is a very negligible and inconsistent amount. In addition, itis unclear if monies exist to aid in the promotion of a strong source reductioncampaign on campus.Monies SavedBy increasing recycling and diverting wastes from the landfill, <strong>UCSB</strong> has avoided thecost of disposal, which is linked to the tipping fees that are paid to landfill operatorswhen waste is disposed of. Based on this assumption, the University could potentiallysave $150,000 on disposal costs by increasing the use of recyclable products oncampus. Since recycling is basically a free-of-charge service for the University, andland filling costs $45/ton, substantial gains could be realized by increased recyclingefforts.73
RecyclingFreeGreen Waste$33/tonLandfill$45/tonThe development of an on-site composting facility could also result in financialsavings for the University. Green waste currently costs $33/ton to haul off campus forcomposting. Given that <strong>UCSB</strong> disposed of 96.22 tons of green waste in 1999-2000,there exists a potential savings of ~$3200. However, the greatest financial gains forthe University would likely stem from a successful source reduction campaign,resulting in less waste to be disposed of to begin with. The completion of a successfulsource reduction campaign could allow the University to reclaim a significant shareof its current $675,000 annual waste disposal costs.BERTHAS5.4.5 Innovativeness (Solid Waste)Facilities Management and the <strong>UCSB</strong> Recycling Committee designed recycling bins,commonly known as BERTHAs, in 1995. These bins have four compartments for thedisposal of trash, paper, plastic & aluminum and newspaper. There are ~61 BERTHAbins located at various, convenient locations around campus. The contents of theserecycling bins are picked up and hauled by A.S. Recycling bicycle riders. Thisinnovative recycling bin design has been purchased by Ventura County and manyother UC schools (such as UC San Diego and UC Davis), pointing to <strong>UCSB</strong>’s role asa leader in the university recycling movement.WasteWise<strong>UCSB</strong> joined the EPA’s WasteWise program in 1999. WasteWise is a free, voluntary,EPA program that aids U.S. organizations in the elimination of costly municipal solidwaste, resulting in both economic and environmental benefits. WasteWise is aflexible program that allows partners to design their own solid waste reductionprograms tailored to their needs, focusing on reducing, reusing, and recycling solidwaste materials. The University has not reported to the WasteWise program for thisyear, although it is expected that the results of the year 2000 waste stream audit willsoon be sent out for analysis. Waste stream audits undertaken by the University areextremely beneficial, as they can aid in improved waste management efforts byidentifying the percentage of waste in campus dumpsters destined for the landfill thatcould be recycled.74
Associated Student RecyclingThe Associated Student Recycling Program has designated outreach coordinators thatare responsible for waste management education on campus. The outreachcoordinators are responsible for educating the incoming staff and students as well askeeping in touch with the more resident population at the University. These outreachcoordinators administer the Green Awards Program to promote their waste goals andto recognize departments and campus organizations that strive to improve their wasteprevention methods, increase their use of recycled content materials, and participatein recycling efforts (Andrande et al., 2000). This program began in 1997 and servesseveral purposes: it acts as a form of internal recognition, stimulates competitionamong departments and other organizations such as the copy centers that producequarterly readers for students, and results in increased awareness of wastemanagement efforts and responsibilities. The awards are administered based on theresults of a detailed questionnaire documenting department waste managementpractices, and the winners are publicized via e-mail and in campus publications, suchas the Daily Nexus newspaper. The questionnaires serve a dual role: (1) they help todetermine which departments are worthy of a Green Award, and (2) they provideinformation for focusing outreach efforts, by highlighting opportunities forimprovement. In addition, A.S. Recycling uses specially designed bicycles for thecollection of recyclable materials from BERTHAs around campus. The use of thesebikes demonstrates A.S. Recycling’s commitment to the environment, as they emitnone of the traditional pollutants associated with automobile transportation andprovide high visibility for campus education.On-Site Recycling Refuse FacilityFacilities management recently completed a design for, and received approval for, arecycling refuse facility on University grounds. This facility will cover ~40,250 ft 2and will feature six main components:• Worm composting bins (using reclaimed wood and some preconsumerfood waste).• Recycled-concrete bins (for the reuse of small pieces of concrete onsite).• Two 40-yard green waste bins (collection area of green waste to becomposted off site).• A 25-yard bin for recycled refuse (this refers to all trash collected oncampus, not in a BERTHA bin, that is sorted through for recyclablesbefore disposal).• Three 4-yard recycle containers (to house recyclable materials fromthe surrounding area for pick-up by CEC).75
• Mulch storage (for reuse on campus).The presence of this facility will make a small dent on compost production for useon-site by the campus. However, it will divert a significant amount of green wastefrom the landfill. In addition, the presence of this facility on-site serves as anopportunity to educate the campus community about composting, green waste andopportunities for the reuse of such materials on campus. Similar experiments withsuch a facility at UC Berkley resulted in the generation of very fine compost, which iscurrently sold by UC Berkley for $3 a bag. Given time to develop, this facility on the<strong>UCSB</strong> campus may yield similar outputs and produce compost good enough to beused on campus.University BookstoreThe University Bookstore does its own recycling of cardboard boxes at the UCen.The Bookstore also offers a container for the recycling of plastic shopping bags in thefront of the store. The Bookstore started to let people bring backpacks a couple ofyears ago in order to cut back on the use of plastic, petroleum-based shopping bags.This has worked better than they ever imagined, with an estimated 75% decrease inthe use of these bags and no need to reorder for quite some time. In line with thisactivity, the Bookstore also trains cashiers to always ask if customers actually need abag. This activity has also proven overwhelmingly positive, as a majority ofconsumers choose to place their purchases in their backpacks.5.4.6 Community & Education (Solid Waste)In 1986, <strong>UCSB</strong> recycling formed a relationship with the Santa Barbara CommunityEnvironmental Council (CEC). Once discarded items make their way into theappropriate recycling receptacles, they are taken to the blue recycling dumpsterslocated on campus, which are provided and serviced by the CEC. The CEC is a nonprofitenvironmental organization based in Santa Barbara that sells recyclablematerials collected from <strong>UCSB</strong>. If the proceeds generated by the sale of therecyclable materials exceed the cost of service (which is completely covered by theCEC), the surplus is returned to <strong>UCSB</strong>. However, this typically does not amount to alarge sum of money. Although <strong>UCSB</strong> does not reap the traditional benefits associatedwith the collection of recyclable materials (i.e., the funds from their sale), neither dothey bear the traditional costs associated with the transport and disposal of thesematerials. This has proven an efficient community partnership, aided by open lines ofcommunication and equal trade offs between benefits and costs.76
Facilities ManagementFacilities management donates building materials such as paint, tiles and flooring toHabitat for Humanity. Other items are also donated to the Santa Barbara CommunityEnvironmental Council and Art from Scrap, a local art studio.5.4.7 Current Progress / Trends (Hazardous Waste)Unfortunately, reliable data regarding hazardous waste purchasing is only availablefor two years, 1998 and 1999. No data were available for tracking the disposal ofhazardous waste off of the <strong>UCSB</strong> campus. The current head of the campus hazardouswaste program came onboard in 1998, and he was unable to verify computer records(many of which were quite discombobulated) prior to that date. A 16.4% increase wasnoted in the purchase of hazardous material liquids in liters from 1998 to 1999, alongwith a 61.6% increase in the purchase hazardous waste solids. In 1999, hazardouswaste disposal was broken down as shown in Figure 5-4.5.4.8 Environmental Impacts (Hazardous Waste)<strong>UCSB</strong> currently disposes of the majority of its hazardous waste via transport to statessuch as Utah and Arkansas for land filling. Hazardous waste generation and disposalhas negative environmental impacts, as does improper handling. As was mentionedpreviously, hazardous waste could potentially leak from its disposal site tocontaminate the surrounding air, water or soil. Although this could result inirreparable damage to the surrounding environment and community, no clear link to<strong>UCSB</strong> has been noted with respect to these activities.Incineration orTreatment18%Recycling20%Landfilling62%Figure 5-4. Disposal of hazardous waste77
5.4.9 Institutional Framework (Hazardous Waste)The hazardous waste facility was built in 1993, making it a relatively newstructure/program. Through a partnership with the CEC, this center has also beenused to host a household hazardous waste program. In terms of campus operations,the hazardous waste stream may be broken down as follows: 1) solvents (acetones,ethanols, etc.) used in experiments and for cleaning glassware in labs; 2) lab waste(ex. specimen preservation in the biology department); 3) other categories (ex. spraypaint cans, organic debris from mechanical engineering, pump oil, gas, and watercontaminated with ether).The hazardous waste program recently switched their pickup procedure, which hashad a large impact on the amount of hazardous waste now being disposed of. Prior toJuly of 2000, EH&S had a recharge basis for all labs, whereby labs were charged agross amount of money for material pickup ($40/gallon) regardless of the materialtype. Labs now pay indirectly for pickup service via grant money received by eachdepartment. This change may be viewed as both an aid and a hindrance to hazardouswaste management efforts on campus. On the one hand, departments now pay for thetrue costs associated with their trash disposal. Researchers now have no excuse toillegally dispose of hazardous waste or store it indefinitely to avoid financial costs.On the other hand, these researchers now have no incentive to minimize the amountof waste generated since the cost of disposal no longer hits them directly in the pocketbook. However, EH&S thinks that this new collection system is much better for thelocal environment and the safety of employees in the laboratories.Chemical Exchange Program (CEP)Chemical exchange programs on other UC campuses have proven quite successful inrecent years in terms of reusing chemicals and reducing the amount of hazardouswaste and chemicals making their way to disposal. Unfortunately, this program hasnot yet met with such success at <strong>UCSB</strong>. Currently, other UC websites provide ameans for viewing what chemicals people are offering or people can offer somethingthemselves. All UC schools were required to participate in the CEP or similarprogram because of SB-14, written in the late 1980s. This bill states that largehazardous waste generators such as universities need some waste minimizationprogram in place. Another catalyst for the development of the CEP at <strong>UCSB</strong> was therealization of the extremely high cost of hazardous waste disposal. Engaging in morereuse at the University level could significantly cut these high costs (See Table 5-5).78
Table 5-5. Hazardous waste disposal costsMaterialDisposal Costs55 gallon drum of paint $270 / drumFlammable paintMercuryOrdinary chemicals~$200 / drum~$35 / pound~$2.50 / pound5.4.10 Financial Issues (Hazardous Waste)General IssuesAs was stated in the preceding survey, disposal of hazardous waste from the <strong>UCSB</strong>campus costs ~$106,000 a year. Land filling hazardous waste is the cheapest root fordisposal; however it typically is not a popular disposal option given that mostchemicals are restricted from being landfilled. In addition, land filling is quite riskydue to the potential for future liability if the landfill leaks or if public buildings arebuilt on top of it after closure. Recycling and incineration cost roughly the same,~$2.82/lb., with the more reactive or toxic chemicals reaching as much as $45/lb.Although many costs associated with the use and disposal of hazardous waste maynot be incurred for several years, they could cause great financial stress for <strong>UCSB</strong>,and should thus be considered carefully. Reduced reliance upon and quantitative useof hazardous materials could thus greatly reduce <strong>UCSB</strong>’s future fiscal burdens.Chemical Exchange Program (CEP)The detriment of the Chemical Exchange Program (CEP) at <strong>UCSB</strong> may be primarilyattributed to a lack of funding and staffing for the CEP website. This website is a vitalcomponent of a successful program, as it allows people to easily post and viewmaterials available for exchange. Although this website is not up and running yet,EH&S has attempted to provide some of these services themselves. For example, ifEH&S notices a reusable chemical placed out for disposal and pickup, they willcontact the Chemistry department regarding reuse. However, this is only a smalleffort that likely has a small impact on waste minimization. The formal developmentof the CEP at <strong>UCSB</strong> will prove necessary for any significant improvements to occur,improvements that could significantly decrease <strong>UCSB</strong>’s annual hazardous wastedisposal costs.79
5.4.11 Innovativeness—Microscale Experiments with HazardousWasteScience labs are the main generators of hazardous waste and chemicals on campus,pointing to the need to address issues at this scale. EH&S estimates that theycurrently pick up ~30 gallons of waste from Chemistry each week, composed ofsolvents and solvents mixed with toxic materials. However, this likely represents animprovement over past performance as at least one series of the undergraduatechemistry program has been converted to microscale experiments. Microscaleexperiments were developed in the late 1970’s, and are expanding in their use aroundnational colleges and universities. These experiments are miniaturized versions ofstandard laboratory experiments, using quantities a hundred to a thousand timessmaller than before. Benefits associated with the use of microscale experimentsinclude improved laboratory air quality, overall lab safety, better, more consistentresults, and lesser time requirements. In addition, the cost of purchasing chemicalsand disposing of wastes are also greatly reduced (Smith, 1993). <strong>UCSB</strong> currently usesmicroscale experiments in Methods of Organic Lab Chemistry 6A and 6B, and inmany biochemistry labs. The use of this technique has occurred primarily in largelabs containing hundreds of students. Smaller, upper level courses do not usemicroscale techniques, given that these students need more practical lab scaleexperience and there is less material used overall. Thus, it is unclear how effective orrealistic the future expansion of these techniques would be in the Chemistrydepartment. However, there may be an opportunity to further this practice in theBiology department.5.4.12 Community & Education (Hazardous Waste)EH&S has formed a successful relationship with the CEC. The EH&S facility is openon Fridays for use by small businesses and on weekends for use by the Santa Barbaracommunity. Approximately 7000 people a year dump hazardous waste (typicallyphotowaste, paint and batteries) via the CEC household hazardous waste program.EH&S’ number one stated goal is to reuse and recycle hazardous waste and chemicalson campus whenever possible. This has been accomplished, in part, by giving awayitems in good condition through CEC’s household hazardous waste program. Thismaterials exchange program provides goods for free to the public. In addition, whenlarge quantities of a reusable product are generated on campus, EH&S may attempt tosolicit interest from businesses. For example, Facilities Management recently had alarge reserve of tar available for disposal. EH&S contacted a local contractor/company that could use the tar. This resulted in a large cost savings of ~$4,000 forthe department. This is an example of an ideal partnership for the campus.Unfortunately, however, savings of this magnitude tend to be recognized only onceevery few years. More common is the reuse and recycling of lab waste (which80
epresents the majority of hazardous waste on campus), which accounts for little costsavings.5.4.13 Current Progress / Trends (Procurement Practices)Paper & Paper Products – Central StoresPurchasing of recycled content paper by departments at <strong>UCSB</strong> has increased ahundred-fold in the past decade, from 0 reams in 1988-89 to 25,739 reams in 1999-00. However, the amount of virgin paper purchased has increased over this timeperiod as well, by ~28%. Given that the University’s population has only increased~10% over this time period, it appears that paper use per person has increased oncampus, indicating increased reliance on paper products in general. However, figuresfrom recent years paint a positive picture for environmentally conscious purchasing at<strong>UCSB</strong>. From 1997-2000, virgin paper purchases decreased by ~18% and recycledcontentpaper purchases increased by ~133%. This may be partially attributed tospecific steps taken by Central Stores and by increased quality of recycled-contentpaper and paper products in general.Paper & Paper Products – <strong>UCSB</strong> BookstoreIt’s difficult to quantify the amount of recycled content paper and paper productspurchased and sold by the Bookstore or to compare current performance with pastperformance due to a lack of available data. However, it is clear that the Bookstorehas steadily increased their recycled content product offerings. These efforts havebeen aided by the fact that increased competition in the recycled paper goods markethas led to decreased prices. However, the gift department has noted that the recycledcontent craze of past years has started to die down, resulting in fewer advertisedproducts for them to purchase. The Bookstore currently attempts to offer at least onerecycled option for each major paper product the Bookstore offers, and to bring innew recycled content products whenever possible. However, recycled productscurrently occupy only ~10% of total shelf space for paper goods, and ~20% of totalshelf space for greeting cards, which suggests that their presence, while growing, isstill quite small. This is of concern given that general supplies (which include paperproducts) account for $4.03M of annual sales, and greeting cards account for$150,000 of annual sales. Changes in these relatively large areas could significantlyimpact <strong>UCSB</strong>’s environmental impact. In addition, the Bookstore does not offerrecycled content products for anything outside of paper and paper products, whichpoints to the fact that the environmental movement in this area is only in thebeginning stages of success.81
5.4.14 Environmental Impacts (Procurement Practices)In order to accurately measure the environmental impacts associated with a product, itis useful to consider the environmental costs of material extraction, manufacturing,product use and disposal. Virgin products often require the extraction of nonrenewablematerials from the earth, significant energy and resource requirementsduring manufacturing and use, large emission of pollutants into the environment andthe permanent loss of land to land filling. In general, the production of recycledcontentproducts is less polluting, cheaper and more energy-efficient than taking newmaterial from the environment. For example, one ton of 100 percent post-consumerrecycled paper saves 20 trees, 7,000 gallons of water, and enough energy to power atypical home for six months (Green Seal, 1995). In addition, 60 pounds of airpollutants are eliminated and three cubic yards of landfill space are spared. This isjust one example in a series of many that points to the significant savings to berealized by the production and purchase of recycled-content products.5.4.15 Institutional Framework (Procurement Practices)Central StoresAlthough the increase in recycled content product offerings and sales noted byCentral Stores are encouraging, these numbers do not tell the whole story, as over 200departments engage in purchasing via an independent route. Approximately half ofthe campus has a delegation to spend $500/day per vendor (any vendor they choose),while the other half has a delegation to spend $2500/day per vendor. Those with ahigher delegation simply have more ‘purchasing’ training, and can also purchase fromany vendor they choose. Central Stores would only get involved for ‘equipment’purchases – i.e., a free standing object, with a one year life-span and a cost of $1500or more (so the supplier of a PC under $1500 is up to the department’s discretion).This creates somewhat of a problem, as it is virtually impossible to track departmentspending under this arrangement. In addition, departments simply choosing topurchase cheaper, virgin paper at another outlet may negate any good moves made onCentral Stores behalf. Thus, any sort of an environmentally conscious purchasingpolicy developed through Central Stores for departments at <strong>UCSB</strong> would likely meetwith limited success. A change in the institutional mindset is needed to makeenvironmentally conscious purchasing practices a priority regardless of the point ofsale.FurnitureCentral Stores at <strong>UCSB</strong> is just beginning to get involved with recycled-contentfurniture, in part due to the Bren School’s request for recycled furniture in their newbuilding. However, recycled-content is only one facet of sustainable furniture.Pollution prevention, waste prevention, energy conservation, regulatory compliance82
and educational outreach are also extremely important factors to consider whenchoosing a furniture vendor. The UC system currently has a contract with Steelcasefurniture for all campus furniture purchases. However, this contract is due to expireon 12/31/00. The contract will be put out to bid and the results of that bid willdetermine the next contract vendor. During a system-wide meeting in the spring of2000, buyers from the UC campuses met to discuss the elements of the bid document,and it was decided that a section would be included to address the issue of recycledcontent. Most of the large companies the UC system has dealt with in the past offeredrefurbished furniture within their line; however, this type of product was nottraditionally part of the contract due to the large discounts dictated by the vendor’scontract for traditional furniture. In addition, most of the companies that offerrecycled-content furniture are not large enough to handle the volume generated by theUniversity system. There are currently four primary companies capable of handlingthe UC system bid: Steelcase, Haworth, Herman Miller and Knoll (Westinghouse).Although each company has a different focus in terms of their environmental efforts,all are committed to environmental issues and have the ability to serve the UC systemas a practical contract vendor. Cost issues here should not be of a ‘non-environmentalvendor vs. and environmental vendor’ type, given that the UC system has decidedthat environmental concerns should be a part of the vendor’s contract. Rather, costcomparisons here should only be made between the four companies presented.University BookstoreThe Bookstore has demonstrated a pretty proactive stance in seeking to enlargecurrent recycled content product offerings. The Bookstore looks at the <strong>UCSB</strong> studentbody as a very defined and exclusive audience with whom they need to make a stronglink with their values and interests. In this spirit, the Bookstore has been quick tochange when student concern and voices have been raised. In addition, extensivedonation regimes have been established by the Bookstore throughout all of itsdepartments, which aids substantially in the campus’ connection with the surroundingcommunity. However, no policies are in place at this point to ensure for the continuedpurchasing of recycled content products in the future. Although there are a number ofdedicated personnel heading Bookstore operations, a stated environmental purchasingpolicy that could be demonstrated at all levels of the Bookstore would substantiallyaid in sustainability efforts. This is a great pitfall of the Bookstore, especially giventhat they have a very large impact on campus with ~$14M in annual sales.5.4.16 Financial Issues (Procurement Practices)Recycled paper currently costs more than virgin paper for one simple reason:economies of scale. The production of recycled paper is actually a less expensiveprocess than non-recycled papermaking (Davis and Kinsella, 1990). However,recycling mills are small compared to traditional paper mills, resulting in a higher83
comparative production cost, and thus a higher price for the consumer. Withincreased demand (and increased technologies) for recycled products, more supplierswill enter the market, resulting in lower prices as a result of increased competition.Thus, it is clear that buying recycled products also creates a demand, lowering theprice difference between recycle and non-recycled goods. This financial factor, alongwith increased environmental awareness, will undoubtedly greatly aid thesustainability movement.Recycled Products Purchasing CooperativeAlthough recycled paper is still slightly more expensive than virgin paper, newinitiatives have been developed to encourage increased use of recycled paper. TheRecycled Products Purchasing Cooperative (RPPC) is an example of one such entity.The RPPC is a collaborative non-profit effort aimed at increasing the amount ofrecycled paper used by businesses and public entities. Membership in the program isfree, and members receive recycled paper at prices that often meet or beat the price onnon-recycled or virgin fiber paper. The RPPC states that 2000 member purchases areexpected to reach over 50,000 cases, saving water, energy, and the equivalent of10,000 full grown trees (RPPC, 2001). The RPPC currently provides 30% postconsumerrecycled copy paper that is thoroughly tested and recommended by the USGovernment Printing Office. The RPCC plans to carry higher post-consumer paper inthe near future as well.Central StoresTable 5-6 displays the cost of all paper purchases at Central Stores in 1998-99. Paperhere includes envelopes, paper, tablets and padded envelopes. Spending on recycledcontentpaper has clearly increased in recent years, and as a result of the annual ‘Maysale’ (see innovation section below), recycled-content paper purchases as a percent oftotal paper purchases, have increased from ~33% in 1997-98 to ~46% in 1998-99.Table 5-6. Central Stores paper purchases for 1998-1999Year Spending – Virgin Spending - Recycled Percent Recycled1998-1999 $ 302,921 $ 263,342 46.5%University BookstoreAs was previously mentioned, increased competition in the recycled goods markethas led to decreased prices overall. Although recycled content products are still more84
expensive to purchase than traditional products, the Bookstore will often considertaking a smaller profit margin in order to make them available at a price that will sell.The retail pricing decision at the Bookstore is always tied to an awareness of theconsumer and what they will spend to acquire a product. As for items in the giftsdepartment, the Recycled Content Product line comes from Utah with a very highprice point. This is a poor seller among students, as are handmade cards andstationary, which also garner a higher price. The head of the gifts department statedthat they may be willing to take a profit cut here and offer more of these types ofgoods if given some sense of overall dedication to sustainability by the Bookstore as awhole.5.4.17 Innovativeness (Procurement Practices)Central StoresCentral Stores has held a large May sale for recycled paper the past two years. Thissale is intended to convert virgin paper users, and actually costs Central Stores moneyas they sell the recycled-content paper at a lower mark-up price. Central Storescurrently charges a smaller markup for recycled-content paper than for virgin paper,although they could charge a much higher markup for their recycled paper. Thisdecreased price (which took effect last year) was for socially conscious reasons, and itdemonstrated a measure of goodwill on the behalf of Central Stores.University BookstoreEvery February the Bookstore has a big sale where customers who trade in oldsweatshirts get $10 off a new sweatshirt. They then donate these used sweatshirts tolocal charities. Over the past couple of years, the Bookstore has faced problemsregarding the manufacturing of their emblematic line and other accessories (ex,backpacks) due to sweatshop concerns associated with their ~20-50 vendors. TheBookstore is currently working with sociology professor Rich Appelbaum to performan experiment testing if students really will prefer to buy clothes made domestically.They are trying to find two shirts of the same quality and features to sell side-by-side:one made from all-union production and one made in a sweatshop. The Bookstore hastaken the initiative here and is committed to working with the community to find anequitable solution for this problem.General Campus IssuesThere are several campus issues regarding purchasing practices that may not fallentirely within either Central Stores’ or the Bookstore’s jurisdiction. One suchexample is the purchase of photocopier machines. Photocopiers potentially have alarge impact on the environment given the large amount of electricity they use, theconsistency of their use, and the large quantities of paper passing through a85
photocopier per day. <strong>UCSB</strong> currently has 14 active vendors for copiers that cost morethan $2,500, including Konica, Sharp, Minolta, Xerox, Linear, Toshiba, Aficio andothers. Individual departments put out some general specifications tailored to theirneeds and present these to the bidders with the help of Central Stores. The libraryrecently completed a bidding process for a new fleet of copiers for a total copy centerthat will all use recycled paper. A new vendor, using Konica copiers, stepped in inSeptember to handle the transition to all recycled paper photocopiers. Each of thesemachines will cost 10 cents per copy, which is less than it cost in previous years tocopy on the two recycled paper photocopiers previously offered in the library. Theswitch to recycled-paper copiers has been hampered by concern regarding theperformance of recycled vs. virgin paper in photocopiers. However, a recent Garbagemagazine article stated that more than 80 percent of the commercial printers polledreported that recycled paper’s performance was equal to or better than that of nonrecycledpaper (Davis and Kinsella, 1990). In order to deal with these concerns headon at <strong>UCSB</strong>, A.S. Recycling is currently undertaking a study to test the performanceof recycled paper vs. virgin paper in multiple copiers around campus. Positive resultswill hopefully provide an impetus for dissuading performance fears in thecommunity.Although this report focuses primarily on paper and paper products and officesupplies, the U.S. EPA is creating a growing market for environmentally friendlygoods such as electronic products and building materials via their Energy Starprogram. <strong>UCSB</strong> could potentially reap substantial financial rewards from aconversion to these products by joining the Energy Star Purchasing Initiative.5.4.18 Community & Education (Procurement Practices)University BookstoreThe Bookstore provides bins for people to donate used clothing and goods, which arethen donated to the Unity Shoppe, the Santa Barbara Rape Crisis Center andtransition homes in the area. Paper goods that cannot be sold by the Bookstore due toa small amount of damage are donated to local schools, along with computer productsthat are donated for reuse. In addition, seasonal greeting cards that are not sold aredonated to local schools and educational organizations around Santa Barbara for artsand crafts activities. Backpacks that are returned to the bookstore are also donated,further expanding the Bookstore’s idea that ‘nothing should ever get thrown away.’5.5. Environmental Report CardSolid WasteIndicator Answer Score86
Has solid waste generated per capita decreasedover the past 7 years?Does the University currently have a wastemanagement policy in place?Has this policy been effective in decreasingwaste generation?Does the University currently have a sourcereduction program?Has this program been effective in decreasingwaste generation?Does the University currently have a reuseprogram?Has this program been effective in decreasingthe amount of waste to be disposed of?Does the University currently have a recyclingprogram?Has this program been effective in increasingrecycling rates on campus?Does the University provide public informationregarding solid waste statistics?Has the University increased the amount ofwaste being recycled in the past 7 years?Has the University decreased the amount ofwaste being landfilled in the past 7 years?Does the University have any communitypartnerships in place related to wastemanagement?No 0No 0N<strong>AN</strong>o 0N<strong>AN</strong>o 0NAYes 1Yes 1Yes 1Yes 1Yes 1Yes 1Hazardous WasteHas hazardous waste generated per capita oncampus decreased over the past 3 years? (Data87No 0
campus decreased over the past 3 years? (Datawere not available for 7 year time span)Has the campus initiated a hazardous wastereduction program?Has this program been effective in decreasingwaste generation?Does the University provide public informationregarding hazardous waste statistics?Does the University focus on means other thanland filling for hazardous waste disposal?Does the University dispose of less than 50% ofhazardous waste via land filling?Does the campus have a history of violatinghazardous waste disposal regulations?Yes 1No 0No 0Yes 1No 0No 1Purchasing PracticesDoes the University have criteria for purchasingpaper and paper products according toenvironmental standards/ requirements?Does the University have criteria for purchasingfurniture according to environmental standards/requirements?Does the University purchase any products madefrom post-consumer recycled materials?Does the University purchase at least 50% of allproducts purchased that are made from postconsumerrecycled materials?Does the University sell any products made frompost-consumer recycled materials?Does the University offer at least 50% of allproducts for sale that are made from post-No 0Yes 1Yes 1No 0Yes 1No 088
consumer recycled materials?Total: 12/23Percentage: 52%Grade: C-5.5. Recommendations for Improvement5.5.1 Solid Waste• Reduce the amount of materials used and the amount of wastegenerated on campus by developing a strong source reductioncampaign for all campus operations. This activity should take priorityover other waste management efforts, as it has been successfullydocumented that success in this arena will decrease the need for futurewaste management efforts. A successful source reduction campaigncould be developed with the assistance of the NWF Campus EcologyProgram or the EPA Waste Minimization Program.• Decrease the use of paper on campus by establishing an officeelectronic mail system and using communications networks for thedissemination of information to students, faculty and staff.• Eliminate paper forms and critically review the use of all standardforms for routine operations. Forms should be provided on the weband accepted by electronic submission.• Gradually replace all copiers and printers with those capable ofhandling recycled content paper and double sided printing.• Decrease reliance on disposable items. Make durability and ability torecycle key components of all purchasing decisions.• Develop a composting facility on campus for green waste, which takesup valuable landfill space and costs the University money to compostoff-site.• Develop a system for segregating waste generation by source, in orderto identify those areas of campus generating the largest amounts ofwaste. Based on these results, an incentive mechanism could bedeveloped to promote waste prevention measures.89
• Get involved with resource-renewal programs for replacing theresources used by the University. Plant enough trees to replace thepaper used annually on campus.• Provide a symposium on alternative paper products such as kenaf,bamboo, and straw/hemp paper. These materials produce more productper acre than do trees, alleviating the pressure to replace forest habitatworldwide with tree farms.• Print all recruitment materials on recycled letterhead.• Require that all professors accept double sided papers.• Require that the campus newspaper, the NEXUS, print all copies onrecycled newspaper.5.5.2 Hazardous Waste• Reduce the toxicity of materials entering the campus waste stream.• Eliminate or reduce the use of hazardous materials on campus. Identifyand use suitable substitutes for these materials.• Expand the use of microscale experiments to all scientific labs oncampus.• Increase funding and website development for the Chemical ExchangeProgram.• Require that all new paint purchased be water-based, as this can berecycled back into a new paint product.• Care should be taken not to purchase more of a material than isactually needed for a project.• Increase training for proper lab techniques and handling of hazardouswaste in all University labs. Provide a group of seminars on proper labhandling and disposal procedures.• Develop a system for tracking the amounts and types of hazardouswaste leaving <strong>UCSB</strong>. Identify the sources of this waste and means forcorrecting inefficiencies.• Inform departments of the costs associated with the disposal ofhazardous waste they generate and provide incentives for decreasedwaste generation.90
5.5.3 Recycling Efforts• Establish a formal and adequate budget for the recycling program. Thefact that <strong>UCSB</strong> has no formal budget in place signifies the lack of astrong commitment on the part of the University as a whole to wastemanagement efforts on campus.• Substitute non-recyclable materials on campus with recyclable ones.• Establish a closed loop system for products such as white and mixedpaper in which recyclable items are collected and recycled by amanufacturer who then sells the recycled product back to theUniversity.• Increase the use of recycled content copier paper.• Place two boxes next to every copier on campus: one for recycling andthe other for use as scrap paper that has only been printed on one side.• Print out all class handouts double-sided on recycled paper fordistribution to students whenever possible.• Require that double-sided, recycled paper be used for all class readers.• Allow students to hand in assignments on scrap paper (i.e., printed onone side), double-sided and electronically whenever feasible.• Take all newspaper, aluminum, plastic #1 and 2, and glass to nearestBERTHA bin.• Equip all buildings with easy access to and an adequate supply ofrecycling containers in order to increase the ease of recycling oncampus.• Develop a program to monitor which departments are generating themost waste and which departments have the highest levels ofcontamination.• Fine departments with high levels of contamination of recyclablematerials in their trash.• Develop a seminar regarding the amount of waste generated anddisposed of on campus, along with disposal trends during freshmanorientation. This will help to highlight recycling efforts on campus andgive new students a sense of place in the recycling program.91
5.5.4 Procurement Practices• Consumers at all levels of the University should engage in precycling,i.e., making purchasing decisions that will reduce waste such asbuying goods with less packaging (e.g., goods in bulk or concentratedform), choosing products that will last longer, and avoiding single-useor disposable products.• Require that all paper purchased by University departments contain30% post-consumer recycled content (the best available on themarket). By increasing recycled-content paper purchases, the marketwill react by decreasing prices, and <strong>UCSB</strong> can have a significant,positive impact on the environment.• Require that all emblematic paper products offered by the Universitycontain at least 30% post-consumer recycled content (i.e. notebooks,journals, planner, etc.). This would point to a clear commitment on theBookstore’s behalf to increase sustainability in their operations.• Increase purchases of recycled-content goods in general by CentralStores, the Bookstore and all campus departments.• Become a member in the Recycled Products Purchasing Cooperative(RPPC) as a means for increasing the use of recycled paper oncampus.• Require that the University purchase only Energy Star approved officesupplies and equipment.• Establish an eco-labeling purchasing initiative, in which the Universitypreferentially purchases goods from suppliers that have received anacknowledged eco-seal demonstrating their environmentalfriendliness.• Centralize all department purchases through Central Stores. Thiswould allow departments to ask for specific vendors or they could askCentral Stores to find them the best deal. In either case, this wouldprovide a mechanism for tracking purchasing practices and ensure thatminimum recycled content purchase guidelines are adhered to.• Alternatively, a monitoring system could be put in place to determinewhere departments are spending money on supplies outside of CentralStores, and perhaps guidelines could be enforced regarding the typesof products that may be purchased (ex. only buy recycled contentpaper or some certain percentage).92
• Convert department ordering through Central Stores to an all on-linesystem in order to cut down on paper waste associated with orders.• Care should be taken to purchase products that are sturdy and capableof repeated use.• Require that all University purchasing contracts adhere to asustainability policy as implemented by the campus (and includespecific environmental specs).• Purchases should be made from local vendors whenever justified by acost-benefit analysis (or whenever possible – wording choice). Thisreduces environmental pollution associated with the transport of goodsfrom far away, and by increasing the demand for such products, theprice of those goods will be effectively lowered.• Seek vendors and companies with good environmental and social trackrecords.• Undertake research by all bookstore departments to determine ifcurrent vendors offer recycled content products, as there appears to besomewhat of an overall weakness in this knowledge. For example,Bookstore gift department staff were unaware of any vendors otherthan ‘Recycled Content Cards’ offering recycled content greetingscards. However, when contacted, Hallmark stated that at least 50% ofthe cards they produce and sale for retail stores contain at least 10%PCR content.• Increase student awareness of current bookstore practices. Recycledproducts should be marketed at the front of the store continuously.• Increase the marketing of recycled content products by both CentralStores and the Bookstore.• In order to increase campus education, the Bookstore could host aweek long lunch hour special in which Environmental Studies, Brenand other professors could conduct an informational lecture series.These could include different topics each day designed to increasecampus environmental awareness. The bookstore is a good forumgiven that it is a very social and intimate gathering place during thelunch hour.93
6. AIR QUALITY <strong>AN</strong>D TR<strong>AN</strong>SPORTATION AT<strong>UCSB</strong>6.1. IntroductionAutomobiles are inextricably linked to air pollution, although the quality of the airsurrounding us is also diminished by other factors such as stationary sources ofpollution, and heating and cooling equipment in buildings. The major portion of thischapter will address transportation practices and policies on campus with theintention of describing inputs to the local air and how those inputs could be lessenedor better controlled. This is the best way to describe the campus air quality, given thatthere is currently no monitoring of pollutant concentrations on campus. In addition, itis more useful to characterize the potential sources of air pollutants on campus thanthe condition of the air so that improvements can be directly linked to campusoperations and policy. The smaller portion of this chapter will then cover theenvironmental impacts of the emissions generated by heating and cooling equipmenton campus and describe the extent to which these items are utilized on campus.6.2. BackgroundAir quality in the US has improved in the last decade in terms of concentrations andemissions of the EPA’s six criteria pollutants: carbon monoxide (CO), lead, nitrogendioxide (NO 2 ), ozone, particulate matter (PM) and sulfur dioxide (U.S. DOT, 1999).However, it is important not to lose sight of the magnitude of the air pollutionproblem that still remains. The Office of Air Quality Planning and Standards’(OAQPS) National Toxics Inventory (NTI) estimates that 75% of the 3.7 million tonsof air toxics that are released to the air annually are from mobile and area sources. Onroad vehicles alone produce 57% of total CO emissions, 31% of total NO 2 emissions,and 29% of total VOC (volatile organic compounds) emissions in the nation. TheEPA reports that approximately 100 million people in the US still reside in countiesthat did not meet the air quality standard for at least one of the criteria pollutants in1996 (U.S. EPA, 1996b). In 1998, California had the highest emissions of CO in thecountry, the second highest emissions of nitrogen oxides (NO x ) and VOCs, and thethird highest emissions of PM 10 and PM 2.5 (U.S. EPA, 1996b). Most of the state ofCalifornia including Santa Barbara County, as shown in Figure 3-1, was in nonattainmentfor federal ozone standards in 2000 as well (CARB, 2000).In 1997 the EPA revised the standard for PM and ozone because neither existingstandard was regarded as adequately protecting people from the negative healtheffects associated with the pollutants. It is estimated that these standard revisions will94
prevent approximately 15,000 premature deaths, 350,000 cases of aggravated asthma,and 1 million cases of significantly decreased lung function in children.Figure 6-1. California Air Resources Board air quality zonesAutomobiles and other vehicles are far more efficient today than at the start of theenergy crisis of 1973 due to manufacturing and technological improvements such asimproved combustion control by fuel injection engines instead of carburetors.However, since 1988, essentially all of the gain in new motor vehicle efficiency hasbeen offset by increases in weight and power within classes, and by consumer shiftsto lower economy vehicles, especially light duty trucks (SUVs, minivans, and pickuptrucks). This trend in consumer preference has serious implications for energyconsumption due to the lower fuel economy of light duty trucks. Compounding theimpact of this trend on energy consumption, vehicle miles traveled has increased over100% and real gasoline prices have decreased 17% since 1970 (U.S. DOT, 1999).On a more global level, ozone depletion and global warming have also becomeserious air quality concerns in the last twenty years. The Montreal Protocol wasadopted in September 1987 in an international effort to phase out the production of95
the most damaging ozone depleting chemicals, chlorofluorocarbons (CFCs) by 1996and HFCFs by deadlines ranging from 2003 to 2030. Similarly, the Kyoto Protocolwas internationally agreed upon in 1997 (although no binding agreements have beenratified by the US) to reduce the emissions of the major global warming gases: carbondioxide, nitrous oxide, methane, perfluorocarbons (PFCs), sulfur hexafluoride, andhydrofluorocarbons (HFCs). Under Section 608 of the CAA, EPA has establishedregulation that requires service practices to maximize recycling of ozone-depletingcompounds (both chlorofluorocarbons [CFCs] and hydrochlorofluorocarbons[HCFCs] and their blends) during the servicing and disposal of air-conditioning andrefrigeration equipment. This is achieved by adhering to the following fiveguidelines:1. Set certification requirements for recycling and recovery equipment, techniciansand reclaimers.2. Restrict the sale of refrigerant to certified technicians.3. Require persons servicing or disposing of air-conditioning and refrigerationequipment to certify to EPA that they have acquired recycling or recoveryequipment and are complying with the requirements of the rule.4. Require the repair of substantial leaks in air-conditioning and refrigerationequipment with a charge of greater than 50 pounds.5. Prohibit individuals from knowingly venting ozone depleting compounds(generally CFCs and HCFCs) used as refrigerants into the atmosphere whilemaintaining, servicing, repairing, or disposing of air-conditioning or refrigerationequipment.6.2.1 Environmental ImpactsTransportation practices, policies and infrastructure have significant environmentalimpacts on both the local and global environment in terms of air quality, resourceconsumption and land use. Heavy dependence on petroleum is the root of mostenvironmental problems related to the transportation sector with respect to bothpetroleum extraction and the emissions associated with fuel combustion byautomobiles. Compounds with ozone depleting and global warming potential used ascoolants in chillers and carbon dioxide and NO x emissions from boilers are the mainsource of harmful emissions to the air associated with institutional buildings. Anoverall assessment of the environmental impacts associated with the use ofautomobiles and HVAC systems in buildings is outlined below.Petroleum ExtractionOil drilling and pipelines directly harm the habitat and ecosystem in which they arelocated. The roads and infrastructure that accompany them also disrupt the local96
setting, attract poachers and facilitate increased traffic. In addition, spills and leaks inthe transport and nearby storage of petroleum are common, contaminating the soiland disrupting the food chain.Emissions from Automobiles and BoilersDespite major improvements in emission rates over the last two decades, automobilescontinue to be the primary source of pollutants that diminish air quality. Boilers burnnatural gas to heat water used to heat buildings and therefore emit the burnt fuel asCO 2 , small amounts of CO, NO x and water vapor.• Ground level ozone, commonly known as smog, is the most commonlocal environmental problem resulting from the combination of severalpollutants caused by the combustion of fuel. Smog is produced whennitrogen oxides and volatile organic compounds react chemically inthe presence of sunlight. The formation of smog remains alocal/regional air quality problem because it is not stable in the loweratmosphere, and therefore exists as smog for only a short period oftime without global dispersion. Smog damages infrastructure,especially rubber and some plastics, and causes serious reductions invisibility and therefore local aesthetic quality (Byrd, 1999).• Since carbon dioxide is a light and well dispersed molecule, there is adirect link between local automobile and boiler operations and theglobal build up of carbon dioxide in the atmosphere. The carbondioxide created by the combustion of petroleum in the transportationsector comprised about 26% of all greenhouse gases emitted in the US,which in turn accounts for about one quarter of all anthropogenicemissions of greenhouse gases in the world (U.S. DOT, 1999). Carbondioxide, the most abundant greenhouse gas, acts as an insulator of longwave thermal radiation. Global climate change is potentially a seriousresult of heat insulated near the earth’s surface. The effects of globalclimate change are widely variable, but revolve around the fact that allareas will experience different climate conditions than the inhabitantsof those areas are currently accustomed and adjusted. Some potentialimpacts include changes in sea level and precipitation patterns, andincreased temperatures at high altitude.• Nitrogen oxides are an important precursor to acidic deposition, whichcan lead to eutrophication of water bodies and leaching of forest soils.Eutrophication can make water bodies extremely unhealthy as a resultof toxic algal blooms, excessive phytoplankton growth, low or nodissolved oxygen in bottom waters, and losses in submerged aquaticvegetation. Forest soils exposed to acidic deposition will be deficient97
in the vital minerals necessary to support healthy vegetation andanimal ecosystems.Transportation Infrastructure• Environmental impacts associated with automobile infrastructurerelate primarily to the construction of roadways and parking lotsrequires moving extremely large amounts of landmass and disruptsand/or destroys the local habitat and ecosystem.Heating and Cooling Equipment• Environmental impacts associated with machinery and research labsrelate to the refrigerants used in chillers and the chemicals releasedthrough laboratory fume hoods. Refrigerants are ozone depleting andglobal warming compounds that escape into the atmosphere from thecooling system regularly via leaks, servicing and accidents. Ozonedepletion is harmful to humans and ecosystems because less ozoneallows more damaging UV sunlight to reach the earth’s surface.Currently, we are experiencing annual ozone depletion ofapproximately 5 percent at mid-latitudes (U.S. EPA, 2001b). Virtuallyall chemicals used in scientific laboratories are released in very lowconcentrations via fume hoods. These concentrations do not cause anair quality problem unless the mechanics of the hood are operatingsubstandard, in which case the concentrations of chemicals releasedthrough the hood could be high, causing local health hazards anddamage to landscaping.6.2.2 Economic ImpactsPoor air quality and transportation practices have significant economic impacts ontwo fronts: 1) the costs of mitigating negative effects or decreased value absentmitigation and 2) US dependence on a resource that we are not naturally endowedwith and the ways in which we choose to use that resource.Mitigation of Negative ImpactsPrivate and governmental expenditure to mitigate the negative effects of poor airquality is a good indicator of the magnitude of the problem and an expenditure thatcould be avoided if the environmental impacts of air pollution were lessened. Ifmitigation efforts are not undertaken, either a social or private loss occurs in the valueof public or private lands or health.• Nitrogen oxides contribute to pollutant haze, which impairs visibilityand can reduce residential property values and revenues from tourism.98
They also cause acid deposition that corrodes buildings andinfrastructure, in turn requiring more intensive maintenance andfrequent replacement.• Ozone is responsible for several billion dollars worth of agriculturalcrop loss and causes noticeable foliar damage in many crops andspecies of trees (U.S. EPA, 1996b).• There are adverse health affects associated with all of the mainpollutants in automobile emissions pertaining to breathing difficultiesand lung tissue damage. Health care spending can be considered asignal for the necessity for abatement of these adverse health affects.Meta-analysis of time series studies suggests that for each 50-ppbincrease in peak ozone levels, hospitalization rates increase 6-10% forasthma, pneumonia, and chronic obstructive pulmonary disease. Ozoneair pollution episodes have been associated with increases inemergency department use from 8 - 15% (New Jersey) to 43%(Mexico City) (Dickey, 1996).• Ozone depletion could lead to higher rates of skin cancer, prematureaging of the skin, cataracts and other eye damage and immune systemdepression. Therefore spending to either protect oneself from the sunor to treat skin/eye afflictions related to UV exposure is an economicimpact of ozone depletion. A United Nations Environment Programme(UNEP) study shows that a sustained 1 percent decrease instratospheric ozone will result in about a 2 percent increase in theincidence of non-melanoma skin cancer, which can be fatal. With thesuccessful phase-out of CFCs, however, EPA expects 295 millionfewer cases of this form of skin cancer over the next century (U.S.EPA, 2001b).Dependence on Foreign PetroleumThe transportation sector uses over 65% of all the petroleum consumed in thiscountry, while over half of the petroleum used in the US must now be imported.Currently, the United States gets half of its oil imports from OPEC and half of thatamount - a quarter overall - from the Persian Gulf. Worldwide, OPEC accounts for43% of world oil production and 60% of the oil traded internationally, but holds 75%of the world's proven oil reserves. The Persian Gulf alone has 30% of worldproduction, 45% of exports, and 63% of proven reserves. That OPEC holds largershares of reserves than of current production and exports means that its share ofproduction and exports is likely to increase over time (Holdren, 2000). This suggeststhat the US is vulnerable to the political instability of these nations and the supplyshocks that may accompany that instability. US 1999 foreign-oil expenditures totaling99
0.6% of GDP are by no means an upper limit: if oil prices stayed near the $34 perbarrel figure they reached in early 2000 and U.S. oil imports nonetheless did notdecline, U.S. oil-import costs would reach about 1.3% of GDP.6.2.3 Campus IssuesCollege campuses play a significant role in local, regional and global air qualityproblems due to a concentrated area of energy consumption, the operation of heatingand cooling equipment, and the generation of densely populated residential space andtraffic commuting to/from campus on a daily basis.Air QualityUniversities must be especially aware and proactive in maintaining healthy local airquality because of the large proportion of students living and working in the relativelysmall space of campus grounds. This involves investment in efficient technology forboilers, chillers and ventilation systems and constant re-evaluation of how best tomaintain the life and usefulness of this machinery without simply purchasing moreequipment.TransportationUnlike small universities where most of the students live on campus, largeuniversities usually do not house the majority of students, faculty or staff. Therefore,large universities must accommodate commuters to and from campus on a daily basisin order to make the commute convenient, manageable, and environmentally andeconomically efficient. Since 35% of the student body and almost 100% of thefaculty/staff of <strong>UCSB</strong> live beyond a two-mile radius from campus, <strong>UCSB</strong> must dealwith the large amount of people commuting to/from campus each day. This involvesproviding parking, roadways, bike paths and racks, adequate walkways into campus,and a mass transit system. In order to keep <strong>UCSB</strong>’s and the local community’senvironment healthy, the University must also take into account the effects of itscommuters and attempt to mitigate them. This involves designing transportationpolicy to manage the demand and supply of parking and single occupancy vehiclecommutes to/from campus. For example, high parking permit prices will limit thewillingness of people to drive an automobile to school and therefore influences theirbehavior. The environmental impact of automobile use also requires thatenvironmental goals be incorporated into campus planning for new parking lots andinfrastructure.6.3. ResultsA series of questions were taken and adapted from the campus environmental auditformat in April Smith’s book, “Campus Ecology.” Interviews were held with or100
information was obtained from members of Parking Services, Environmental Health& Safety, Transportation Alternatives Program, Facilities Management and the Officeof Budget & Planning. All data included were derived from these sources, althoughadditional research was obtained from the US EPA and US Department of Energyweb sites. The following questions were asked to gauge <strong>UCSB</strong>’s current status withrespect to campus air quality and transportation practices and policies.1. What are the campus’ stationary sources of pollution and does the campusmonitor these emissions? “Pollution” in this question refers to the six pollutantsfor which the EPA has set federal air quality standards.Although there are no boiler plants on campus, every large building (approximately20 to 30) has a boiler to heat the building. These boilers all burn natural gas to heatwater or steam to heat the buildings. In this area, the natural gas burned has traceamounts of sulfur in it, which when mixed with water becomes sulfuric acid, which isreleased through the flues in campus buildings. The other emissions are carbondioxide, NO x and water vapor. There are sometimes small amounts of carbonmonoxide released, but there were no visible signs of CO release (black smoke) whenthe flues were observed for this survey. Some boilers on campus are low NO xburners, which are more expensive to purchase and operate, but have a better impacton the environment. Actual concentrations of pollutants in the flue emissions are notmonitored. Most of the boilers on campus have been running for at least 20 years.2. What equipment on campus uses ozone depleting or global warmingcompounds? Are the emissions monitored?Chillers are used for cooling in almost every large building on campus. These chillersuse refrigerants (coolants) to remove heat from the circulating water that cools thebuildings. Coolant emissions are not directly monitored, but the replacement rate isapproximately equal to the leak rate. Only approximately 100 lbs. of refrigerant hashad to be added to the highly efficient chillers in the last four years. The 1200 Tonchiller in the main library is the largest chiller in Santa Barbara County. All of thehigh efficiency chillers have been on line for slightly less than a year.3. What percent of the campus is devoted to vehicular transportation such asparking spaces and roadways? Does this supply meet demand for parking?The total acreage of the <strong>UCSB</strong> campus is 815 acres, 52 of which are devoted toparking spaces. This means that 6.4% of the campus is covered with parking areas,which translates into 6,185 parking spaces available to the over 20,000 students andfaculty commuting to the campus on a daily basis. It is campus policy that101
undergraduates and graduates not employed by the University living within a twomile radius of campus are not eligible to obtain a parking permit to drive to campus,which technically eliminates 65% of the student body from demanding a parkingspace resulting in enough spaces to meet about half of the daily demand for parking. 4There is not an available statistic regarding the acreage covered by roadways on thecampus.4. What is the average daily commute to campus by automobile? How does thistranslate into carbon dioxide and nitrogen oxide emissions?There were 8,907 annual and quarterly parking permits issued for the 1999-2000school year. This may be a slight overestimate of the number of people owning aparking permit at any one point in time because there is no distinction betweenquarterly and annual permits in this count. Of the total 8,907, only a set of 4,652could be used to calculate the average daily commute to campus because not everypermit provided a local address. The number of permits issued in each location wascounted in the set of 4,652 permits and then used to estimate the total number permitsin each location. Then, the rest of the calculations (total Vehicle Miles Traveled(VMT), gas consumption and CO 2 emissions) were based on that estimate of the totalnumber of permits issued in each location.Table 6-1. Location of <strong>UCSB</strong> parking permits issuedLocation # Permits Counted Portion of SampleSanta Barbara 2,603 56%Goleta 1950 42%Carpinteria 86 1.8%Summerland 13 0.2%4 There are approximately 18,000 students, 35% of which are eligible for a permit (6,300). There isroughly the same number of faculty/staff (6,300) resulting in a total of 12,600 people commuting tocampus to park in 6,185 parking spaces.102
LocationTable 6-2. Estimated emissions from automobile transportation to <strong>UCSB</strong>Estimated# ofPermitsDrivingDistance tocampus 1TotalVMT 2Total GasConsumption 3 Total CO 2emissions 4Total NO xemissions 5SB 4,987 9.9 98,742 3,950 gal. 78,994 217 lbs.lbs.Goleta 3,740 3.9 29,172 1,167 gal. 23,338 64 lbs.lbs.Carp. 161 23.6 7,599 304 gal. 6,079 lbs. 17 lbs.Summ. 19 17.5 655 26 gal. 524 lbs. 1.5 lbs.1 One Way (miles)2 Round Trip3 Using average mileage of 25 miles/gallon4 20 lbs. of CO 2 /gallon gasoline burned5 1 gram of NO x /mile traveledIt is useful to understand these data in terms of daily averages (Table 6-3) — i.e. ifthe average person commutes 15 miles round trip to/from campus per day, the totalVMT, gallons of gas consumed, and emissions generated by the <strong>UCSB</strong> campus.Table 6-3. Average daily emissions from automobile transportationRound Trip CommuteVMT TotalGas ConsumptionCO 2 EmissionsNO x Emissions15 miles133,605 miles5,344 gallons106,884 lbs.294 lbs.5. Does the university operate any vehicles that use alternative fuels?The campus vehicle fleet consists of 295 vehicles on campus. Nine of those areelectric vehicles and ten operate on natural gas. There are also 36 campus ownedvehicles that operate off campus, none of which use alternative fuels.6. How do the parking permit prices compare with other UC campus parkingprices?The parking prices at <strong>UCSB</strong> are about average within the UC system. This canpartially be explained by the local surroundings of the campus, and therefore thesupply of parking space, as compared to more urban settings such as Los Angeles or103
San Francisco. It should be noted that there is no special carpool rate and parkingafter 5pm and on weekends is free at <strong>UCSB</strong>.Table 6-4. Parking fees on UC campusesCampus Average Monthly ParkingRate ($)<strong>UCSB</strong> 45UCI 35UCR 24UCD 38UCSC 38UCSD 50UCLA 54UCB 527. What are the other options to commute to campus and how does theUniversity promote these options?The parking and transportation department at <strong>UCSB</strong> founded a well-developedTransportation Alternatives Program (TAP) in the 1992-93 school year to providealternative commuting options for <strong>UCSB</strong> faculty, staff, and students. It strives toconserve energy, reduce campus parking demand, traffic congestion, air pollution,and global warming. Alternative transportation includes the use of vanpools, carpool,bicycles, and transit buses. Anyone who qualifies for a parking permit but does notown one can register with TAP to get six free days of parking per quarter and benefitfrom an emergency ride home program, monthly drawings for gift certificates, andspecial 3+ person carpool parking spaces.Vanpool ProgramThe vanpool program provides inexpensive transportation for long-distancecommuters, from Santa Maria, Lompoc, the Santa Ynez Valley, Carpinteria,Ventura, and Camarillo. Monthly fares are $75-$90 with an option to ride standbyfor $2.50 each way. Monthly fares fluctuate depending on van ridership andthe distance each van travels. In March 2001, there were 119 members of thevanpool program.Carpool ProgramThere is an option to purchase a carpool parking pass, by which the purchaserssplit the price of the permit between them and the passes are distributed so that104
only one car can actually display the pass at a time. If there are three or morepeople sharing a pass they able to park in carpool parking spaces which are moreideally located and readily available than the student “C” parking spaces. Theparking and transportation office also maintains a database of people interested incarpooling for the purpose of matching potential car-poolers. In March 2001,there were 185 members of the carpool program.Bicycle ProgramsThere is an intricate system of bicycle paths approximately 9 miles long withinthe <strong>UCSB</strong> campus where bicyclists almost always have the right of way topedestrians. There were several bicycle facility improvements over the 1999/2000school year including repair and resurfacing of the north UCen lot, the CampbellHall lot and the path to that lot from the north, the Bus Loop path and lot, and thepath intersections southwest and southeast of the library. There was also theexpansion of several lots, curb cuts at path intersections with roads, and signinstallations. The near future goals of the bicycling program are to expand andrepair the bike lot north of the Music building and construct two new bike circlesat Pardall at the border of Isla Vista and at the SAASB building.The TAP program provides a comments form on the web for anyone to fill outregarding bicycle paths, lots, or policy suggestions to further improve the systemto make biking to school a realistic option for as many commuters as possible.Biking is the main form of transportation to/from campus for the students that arenot eligible for parking passes because they live within a two-mile radius ofcampus. While the University maintains a well-kept and practical bike pathsystem, the reality of students biking to school is also improved because the cityof Santa Barbara maintains bike paths from the campus along the coastline. TAPestimated 14,000 bicycle commuters to <strong>UCSB</strong> in March 2001, 625 of whom wereregistered with TAP to reap the benefits of the TAP program.Bus ProgramsThere are nearly 300 buses per day connecting the <strong>UCSB</strong> campus with Goleta,Isla Vista, Santa Barbara, and Carpinteria. The MTD bus ride is free for USCBstudents who can provide proof of current registration. This is accomplished by a$7.50 a quarter lock in fee through the Associated Students, where students paythe fee with tuition fees even if they do not ride the bus. This fee is periodicallyvoted on by the students to keep it in place. An occasional two-day MTD Surveyis done on lines that serve <strong>UCSB</strong> to determine <strong>UCSB</strong> ridership. The last surveytook place during the 1999/2000 school year and showed an average of 6,000student rides per day. This number is an estimate based on that two-day survey. Inaddition, MTD tracks the actual number of students using bus passes on a105
monthly basis. The most recent one available was for March of 2000 showing thatstudents used their bus passes 67,000 times during that month.8. How is the TAP funded? How is it administratively supported?The TAP program is funded by the reserves from the fines and forfeiture budget ofparking services. According to California Codes Education Code, Section 89700-89710, these reserves may not be utilized to purchase land or to construct any parkingfacility. Instead they must be used for the development, enhancement, and operationof alternative methods of transportation of students and employees of <strong>UCSB</strong> and themitigation of the impact of off-campus student and employee parking in Universitycommunities. The amounts added to the Fines and Forfeitures were $25,000 for 1999-2000, $46,000 for 1998-1999, and $61,000 for 1997-1998 demonstrating that thereserves fluctuate considerably from year to year based on factors completely out ofthe hands of the TAP staff. The TAP staff consists of a program manager who workswithin the parking services division, and a half time vanpool coordinator.9. What are the procedures for hood vent usage for laboratories on campus?There are 450 (+/- 5%) fume hoods on campus. Only16-20 stacks are higher than 7feet (ranging from 10-40 feet), while the rest of the stacks are 7 feet high inaccordance with the minimum height standard. In the 1999-2000 school year,approximately 15-25 hoods were identified slightly above or below <strong>UCSB</strong>performance criteria and facilities adjusted those hoods accordingly. These hoods areused for exhausting any volatile substance to maintain healthy indoor air qualitywithin the lab. 5 The hoods are maintained by campus facilities management andannually inspected and certified by EH&S. The most common defect of the fumehoods results in either not enough air combined with the substance or a low velocityof air flowing through the hood. These defects are usually simple to repair. As aresult, it is common practice to repair the existing technology instead of replacing itwith more energy efficient structures.5 The fume hood simply combines the volatile substance with enough air at a high enough velocity todispel the substance out of lab through the hood to reach outside at a low enough concentration to meetstandards.106
6.4. Analysis of Results6.4.1 Current Progress and TrendsTransportationEnrollment at <strong>UCSB</strong> has not increased enough in the last decade to cause a drasticincrease in commuting rates to and from campus due to simple enrollment increases.However, the bus subsidy has decreased single occupancy vehicle travel to and fromcampus. Therefore the impact of automobile transportation generated by <strong>UCSB</strong> hasdecreased somewhat in the last decade.The trends for bike path use are more difficult to assess. The bike path infrastructurehas essentially remained consistent over the last decade and therefore the travelto/from campus using bike paths could be assumed to be close to what it was tenyears ago. Yet, the TAP has undoubtedly had some positive influence in encouragingcommuting by bicycle because of the additional perks the program provides for bikeriders such as rainy day driving passes and emergency ride home services. Thenumber of bike racks has also increased over the last decade, presumably because thedemand for bike racks was increasing. However, there are still not enough bike racksto meet demand, which could suggest that the demand for bike racks, and thereforebike ridership, is still increasing.Parking supply will increase along with the parking permit prices over the nextdecade. Since these are two opposing forces when it comes to parking supply anddemand management, it is difficult to predict whether the outcome will be more orless single occupancy vehicle commuting to/from campus. There are currently sixplans for increasing parking supply under consideration by <strong>UCSB</strong> budget andplanning. For each of the six options, there are a different number of final parkingspaces available on campus and an accompanying parking permit price. The twooptions with the lowest increase in parking spaces, and therefore the lowest increasein permit prices, would result in 7,366 parking spaces in the 2014-15 school year.That is an increase of 1,185 spaces over a fourteen-year period. The accompanyingpermit price in 2014-15 would be $87/month as opposed to the current price of$45/month. The two plans with the highest increase in parking spaces would result in9,033 parking spaces in the 2014-15 school year and a permit price of $150 or$154/month depending on the option. This is a net increase of 2,852 parking spacesover the same fourteen-year period.Heating and Cooling EquipmentThere currently are or are expected to be seven chillers that are high efficiency (.46 to.49 kW/Ton) on campus. There are a couple chillers that still use a CFC (CFC-11/R-11), but these are expected to go off line in the next six months so that no chiller on107
campus will operate with CFCs. The fact that no chillers on campus will use CFCs bythe end of 2001 is a good sign of the campus’ commitment to abiding by the “spirit”of the Montreal Protocol.The high efficiency chillers are also low-pressure chillers, meaning that if there is aleak, mostly air escapes instead of refrigerant. The rate of replacement of lowefficiency chillers by high efficiency chillers could be increased; only about 28% ofall chillers on campus are high efficiency chillers that conserve energy and limitemissions.6.4.2 Environmental ImpactsTransportationAs a large public institution, <strong>UCSB</strong> should be highly concerned with its contributionto the high ozone and particulate matter concentrations that currently plague the airquality of Santa Barbara County. Since automobile emissions are the main cause ofthe air quality problems and <strong>UCSB</strong> generates approximately 71,082 VMT per day,there is a strong connection between the air quality problems of the county and thetravel generated by campus commuters. Simply altering the methods of transportationused by University students, faculty and staff to commute to/from campus couldsignificantly reduce the current daily emissions of approximately 106,884 lbs. ofcarbon dioxide and 294 lbs. of nitrogen oxides. Taking into account all of thenegative environmental and economic impacts from automobile emissions and thescale of the emissions generated by <strong>UCSB</strong>, the environmental impact oftransportation policies and practices related to <strong>UCSB</strong> contribute largely to local,regional and global environmental degradation.Heating and Cooling EquipmentHCFCs (R-123 and R-22), the refrigerants used in all chillers on campus, arecontributors to global warming and ozone depletion; however, there is a significanttrade off between chiller efficiency and the use of these compounds. If FHCs (fluorohydrocarbons– no chlorine) are used as refrigerants, the chillers operate at a muchlower efficiency and therefore require more energy to operate, which contributes toglobal warming as well. HCFCs have much less potential for global warming andozone depletion than CFCs but are much more efficient coolers than FHCs, andtherefore the gradual (five year) switch from chillers using CFCs on campus hasinevitably lessened the impact of the campus on global warming and ozone depletion.The other source of emissions is in the operation of the purge. The purge removes airthat gets inside the chiller, and when it is full it will discharge the air, where somecoolant may escape simultaneously.108
6.4.3 Institutional FrameworkTransportationOverall, it seems that the TAP has been successful in utilizing parking demandmanagement fundamentals to lower the impact of automobile commuting to/fromcampus on the environment. This is especially impressive considering theinstitutional constraints the program faces. One person runs the entire program with ahalf time assistant to aid in vanpool coordination. The details of operations on a dailybasis limit the time and resources available to implement innovative and effectiveideas. The program makes very slow to no progress in terms of adding new prioritiesand methods to pursue those priorities. Aside from the issue of “personpower”dedicated to run the TAP, there is also the issue of support of TAP priorities fromcampus “higher ups” and within the institution itself. There is a disconnect betweenwhat the TAP attempts to accomplish in the everyday aspects of transportation policyand what the campus budget and planning office attempts to accomplish in the longrange planning of transportation policy. The two necessary aspects of transportationpolicy on campus – influencing individual behavior from the bottom up and settingcampus priorities from the top down – are not well coordinated in an effort to reallymitigate the environmental impact of commuting to/from campus every day. The factthat the number of parking spaces added and permit prices are positively correlated inthe parking expansion options demonstrates that the priority for choosing an option ispaying for the construction of the parking spaces and not squeezing the supply anddemand of parking spaces to influence commuting to/from campus. To effectivelysqueeze the demand and supply for spaces, the permit rates should be higher whenthere is a lower supply of spaces, yet this is clearly not the priority in designing theparking supply options. The fundamentals of parking supply management (i.e. keepthe additions of parking spaces to a minimum while increasing permit prices to lessenthe demand) are not fully incorporated into the priorities of <strong>UCSB</strong>’s transportationpolicy.With regards to parking permit designation, the way in which permits are distributedis not highly successful. Permits are technically only available to those living outsideof a two-mile radius of campus, yet this is not always the case and often people livingwithin the two-mile radius obtain parking permits. In addition, alternate permitdesignation patterns such as differential rates depending on location or In VehicleParking Meters (IVPM) could increase the number of commuters accommodated byeach existing parking space.Heating and Cooling EquipmentFacilities management (FM) is in charge of heating and cooling systems for allbuildings on campus. FM personnel are divided into zones depending on geographiclocation on campus. There does not seem to be any organizational problems within109
FM that impede the campus’ ability to appropriately operate all heating and coolingsystems on campus.6.4.4 Financial IssuesTransportationThe budget of the TAP program is highly variable because it does not have its ownset budget based on needs and expenses. Rather, it has a budget based on theexpenses and income of the parking services department of which TAP is a part.Thus, when the reserves of the parking services fines and forfeitures change, theresources available for TAP spending change as well. In addition, there is constantnegotiation regarding whether TAP, AS Bikes, parking services, or facilitiesmanagement pays for bike path, bike parking lot and bike rack improvements.Financial issues of maintaining and promoting TAP priorities on campus are notclearly delineated between departments. Each project is a negotiation to elicit amplefunding from a department outside of the TAP whether it be parking services orfacilities management. The bulk of the income from parking permits goes to"operations" and "reserves" (savings for more parking structure construction) forparking services, and is not directed towards TAP. This is formerly set forth in theParking Principles of <strong>UCSB</strong>’s Parking Facilities Replacement Policy which states thatfunds from parking permits should not be used for new roads, bike parking and paths,ceremonial places of arrival, pedestrian plazas etc. The Parking Principles werepromulgated by the UC-wide Faculty Welfare Committee. They were not furtheracted on or accepted, so they have no "official" status in the UC system or <strong>UCSB</strong>, butthey continue to influence how parking funds are thought appropriately spent. Thepermit fees should be treated as a Pigouvian tax, which is a tax levied on an agentcausing an environmental externality (environmental damage) as an incentive to avertor mitigate such damage. In this case, the purpose of the permit fee should be to deterindividuals from driving to campus. Therefore, a portion of the revenues from thepermit fees should fund the transportation alternatives program, as the active officeon campus in deterring individuals driving to campus, instead of funding operationsand reserves for the parking services department.The reserves from fines and forfeitures account for about 15% of parking servicesincome and about the same proportion of its expenses. Permit sales are 60% of theparking services revenues, but only 14% of the department’s expenditure. In addition,only about 4% of total expenditure for parking services is spent on the TAP programalthough TAP brings in about 3% of its revenues. Thus, the TAP is basically selfsufficient – its revenues bring in almost enough to maintain the bare minimum ofactivity, but there is no room for program growth. Since administration of the parkingpermits is carried out by parking services, enough revenue from the permits should goto parking services to fund the administration of the permits and the amount sent to110
eserves should be substantially decreased. This would leave a large portion of therevenue from permit fees as a permanent source of income for the TAP, which wouldgreatly enhance its ability to innovatively and effectively manage parking demand. Ifthe TAP were more aptly funded and therefore more successful, it could be arguedthat there would be less need for spending on future parking lots.Heating and Cooling EquipmentThe high efficiency chillers and low NO x boilers are much more expensive (upfront)than the lower efficiency alternatives. However, facilities management takes thesavings in operating costs for high efficiency equipment into account whenconsidering purchasing new equipment. It is not financial constraints that arepreventing old chillers from being replaced with more efficient ones; it is more amatter of not needing to replace the old equipment yet because it still runs relativelywell.6.4.5 InnovativenessTransportationThe policy makers at <strong>UCSB</strong> have basically done two things to innovatively influencetransportation policy: 1) create the TAP and 2) regulate eligibility for parkingpermits. Since the TAP was created, it has been faced with institutional and financialconstraints limiting its ability to continually be effective. Buses and carpooling arepretty standard methods for lessening automobile use, yet vanpools from longerdistances are less common. Bike paths, which are not in themselves innovative, are soon <strong>UCSB</strong>’s campus because of the extent to which they dominate the campus in termsof right of way over pedestrians, and the physical convenience of the bike lots, racksand paths. However, there are many campuses, such as University of Colorado atBoulder and University of Washington, that are much more innovative in theirmethods of reducing single-occupancy vehicle commuting to/from campus.The rule that students living within a two-mile radius are not eligible for a parkingpermit is innovative and technically eliminates approximately 65% of the studentbody from driving to campus. This significantly affects individual transportationpractices and the associated environmental impacts. This rule is considered aninnovative step in the right direction. Obviously, the VMT is not a big issue withpeople commuting to/from campus from within a two-mile radius; the problem is thatthose people take up valuable parking spaces, which makes parking supply tighterthan it should be.Lastly, it is a start in the right direction that a small fraction of the campus vehiclefleet operates using natural gas or electricity, yet the University should move towardsoperating the majority of campus vehicles on alternative fuels.111
Heating and Cooling EquipmentA huge chiller loop has recently been installed on campus to cool several largebuildings on campus with one central chiller and cooling tower. This is more efficientthan each building cooling itself because of economies of scale and eliminating theneed to shut down and start up the equipment periodically.6.4.6 Community/EducationTransportationThe TAP promotes community awareness through a well developed and maintainedwebsite and constant information provision via flyers etc. on campus. The SantaBarbara Air Quality Control District has occasionally funded various projects at<strong>UCSB</strong> to “green” transportation on campus. The subsidy of MTD fares by studentshas demonstrated a commitment by the students who voted to enact the lock in feeand the University who allowed it to be incorporated into the tuition to reducingsingle occupancy vehicle commutes to/from campus.6.5. Environmental Report CardQuestion Answer ScoreTransportationIs there an alternative transportation program? Yes 1Does the alternative transportation program offerspecial benefits to participants?Has participation in the alternative transportationprogram been increasing?Yes 1Yes 1Is there preferential parking for carpoolers? Yes 1Is the alternative transportation programadequately supported (administratively andfinancially)?Do any campus fleet vehicles operate onalternative fuels?No 0Yes 1112
Is a substantial portion (>50%) of the campusvehicle fleet operated on alternative fuels?Does a substantial portion (>50%) of the studentbody commute to campus by methods other thanvehicles?Is there a highly developed and well-maintainedbike path system on campus and in the localcommunity?Are student rides on local mass transportationsubsidized?Are employee rides on local mass transportationsubsidized?Does the current system of parking permitdesignation maximize use of existing spaces?Are the revenues from parking permits directedtowards encouraging alternative transportation?Is construction of new parking spaces theabsolute last resort to managing parking supplyand demand?Is less than 10% of the campus devoted toparking lots/structures?No 0Yes 1Yes 1Yes 1No 0No 0No 0No 0Yes 1Air QualityAre the laboratory fume hoods well maintainedand in accord with University EH&S policy?Has all equipment using CFC’s been (or plannedto be) replaced/ retrofitted?Yes 1Yes 1113
Is efficiency and global warming/ozonedepletion potential the priority in purchasingnew chillers?Are a substantial portion (>50%) of the chillershigh efficiency, low-pressure chillers?Are a substantial portion (>50%) of the boilerslow NO x burners?Is life cycle costing taken into account whenmaking HVAC purchasing decisions?Is the oversight department for HVAC systemswell organized?Yes 1No 0No 0Yes 1Yes 1Total: 14/22Percentage: 64%Grade: C+6.6. Recommendations6.6.1 Transportation• Direct parking permit revenues towards alternative transportationmeasures.• Restructure the funding available to the TAP so that it is less variableand more clearly itemized.• Subsidize faculty and staff MTD rides.• Increase MTD capacity for bicycles to more completely integrate thetwo travel options.• Create real time car pool matching on the TAP website.• Integrate TAP priorities into campus budget and planning priorities sothat new parking structures are not the main form of parking supplymanagement.• Squeeze parking demand by increasing parking prices.114
6.6.2 Air Quality• Continue to replace low efficiency chillers with high efficiencychillers.• Invest in chillers that do not use HCFCs.• Invest in low NO x boilers.• Invest in more energy efficient fume hood technology.• Form a partnership with the Santa Barbara Air Pollution ControlDistrict for community programs, bicycle subsidies, and additionalvanpools.• Invest in alternative fuel vehicles for campus fleet.115
7. WATER M<strong>AN</strong>AGEMENT7.1. IntroductionAs a basic element of everyday life, a reliable supply of freshwater is commonlytaken for granted. The ease at which most Americans can access a seemingly endlesswater supply stands in stark contrast to the complex reality of water policy. The U.S.is the largest user of water in the world (WRI, 2001) and California is the largest userin the U.S. (Solley et. al, 1998). The history of water management in California hasbeen a cycle of surplus and shortage. A constant struggle has been underway tomaintain the necessary resources for the ever-growing state. Currently, the CaliforniaDepartment of Water Resources (CDWR) estimates shortages in six of the ten waterregions in the State. The Central Coast Region 6 (CCR), which includes Santa BarbaraCounty, is one such region. Estimates of current and future water use suggest that theCCR is facing a water shortage 7 that is expected to exist well into the future (CDWR,1998). Water use also has impacts on the landscape, as water withdrawals used forirrigating non-native vegetation takes water away from environmental uses, such asmaintaining aquatic ecosystems. Lastly, universities generate large quantities ofwastewater that can impact the quality of surface and coastal waters. Thus, mitigationof these impacts is a crucial step in the path toward a more sustainable university.7.2. Background7.2.1 WaterWater management can be discussed at different levels of resolution. Many globallyoriented governmental and non-governmental organizations have producedcomprehensive studies of global water use, mostly in response to growing scarcity inmany areas of the globe. At the national level, the United States Geological Society(USGS) has produced an estimate of water use every five years beginning in 1950, inorder to “collect reliable and uniform information on the sources, uses, anddispositions of water in the United States” in order to “assess the effectiveness ofalternative water-management policies, regulations, and conservation activities, andto make projections of future demands” (Solley et. al, 1998). The EPA has a varietyof programs and studies directed toward water management issues (see U.S. EPA,2000). The careful management of water resources also takes place at state, regional,and local levels. The Background section of this chapter introduces the major issues6 This region includes parts of San Mateo, Santa Clara, San Benito, and Ventura Counties and all ofSanta Cruz, Santa Barbara, San Luis Obispo, and Monterey Counties.7 Shortage is defined by CDWR as the difference between water supply and demand.116
involved in water management: water supply, user demand, water quality, and waterrights.SupplyWater originates as either groundwater or surface water. An estimated 20 percent ofwater used in the United States comes from groundwater (Solley et. al, 1998) that isstored in aquifers—layers of rock and soil that contain enough space in the form ofpores and fractures to hold large amounts of water. Since recharge rates are normallyvery slow, groundwater is only renewable if the withdrawal rates are very slow aswell (to match the recharge rates). Non-renewable or “fossil water” is contained inunderground aquifers that are recharged at rates that make them available forsustainable use only at small rates of withdrawal (Ashley and Smith, 1999). InCalifornia, groundwater withdrawals account for over 30 percent of water use, withover 75 percent of the water used in the CCR obtained from groundwater sources(CDWR, 1998). Historically, the Goleta North/Central Groundwater Basin has beenin a severe state of overdraft. The Wright Judgment of 1989 mandated the GoletaWater District (GWD) to bring the basin into hydrological balance by 1998. This wasaccomplished through the importation of water through the State Water Project andother supplemental sources (Rodriguez and Lang, 2000).Surface water is contained in streams, rivers, and lakes and is useable by trapping ordiverting runoff in reservoirs, canals, and aqueduct piping systems. Surface water canbe used at more rapid rates than groundwater due to its much faster recharge rates. InCalifornia, as in the rest of the country, the majority of the water used is surfacewater. Delivery of surface water in California is complicated by the fact that themajority of the people live in the southern half of the state, while the majority of thewater falls in the northern half, “necessitating an extensive system of dams,reservoirs, pipelines, and aqueducts to service these areas” (Schamandt et al., 1988,58). It was for this purpose that the State Water Plan was initiated. The year 1933 sawthe beginnings of the State Water Plan with the passage of the Central Valley ProjectAct by the California Legislature, designed to transport water from the SacramentoRiver to the San Joaquin Valley and Los Angeles (Schamandt et al., 1988, 60). Thelast major project of the State Water Plan was the 1960 State Water Project (SWP),which, according to the Metropolitan Water District, is “the largest aqueduct systemin history.” This system transfers water from the “Sacramento and San Joaquin riversthrough a network of dams, reservoirs, six power plants, and 58 miles of aqueducts,”to satisfy the needs of agricultural and urban interests to the south (Gottlieb, 1988, 6-8). In 1991, Santa Barbara, Goleta and several other communities voted to beginimporting their allocation of State Water and the SWP Coastal Branch began deliveryin 1997 (CDWR, 1998).117
DemandOffstream use: water diverted or withdrawn from a surface- orground water source and conveyed to a place of use (Solley et. al,1998).The United States is the largest consumer of water in the world (WRI, 2001). Totalwater withdrawals (fresh and saline) in the United States in 1995 equaled 402,000Mgal/d or 1,500 gal/d per capita for offstream uses (Solley et. al, 1998). This signifiesa 2 percent decrease in use since 1990 and a 10 percent decline since 1980. Thedecrease in water use is even more significant in light of the 16 percent increase inpopulation from 1980 to 1990 (Solley et. al, 1998). As the USGS states in its 5-yearcompilation series of estimated water use, “[t]his decline signals that we are12% Domestic/Commmercial41%Agriculture8% Industrial39%ThermoelectricFigure 7-1. U.S. water use for 1995managing our water resources more effectively, that water use does respond toeconomic and regulatory factors, and that the general public has an enhancedawareness about water-resources and conservation issues” (Solley et. al, 1998).California has the highest offstream withdrawals in the nation at 45,900 Mgal/d,although the state has seen a decrease since 1980, the peak year in water usage(Solley et. al, 1998). Despite this decrease in use, California is projected to face futurewater shortages. The CDWR estimates water shortages of between 2.4 and 6.2million acre-feet by 2020 (CDWR, 1998). In the Central Coast Region 8 there is acurrent shortage of 214 thousand acre-feet (taf) during an average year and 282 taf in8 According to the California Department of Water Resource, the Central Coast Region extends fromsouthern San Mateo County in the North to the northwestern tip of Ventura County in the south andincludes all of Santa Cruz, Monterey, San Luis Obispo and Santa Barabara Counties. Also included areparts of San Mateo, Santa Clara and San Benito Counties (CDWR, 1998).118
7%Environmental18% Urban75%Agriculturea drought year (CDWR, 1998). Therefore, by CDWR estimates, water use inCalifornia must decrease or supplies must increase in order to avoid major shortagesin the future. Expected increases in state population of 15 million (a 46% increase)over the next 20 years will require more conservation.Water QualityWater quality has been a salient national issue since the 1960s. However, strongfederal regulation did not emerge until the 1972 Federal Water Pollution Act(Switzer, 1998). This Act was passed following a major public policy queuing event:the Cuyahoga River in Ohio caught fire in 1969. In 1977 groundwater pollutiongained national attention with the discovery of contamination of soil and groundwaterat Love Canal, New York although no federal groundwater regulations weresubsequently developed 9 (Rosenbaum, 1998). Currently “nearly 40 percent of thenation’s assessed waters are not meeting the standards states have set for them,”potentially resulting in significant harm to both environmental and human health.(U.S. EPA, 2000).Pricing and Property RightsFigure 7-2. South Coast water use for 1995Allocation of water property rights has historically had an enormous impact on theprice and use of water across the United States (Cahn, 1995; Haddad, 2000; Ashleyand Smith, 1999). In the agrarian societies water was seen as a community resourcewhere everyone had common access and equal right. This “system of riparian rights”was common in early American society (Cahn, 1995). As the United States developedinto an industrial society, water was increasingly viewed as private property similar toland or minerals (Cahn, 1995). In most of the West, the doctrine of prior9 Although the Safe Drinking Water Act was passed in 1974, and CERCLA in 1980-both of whichaddress groundwater contamination.119
appropriation or “first in time, first in right” is dominant. It assigns rights to the firstuser to put the water to beneficial use (Ashley and Smith, 1999; Cahn, 1995). InCalifornia there is a “hybrid doctrine” that includes both riparian and appropriativerights (Haddad, 2000; Ashley and Smith, 1999). The doctrine of prior appropriationencourages over consumption of water resources because users that have a “priorright” are “required to use the water available to them or else lose it” (Hartwick andOlewiler, 1998). This can lead to a situation where farmers are flooding their fields togrow water intensive crops such as rice or alfalfa while urban areas are struggling tomeet basic demand. Hartwick and Olewiler state:“In times of shortfall in water supply, prior appropriative rights indicate that thoseusers who acquired rights first in time may draw on the supply ahead ofsubsequent users…[e]conomic waste occurs because urban users have highervalues of the water for amounts [wasted by rural users] (Hartwick and Olewiler,1998).”7.2.2 Environmental ImpactsEnvironmental impacts relating to water use fall under the two broad categories ofwithdrawal and inputs:Withdrawals: Impacts from water withdrawals have several causes, such as watersupply development projects and the overdrafting of aquifers. Water developmentprojects such as dams and canals disrupt the natural flow of rivers, which changes thenatural characteristics of aquatic ecosystems. Studies of salmon populations ondammed rivers show major impacts on the migrating fish (Raymond, 1979;Lichatowich et al., 1999). Diverting flows from surface waters leave less available forthe maintenance of natural systems, thus changing the physical characteristics of theecosystem. Postel and Carpenter state: “Freshwater remaining in its natural channelshelps keep water quality parameters at levels safe for fish, other aquatic organisms,and people” (Postel and Carpenter, 1997). A clear example is Mono Lake in SouthernCalifornia. Beginning in 1940, the city of Los Angeles began to redirect the waterflows from four of the five streams feeding Mono Lake. As a result, “the level of thelake has dropped and increased salinity levels, which threaten the entire food chain”(Switzer, 1998). Alterations in the flow of rivers and the drainage or drowning ofwetlands affect aquatic ecosystems, with consequences for environmental quality andhuman well-being that are diverse and not yet fully understood. “During the era ofmajor water development, the US lost over 60% of its inland wetlands, polluted halfof its streams and lost or badly degraded many major fish runs” (Hawken et al.,1999). In addition, overdrafting of groundwater can lower water tables, cause landsubsidence, and reduce storage capacity (Ashley and Smith 1999). Lower water tablescan be especially harmful in coastal areas due to saltwater intrusion that can pollutethe remaining resource (Ashley and Smith, 1999).120
Inputs: We use water for waste removal and as a sink for wastes. There are two maintypes of pollution sources, point and nonpoint. Point sources include “hazardouswaste sites, landfills, wastewater-disposal sites, and leakage of refined petroleumproducts (Ashley and Smith, 1999). Nonpoint sources include agricultural, urban andmining runoff; seepage septic tanks; salt from road de-icing and acid precipitation(Ashley and Smith, 1999; Cahn, 1995; Switzer, 1998). Table 7-1 summarizes types ofpollutants, their sources and impacts. Point and nonpoint sources pollute both groundand surface water. Nonpoint pollution “is estimated to be the major cause of pollutionin 65 percent of the stream miles not meeting state standards” and the EPA hasidentified nonpoint sources as “actual or potential sources of groundwatercontamination” (Rosenbaum, 1998, 210 and 214). In addition, the U.S. releases anestimated 41,000 Mgal/d of treated wastewater per year, typically into surface waters(Rosenbaum, 1998).Table 7-1. Water pollution categoriesCategory Contaminants Source ImpactOrganismsBiologicalcontaminantsincluding bacteria,parasites and virusesSewage discharge,cattle feedlots,leaching septic tanksHuman healthSuspended andDissolved SolidsNutrientsMetals and ToxicsSoil particles,inorganic saltsPhosphates, nitrates,etc.Lead, aluminum,cadmium, mercury,arsenic, radioactiveminerals, chemicalsolvents, sulfur andnitrogen oxides,trihalomethanes, PCBsor synthetic organiccompounds,radioactive waste, andmetallic compoundsAgricultural andurban runoffAgricultural andurban runoff, septicsystemsPesticides fromagricultural andurban runoff andlandfill leaks;chemical solventsfrom industrialsources; undergroundpetroleum storagetanks; nuclear testingand medical wasteIncreasedturbidity and maycarry bacteriaEutrophicationand human healthReproductive andendocrinedisorders;nervous systemdamage andcancersPhysical Increased temperature Manufacturing and Aquatic lifepower generationSources: Ashley and Smith, 1999; Cahn, 1995; Switzer, 1998; Sampat, 2000.121
7.2.3 EconomicsThere are significant costs associated with all phases of water management. Since1960 the US has spent over $114 billion on wastewater treatment facilities and $400billion on water resources overall in the last 100 years. In 1960 California votersapproved $1.75 billion to build the State Water Project, signally the large capitalexpenditures required to develop water management systems (Rodriguez and Lang,2000). Water is used for several different economic activities: to create hydropower,for irrigation, for waste disposal, for various industrial purposes, and for varioushousehold uses. In fact, every sector of our industrial economy is directly dependenton sources of clean water and all sectors of our economy is dependent on the powergenerated by water flowing through our rivers (U.S. EPA, 2000). For example:• $197 billion worth of food and fiber comes from irrigated crops andlivestock each year;• $44 billion is spent by Americans visiting coastal areas each year;• industry uses an estimated nine trillion gallons of fresh water per year;and• commercial fishing depends on functioning wetlands and coastalwaters (U.S. EPA, 2000).However, freshwater resources are often “overexploited relative to economicefficiency” (Cohen, 1995). This may be partially attributed to the use of subsidies inthe form of pricing structures that benefit irrigated agriculture (Hartwick andOlewiler, 1998). Agricultural interests enjoy a substantial price advantage over urbanand industrial users, leading many to critics to charge that great waste occurs in someagricultural areas. In the CCR agriculture is the largest user of water and is expectedto stay that way for the foreseeable future—CDWR estimates a loss of less than onepercent of irrigated crop acreage in CCR over the next 20 years (CDWR, 1998). Thepricing structure of local purveyors gives irrigated agriculture a significantly reducedprice (Goleta Water District, 2001).Economically efficient allocation of water is hampered by what economists call amarket-failure. In theory, the market should allocate water at low cost to those whoneed it most, i.e. those who have the highest willingness to pay. For the marketsystem to function correctly the commodity must exhibit the characteristics of aprivate good: “rivalry in consumption and excludability of ownership” (Weimer andVining, 1999). Water is generally considered an open-access public good because it isnonexcludable—more than one individual may have the right to use the same waterresource (Weimer and Vining, 1999). This can lead to a “tragedy of the commons”scenario where users of a public good see it as being in their self-interest to degradethe commons (Hardin, 1968).122
Beyond the realm of economic efficiency, values and politics also play a role indetermining the distribution of water. As Hartwick and Olewiler state:“Governments are unlikely to allow the market to reach equilibrium where agroup of people cannot afford water. Markets are therefore not necessarily theideal mechanism for distributing an essential good such as water (Hartwick andOlewiler, 1998).”The government has responded by assigning property rights to some waterresources—riparian and appropriative—and they have established public control ofother water supplies as well as delivery systems. Neither response has establishedeconomic efficiency and over consumption has continued.The problem is also relevant with respect to pollution, given that water pollution is anexternality (i.e., polluters do not have to pay for damage they cause to theenvironment). Dirty water is costly in terms of lost ecosystem services and in healthtreatment costs. Water pollution may be termed an externality or situation “in whichthe actions of one individual (perhaps a person, perhaps a firm or government) affectthe welfare of another” without the full cost of those actions being realized (Stokeyand Zeckhauser, 1978). For example:“Externalities, and the market failures they generate, are a major reason forgovernment intervention in private markets. The most familiar and most widelydiscussed externalities relate to the environment. Given present pricingarrangements, we cannot expect market processes to yield air and water that aresufficiently pure (Stokey and Zeckhauser, 1978).”The cost of lost ecosystem services is unknown and difficult to measure. However,the U.S. Environmental Protection Agency has put together information on some ofthe health effects associated with water pollution:• “In 1998 about one-third of the 1,062 beaches reporting to the EPAhad at least one health advisory or closing.• In 1998 2,506 fish consumption advisories or bans were issued in areaswhere fish were too contaminated to eat.• Seventeen states reported 37 recreational water outbreaks caused bymicroorganisms in the latest (1995-1996) available data from theCenter for Disease Control.• The EPA currently estimates that at least a half-million cases of illnessannually can be attributed to microbial contamination in drinkingwater.”123
• “Over a trillion dollars…has been spent to upgrade and expandwastewater treatment facilities” (U.S. EPA, 2000).Water Use7.2.4 Campus IssuesWater use is an important issue on college and university campuses. Current campusgreening literature identifies water use and water quality as important factors indetermining the environmental impact of universities (Green Destiny Council, 1995;Thurlow, 1999a,b; Fetter and Mudd, 1993). University water use includes: irrigation,water appliances (toilets, showers, clothes and dishwashers), chillers, cooling towers,and food preparation (Fetter and Mudd, 1993). Depending upon regional or localabundance or scarcity, universities can have a large impact on water supplies.However, even in regions where water is usually abundant, shortages and droughtscan occur. Cost savings are often possible from the implementation of waterconservation strategies. In their book Green Investment, Green Return, the NationalWildlife Federation lists the cost savings and use reductions after conservationmeasures were taken at several universities. Two examples highlight the possiblebenefits of conservation programs. Columbia University noted the following savingsafter retrofitting the campus with water conserving showerheads, toilets and facets:• 25-30% reduction in water use• Annual savings of $203,000• Payback period of 1.8 yearsIn addition, Brown University noted the following savings after retrofitting residencehalls with low flow showerheads:Water Quality• 50% reduction in water use• Annual savings of $45,800• Payback period of 8 monthsCritical water quality issues on university campuses include runoff from impermeablesurfaces and the generation of wastewater (NWF, 1996). Runoff either is connected towastewater and goes to the treatment plant or is separated into its own drainagesystem that empties into nearby surface water. At coastal campuses like <strong>UCSB</strong>, themajority of the runoff empties into the Pacific Ocean. Runoff can pollute lakes, rivers,wetlands, and sensitive coastal habitats and potentially contributes to health risks forsurfers and other beach goers. Wastewater generation is another issue that is124
important for campuses to consider. The amount of wastewater generated dependsupon the amount of water that comes into campus. In ecologically sensitive areas,wastewater generation and treatment can have significant environmental impacts.Both water use and wastewater generation can be reduced through conservationmeasures like low flow showerheads, ultra low flush or composting toilets, andautomatic faucets. The amounts of water used for everyday activities are summarizedin Table 7-2.Table 7-2. Water requirements for common campus activitiesBrushing TeethShowerShave with water runningFlush a ToiletRun a dishwasherHand wash dishesWash a load of clothesSource: Switzer, 19982 gallons25-50 gallons10-15 gallons5-7 gallons12 gallons20 gallons59 gallons7.3. ResultsA series of questions were taken and adapted from the campus environmental auditformat in April Smith’s book, “Campus Ecology”. Interviews were held with JonCook and David Inouye in Facilities Management, Jim Dewey in Physical Facilities,and Ali Aghayan from Environmental Health and Safety. All data included werederived from these sources, although additional research was obtained from U.S.EPA, CDWR and Santa Barbara County resources. The following questions wereasked to gauge <strong>UCSB</strong>’s current status with respect to campus water managementpractices and policies.125
1. How much water is used by <strong>UCSB</strong> per year? Over the past 10 years?Table 7-3. Historical <strong>UCSB</strong> annual water useYear Total Water Used(gallons)1993 194,0911994 216,8271995 234,1401996 283,0111997 240,6081998 264,8321999 273,197Change +41%250,000,000200,000,000Gallons of Water150,000,000100,000,00050,000,000TotalPotableReclaimed1993 1994 1995 1996 1997 1998 1999YearFigure 7-3. Historical <strong>UCSB</strong> annual water use2. How much water is used indoors? Outdoors (irrigation)?About one third of use is for irrigation and two thirds for indoor use. Some irrigationareas are not hooked up to reclaimed water (Residence Halls, University Center, andParking areas). However, areas that use reclaimed water use it exclusively.126
Table 7-4. Potable and reclaimed water useYear Potable (Indoor andOutdoor)Reclaimed (Outdooronly)1993 177,260 16,8311994 158,745 58,0821995 170,858 63,2821996 214,183 68,8281997 192,294 48,3141998 196,020 68,8121999 204,995 68,202Change +16% +305%3. How much reclaimed water is used? What percent of outdoor use? Whatpercent of total use?Reclaimed water came online in 1993-94. Reclaimed water use as a percent ofoutdoor use is not known. See Figure 7-4 for more information.Table 7-5. Historical use of reclaimed waterYear Reclaimed % of Total Water Used(gallons)1993 16,831 8.67%1994 58,082 26.79%1995 63,282 27.03%1996 68,828 24.32%1997 48,314 20.08%1998 68,812 25.98%1999 68,202 24.96%Change +305% +16%127
30%25%Percent Reclaimed20%15%10%5%0%1993 1994 1995 1996 1997 1998 1999 TotalYear4. How much was spent on water over the past 7 years?See Figure 7-5.Figure 7-4. Reclaimed water use as a percent of total use750Dollars (thousands)7006506005505004504001994 1995 1996 1997 1998 1999 2000YearFigure 7-5. Total Water Expenditures: 1994-20005. How much wastewater is produced per year? Over the last 5 years?An estimated 400,000 gallons of wastewater is produced per day, for a total of146,000,000 gallons a year. See Figure 7-6.128
6,0005,000Gallons of Wastewater4,0003,0002,0001,00001993 1994 1995 1996 1997 1998 1999YearFigure 7-6. Total annual wastewater generation at <strong>UCSB</strong>6. Is storm water runoff measured? If so, how much?No, storm water runoff on campus is not currently measured.7. Are there any mitigation measures in place?All newly constructed drains must have oil filters. An estimated 25 percent of stormdrains have mitigation measures currently in place.8. Where does the runoff go?Campus runoff proceeds to the Pacific Ocean (I.V. Beach and Goleta Beach), GoletaSlough, Campus Lagoon, and meadows north of campus.9. What water conservation strategies are in place?The major conservation measure is the use of reclaimed water. Outdoor watering isonly performed from 7pm to 7am.10. Where does <strong>UCSB</strong> get its water?129
<strong>UCSB</strong> obtains water from the following sources: Lake Cachuma, the California StateWater Project, and local groundwater sources.11. What regulations apply to water issues on campus?There are four main government agencies that regulate either water supply or waterpollution at <strong>UCSB</strong>. Water supply (including reclaimed water) is under the auspices ofGoleta Water District. Water pollution is regulated by the U.S. EnvironmentalProtection Agency (EPA), State Water Resources Board (SWRB), and the RegionalWater Quality Control Board (RWQCB). SWRB is the lead state agency, while theRWQCB is the primary point of contact for <strong>UCSB</strong> for compliance, enforcement,permits, etc. The primary statutes of concern are the federal Clean Water Act andCalifornia Water Code.12. What is the relationship between land use and water use on campus?The amount and type of plants used for landscaping determines how much water isused for irrigation purposes. More specifically, the horticultural requirements of theplants must be met. Not only is water a physiological necessity in itself, it is also themedium that allows nutrients to pass into the plant.7.4. Analysis of Results7.4.1 Current trendsWater Use: Water use has increased steadily over the past six years (both per capitaand total use). Water use has increased 40% overall since 1993, but has decreasedfrom a high in 1996. Potable and reclaimed water uses have shown similar increases.The most troubling aspect noted with respect to water use is that potable water usehas increased even as reclaimed increased. Over the same six-year period per capitapotable water use has increased by almost ten percent and total per capita use hasincreased by 33 percent (see Figure 7-7). When reclaimed water came online in fullyin 1994, there was a noticeable decrease in potable water use. However, this decreasewas subsequently accompanied by a steady increase to a level well above prereclaimedusage levels. Expenditures for water have increased by 25% since 1994(see Figure 7-5).Runoff: An estimated 25% of storm water drains have mitigation measures in place.It is now a requirement that all new construction that includes storm drains must havemitigation measures. However, the direct impacts on water quality associated withrunoff are difficult to measure. In the past year the Shoreline Preservation Fund hasfunded water quality testing in Campus Lagoon and along the shore around <strong>UCSB</strong>.130
Gallons of Water10,0009,0008,0007,0006,0005,0004,0003,0002,0001,000TotalPotable01993 1994 1995 1996 1997 1998 1999YearFigure 7-7. Per capita water useLocal and state agencies test ocean water quality regularly. Runoff from <strong>UCSB</strong> addsto runoff from local streams and other urban runoff. It is likely that impacts haveincreased as <strong>UCSB</strong> has become more developed (see Chapters 2 and 3 of this reportfor more on campus development).Wastewater: Trends in wastewater match trends in water use; total wastewatergeneration has increased by approximately 40 percent since 1993. Wastewateroutflow from campus is generally 60 percent of total water use. In other words 40percent of water that is used on campus is consumed—evaporated, transpired,incorporated into products or plants, consumed by humans—and 60 percent leavescampus to be treated as wastewater.7.4.2 Environmental ImpactWater Use: Data from <strong>UCSB</strong> shows a trend of increasing water use over the pastseven years. This is troubling in the face of growing water scarcity in the CentralCoast Region of California. Local groundwater basin overdraft is not a problem forGWD sources because of adjudication of the North/Central Goleta GroundwaterBasin in 1989. The Wright Judgment established a safe-yield and allocations for thebasin as well as requiring “a state of hydrologic balance by 1998” (Rodriguez and131
Lang, 2000). The GWD “has achieved compliance with this order throughimportation of State Water and the development of other supplemental supplies”(Gibbs, 2001). The supplemental supplies are surplus allocations from the CachumaProject purchased from the City of Santa Barbara, which may or may not be availablein the future. Thus, the GWD will have to rely on regional and statewide surfacewater supplies adding to the already substantial burden on these sources. Severalother area groundwater basins are in a state of overdraft including Santa MariaValley, San Antonio Valley, Santa Ynez Uplands, Lompoc Uplands, and CuyamaValley. Since supplies are limited, any use takes away from other potential usesincluding environmental and reduction of groundwater overdraft in other basins.Everybody has a responsibility to conserve to help mitigate the current shortagesacross the region and state.Runoff: The impact of storm water runoff is difficult to measure. Several public andprivate agencies measure water quality in the coastal waters around <strong>UCSB</strong> and evenat the campus lagoon. The Shoreline Preservation Fund considers runoff from campusand Isla Vista to be harmful to coastal water quality north of campus. The majorimpacts for coastal water quality are considered to be streams during the rainy winter,although extensive data are not available for the comprehensive assessment ofenvironmental impacts resulting from runoff at <strong>UCSB</strong>.Wastewater: Wastewater from <strong>UCSB</strong> is treated at the Goleta Sanitary District (GSD)plant and discharged into the Pacific Ocean approximately one mile from shore at adepth of 92 feet. The GSD takes monthly water quality profiles of coastal waters ateight ocean stations and they run bacteria tests weekly in the “surf zone” from IslaVista to Moore Mesa. The Pursuant to their NPDES permit authorized by the EPAand Regional Water Quality Control Board the GSD have effluent limits for greaseand oil, suspended solids, biological oxygen demand, ammonia, turbidity, and fecalcoliform. They have had no permit violations since at least 1996.7.4.3 Institutional FrameworkThe Grounds Department, a subsection of Facilities Management, manages outdoorwater use. There is no committee or department on campus that manages overallwater use. Indoor water conservation is on a project-by-project basis. The GoletaWater District (GWD) supplies water for the University of California, Santa Barbaraand the surrounding area. Goleta Water District serves approximately 75,000 people.Water supplies include Goleta North/Central Groundwater Basin, the CachumaProject and the State Water Project. Cachuma Project built in early 1950s to deliverwater to South Coast and Santa Ynez Valley. Total water use in the GWD isestimated at 8,863 acre-feet per year, per capita use is 103 gallons per day (Rodriguezand Lang, 2000). <strong>UCSB</strong> used 627 acre-feet of water in 1999 or seven percent of totaluse in the Goleta Water District.132
7.4.4 Financial IssuesWater is purchased from the Goleta Water District, the local water purveyor, as partof the utilities budget. Water purchases from this source accounts for 10-12 percent oftotal utility expenditures. Improvements to water conservation and mitigation forpollution do not have separate budgets. Rather, most improvements at this time mustcome from new capital projects.The GWD has a tiered pricing structure that gives a significant price advantage foragricultural irrigation and a smaller advantage for recreational irrigation as presentedin Table 7-6 below. In the past ten years, <strong>UCSB</strong> has paid anywhere from two dollarsto well over five dollars per hundred cubic feet of water supplied.Type of UseTable 7-6. Water pricing according to useWater Rates (per hundred cubic feet)Urban $3.13Reclaimed Irrigation $1.74Recreation Irrigation $1.74Agricultural Irrigation $0.907.4.5 InnovationThe major water innovation noted at <strong>UCSB</strong> is the use of reclaimed water. The use ofreclaimed water has resulted in initial drops in water use and may have averted evengreater increases. Reclaimed water is treated wastewater that can “legally besubstituted for drinking water in agriculture, landscape irrigation, and flushing toilets”(GWD, 2001). The water is treated at the Goleta Sanitary District (GSD) waterreclamation plant where it undergoes tertiary treatment and is distributed to <strong>UCSB</strong> forirrigation purposes. The plant was built in 1993 in a partnership between GWD andGSD and supplies approximately 1,000 acre-feet per year for irrigation at “GoletaBeach, UC Santa Barbara, Goleta’s post office, and various parks and golf courses”(GWD, 2001). Reclaimed water meets bathing water standards but is high in nitrogencontent. It is not very dangerous but could be harmful if a person drank a lot.Reclaimed came online in 1994 at <strong>UCSB</strong>. Reclaimed areas are isolated from otherareas, human contact is minimized, and all reclaimed water lines are marked inpurple. The amount of area irrigated has remained constant since 1994, whileapproximately 1-1.5 million gallons of water gets reclaimed per day.In addition to the use of reclaimed water, <strong>UCSB</strong> has increased the use of oil filters onstorm water drains for new construction with significant amounts of paved surface.All construction in the past seven years required that storm drains have filters. <strong>UCSB</strong>133
has also attempted to use the natural filtration of the landscape. There are monitoringwells in catch basins near buildings that use chemicals that test for pollution, andthere have been retro fittings of some water appliances and buildings.Lastly, there have been retrofittings of some water appliances on campus. Forexample, in 1989, campus residence halls were retrofitted with 100 low flush toilets.7.4.6 Community/EducationGroups such as the Surfrider Foundation, Environmental Defense Center, and theEarth Action Board Heal the Ocean and Shoreline Preservation Fund are active oncampus and in the community promoting environmental issues and conductingstudies regarding water use and water quality issues.7.5. Environmental Report CardIndicator Answer ScoreIs there a University water conservation policy? No 0Has per capita water consumption decreased inthe since 1993?No 0Has absolute water use decreased? No 0Is there any water quality monitoring by theUniversity?No 0Is reclaimed water used on campus? Yes 1Does a majority of the water used for irrigationcome from reclaimed water?Has wastewater generation per capita decreasedin the past since 1993?Have there been any water conservationretrofits?Yes 1No 0Yes 1Total: 3/8Percentage: 38%Grade: D134
7.6. Recommendations7.6.1 Water Use• Monthly data should be generated and easily accessible by buildingand by use category (irrigation or indoor).• Extend the use of reclaimed water to the entire campus.• Use drip irrigation along sidewalks and buildings.• Mandate high efficiency appliances in new buildings.• Set schedule for eventual retrofitting of all “inefficient” waterappliances.• Conduct a water audit.7.6.2 Water Pollution• Calculate storm water runoff on campus.• Test water quality near storm drain outfall.• Place oil filters on all drains.135
8. L<strong>AN</strong>DSCAPE M<strong>AN</strong>AGEMENT8.1. IntroductionThe term landscape can apply to several different levels of analysis. At its broadestlevel landscape is defined as the “heterogeneous mosaic of habitat patches created byvariations in topography and soils” within a region at the kilometer scale (Ricklefs,1997, 91). More often in common usage, terms like urban landscape or naturallandscape are used to signify different types of land use (Perry, 1992). At an evensmaller scale are managed landscapes such as corporate and university campuses,parks, and personal gardens. The concept of sustainable landscaping refers primarilyto these types of managed landscapes (Perry, 1992; Corbett and Corbett, 2000).Sustainable landscaping is consistent with the principles sustainability defined in theintroduction of the paper: minimize the use of resources (such as water, fertilizers andpesticides), minimize waste (in the form of contaminated runoff); and conserve thenatural environment by using native plants that fit with the natural landscape of theregion. This section then investigates landscape management at <strong>UCSB</strong> with anassessment, analysis and recommendations.8.1.2 BackgroundA growing population in California and the development that accompanies suchgrowth are putting increasing pressure on the natural environment. According toestimates by the California Department of Finance, by 2020 California populationwill grow by almost 11 million people, an increase of almost 31 percent (CaliforniaDepartment of Finance, 1998). Over the same time period Santa Barbara County isexpected to grow by 34 percent, from412 thousand people to 553 thousandPopulation6000005000004000003000002000001000000199019931996199920022005Year20082011201420172020Figure 8-1. Population of Santa Barbara County.Source: California Department of Finance, 1998.(California Department of Finance,1998). Such population growth willlead to a more developed landscapeand make habitat preservation an evenmore important goal. As LesterBrown of the Worldwatch Institutestates: “Our numbers continue toexpand, but Earth’s natural systemsdo not” (Brown, 2000).136
Ecosystems are being threatened by habitat loss, the introduction of alien species, andthe fragmentation of natural areas caused by “bulldozing, paving, plowing, draining,dredging, trawling, dynamiting, and damming” (Baskin, 1998, 9). For example, as of1991, wetlands in the United States had been reduced from an original 221 millionacres in the lower forty-eight states, to 103.3 million acres (Switzer, 1998, 153). Atleast one in eight plant species in the world—and nearly one in three in the UnitedStates—is already threatened by extinction (Vig and Kraft, 2000, 374). By 1980, 85percent of the virgin forests throughout the U.S. had been destroyed, with lossesestimated at 95-98 percent in the lower 48 states (Sierra Club, 1998). The state ofCalifornia’s landscape is also troubling and has experienced the following habitatlosses:• 99 percent of its native grasslands• 70-90 percent of coastal sage scrub• Over 85 percent of coastal redwoods• 91 percent decline of all wetland types, a 94 percent loss of inland wetlands,and a 66-88 percent loss of Central Valley vernal pools.• 80 percent of the coastal wetlands have been converted to urban oragricultural uses and 62 percent of the salt marshes are gone (Sierra Club,1998).The new field of invasion ecology has developed to assess the impacts of theanthropocentric introduction of exotic or invasive species (Cox, 1999). According toGeorge W. Cox: “Deliberate introductions for biological control have led to theestablishment of over 237 exotic insects and several plant pathogens in the UnitedStates” (Cox, 1999). The National Parks Service calls the invasion of exotic species,“one of the most serious threats that parks face today” because “exotic species disruptcomplex ecosystems, reduce biodiversity, jeopardize endangered plants and animalsan degrade habitats” (National Parks Service, 1997). Humans have introduced exoticplant species intentionally for use as agricultural crops, forages, medicinal uses, andhorticultural uses (Cox, 1999). “Many of the same traits that make a plant a highlydesirable ornamental, such as prolific flowering and seeding or cold and heattolerance, also may make them ideal weeds. Every new plant introduction is anexperiment with an unknown outcome” (Westbrooks, 1998).8.1.3 Environmental ImpactsLandscape management can have serious environmental impacts through theintroduction of invasive species, the pollution of water bodies from pesticide andfertilizer use, the fragmentation of natural habitats, water use, and soil impaction.137
Pesticides are a leading stressor and cause water quality impairment in11% of U.S.lakes (Rosenbaum, 1998). Nonpoint pollution is estimated to be the major cause ofpollution in 65% of the stream miles not meeting state standards for their designateduse (Rosenbaum, 1998, 210). Agriculture is the largest contributor to nonpointpollution (metabolic wastes from animals, sediment, fertilizers, pesticides, anddissolved solid), accounting for and estimated one-third of pollution to the nation’sstreams (Rosenbaum, 1998, 211). Nutrients from nonpoint sources can lead toeutrophication. Many managed landscapes often use large inputs of pesticides andfertilizers. The most extreme cases are for agriculture but large areas of managedlandscapes can also have impacts. Private gardens and lawns can also add up to alarge impact. Scholars have found evidence of anthropogenic change in the globalcarbon and phosphorus cycles (Schlesinger, 1997).Landscape management commonly requires inputs of pesticides, herbicides andfertilizers. These inputs can lead to water pollution from storm water runoff,commonly referred to as non-point pollution. Runoff collects pollutants frommanaged landscapes and oil and chemicals from urban landscapes and bacteria.Nonpoint pollution is the most common source of surface water pollution. It canimpact both surface and groundwater; its sources are urban and agricultural runoff.Runoff is the largest contributor because of animal wastes, sediment, fertilizers,pesticides, dissolved solids, etc., is the major cause of the eutrophication of lakes andwetlands. An extreme example of the damage caused by runoff is the 7,000-squaremile“dead zone” off the coast of Louisiana. Agricultural fertilizers are washed downthe Mississippi River and end up in the Gulf of Mexico and cause a depletion ofoxygen in the coastal waters (Hawken et al., 1999, 149). “But the majority pollutionproblems are caused by runoff from city streets, rural areas and other diffuse sources”(U.S. EPA, 2000).8.1.4 EconomicsEcosystems play a crucial role in sustaining our health and well-being. They provideclean air for us to breathe, clean water to drink, productive soils to grow our food,sinks for our wastes, and many other services (Hawken, 1997; Daily, 1997; Prugh etal., 1999). Most importantly, all these services are rendered at almost no cost tohumans. Recent scholarship estimating the monetary value of ecosystem services iscontained in the book Nature’s Services: Societal Dependence on Natural Ecosystems(Daily, 1997). Dollar values are estimated for the services provided by “majorbiomes” (marine, freshwater, forest, and grassland ecosystems) and “overarchingservices” (climate stabilization, genetic variation, productive soils, pollinators, andnatural pest control). Costanza uses these studies and others to estimate an aggregatevalue for “17 ecosystem services for 16 biomes” at $33 trillion per year (Costanza,1997). In comparison, the “[g]lobal gross national product total is around US $18trillion per year” (Costanza, 1997). Humankind cannot reproduce most of these138
services at any price (Hawken, 1997). Some of the services the natural environmentprovides are summarized in Table 8-1.Table 8-1. Nature’s services• Production of oxygen• Maintenance of biological and genetic diversity• Purification of water and air• Storage, cycling, and global distribution of freshwater• Regulation of the chemical composition of the atmosphere• Maintenance of migration and nursery habitats for wildlife• Decomposition of organic wastes• Sequestration and detoxification of human and industrial waste• Natural pest and disease control by insects, birds, bats, and otherorganisms• Production of genetic library for food, fibers, pharmaceuticals, andmaterials• Fixation of solar energy and conversion into raw materials• Management of soil erosion and sediment control• Flood prevention and regulation of runoff• Protection against harmful cosmic radiation• Regulation of the chemical composition of the oceans• Regulation of the local and global climate• Formation of topsoil and maintenance of soil fertility• Production of grasslands, fertilizers and food• Storage and recycling of nutrientsSource: Hawken et al., 1999.8.1.5 Campus IssuesThe major landscaping issues that must be addressed at the campus level are resourceconsumption (water and fertilizers), loss of natural habitat, and water pollution fromthe runoff of fertilizers and pesticides and herbicides. These problems are addressedthrough new approaches to landscaping such as “greenscaping” (NWF, 1996) and“sustainable landscaping” (Perry, 1992). These terms have come to describe thegrowing trend of valuing both aesthetic and ecological benefits in designing andmaintaining landscapes (Corbett and Corbett, 2000). Sustainable landscaping placesan emphasis on protecting native organisms, preserving natural habitat, reducing theuse of resources and viewing the landscaped campus as part of the local or regionalecosystem (Keniry, 1995; Lerner, 1994).139
In addition, sustainable landscape can have the significant side benefit of reducinglandscaping costs while helping to protect the environment (Keniry, 1995). Reducingpesticides and fertilizers reduce pollution of surface and groundwater from stormwater runoff. Pesticides can also be harmful to humans, and beneficial organisms.Therefore, inclusion of water conservation in landscape planning can reduce watercosts and reduce demand of a scarce resource.Techniques for reducing pesticide use include “planting appropriate native specieswhich are naturally pest resistant; pulling weeds by hand; and introducing appropriatenative predators like bats, birds, reptiles, other insects, and amphibians to eliminateproblem insects” (NWF, 1996). Fertilizers can often be reduced or eliminated throughthe use of compost or mulch. Water conservation is also a crucial part of sustainablelandscaping. Water savings can be realized by using mulch to increase waterretention, using grey water and/or reclaimed water for irrigation, and the developmentof a drip irrigation system (NWF, 1996).Sustainable landscaping has become a salient issue at many universities across theUnited States (see Green Destiny Council, 1997; Keniry, 1995; Lerner, 1994). In thebook, Ecodemia: Campus Environmental Stewardship, Julian Keniry provides severalexamples of universities that are moving towards sustainable landscaping via thefollowing means: the use of native plants, integrated pest management, andcommunity outreach (Keniry, 1995). The use of native plants is a step in the rightdirection as they are adapted to natural conditions without the need of lots of inputs,and can be used to gradually replace exotic and annual vegetation with perennial andnative plants (Keniry, 1995). For example, Wesleyan Nebraska University hasrealized significant gains from the use of native plants including reducing fertilizeruse, avoiding cost of nursery bought plants, increased habitat for birds, andeducational opportunities (Keniry, 1995).Integrated Pest Management (IPM) is another strategy for decreasing the intensiveuse of pesticides on campus. This approach uses spraying only as a last resort, whenother strategies have been ineffective and pests threaten to damage economicallyvaluable vegetation (Keniry, 1995). For example, strategies include exchangingblanket spraying for spot spraying and increased use of mechanical controls (i.e.sticky traps and eliminating pests by hand), and better planning (choosing plants withnatural resistance and putting them in the proper place). Biological controls are alsooften utilized such as insect diseases and “beneficial insects” that prey on orparasitize pests (Keniry, 1995). Examples of beneficial insects are ladybugs,lacewings, assassin bugs, parasitic wasps, and praying mantises (Keniry, 1995). IPMpolicies on many campuses have enjoyed considerable success, as demonstrated bythe drastic reduction of spraying practices.Community building and education can also be an important tool in sustainablelandscaping through horticultural lectures and hands-on programs for students and140
staff. For example, Texas Southern University gives students and faculty a chance toparticipate in managing the campus landscape through an “Adopt-a-Plot” programwhere participants develop and mange their own pieces of the campus landscape(Keniry, 1995). This program encourages the use of native and other well-adaptedplants and works to develop and expand drip irrigation under sidewalks and aroundbuildings. Drip irrigation is often considered to be more specific and efficient thantypical sprinkler systems, “which often water sidewalks and buildings and everythingbut their intended sites” (Keniry, 1995). Participants in the Adopt-a-Plot program usemulching and composting instead of fertilizers. Campus generated compost is usedand participants also contribute their organic debris to the compost pile.8.2. ResultsA series of questions were taken and adapted from the campus environmental auditformat in April Smith’s book, “Campus Ecology”. Interviews were held with DavidInouye, Jon Cook and Mary Ann Hopkins from Facilities Management and RayAronson, Ali Aghayan and Wayne Ferren. All data included were derived from thesesources, although additional research was obtained from library and Internetresources. The following questions were asked to gauge <strong>UCSB</strong>’s current status withrespect to campus landscape management practices and policies.1. What plants are used for landscaping on the <strong>UCSB</strong> campus?A wide variety of vegetation is used on campus—everything from turf to palm trees.2. What are the criteria for choosing landscaping materials? Is preference givento drought tolerant or native plants?Visual impact is of primary concern, although criteria have varied over time. Thereare no formally specified criteria for landscaping at <strong>UCSB</strong>.3. What is the process by which landscaping materials are chosen for newprojects?The Design and Review Committee dictates what plants are used for landscaping ofnew construction projects. The Committee is a Chancellor’s committee staffed on arotating basis.4. What type of landscape region is <strong>UCSB</strong> in?141
<strong>UCSB</strong> is located in a Southern Coastal Edge landscape region with a Mediterraneanclimate. Mild weather is common for both winter and summer months. The majorityof rainfall in Santa Barbara (average of 18.67 inches) is during the winter months,December through March (City of Santa Barbara, 2000). Temperature varies from anaverage high of 75.4° F in August to an average low of 40.1° F in December. There is“virtual year round moisture stress on landscape plants” with annualevapotranspiration of 40 inches (Perry, 1992, 20). “Natural vegetation is dominatedby coastal strand, coastal sage scrub, and chaparral plant communities” (Perry, 1992,20). The South Central Coast region provides habitat for 1,400 native species, with140 endemic to the region (CCP, 2000).5. What connection does <strong>UCSB</strong> campus have with regional ecology? Is <strong>UCSB</strong> arural or urban campus? Are there natural areas?<strong>UCSB</strong> is primarily an urban campus and becoming more so as campus developmentincreases. <strong>UCSB</strong> manages a number of natural areas including EnvironmentallySensitive Habitat areas (as designated by the Coastal Commission). The primarynatural areas include Campus Lagoon, North, South, East, and West Bluffs, StorkeWetland and Coal Oil Point Reserve. The Museum of Systematics and Ecology(MSE) within the Department of Ecology, Evolution, and Marine Biology (EEMB)manages these projects with the exception of Coal Oil Point reserve, which ismanaged by the University of California Natural Reserve System. MSE also has aRestoration Intern Program, Restoration Ecology Seminar, a course entitled FieldWork in Restoration, and this fall it started work on the Lagoon Park EnhancementPlan in association with the new student housing project, Manzanita Village6. Have campus natural areas been maintained over the past 10 years?No, the Coast Live Oak Grove near the Recreational Center was removed to makeway for the Environmental Health and Safety building.7. Are there any programs to connect the campus with the region ecologically?Groups such as the Surfrider Foundation, Audubon Society, Environmental DefenseCenter, and the Earth Action Board are active on campus and in the communitypromoting environmental issues. Other groups such as the Conception Coast Project(CCP) and the Gaviota Coast Conservancy (GCC) are focused on protecting andrestoring ecological integrity to the region (CCP, 2000).8. What University departments are active in landscaping?142
The majority of landscaping is managed by Physical Facilities, although UniversityHousing, the University Center, and Parking also manage some landscaped areas.9. What is the pest management strategy?<strong>UCSB</strong> has an Integrated Pest Management policy (IPM). The IPM uses a “commonsense and environmentally sensitive approach to managing pests and minimizing pestdamage while causing the least possible hazard to people and environment” and doingit economically (<strong>UCSB</strong> Policy 5435).10. What pesticides are used on campus? In what quantities?Roundup is used in small quantities for spot treatment for weeds. Total quantitiesused are not known.11. Is there any treatment for storm water runoff? Where does the outflow go?Storm water runoff from campus drains directly into the Pacific Ocean, CampusLagoon, and Goleta Slough. All storm drains installed in the past 7 years have oilfilters and filters are required for all future drains. An estimated 25 percent of the totalstorm drains on campus have filters measures.12. Are there any endangered species on campus (state and federal)?Yes: Brown Pelicans, Coulter’s Saltbush, Coastal Bluff Herbs, Dune Scrub, LeastTern, Bald Eagle, Willow Flycatcher, Peregrine Falcon, White-tailed Kite, GoldenEagle and Snowy Plover. An additional 22 species are listed as Species of Concern bythe California Department of Fish and Game (Ferren and Thomas, 1995).8.3. Analysis of Results8.3.1 Current trendsCampus Development: The <strong>UCSB</strong> campus has a total area of approximately 980acres. Of that total area, 100 acres are considered environmentally sensitive habitat,160 acres are considered undeveloped and the remaining 720 acres are classified asmanaged landscape, buildings, roads and parking lots. The square footage of campushas not changed significantly since the 1960s; however, there have been trade offsbetween developed and undeveloped areas on campus.143
Pest Management: Since <strong>UCSB</strong> instituted its IPM in 1985 (which was subsequentlysigned by Chancellor Yang in 2000, Policy 5435) it has seen a decrease in the use ofpesticides. Pesticide use has been almost phased out as a means for protecting thecampus from insects as a result of this policy.Runoff: An estimated 25% of storm water drains on campus have mitigationmeasures in place. It is now a requirement that all new construction that includesstorm drains must have mitigation measures.8.3.2 Environmental ImpactHabitat Loss: Development pressure on campus is putting strains on the natural areasthat surround campus (Campus Planning, 2000b). There has been significantfragmentation of habitat, resulting in potential ecological deterioration. However, theextent of environmental impact associated with habitat loss on campus is not known.Runoff: Storm water runoff may have significant environmental impacts on thenatural areas surrounding <strong>UCSB</strong> campus. Although local and state agencies test oceanwater quality regularly, the direct impacts on water quality associated with campusrunoff are difficult to measure. The Shoreline Preservation Fund (the Fund) hasrecently contributed resources for the testing of the Campus Lagoon and the shorelinenear <strong>UCSB</strong>. The Fund studies consider runoff from campus and Isla Vista to beharmful to coastal water quality north of campus.The University of California, Santa Barbara Natural Areas Plan (the Plan),completed in 1995, discusses the negative impact of storm water runoff on CampusLagoon. According the Plan, Campus Lagoon receives water from three sources:• “General storm water run-off from ground surfaces surrounding thelagoon.• Outfall from eight storm drains. This outfall originates as perchedgroundwater discharged from building sub-drains and vault sumppumps, storm water from roof drains, lawns, parking lots and streets,and irrigation water from sprinkler systems.• Discharge from Biological Sciences Seawater System (BSSS). Thisincludes surplus seawater and wastewater. Surplus seawater comesfrom overflow from the head tanks near the Marine laboratory…Wastefiltered seawater is piped from the aquaria and holding tanks in theMarine Laboratory and the Marine Biotechnology Laboratory” (Ferrenand Thomas, 1995).These inputs are thought to have negative impacts on the water quality of the lagoon.As stated in the Plan: “Storm drain discharge was shown to carry contaminants into144
Campus Lagoon from roads, parking areas, and landscape grounds” (Ferren andThomas, 1995). Inputs of nutrients come from “bird droppings, aquaria wastewater,fertilizer-enriched runoff, and organic matter from surrounding vegetation (Ferrenand Thomas, 1995). Also stated in the Plan: “Compared with coastal seawatersamples, lagoon water was highly enriched in phosphate, nitrates, nitrites, andsilicates and generally low in salinity and oxygen” (Ferren and Thomas, 1995). Dueto these factors, Campus Lagoon has noted many of the characteristics ofeutrophication: “massive algal growths and die-off…accompanied by die-off of fishand aquatic organisms and generation of hydrogen sulfide” and a low diversity ofzoological species (Ferren and Thomas, 1995). Other impacts to the lagoon area aredegraded habitats by exotic species such as “Hottentot, Fig, Sea Fig, New ZealandSpinach, and Giant Reed” (Ferren and Thomas, 1995). Endangered species found inthis area include Coulter’s Saltbrush, Spiney Tarweed, the Brown Pelican, andCalifornia Least Tern (Ferren and Thomas, 1995). Various other birds, insects,mammals, reptiles, plants, and benthic organisms also inhabit the Campus Lagoonarea.8.3.3 Institutional FrameworkThe Long Range Development Plan (LRDP) for <strong>UCSB</strong> sets several physical planningprinciples for maintaining quality of life on campus:• “Retain the unique sense of place of the campus by preserving andenhancing its environmental quality”.• “Opportunities for interaction for all members of the campuscommunity” should be strengthened.• <strong>UCSB</strong> should “engage the surrounding communities” in campus life.• Growth on campus should not degrade the quality of life for itsoccupants (Campus Planning, 2000b).There are several campus committees on campus that are responsible for upholdingthese goals. The most important with respect to landscape management is the Designand Review Committee (DRC). It is charged with “achieving architectural andlandscape design of the highest possible quality for <strong>UCSB</strong>” (<strong>UCSB</strong>, 1998).Specifically, the DRC “reviews” landscape and environmental matters and “campusdesign guidelines and master planning” (<strong>UCSB</strong>, 1998). The DRC reports to theChancellor and Campus Planning Committee and is responsible for what plants areused for landscaping of new construction projects and the overall landscaping themeon campus. The committee membership consists of consulting architects, facultymembers, one undergraduate student, one graduate student, one staff member, and145
several members of the Committee on Capital Projects (<strong>UCSB</strong>, 1998). The committeeis required to consult at least one landscape architect but the membershiprequirements make no mention of consulting with an ecologist or any physicalscientists or members of Facilities Management. In contrast, the Subcommittee onCampus Landscape (SCL) is co-chaired by Bruce Tiffney from Geological Sciences.The subcommittee includes several representatives from Facilities Management and arepresentative from Santa Barbara Botanic Garden, Geological Sciences, Housing andResidential Services, Budget and Planning, as well as student and communityrepresentatives (Wallace et al., 1992). The SCL was charged with developing a “morecomprehensive planning approach and maintenance of our campus landscape…[and]will be responsible for reviewing landscape plans” for new campus development(Ferren and Thomas, 1995).The Campus Landscape Plan (the Plan) was commissioned by the SCL in 1992 tostudy the horticultural areas on Main Campus. This plan delineated goals to informfuture landscaping at <strong>UCSB</strong>.“The Plan is not intended to be a constraining or explicit planning document. ThePlan is intended to act as an outline for detailed landscape projects. It is to be usedas a guide for designing and implementing a more cohesive and practicallandscape” (Wallace et al., 1992).The primary focus of the Plan is on creating an aesthetically pleasing campuslandscape. However, the Plan outlines several other important goals including“reflecting the influences of the regional landscape—the man-made, urban gardenlandscape of Santa Barbara; the natural landscape of ocean, mountains, wetlands andmarine shelf” (emphasis added), and recommends maintaining the “urban, cultivatedcharacter” in the center of Main Campus (Wallace et al., 1992). The Plan designatesthe center of campus as a “garden zone” where the use of non-native, resourceintensive plants is possible because of “a higher level of irrigation and maintenanceallocated to this zone,” though drought resistant and low-maintenance plants areencouraged (Wallace et al., 1992.) The Plan also encourages the development of“theme areas” where plant selection should represent a “regional, climatic, taxonomicor aesthetic theme” (Wallace et al., 1992). In addition, the Plan suggests using plantsfrom Australian, Africa, California, South America, and European Mediterraneanclimate regions.There are two sections of the Plan that provide examples of what should be the focusof a sustainable landscaping policy: Resource Conservation and Environment andEducational use. The Plan states: “The campus landscape should be responsive to theregional natural landscape and conserve scarce natural resources” and “shouldfunction as an arboretum, displaying a diverse collection of plant species as an146
educational resource for the campus and community” (Wallace et al., 1992). The Plansuggests the following goals:• “Restore natural areas, primarily on the perimeter of campusdevelopment.• Preserve and enhance wildlife habitats.• Consider micro-habitats when selecting plants.• Use water-conserving plants.• Consider long-term maintenance requirements• Collections of species native to California and other Mediterraneanclimates…should be developed for reference and teaching. Collectionsmay illustrate natural plant associations, regionally rare andendangered taxa, taxonomic relationships and landscape themes”(Wallace et al., 1992).The Campus Landscape Plan shows encouraging signs of a willingness to includesustainability in landscape management. However, many of the goals stated in thePlan are not consistent with the principles of sustainability, including the use of moreresource intensive plants at the campus core and the use of non-native vegetationthroughout the main campus. In addition, the Plan is not a detailed document anddoes not provide criteria for plant selection or a coherent campus-wide unifyinglandscape theme. Sustainable landscaping could provide the criteria and guide thefuture of landscape management at <strong>UCSB</strong>.8.3.4 Financial IssuesFacilities Management is in charge of most maintaining the campus landscapeincluding pest management. Areas not managed by Facilities Management aremanaged by either the Parking Department or Housing and Residential Services.Most improvements at this time must come from new capital projects or FacilitiesManagement maintenance budget. At this time sustainable landscaping is not apriority on campus. It is possible that more sustainable practices could result inconsiderable cost savings. For example, native plants generally require smaller inputsof labor, irrigation water, fertilizers and pesticides. The Integrated Pest ManagementPolicy is thought to have reduced pesticide expenses since its inception in 1985 (aswell as reducing environmental and human health hazards). After an initial expenseof approximately $150,000 the current yearly expense for pest management is near$22,000.147
8.3.5 InnovationThe Integrated Pest Management Policy (Policy 5432) is the first signed by achancellor of a University of California campus. The policy has been in effect since1985 and was signed by Chancellor Yang in 2000. The IPM policy is described as:[A]n effective common sense and environmentally sensitive approach tomanaging pests and minimizing pest damage. The approach causes the leastpossible hazard to people and the environment and employs the most economicalmeans. This ecosystem (the relations between organisms and their environment)based strategy employs a combination of tactics including, but not limited to,sanitation, monitoring, habitat modification, biological control, and modificationof cultural practices…[p]est control materials are selected and applied in amanner that minimizes risks to human health, other creatures, and theenvironment (Policy 5435).Human health concerns were a major catalyst for instituting the IPM policy, as thispolicy has significantly decreased the use of chemicals on campus. The IPM strategyemployed at <strong>UCSB</strong> assumes that the human occupants of the campus must live withsome amount of pests and focuses on controlling, rather than eradicating, such pests.The <strong>UCSB</strong> campus is surrounded by heavy nature areas that provide naturalharborage for many types of wildlife including raccoons, skunks, mosquitoes, andmany other types of rodents and insects. In this environment eradication of pests isimpossible.Pest problems are prioritized in terms of public health risk and threat to campusstructures. Different places on campus need different levels of control (for example itis less important to strictly control insects in a classroom than in the Student HealthCenter). A large part of IPM is based on prevention and a focus on the structure andsanitation of buildings and their immediate surroundings. For example, it isimperative to eliminate insect “runways” into buildings. For this reason, all foliage iskept a minimum of three feet from buildings. The key to sanitation is to make thehabitat inside buildings less inviting than the habitat outside. Natural ingredients, oilbased soap, and a large amount of man-hours are the main tactics used for dealingwith unwanted insects and animals. Pesticides are now the last option for controllingpests on campus, not the first. Under the IPM philosophy, the best way to do anythingis to let nature take care of it. <strong>UCSB</strong> has been experimenting with biologicalmanagement methods such as releasing predator insects to control insect pestpopulations. A recent example on campus of insect treatment is the use of white fliesand ladybugs to control aphid populations.148
8.3.6 Community/EducationThere is considerable outreach from the campus to the community through theMuseum of Evolution and Systematics. Groups such as the Audubon Society,Environmental Defense Center, and the Earth Action Board are active on campus andin the community promoting environmental issues. Other groups such as theConception Coast Project (CCP) and the Gaviota Coast Conservancy (GCC) arefocused on protecting and restoring ecological integrity to the region (CCP, 2000) andhave connections to the campus community.8.4. Environmental Report CardIndicator Answer ScoreIs there long-range landscaping plan? No 0Are there specific criteria for selectinglandscaping plants?Do those criteria include energy conservationcharacteristics?Do those criteria include water conservationcharacteristics?Do those criteria include exclusion of nonnativeplants?Are there natural areas on campus maintainedby the University?No 0No 0No 0No 0Yes 1Is there a natural areas conservation plan? Yes 1Are there any programs to connect the campuswith the region ecologically?Yes 1Is there an IPM policy? Yes 1Has the IPM policy reduced the use ofpesticides?Yes 1Total: 5/10Percentage: 50%Grade: C-149
8.5. Recommendations• Develop a campus-wide landscaping policy/plan.• Implement pro-native criteria for all landscaping projects.• Orient landscape towards the regional ecological setting.• Replace invasive plants with natives in non-developed areas.• Integrate the IPM and plant selection process.• Integrate water conservation with the plant selection process.• Utilize landscaping for climate control.• Increase cooperation with local conservation groups.• Update the campus plant inventory.• Enhance educational opportunities by cultivating endemic vegetation.• Increase funding for the “greening” of the campus landscape.• Conduct a study of ways to increase habitat quality and connectivitythrough campus landscaping (perhaps as a student research project).150
9. POLICY FRAMEWORKThe final component of this report is the policy framework, composed of a draftpolicy statement and a general feasibility study for increasing the sustainability ofUniversity operations. The draft policy statement provides a foundation forestablishing sustainability as a core priority of the campus and identifies ways thatthis priority can be incorporated into all campus policies and practices. In the processof conducting our campus assessment, it became clear that while sustainability goalsmay be met on a project-by-project basis, this results mainly from the effort ofdedicated staff members, rather than from a broad scale campus initiative. In order toensure that sustainability measures will continue to be prioritized over time, a topdowncomprehensive policy is needed.Our goal is to offer a springboard for the development of such a campus-widesustainability policy to be adopted by the Chancellor and Academic Senate. Thepolicy statement contains information regarding energy conservation, waterconservation, waste minimization, green building practices and alternativetransportation, and provides a starting point for implementing ideas and creatingdepartmental procedures. The draft policy was then discussed with several keypersonnel in the upper and lower tiers of the University to determine the feasibility ofsuch a policy at <strong>UCSB</strong>. This feasibility study identified both institutional and externalbarriers to change of this scale at the University and offered some suggestions foraiding the adoption and implementation of such a policy at <strong>UCSB</strong>.9.1. Empirical & Theoretical RationaleResearch has shown that the formation and publishing of an environmental policy incorporations is a necessary step in the quest for improved environmental performance(Ramus and Steger, 2000). The university is a large institution that shares manyattributes with corporations: universities provide a service for a fee, employspecialists and generalists throughout the system and are influenced by stakeholdersand the regulatory sector. Thus, research documenting the importance of corporateenvironmental policies on sustainability may be applied to the university setting.Research investigating the relationship between environmental policy and employeeenvironmental initiatives provides some interesting insights that can be applied in theuniversity context. An “ecoinitiative” is defined as any action taken by an employeethat she or he thought would improve the environmental performance of thecompany. Ecoinnovation is a means for corporations to become moreenvironmentally and economically sustainable in their activities (Davis, 1991 andFussler, 1996). Previous research has suggested that business’ transition towardssustainability would be enhanced by their ability to implement employee’s creativeenvironmental solutions (Fussler, 1996). Further research has supported the assertion151
that the ecological sustainability of businesses depends on innovative solutions (suchas ecoinitiatives (World Business Council for Sustainable Development, 1996a,1996b). Thus, it is clear that a strong link exists between institutional sustainabilityand employee innovation.The role of a published environmental policy in enhancing the link betweensustainability and employee ecoinitiatives is significant. Barret and Murphy (1996)suggest that the degree of organizational support for employee actions determines thesuccess of environmental efforts. In the absence of supportive management behaviorsand/or the organization’s communication of a corporate vision of sustainableactivities as signaled by an environmental policy, research has found few employeegenerated eco-initiatives (Ramus and Steger, 2000). In addition, a number ofresearchers have shown that environmental policy is an important precursor toemployee engagement in environmental activities (Brophy, 1996; Barret and Murphy,1996). Ramus and Steger (2000) noted the following conclusions regarding the roleof an environmental policy in increasing an institution’s environmental performance:• The presence of a published environmental policy positively impactsthe presence of employee environmental initiatives.• Employees who perceive strong signals of organizational supervisoryencouragement are more likely to develop and implement creativeideas that positively affect the natural environment than employeeswho do not perceive such signals.• The strong link between the existence of a published environmentalpolicy and the willingness of employees to attempt self-describedenvironmental initiatives demonstrates that employees respondedpositively with creative ideas in the environmental area if theyperceive a strong organizational commitment to the environment. Infact, the presence of an environmental policy triples the probability ofemployee eco-initiatives.There are thus two main conclusions to draw from this body of empirical andtheoretical research: (1) employees are more likely to perform in a positive,environmental manner when the company’s environmental policies are known, and(2) it is important for an institution to have a published environmental policy as it hasa direct impact on the level of eco-innovation. These findings acted as a catalyst forour draft policy on sustainability.9.2. <strong>UCSB</strong> Draft PolicyWe drafted a campus policy for sustainability that encompasses the primaryprinciples of sustainability outlined in the introduction (see Appendix C for policytext):152
1. The minimization of resource consumption.2. The minimization of waste/pollution.3. The conservation of the natural environment.4. The promotion of environmental education.5. An expanded sense of community.6. The need to think in terms of generations.7. The need to think holistically.<strong>UCSB</strong> has taken some preliminary steps towards sustainability, although more aregreatly needed. <strong>UCSB</strong> signed the Talloires Declaration of 1990, which is anagreement between University Leaders for a Sustainable Future and 279 universitiesworldwide. This declaration calls for a commitment to furthering environmentaleducation and promoting sustainable development (see Appendix D). However, thisinitiative has not been very well publicized and has not spurred a meaningfuldiscussion regarding the steps to be taken at <strong>UCSB</strong> to further sustainability.Our policy was designed to enhance sustainability efforts by <strong>UCSB</strong> and the UCsystem and to instigate action on sustainability issues. This policy calls for <strong>UCSB</strong> tobe a leader in environmental stewardship, environmental research and environmentaleducation, and complements the University’s Academic Planning Statement (APS).The APS “establishes goals and objectives for <strong>UCSB</strong> to assume a position of greaterleadership among state, national and world academic communities.” It is intended toserve as the standard against which to assess progress toward the fulfillment of threeprimary missions ensuring:• strong programs of research that adhere to high standards of academicexcellence while addressing the changing needs of society,• an outstanding environment for teaching and learning in whichstudents will acquire life-long habits of learning, thus providing anexcellent basis for their future role in the world community, and• a faculty, student body, and staff characterized by diversity andexceptional quality” (<strong>UCSB</strong>, 1993).The components of sustainability defined in our report could all easily beincorporated into these three core components of the APS. In fact, the omission ofsuch a discussion runs contrary to the University’s stated goals of teaching people toimprove their ability to influence the world after graduating, and to focus researchefforts to reflect the changing needs of society. The goals of the APS cannot beaccomplished without addressing sustainability. We believe our draft policy statementon sustainability enhances the missions outlined in the APS, while also outlining amore definitive plan for action.153
This policy calls for action by the University to acknowledge and work to reduce theimpacts of its activities on the environment at a local, national and global level. Thispolicy outlines solutions to environmental problems by adopting sound principles andbest practice, and calls for the University to demonstrate environmental protectionand enhancement through appropriate operational, educational, research andinstitutional practices. The specific aims of the policy are categorized as follows:1. To maximize campus energy efficiency.2. To engage in green building practices in campus development.3. To reduce solid waste generation.4. To reduce hazardous waste generation.5. To implement an environmentally responsible purchasing and campus storespolicy.6. To reduce air pollution associated with transportation.7. To maximize alternative transportation efficiency.8. To optimize and control the use of water on campus.9. To reduce impacts associated with landscaping in the built environment.10. To enhance natural areas on and around the campus.11. To increase communication between individuals and departments working towardsustainability.In addition, this policy calls for the maintenance of a balance between ecosystemwell-being, economic viability and human health as a means for progressing towardsenduring sustainability (Figure 9-1). To this end, all University departments andindividuals are asked to incorporate ideals of sustainability into everyday decisionsand actions, including purchasing, transportation, energy and water usage, and wastedisposal practices. The University has a responsibility to teach environmentalstewardship, not only in the classroom, but also in all campus operations. By strivingto make University operations and policies more efficient and environmentally-sound,<strong>UCSB</strong> can increase its environmental performance while also saving money andresources.154
EcosystemWell-BeingSustainabilityHumanHealth &Well-BeingEconomicVitalityFigure 9-1. Balanced view of sustainability9.3. Feasibility & Institutional BarriersA series of interviews with University personnel in Facilities Management,Environmental Health and Safety (EH&S), The Campus Energy Team, the Office ofthe Chancellor and Vice Chancellor, AS Recycling, the Transportation AlternativeProgram (TAP), the Office of Budget and Planning (BAP), and numerous faculty,staff and students from various campus departments provided us with informationregarding the feasibility of adopting such a policy on the <strong>UCSB</strong> campus. The maininstitutional barriers to environmental change, as determined from the interviews, are:• Institutional and organizational barriers: This includes the lack of acampus sustainability policy, a lack of communication and advocacyfrom the top down and the lack of a clear environmental leader oncampus.• Financial barriers: This refers to the lack of adequate resourceallocation for environmental programs and initiatives. In addition, thetypical manner in which the University’s financial framework isdesigned does not consider the potential long-term savings to offset155
high up-front costs for environmentally sound technologies andsystems.• Informational barriers: There is a lack of readily availableinformation measuring campus environmental performance in manykey campus sectors. In addition, analyses of available information arenot made readily available to the community at large.• Organizational Culture barriers: Sustainability is currently not a toppriority for the entire campus community.In addition, the following external factors were noted as barriers to environmentalchange:• Resource barriers: This refers to a lack of environmentally-soundresources, such as large quantities of renewable energy for purchase bythe University.• Technological barriers: Environmentally-sound alternatives toinefficient or polluting products and systems may not exist, are oflower quality, or are financially prohibitive.• Supply barriers: In some cases, it is difficult to find suppliers forenvironmentally sound products and to change your relationship withthem.9.4. Successful Policy Adoption & ImplementationA full discussion outlining a strategy for the adoption and implementation of thispolicy was beyond the scope of the current report. However, it is clear from bothliterature reviews and discussions with the campus community that a combination,top-down/bottom-up approach will be needed. There is clearly a strong impetus fortop-down support of environmental issues, as noted in the empirical researchliterature (Ramus and Steger, 2000). Likewise, there is a strong argument for theupwelling of environmental support from students, faculty and staff, as they will bethe ones to implement the directives of sustainability on a day-to-day basis. As wegathered information for our environmental assessment, we observed that themajority of sustainability efforts on campus to date have stemmed from concernedstaff members, suggesting the presence of bottom-up support. In order to allow thissupport to reach its full potential, it needs be met by a stated commitment tosustainability from the highest levels of University administration.In order to facilitate the adoption and implementation of our draft policy statement onsustainability, we have compiled the following tips:156
• Provide a campus community review of policy statement for publiccommentary before policy adoption.• Make the policy statement available to the public, and hold regularmeetings to inform the public regarding progress.• Provide a means for effectively communicating the policy statement toall campus employees.• Provide training for staff to learn how to adhere to policy statementgoals, and how to use new equipment mandated by the policystatement.• Encourage staff initiatives for environmental improvement andprovide a forum for these ideas to be discussed and adopted.• Establish a documenting and monitoring system so that adherence tothe policy can be marked and easily accessible. In addition, a systemshould be developed for measuring the campus’ progress inaccomplishing the goals set by the policy statement.• Establish a protocol for detecting and addressing unmet policyimperatives.• Establish an information reporting system. The amount of resourcesused by campus as well as notes on increased environmentalperformance by the campus should be published on a public website.• Periodically review the policy statement for necessary changes inscope due to changing environmental conditions and availabletechnologies.• Focus on continual improvement and changing levels of what’sconsidered a good environmental goal for the campus based onsocietal and environmental shifts.157
10. CONCLUSION10.1 Overall Campus AssessmentOur study of the environmental performance of <strong>UCSB</strong> highlights two major trends:(1) an increased use of our natural resources, waste generation, and pollution of theenvironment, and (2) the development of important innovations in some areas ofcampus operations. These innovations, such as the IPM policy, the use of reclaimedwater, the formation of the Energy Team, the recycling committee, and the TAPprogram, have had positive impacts on campus sustainability. We hope that theseinnovations mark the beginnings of a campus-wide move toward sustainability.However, to date, the first trend has been dominant. As a result, <strong>UCSB</strong> scored fairlylow marks on our sustainability scorecard: one B-,one C, one C, two C-’s, and one D.Individuals with a vision of cost savings, efficient operations and environmentalperformance are leading the progressive effort toward sustainability. However, theirability to significantly increase the sustainability of the campus is severely hamperedby a lack of overall, institutional support. We have identified two core institutionalbarriers to sustainability at <strong>UCSB</strong>:• Lack of a clear commitment to sustainability. There currently existsno clear commitment to sustainability in the institutional framework ofthe University, as is demonstrated by the absence of a policy statementon sustainability. Although efforts undertaken by individuals withinthe University are important for initiating and sustainingenvironmental initiatives, they cannot replace a commitment from thepresident or chancellor of a university (Smith, 1993).• Lack of funding for environmental technologies and initiatives.Funding is a clear barrier to sustainability efforts, given that moreefficient technologies generally have higher up-front costs. Forexample, conservation projects must compete with capital projects (i.e.new buildings, parking lots) for funding and are rarely given priority.However, this report has demonstrated that installing such equipmentand funding environmental initiatives can result in significant savingsover time. The need to fully consider life-cycle costs should thusbecome a core component of all campus operations.It is our contention that these barriers will continue to hinder sustainability efforts oncampus unless adequately dealt with. Our policy statement provides a building blockfor addressing these issues by establishing sustainability as a priority in all campusoperations. Adopting this policy statement may have repercussions beyond the <strong>UCSB</strong>campus, given that UC Santa Barbara may serve as a model for the entire UC system.158
In addition, a new UC campus will be completed in 2004 in Merced. This policystatement could have a profound influence on the sustainability of this campus byensuring green building design, environmentally friendly campus lay out and theinstallation of the most efficient equipment right from the start.10.2 Research in Campus GreeningThe field of campus greening has grown in recent years, resulting in a variety ofcampus audits. We believe that our research compliments scholarship previouslyundertaken by students and faculty at institutions such as Penn State, UC San Diegoand Brown, as well as the Campus Ecology Program sponsored by the NationalWildlife Federation. Similar to these earlier studies, we developed a methodology forassessing the sustainability of <strong>UCSB</strong> across a wide range of campus operations,educational efforts, and the University’s role in creating a sense of community.However, the scope of our project went beyond these studies to develop andincorporate the principles of sustainability into a campus policy on sustainability.Although we analyzed a wide variety of issues relating to campus environmentalperformance, there were several areas of campus operations that were omitted fromour study as they were beyond our scope. These areas include: food services,operations of the University Center, residence halls, university curriculum, offcampus land holdings, University business and research ties and sources of Universityfunding. Future research targeting these issues would greatly compliment this piece ofresearch while also ensuring for a broader view of sustainability at the campus level.In addition, this research was undertaken without the assistance of any clearly definedindices or measures of sustainability. Although it is possible to track improvements inany one area of campus operations, it is not clear what actions or numbers wouldactually constitute a sustainable campus. The University of Michigan’s Center forSustainable Systems (CSS) is currently working to advance these efforts bydeveloping metrics for quantifying and assessing campus environmental performance(NWF, 1999). This research is intended to create a template for use by campusesnationwide to measure environmental performance in terms of standardized metricsso that we may characterize campus sustainability on a functionally relative scale(NWF, 1999). Future environmental assessments at <strong>UCSB</strong> would be greatly aided bythe use of such a tool, which would allow for more comparison between <strong>UCSB</strong> andother campuses.10.3 General RecommendationsDuring the course of this research we came across a variety of resources designed toaid campuses in the quest for sustainability. It is our belief that adherence to the159
following recommendations could greatly compliment the present research anddevelop the path for future sustainability endeavors.• Join the Campus Ecology program. This program is a component ofthe National Wildlife Federation that assists students, faculty, staff andadministrators in transforming colleges and universities into learningand teaching models of environmental sustainability, by assisting withthe design and implementation of practical conservation projects,providing training and incentives, and by helping to document andshare lessons learned nationally and beyond (Nicholson et al., 2000).This is achieved through the maintenance of a database of campusenvironmental audits and policies, seminars and training programs. Inaddition, although we have completed an environmental assessment of<strong>UCSB</strong>’s environmental performance, it is difficult to view <strong>UCSB</strong> inthe context of nationwide campus environmental performance.Campus Ecology is developing a new large-scale environmentalperformance survey of U.S. colleges and universities, which couldprovide <strong>UCSB</strong> with a point of comparison for measuring progress.• Engage Participation from the Campus Community on this Issue.Members of the immediate and surrounding campus community needto have input on this move towards sustainability to prevent futureroadblocks. Enlisting support and participation from a diversity ofcampus stakeholders will help legitimize environmental efforts, whilealso ensuring their survival.• Establish an Environmental Fund. Lack of financial resources is themost commonly sighted barrier to sustainability initiatives on campus.Therefore, an environmental fund should be established at <strong>UCSB</strong> toaid in the purchasing of efficient technologies, pay for training andseminars, fund environmental programs on campus, and provide forfuture research on environmental issues. Examples of projects thatcould be implemented include energy and water conservation retrofits,mitigation measures for storm drains, landscape restoration projects.• Develop a Mechanism for Monitoring Progress. During ourresearch we interviewed a variety of staff members interested inworking toward a more sustainable campus. It is crucial that thesepeople have the opportunity to exchange information and ideas. Tothis end we recommend the establishment of a campus committee onsustainability. This committee would monitor campus sustainabilityand prioritize research needs and changes in policy, operations, andinfrastructure.160
• Compile and publish data on sustainability. There is a significantinformation deficit on campus sustainability issues. Data on resourceuse should be readily available to students and members of thecommunity and monitored over time. Proposals such as a frequentlyupdated website containing energy use data by building are a step inthe right direction.10.4 Choosing a PathThis project’s vision extends beyond the border of the <strong>UCSB</strong> Campus. We believe theconcept of sustainability is the future of environmental policy-making at the local,state, national, and global level. This report seeks to contribute to the recent literatureon the development of sustainable communities (See Mazmanian and Kraft, 1999 andKamieniecki et al., 1997). Ever since the issuing of the Brundtland Commissionreport, sustainability has been part of the discourse. However, now it is time toadvance the theoretical discussion into a functional idea of how sustainability can beapplied in the real world. We took on the extraordinary task of analyzing all the majorissues involved with sustainability—Building Design, Energy Use, WasteManagement, Air Quality and Transportation, Water Management and LandscapeManagement—with the hope of evaluating the current situation at <strong>UCSB</strong> anddeveloping recommendations and policy that will lead the University in the rightdirection, while also establishing a model for other universities to follow in the future.The University of California, Santa Barbara is facing a choice that is analogous to thefamous poem by Robert Frost: The Road Not Taken. Two roads do diverge ahead ofus, one path leads to an acknowledgement of our responsibility to the present andfuture generations to take action to protect our natural resources and establish asociety that is truly sustainable. The other is the well-worn path resistant to change,leading to a future of dwindling resources and possible drastic changes to the naturalenvironment. When we “shall be telling this with a sigh, somewhere ages and ageshence” will we be secure in the knowledge that we made the correct choice or will weregret the lost opportunities of the past?161
GLOSSARYCo-generation: the trapping and utilization of waste heat from on-site generationsystems for supplying heat or hot water to buildings.Green Building: the use of efficient designs and technologies to decrease the totalenvironmental impacts of construction, operation and maintenance of a building.Hazardous Waste: waste which because of its quantity, concentration, or physical,chemical or infectious characteristics may either: (1) cause or significantly contributeto an increase in mortality or serious illness, or (2) pose a substantial present orpotential hazard to human health or the environment if it is improperly managed.Life-cycle costing: an analysis of the full cost of a product, including the initialpurchase price and the costs of usage over time.Micropower: the small-scale generation of electrical power closer to where it is usedthrough renewable energy sources.Municipal Solid Waste: discarded material including garbage, refuse, and sludgethat can be solid, semisolid, liquid or contain gaseous materials.Net metering: an agreement with a utility company to sell power from on sitegenerators in excess of what is needed back onto the power grid. When power issupplied onto the grid, electricity meters run backwards and result in an offset ofelectricity bills equal to a maximum of what the customer would normally usewithout the use of on-site generation.Non-point pollution: pollution arising from diffuse, multiple sources rather thanfrom a point source.Off-stream use: water diverted or withdrawn from a surface- or ground water sourceand conveyed to a place of use.Passive solar design: building orientation and design that utilize the natural lighting,heating and cooling properties of sun and wind instead of or supplemental tomechanical systems.Post-consumer content: material from products that were used by consumers orbusinesses and would otherwise be discarded as waste.Precycling: making purchasing decisions that will reduce waste such as buyinggoods with less packaging (e.g., goods in bulk or concentrated form), choosingproducts that will last longer, and avoiding single-use or disposable products.Recyclable products can be collected and remanufactured into new products afterthey’ve been used. These products do not necessarily contain recycled materials andonly benefit the environment if recycled after their use.162
Recycled-content products are made from materials that would otherwise have beendiscarded. Items in this category are made totally or partially from material destinedfor disposal or recovered from industrial activities.Recycling: the process of collecting, sorting, cleansing, treating and reconstitutingmaterials that would otherwise become solid waste, and returning them to theeconomic mainstream in the form of raw material for new, reused, or reconstitutedproducts which meet the quality standards necessary to be used in the marketplace.Reuse: the recovery or reapplication of a package or product for uses similar oridentical to its originally intended application, without manufacturing or preparationprocesses that significantly alter the original package or product.Waste Prevention: any action undertaken by an individual or organization toeliminate or reduce the amount or toxicity of materials before they enter themunicipal waste stream. This action is intended to conserve resources, promoteefficiency, and reduce pollution.Wastewater: water that carries wastes from homes, businesses, and industries.163
APPENDIX A: ENERGY CONSUMPTIONCALCULATIONSTo estimate the total amount of CO 2 that campus energy consumption is responsiblefor, we used two methods outlined by David Vitaver of the California EnergyCommission (personal communication).Assumptions:1. A kWh consumed at <strong>UCSB</strong> is representative of a kWh consumed in the rest ofCalifornia.2. Energy consumption in California comes from the following sources:31% natural gas20% coal20% hydroelectric16% nuclear12% renewable1% other3. The only sources of electricity-related CO 2 in the California are natural gas andsub-bituminous coal (a tenuous assumption).4. Natural gas is burned on average at 10,000 Btu/kWh and has a CO 2 content of 119lbs/mBtu.5. When natural gas is used directly on-site, it burns at 100,000Btu/therm.6. Sub-bituminous coal is burned on average at 9,500 Btu/kWh and has a CO 2content of 238 lbs/mBtu.7. The electricity consumption of <strong>UCSB</strong> was 83,014,663 kWh in fiscal year 1999-2000.8. The total direct consumption of natural gas at <strong>UCSB</strong> was 3,000,000 therms infiscal year 1999-2000.9. For reference, 1 therm = 29.3 kWh.Based on these assumptions and approximations, we can calculate the amount of CO 2emissions per kWh and per therm and then multiply by the total campusconsumption:Electricity:CO 2 /kWh = (0.20 * 2.26 lbs CO 2 /kWh) + (0.31 * 1.19 lbs CO 2 /kWh) = .8209 lbsCO 2 CO 2 /kWh.8209 lbs CO 2 /kWh * 83,014,663 kWh/year = 68,146,736 lbs CO 2 /yearNatural gas:CO 2 /therm = 11.9 lbs CO 2 /therm164
11.9 lbs CO 2 /therm * 3,031,218 therms/year = 36,071,494 lbs CO 2 /yearTotal energy related CO 2 emissions:68,146,736 lbs CO 2 /year + 36,071,494 lbs CO 2 /year = 104,218,230 lbs CO 2 /year165
APPENDIX B: CARBON DIOXIDE EMISSIONCALCULATIONSMarginal Method for estimating the amount of CO 2 emission reductions that wouldbe achieved by reducing campus demand by 1 kWh during peak demand (winter andsummer).Marginal emission reduction is determined by the type of plant that would most likelybe turned off if campus demand were reduced. General rules of thumb about whichplants are on margin in California at different times are as follows:1. Hydroelectric plants are generally the cheapest and cleanest to run, and so theyremain on more of the time. Therefore they are on margin at the times when theleast amount of energy is being used (e.g. in the middle of the night.)2. Natural gas powered plants vary in efficiency. Those with least efficiency are onmargin only during the most consumptive times of summer peaks, while slightlymore efficient plants are on margin during winter peaks. Because natural gasplants cost more to run than some other types of facilities and because natural gasplants can be easily shut off, natural gas plants are on margin whenever they arerunning.3. Coal plants take time to start and stop, and so they are often let to run all of thetime, rather than coming on line solely for peak demand service.4. Because uranium is relatively inexpensive and nuclear plants cannot easily beswitched on and off, functioning nuclear plants are never on margin.5. Wind generators are never on margin since they cost virtually nothing to run.Thus we can assume that reducing peak electricity demand at <strong>UCSB</strong> will most likelyresult in the shutting down of a natural gas powered generating facility. Theefficiency of the facilities that would be shut down first depends on the season.To calculate the marginal CO 2 reduction from reduced power demand on campus, weassumed that:• Natural gas plants running during peak demand in the summer range in efficiencyfrom 14-16 million BTUs/kWh.• Natural gas plants running during peak demand in the winter range in efficiencyfrom 10-12 million BTUs/kWh.• Natural gas emits 119 lbs of CO 2 /mBTU.Therefore we estimate that the marginal amount of CO 2 emission reduction is:1.79 lbs/kWh in the summer and 1.31 lbs/kWh in the winter.166
APPENDIX C: DRAFT POLICY ONSUSTAINABILITY FOR <strong>UCSB</strong>The University of California at Santa Barbara recognizes that the principles ofsustainability and environmental stewardship are not only compatible with the goalsof academia, but are essential to the long term existence of this institution.For the purposes of this document, we used the word sustainability to refer to allprojects that reduce environmental impact by:1. Minimizing resource consumption2. Minimizing pollution, and3. Conserving the natural environment.In order to encourage such efforts, the University adopts the following objectives ascore priorities:Increase energy efficiency:• Replace inefficient equipment with energy conserving alternatives.• Install monitoring and control systems to reduce energy demand.• Reduce peak energy demand.• Exceed title 24 specifications whenever feasible based on life cycle cost analysis.• Incorporate energy efficiency into new building design.• Purchase energy efficient electrical equipment, appliances and mechanicalsystems.Increase use of renewable/green energy sources:• Incorporate requirement for a minimum percentage of renewable energy sourcesin contractual agreements with energy suppliers.• Increase use of on-site power generation.Engage in green building practices in campus development:• Adopt LEED Silver Medal standards as minimum criteria for all new buildings.• Incorporate sustainable building practices into all new development andconstruction:• Examine local, regional and global impacts of campus planning and development.• Incorporate green building requirements into contracts with architects andcontractors.• Use environmentally sound building materials.• Manage existing building for sustainability.167
Engage in waste reduction efforts:• Exceed AB675 levels for waste prevention when justified by a cost benefitanalysis.• Engage in source reduction at all levels of the University (administration, faculty,staff, students, etc.).• Reduce the use of, reuse and recycle materials.• Incorporate sustainability goals into purchasing contracts.• Close the recycling loop by purchasing recycled-content products.• Appropriately manage solid and liquid wastes, especially hazardous wastes.Reduce pollution sources on-site:• Minimize campus atmospheric emissions of toxics, greenhouse gases, criteriapollutants, and ozone depleting chemicals through efficient design and operationsof laboratory chemical fume hoods and building heating/cooling systems.• Reduce sources of indoor air pollution.Reduce environmental impact associated with transportation to and fromcampus:• Increase the availability and effectiveness of alternative forms of transportation.• Minimize the number of parking permits sold to individual users.• Construct new parking structures only when it is clearly established that parkingdemand or supply cannot be sufficiently altered by other means.• Restrict vehicular traffic to the perimeter of campus to keep the interior safe andaccessible to pedestrians and bicycles.Conserve water:• Replace inefficient equipment with water conserving alternatives.• Maximize use of reclaimed water.• Maximize efficiency of irrigation systems.Reduce impacts associated with landscaping in the built environment:• Minimize soil erosion and manage runoff.• Minimize the total area of impermeable surfaces.• Avoid the use of invasive plant species.• Give preference to vegetation native to the region or adapted to the Mediterraneanclimate.• Utilize integrated pest management strategies to reduce or eliminate the need forpesticides and chemical fertilizers.168
Enhance natural areas on and around the campus:• Maintain the campus non-built environment in its natural state.• Restore degraded natural areas on campus to increase the quality of wildlifehabitats.• Maximize connectivity between campus natural areas and the regional ecology.Increase communication between individuals and departments working towardsustainability:• Incorporate operations and maintenance staff into the decision making process.• Increase communication between Budget and Planning, Design and Constructionand Maintenance departments.• Educate faculty, staff and students about campus sustainability efforts.169
APPENDIX D: TALLOIRES DECLARATION:UNIVERSITY PRESIDENTS FOR ASUSTAINABLE FUTUREWe, the presidents, rectors, and vice chancellors of universities from all regions of theworld are deeply concerned about the unprecedented scale and speed ofenvironmental pollution and degradation, and the depletion of natural resources.Local, regional, and global air pollution; accumulation and distribution of toxicwastes; destruction and depletion of forests, soil, and water; depletion of the ozonelayer and emission of "green house" gases threaten the survival of humans andthousands of other living species, the integrity of the earth and its biodiversity, thesecurity of nations, and the heritage of future generations. These environmentalchanges are caused by inequitable and unsustainable production and consumptionpatterns that aggravate poverty in many regions of the world.We believe that urgent actions are needed to address these fundamental problems andreverse the trends. Stabilization of human population, adoption of environmentallysound industrial and agricultural technologies, reforestation, and ecologicalrestoration are crucial elements in creating an equitable and sustainable future for allhumankind in harmony with nature. Universities have a major role in the education,research, policy formation, and information exchange necessary to make these goalspossible.The university heads must provide the leadership and support to mobilize internal andexternal resources so that their institutions respond to this urgent challenge. We,therefore, agree to take the following actions:1. Use every opportunity to raise public, government, industry,foundation, and university awareness by publicly addressingthe urgent need to move toward an environmentally sustainablefuture.2. Encourage all universities to engage in education, research,policy formation, and information exchange on population,environment, and development to move toward a sustainablefuture.3. Establish programs to produce expertise in environmentalmanagement, sustainable economic development, population,and related fields to ensure that all university graduates areenvironmentally literate and responsible citizens.170
4. Create programs to develop the capability of university facultyto teach environmental literacy to all undergraduate, graduate,and professional school students.5. Set an example of environmental responsibility by establishingprograms of resource conservation, recycling, and wastereduction at the universities.6. Encourage the involvement of government (at all levels),foundations, and industry in supporting university research,education, policy formation, and information exchange inenvironmentally sustainable development. Expand work withnongovernmental organizations to assist in finding solutions toenvironmental problems.7. Convene school deans and environmental practitioners todevelop research, policy, information exchange programs, andcurricula for an environmentally sustainable future.8. Establish partnerships with primary and secondary schools tohelp develop the capability of their faculty to teach aboutpopulation, environment, and sustainable development issues.9. Work with the UN Conference on Environmental andDevelopment, the UN Environment Programme, and othernational and international organizations to promote aworldwide university effort toward a sustainable future.10. Establish a steering committee and a secretariat to continue thismomentum and inform and support each other's efforts incarrying out this declaration.171
BIBLIOGRAPHYAmerican Public Works Association (APWA) (1976). History of Public Works in theUnited States, 1776-1976. Armstrong, E.L., Robinson, M.C., and Hoy, S.M.,eds. Chicago: American Public Works Association.Andrande, Alfred, Donna Cassano, Connie Liu, Anita Teo and Joe Yanhner (2000).“An Evaluation of the EPA Wastewi$e Program.” Thesis, Donald Bren Schoolof Environmental Management, University of California, Santa Barbara.Ashley, Jeffrey S., and Zachary A. Smith (1999). Groundwater Management in theWest. Lincoln, Nebraska: University of Nebraska Press.Aston, Darcy and Alison Whitney (1993). "Sustainable Landscaping: ResourceEfficient Landscapes for the Central Coast." Santa Barbara County WaterAgency and City of Santa Barbara Public Works Department.Barret, S. and D. Murphy (1996). Managing corporate environmental policy: Aprocess of complex change. In W. Wehrmeyer (Ed.), Greening people: 75-98.Sheffield, England: Greenleaf.Baskin, Yvonne (1998). The Work of Nature: How the Diversity of Life Sustains Us.Washington, D.C.: Island Press.Brophy, M. (1996). “The essential characteristics of an environmental policy. In R.Welford (Ed.), Corporate environmental management: Systems andstrategies: 92-103. London: Earthscan.Brown, Lester R. (2000). “Challenges of the New Century.” State of the World 2000.Edited by Lester R. Brown, et al. New York: WW Norton and Company.Brown, R. L. and E. Ayres (1998). World Watch Reader. Washington, D.C.: WorldWatch Institute.Byrd, Mary (1999). “Santa Barbara County Air Pollution Control District: 1999Report to the Community.” Santa Barbara Air Quality Control District.Cahn, Matthew Alan (1995). Environmental Deceptions: The Tension BetweenLiberalism and Environmental Policymaking in the United States. Albany:State University of New York Press.California Air Resources Board (CARB) (2000). “State Area Designations Map:Ozone.” Areas Designations Home Page: Ozone. 15 February 2001.California Department of Water Resources (CDWR) (1998). “Bulletin 160-98:California Water Plan.” http://rubicon.water.ca.gov/b16098.htm172
California Energy Commission (2001). “California Energy Facts.” 18 January 2001.California Integrated Waste Management Board (1995). California Integrated WasteManagement Board: Public Resources Code. State of California, GovernmentDocument.California State Department of Finance (1998). “County Population Projections withRace/Ethnic Detail Estimated July 1, 1990-1996 and Projections for 1997through 2040.” Demographic Research Unit.Campus Planning (2000a). “Historical Aerial Photographs.” Campus PlanningPhysical and Environment Highlights. 22 March 2001.Campus Planning (2000b). “<strong>UCSB</strong> 1990 Long Range Development Plan.”Campus Planning (2000c). “Capital Development and Physical Planning Guidelines.”City of Santa Barbara (2000). “Santa Barbara Rainfall By Calendar Year.” WaterResources Division, Water Supply Management Division. March 2000Clemmer , S., B. Paulos, A Nogee (2000). “Clean Power Surge: Ranking the States.”Union of Concerned Scientists. April 2000.Cohen, Joel E. (1995). How Many People Can the Earth Support? New York:W.W. Norton and Company.Conception Coast Project (CCP) (2000). “DRAFT: Conception Coast ProjectStrategic Plan.” Unpublished Draft Report.Corbett, Judy and Michael Corbett (2000). Designing Sustainable Communities:Learning from Village Homes. Covelo, California: Island Press.Costanza R. (1997). “The Value of the World’s Ecosystem Services and NaturalCapital.” Nature. May 15, 1997.Cox, George W. (1999). Alien Species in North America and Hawaii. Covelo,California: Island PressDaily, Gretchen C., ed. (1997). Nature’s Services: Societal Dependence onNatural Ecosystems. Washington D.C.: Island Press.173
Davis, J. (1991). Greening Business: Managing for sustainable development. Oxford:Basil Blackwell.Davis, Alan and Susan Kinsella (1990). “Recycled Paper: Exploring the myths.”Garbage Magazine, May/June 1990.Department of Toxic Substance Control (DTSC) (1989). “SB 14 - Hazardous WasteSource Reduction Planning.” Department of Toxic Substances Control -Pollution Prevention Home Page. 9 February 2001.Design, Construction and Physical Facilities (2001).” Physical Facilities: Utilities andEnergy Programs.” Physical Facilities Energy Programs Home Page. 14April 2001. Dickey, Jefferson H., MD (1996). “No Room to Breath.” Physicians for SocialResponsibility: Health Effects of Air Pollution. 13 April 2001.Dozier, J. and L. F. Matthiessen (2000). “Greening Bren Hall.” Campus PlanningCommittee. 22 March 2001.Dunn, S. (2000). Micropower: The Next Electrical Era. Worldwatch Paper 151.Worldwatch Institute.Earth Works Group (1990). The Recycler's handbook. Berkeley: Earth Works Press.Enron Energy Services (2000). “DRAFT: Strategic Energy Report-University ofCalifornia at Santa Barbara.” Enron Energy Services.Facilities Management (2001). “Recycling update.” <strong>UCSB</strong>, Facilities ManagementWebsite, Recycling Home Page. 20 February 2001.Ferren, Wayne and Kathryn A. Thomas (1995). “University of California, SantaBarbara, natural areas plan: classification, inventory, and managementguidelines.” Prepared for <strong>UCSB</strong> Office of Budget and Planning. SantaBarbara, CA: Museum of Systematics and Ecology, Department of BiologicalSciences, University of California, 1995.Fetter, Rob and Alyssa Mudd (1993). “The Brown, the Green, and the Grey: AuditingWater Use at Brown University.” Brown University.Fussler, C. (1996). Driving eco-innovation: A breakthrough discipline for innovationand sustainability. London: Pitman.174
Gibbs, Dennis (2001). “Santa Barbara County Groundwater Report.” With assistancefrom Jon Ahlroth and Christina Lopez. Santa Barbara County Public Works,Water Resources Department, Water Agency Division.Goleta Water District (GWD) (2001). Goleta Water District Homepage.Goodland, Robert and Herman Daly (1996). “Environmental Sustainability: Universaland Non-negotiable.” Ecological Applications. 6.4 (November): 1002-1017.Gottlieb, Robert (1988). A Life of its Own: The Politics and Power of Water. SanDiego: Harcourt Brace Jovanovich.Green Destiny Council (1997). “Penn State Indicators Report”. Green DestinyCouncil Home Page. January 2001.Green Seal (1995). “Choose Green Report, Copy Papers.” Washington, DC.: GreenSeal.Haddad, Brent (2000). Rivers of Gold: Designing Markets to Allocate Water inCalifornia. Washington D.C.: Island Press.Hardin, Garrett (1968). “The Tragedy of the Commons.” Science. V162 (December13): 1243-1248.Hartwick, John M. and Nancy D. Olewiler (1998). The Economics of NaturalResource Use. Menlo Park, California: Addison-Wesley.Hawken, Paul, Amory Lovins, and L. Hunter Lovins (1999). Natural Capitalism:Creating the Next Industrial Revolution. Boston: Little, Brown and Company.Hawken, Paul (1997). “Natural Capitalism.” Mother Jones, March/April 1997.Holdren, John P. (2000). “U.S. Vulnerability to Oil Price Shocks and SupplyConstrictions – and How to Reduce It.” Hearing Regarding Oversight ofRisking Oil Prices and the Efficiency and Effectiveness of Executive BranchResponses: Opening Statement.Jones-Lee, A. and Lee, G. F. (1993). “Groundwater Pollution by Municipal Landfills:Leachate Composition, Detection and Water Quality Significance,” Proc.Sardinia '93 IV International Landfill Symposium, Sardinia, Italy, pp.1093-1103, October (1993).Kamieniecki, Sheldon, George A. Gonzalez, and Robert O. Vos. (1997). Flashpointsin Environmental Policymaking: Controversies in Achieving Sustainability.Albany, New York: State University of New York Press.Keniry, Julian (1995). Ecodemia. Washington D.C.: National Wildlife Federation.175
Keniry, Julian and David J. Eagan (1998). Green Investment, Green Return.Washington D.C.: National Wildlife Federation.Lerner, Steve (1994). “Student greens get practical at the University of Wisconsin.”Amicus Journal 16.2 (Summer, 1994): 36-42.Lickatowich, L., L. Morbrand, and L. Leslie (1999). “Depletion and extinction ofPacific salmon (Oncorhynchus spp.): A different perspective.” ICES Journalof Marine Science. 56: 467-472.Matteson, Gary (2001). “Draft: University of California Campus Energy Report.” UCOffice of the President.Maxmanian, Daniel A. and Michael Kraft, ed. (1999). Toward SustainableCommunities. Cambridge, Massachusetts: The MIT Press.Mills, E., G. Bell. D. Sartor, A. Chen, D. Avery, M Siminovitch, S. Greenberg, G.Marton, A de Almeida and L.E. Lock (1996). “Energy Efficiency inCalifornia Laboratory-Type Facilites.” Ernest Orlando Lawrence NationalLaboratory. Berkeley, CAMontague, Peter (1998), “Landfills are dangerous #617,” Rachel's Environmental andHealth News, September 24, 1998. Environmental Research Foundation.National Parks Service (1997). “Exotic Species.” Natural Resources, Wildlife andPlants. 4 December 1997. National Wildlife Federation (NWF) (1999). Buying Green the Easy Way.Washington D.C.: National Wildlife Federation (Campus Ecology Program).--- (1998). Ecological Building Design. Washington D.C.: National WildlifeFederation (Campus Ecology Program).--- (1996). Greenscapes. Washington D.C.: National Wildlife Federation (CampusEcology Program).Nicholson, Ben, Jonathan Buckley and Greg Keolian (2000). “Measuring Progress:Developing Standard Campus Performance Metrics.” Campus EcologyConnection. Spring 2000 11(1).Occupational Health and Safety Organization (2000). “Indoor Air Quality in theWorkplace #2273.” OSHA Unified Agenda: Long-Term Actions. 30 November2000. < http://www.osha-slc.gov/Reg_Agenda_data/2273.html>Peabody, Z. (2001). “Gambles Pay Off as Public Universities Avoid Spiraling Costs.”Los Angeles Times 10 February 2001.Perry, Bob (1992). Landscape Plants for Western Regions: An Illustrated Guide toPlants for Water Conservation. Claremont, CA: Land Design Publishing.176
Phillips, J.A. (1998). Managing America’s Solid Waste. Boulder: J.A. Phillips andAssociates.Postel, Sandra and Stephen Carpenter (1997). “Freshwater Ecosystem Services.”Nature’s Services: Societal Dependence on Natural Ecosystems. WashingtonD.C.: Island Press.Prugh, Thomas with Robert Costanza, John Cumberland, Herman E. Daly, RobertGoodland, and Richard Norgaard (1999). Natural Capital and HumanEconomic Survival. New York: Lewis Publishers.Rafthje, William and Cullen Murphy (1992), Rubbish: The Archaeology of Garbage.New York: HarperCollins Publishers.Ramus, Catherine A. and Ulrich Steger (2000), “The roles of supervisory supportbehaviors and environmental policy in Employee ‘ecoinitiatives’ at leadingedgeEuropean companies”, Academy of Management Journal 42(4): 605-626.Raymond, Howard L. (1979). “Effects of Dams and Impoundments on Migrations ofJuvenile Chinook Salmon and Steelhead from the Snake River, 1966-1979.”Transactions of the American Fisheries Society. 108: 505-529.Recycled Products Purchasing Cooperative (RPCC) (2001), “Purchasing CooperativeExpands Nationally Continuing to Increase the Use of Recycled Paper.” TheRecycled Products Purchasing Cooperative Home Page. January 2001.Ricklefs, Robert E. (1997). The Economy of Nature. New York: W.H. Freeman andCompany.Rodriguez, Lynn and Rory Lang (2000). “Water Resources of Santa BarbaraCounty.” Santa Barbara County Water Agency.Romm, J. J. and W. D. Browning (1994). “Greening and the Bottom Line: IncreasingProductivity Through Energy-Efficient Design.” Rocky Mountain InstituteLibrary. November 2000. Rosenbaum, Walter A. (1998). Environmental Politics and Policy. Washington, D.C.:CQ Press.Sampat, Payal (2000). Deep Trouble: The Hidden Threat of Groundwater Pollution.Washington, DC: Worldwatch Institute.Schlesinger, William H. (1997). Biochemistry: An Analysis of Global Change. SanDiego: Academic Press.Schmandt, Jurgen, Ernest T. Smerdon, and Judith Clarkson (1988). State WaterPolicies: A Study of Six States. New York: Praeger.177
Sharp, Leith (1998). “The Monash University Churchill Fellowship to StudyOverseas: Building Institutional Commitment to Campus EnvironmentalSustainability.” The Winston Churchill Memorial Trust of Australia. Authore-mail: leith_sharp@harvard.eduShoreline Preservation Fund (2001). “<strong>UCSB</strong> Shoreline Water Quality MonitoringProgram.” 15 March 2001. Sierra Club (1998). Habitat Report.Smith, April A. (1993). Campus Ecology. Los Angeles: Student EnvironmentalAction Coalition, Living Planet Press.Solley, Wayne B., Robert R. Pierce, and Howard A. Perlman (1998). Estimated Useof Water in the United States in 1995. U.S. Geological Survey Circular 1200.Stokey, Edith and Richard Zeckhauser (1978). A Primer for Policy Analysis. NewYork: W.W. Norton and Company.Switzer, Jacqueline Vaughn (1998). Environmental Politics: Domestic and GlobalDimensions. With Gary Byner. New York: St. Martin’s Press.Thurlow, Aaron (1999a). A Hard Look at the Present Status of the Future ofEnvironmental Practices at the University of California, San Diego. La Jolla:UCSD.--- (1999b). Evaluating the Environmental Performance of the University ofCalifornia, San Diego. La Jolla: UCSD)<strong>UCSB</strong> (1999). “Parking Plus Two Committee Report to CPC.” Parking Plus TwoCommittee. 17 May 1999. Unpublished.--- (1998). “Design Review Committee.” Budget and Planning. June 1998.--- (1993). “Academic Planning Statement, University of California, Santa Barbara:Mission, Goals and Objectives.” Academic Planning Coordinating CommitteeHome Page. 1 June 1999.U.S. Department of Transportation (DOT) (1999). “Transportation Statistics AnnualReport, 1999.” Bureau of Transportation Statistics. BTS99-03. Washington,DC.U.S. Energy Information Administration (U.S. EIA) (2001). “California EnergyConsumption.” 5 April 2000.178
--- (2000a). “Country Analysis Briefs: United States of America.”12 October 2000.--- (2000b). “Energy Overview.” Annual Energy Review.U.S. Environmental Protection Agency (U.S. EPA) (2001a). “Indoor air quality.”Indoor Air Quality: Office of Air and Radiation. 27 February 2001.--- (2001b). “Benefits of the CFC Phase-out.” Stratoshperic Protection Division. 6May 2000. --- (2000). “Liquid Assets 2000: America’s Water Resources at a Turning Point.”EPA-840-B-00-001. Office of Water (4101), United States EnvironmentalProtection Agency, Washington, D.C.--- (1998). “Characterization of Building-Related Construction and DemolitionDebris in the United States.” Office of Solid Waste: Construction andDemolition Debris. 12 October 1999.--- (1996a). “Characterization of Municipal Solid Waste in the United States: 1996Update.” [S.l.: s.n., 1998?]--- (1996b). “National Air Quality and Emissions Trends Report, 1996.” Office of AirQuality and Standards. 26 September 2000.U.S. Green Building Council (2001). “Leadership in Energy and EnvironmentalDesign (LEED).” LEED Home Page. 8 March 2001.Vig, Norman J. and Michael E. Kraft (2000). “Toward Sustainable Development.” InEnvironmental Policy. Edited by Norman J. Vig and Michael E. Kraft.Washington, D.C.: CQ Press.Vitaver, D. (2001). Interviews with an Electrical Generation Systems Specialist.December 28, 2000- March 9, 2001.Wallace, Roberts, and Todd (1992). “University of California, Santa Barbara CampusLandscape Concept Plan.” Commissioned by the Subcommittee on CampusLandscape of the Campus Planning Committee.Weimar, David L. and Aidan R. Vining (1999). Policy Analysis: Concepts andPractice. Upper Saddle River, New Jersey: Prentice Hall.179
Westbrooks R. (1998). Invasive Plants Changing the Landscape of America: FactBook. Washington D.C.: Federal Interagency Committee for the Managementof Noxious and Exotic Weeds.Wetherall, R. (2000). “1999 Net System Power Calculation (1999 California PowerMix).” State of California Resources Conservation and DevelopmentCommission. 29 March 2001. World Business Council for Sustainable Development (1996a). Eco-efficiency andcleaner production: Charting the course to sustainability. Geneva: UnitedNations Environmental Program (UNEP).--- (1996b). Eco-efficient leadership for improved economic and environmentalperformance. Geneva: United Nations Environmental Program (UNEP).World Commission on Environment and Development (WCED) (1987). OurCommon Future. Oxford: Oxford University Press.World Resources Institute (WRI) (2001). World Resources 2000-2001 People andEcosystems: The Fraying Web of Life. 21 March 2001.
Institute for Sustainable Development on Campus: Tools for Campus DecisionMakershttp://iisd1.iisd.ca/educate/National Wildlife Federation: Campus Ecology Programhttp://www.nwf.org/nwf/campusPrinceton Environmental Review Committeehttp://www.perc.eduTulane University Environmental Audithttp://www.tulane.edu/~greenclb/audit/<strong>UCSB</strong> Budget and Planninghttp://bap.ucsb.edu/planning/4.parking.stuff/images/rate1.gifhttp://bap.ucsb.edu/planning/4.parking.stuff/pages/costs.site.htmlhttp://bap.ucsb.edu/planning/4.parking.stuff/images/supply.htmlhttp://bap.ucsb.edu/planning/4.parking.stuff/images/rates.htmlhttp://bap.ucsb.edu/planning/4.parking.stuff/pages/parking.drc.htmlhttp://bap.ucsb.edu/planning/4.parking.stuff/pages/cpc.final.recs.htmlhttp://bap.ucsb.edu/planning/4.parking.stuff/pap/wrkshp.feb.html<strong>UCSB</strong>, Environmental Health and Safetyhttp://ehs.ucsb.edu/<strong>UCSB</strong>, Facilities Managementhttp://facilities.ucsb.edu/University of South Carolinahttp://www.fmc.sc.edu/recycle/env.htm181
182