Report - Economics and Statistics Administration - Department of ...
Report - Economics and Statistics Administration - Department of ...
Report - Economics and Statistics Administration - Department of ...

You also want an ePaper? Increase the reach of your titles
YUMPU automatically turns print PDFs into web optimized ePapers that Google loves.
Digital Economy 2003<strong>Economics</strong> And <strong>Statistics</strong> <strong>Administration</strong>AUTHORSIntroduction .................................................................................................................. Sabrina L. MontesInformation Technologies in the U.S. Economysabrina.montes@esa.doc.govChapter I ............................................................................................................................... David HenryInformation Technology Producing Industries—Hopeful Signs in 2003 david.henry@esa.doc.govDonald Daltondonald.dalton@esa.doc.govChapter II ............................................................................................................................ S<strong>and</strong>ra CookeInformation Technology Workers in the Digital Economys<strong>and</strong>ra.cooke@esa.doc.govChapter III ......................................................................................................................... Dennis PastoreInternational Sales <strong>of</strong> Information Technology Goods <strong>and</strong> Services dennis.pastore@esa.doc.govDonald Daltondonald.dalton@esa.doc.govChapter IV ........................................................................................................................ Jesus DumaganIndustry-Level Effects <strong>of</strong> Information Technologyjesus.dumagan@esa.doc.govUse on Overall ProductivityGurmukh Gillgurmukh.gill@esa.doc.govCass<strong>and</strong>ra Ingramcass<strong>and</strong>ra.ingram@esa.doc.govChapter V .............................................................................................................................. B.K. AtrosticIT <strong>and</strong> Economic Performance:barbara.kathryn.atrostic@census.govEvidence from Micro Data StudiesRon Jarminron.s.jarmin@census.govChapter VI .....................................................................................................................Cass<strong>and</strong>ra IngramInformation Technology’s Role Incass<strong>and</strong>ra.ingram@esa.doc.govLife Sciences Research & DevelopmentGurmukh Gillgurmukh.gill@esa.doc.govChapter VII ....................................................................................................................... Patricia BuckleyDigital Transformation: Information, Interaction, <strong>and</strong> Identitypatricia.buckley@esa.docContributing Editors ..................................................................................................... Sabrina L. Montessabrina.montes@esa.doc.govJeffrey Mayer, Director <strong>of</strong> Policy Developmentjeff.mayer@esa.doc.govvii
DIGITAL ECONOMY 2003Chapter V: IT AND ECONOMIC PERFORMANCE: EVIDENCE FROMMICRO DATA STUDIES ..................................................................................................................... 61What Are Micro Data?...................................................................................................................... 62Benefits <strong>of</strong> Micro Data Research ................................................................................................... 62Research Requires Good Micro Data ............................................................................................ 63The Role <strong>of</strong> Information Technologies in Business Performance ..................................................... 63The Role <strong>of</strong> IT in Productivity—A Brief Survey <strong>of</strong> the Literature .................................................. 64Cause <strong>and</strong> Effect: Does Using IT Make Businesses More Productive? .......................................... 65Does the Business Environment Matter?—International Comparisons .................................... 66Does It Matter How IT Is Used? ................................................................................................... 68Is the Impact <strong>of</strong> IT the Same for All Kinds <strong>of</strong> IT, Everywhere?—Evidence fromStudies <strong>of</strong> Market Structure ...................................................................................................... 70Trucking .................................................................................................................................... 71Residential Real Estate ............................................................................................................. 72The Impact <strong>of</strong> IT on Wages ...................................................................................................... 73Insights from the International Micro Data Initiative .............................................................. 75Better Micro Data Research Requires Better Micro Data ................................................................. 76Conclusion ........................................................................................................................................ 77Chapter Vl: INFORMATION TECHNOLOGY’S ROLE IN LIFE SCIENCESRESEARCH & DEVELOPMENT ........................................................................................................ 81Bioinformatics Is Vital for Advances in the Life Sciences ................................................................ 81The Need for Data Management <strong>and</strong> Analytic IT Tools ............................................................... 82Computing Power <strong>and</strong> Networks ............................................................................................. 83Bioinformatics Assists Drug Discovery <strong>and</strong> Development ............................................................. 84Bioinformatics Is a Key Life Sciences R&D Activity ....................................................................... 85Survey <strong>of</strong> Firms Engaged in Biotechnology Activities .............................................................. 85Public Institutions Support Bioinformatics R&D ............................................................................ 86IT Market <strong>and</strong> Job Opportunities in the Life Sciences ..................................................................... 87Job Opportunities in Bioinformatics .............................................................................................. 88Conclusion ........................................................................................................................................ 89Chapter Vll: DIGITAL TRANSFORMATION:INFORMATION, INTERACTION, AND IDENTITY .......................................................................... 91Information ....................................................................................................................................... 92Search ........................................................................................................................................... 92Archiving ....................................................................................................................................... 93Control .......................................................................................................................................... 94Interactions ....................................................................................................................................... 95Communication <strong>and</strong> Commerce ................................................................................................... 95Communications....................................................................................................................... 96E-Commerce ............................................................................................................................. 97E-Business Process ......................................................................................................................... 97Management................................................................................................................................. 98Enterprise Architecture ............................................................................................................. 99Collaborative Tools................................................................................................................... 99Identity ............................................................................................................................................ 100Security ....................................................................................................................................... 101Identity Theft.......................................................................................................................... 101Computer Crime ..................................................................................................................... 102Authentication ........................................................................................................................ 103Privacy ........................................................................................................................................ 103Conclusion ...................................................................................................................................... 104x
DIGITAL ECONOMY 2003TABLESTable 1.1 IT Producing Industries’ Contribution to Real Economic Growth ................................ 10Table 1.2 Private Fixed Investment ............................................................................................. 13Table 1.3 Shipments, New Orders, <strong>and</strong> Total Inventories for Computers,Communications Equipment <strong>and</strong> Semiconductors, 2003 ............................................. 15Table 1.4 IT-Producing Industries Gross Domestic Product (GDP) by Sector .............................. 16Table 1.5 IT-Producing Industries Inflation Adjusted Output ...................................................... 17Table 1.6 R&D Expenditures, Company-funded .......................................................................... 18Table 2.1 IT-Producing Industry Employment By Major IT Sector............................................... 23Table 2.2 IT Occupational Employment by Education <strong>and</strong> Training Requirement1999 to 2002 .............................................................................................................. 26Table 3.1 U.S. Trade in IT Goods ................................................................................................ 37Table 3.2 U.S. Trade in IT Services .............................................................................................. 38Table 3.3 Sales <strong>of</strong> Foreign Affiliates versus U.S. Exports in 2000 ................................................ 41Table 3.4 Computer Goods Trade Between Related Parties ........................................................ 42Table 4.1 GDP Growth, 1989–2001 ............................................................................................ 47Table 4.2 FTE Growth, 1989–2001 ............................................................................................. 48Table 4.3 Productivity (GDP per FTE) Growth, 1989–2001 ........................................................ 49Table 6.1 Percent <strong>of</strong> Survey Respondents by Biotechnology Activity, 2002 ................................ 86Table 6.2 Number <strong>of</strong> Survey Respondents Indicating Bioinformatics Research Activitiesby Application, 2002 ................................................................................................... 86Table 7.1 Top Three Search Results for “Digital Economy” ........................................................ 93BOXESBox 1.1 Information Technology Producing Industries .............................................................. 10Box 2.1 IT-Related Occupations ............................................................................................... 24Box 5.1 OECD International Micro Data Initiative .................................................................... 66Box 7.1 Challenges for Economic Data Collection: Changes in the Supply Chain .................... 98Box 7.2 E-Gov Initiatives Improving Government through IT: Geospatial One Stop .............. 100xi
DIGITAL ECONOMY 2003FIGURESFigure 1 Private Fixed Investment in Equipment <strong>and</strong> S<strong>of</strong>tware ................................................... 3Figure 2 After-Tax Return to Capital ........................................................................................... 4Figure 3 Non-farm Payroll Employment ...................................................................................... 5Figure 2.1A Index <strong>of</strong> Changes in Industry Employment: IT-Producing Industries <strong>and</strong>All Private Industries .................................................................................................... 20Figure 2.1B IT-Producing Industry Employment Levels (1993 to 2002) ......................................... 21Figure 2.2 IT-Services <strong>and</strong> IT-Manufacturing Employment Year-to-Year Rates <strong>of</strong> Change .......... 22Figure 2.3 IT Occupational Employment, by Education <strong>and</strong> Training Requirement, 2002 ........... 25Figure 2.4 Unemployment Rates in Computer-Related Occupations Compared withPr<strong>of</strong>essional Specialty Occupations <strong>and</strong> the National Average .................................... 29Figure 3.1 U.S. Trade in IT Goods ................................................................................................ 36Figure 3.2 U.S. Trade in Computer-Related Services .................................................................... 39Figure 4.1 Average Annual Productivity Growth Accelerated inNon-farm Business Sector after 1995 .......................................................................... 46Figure 4.2 Labor Productivity Growth in IT-lntensive, Less IT-lntensive <strong>and</strong>All Industries <strong>of</strong> the U.S. Non-Farm Business Sector 1989–2001 ................................ 49Figure 4.3 Contributions to Overall Labor Productivity Growth by IT-lntensive <strong>and</strong> LessIT-lntensive Industries <strong>of</strong> the U.S. Non-farm Business Sector 1990-2001 ................... 50Figure 4.4 Contributions to Labor Productivity Growth in U.S. Non-Farm Business Sectorby Major Industry Group 1989–2001 .......................................................................... 51Figure 4.5 Contributions to Labor Productivity Growth in U.S. Non-Farm Business Sectorby Major Industry Group, 2001................................................................................... 52Figure 4.6 Contributions to Productivity Growth Acceleration in U.S. Non-Farm Business Sectorby Major Industry Group 1995–2001 Over 1989–1995 ............................................. 53Figure 5.1 Differences in Productivity Outcomes between Germany <strong>and</strong> the United States ........ 68Figure 5.2 Computer Networks Were Common in U.S. Manufacturing Industries in 1999,But Sophisticated Network S<strong>of</strong>tware Was Not ............................................................ 69Figure 6.1 Bioinformatics Uses Information Technology to Manage <strong>and</strong>Analyze Information Generated by the Life Sciences .................................................. 82Figure 6.2 Number <strong>of</strong> Transistors per Integrated Circuit vs. DNA Sequences in Genbank ........... 83APPENDICESAppendix 2.A The North American Industrial Classification System ................................................... 33Appendix 4.A Data <strong>and</strong> Methods....................................................................................................... 55Appendix 4.B IT-lntensity Rankings ................................................................................................... 57Appendix 4.C Comparison With Other Studies on IT’s Role inU.S. Productivity Growth Acceleration ........................................................................ 59Appendix 5.A Conducting Micro Data Research on the Impact <strong>of</strong> IT ................................................ 79xii
PrefaceKathleen B. Cooper, Under Secretary for Economic AffairsDigital Economy 2003 (DE2003) is the <strong>Department</strong>’s fifth annual report on conditions in U.Sinformation technology (IT) industries <strong>and</strong> the effects <strong>of</strong> IT on national economic performance.Each <strong>of</strong> these reports has addressed questions that economists have sometimes found difficult toanswer. Early nineteenth-century economists earned a reputation as practitioners <strong>of</strong> the “dismalscience” by underestimating the ability <strong>of</strong> technological innovation to drive faster than expectedeconomic growth. This year, the basic analytic challenge has been complicated by an atypicalrecovery. Productivity growth has been remarkably strong, output growth has gatheredimpressive momentum, <strong>and</strong> prices remain low. But employment has lagged. DE2003 examinesIT’s role in these unusual developments.Important developments that we anticipated (or hoped for) in our 2002 report have come topass. Renewed IT investment <strong>and</strong> strong if selective growth in IT-producing industries havehelped the sector reassert its role as an engine <strong>of</strong> economic growth. In addition, strongproductivity growth during <strong>and</strong> after the 2001 recession has answered the challenge posed fouryears ago by Robert Solow when he suggested that IT’s enduring effects on productivity wouldbe clear only when the economy had weathered its first IT-era recession.DE2003 shows that: (i) recovery in IT-producing industries <strong>and</strong> increased use <strong>of</strong> IT throughoutthe economy are once again helping to drive very rapid productivity <strong>and</strong> output growth; (ii)employment growth in IT industries <strong>and</strong> IT occupations has yet to recover; (iii) highlycompetitive U.S. IT-producing industries are globally integrated; <strong>and</strong> (iv) even as we begin totake its presence for granted, IT continues to alter our lives, exp<strong>and</strong>ing our choices, <strong>and</strong>presenting us with new opportunities <strong>and</strong> challenges. In short, our continuing study shows thatthe digital era is living up to many <strong>of</strong> our expectations <strong>and</strong> hopes. But there is much more tounderst<strong>and</strong> about IT’s role in our growing <strong>and</strong> changing economy.xiii
INTRODUCTION:INFORMATION TECHNOLOGIESIN THE U.S. ECONOMYBy Sabrina L. Montes *In the late 1990s, the U.S. economy achieved performance levels unseen for a generation.Strong output <strong>and</strong> productivity growth accompanied low inflation <strong>and</strong> healthy employmentgrowth. Then <strong>and</strong> now, economic research has suggested that investment in <strong>and</strong> use <strong>of</strong>information technologies (IT) played a role in bringing about that happy macroeconomicsituation. Some observers, however, were skeptical <strong>of</strong> whether the observed changes wouldendure—<strong>and</strong> especially whether long-term trends in measures like labor productivity growthhave indeed improved. They wanted, for instance, to see how the economy would fare as itmoved through a business cycle.The economy has passed through that test with a shallow, 8-month recession beginning inMarch 2001. However, the recession <strong>and</strong> post-recession period have been atypical. During therecession, real gross domestic product (GDP)—buoyed by consumer spending <strong>and</strong> a stronghousing market—did not decline as much as during a typical recession. However, real businessinvestment declined faster <strong>and</strong> more deeply <strong>and</strong> the job losses stayed higher longer than duringan average recession. The job market has remained stubbornly weak in the post-recessionperiod, <strong>and</strong> the U.S. economy has endured an extended period <strong>of</strong> modest output growth thatonly recently has begun to improve. On the other h<strong>and</strong>, throughout the recession <strong>and</strong> the postrecessionperiod, inflation has remained low <strong>and</strong> labor productivity growth has been strong.In addition, questions persist about the impact <strong>of</strong> IT on the U.S. economy. Do the economicforces that were at work during the latter half <strong>of</strong> the 1990s still resonate in our current economicsituation? Three questions, in particular, st<strong>and</strong> out: What are the prospects for IT producers?How are IT workers faring in the current slack job market? And, do investment in <strong>and</strong> use <strong>of</strong> IT* Ms. Montes (sabrina.montes@esa.doc.gov) is an economic policy analyst in the Office <strong>of</strong> Policy Development, Office<strong>of</strong> the Chief Economist, <strong>Economics</strong> <strong>and</strong> <strong>Statistics</strong> <strong>Administration</strong>.1
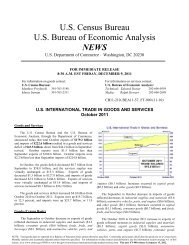
DIGITAL ECONOMY 2003still play a comm<strong>and</strong>ing role in U.S. economic activity? The desire to illuminate these questionsunderlies this report.IT ProducersSince the mid-1990s, the IT-producing sector has been vital to U.S. output growth. On average,between 1996 <strong>and</strong> 2000, IT producing industries, which represented between 8 <strong>and</strong> 9 percent <strong>of</strong>the economy, supplied an average annual 1.4 percentage points to the nation’s 4–5 percent realannual output growth. We estimate IT producers’ contribution to economic growth dropped to0.1 percentage point <strong>of</strong> the estimated 2.3 percent growth rate in 2002. However, IT producers’contribution to economic growth revived in 2003, as growth in both the overall economy <strong>and</strong> inparts <strong>of</strong> the IT producing sector, improved. In 2003, IT producers contributed 0.8 percentagepoint to the estimated 2.9 percent growth rate. (Chapter 1.)Since 2000, however, some IT producers have been struggling. IT manufacturing nominaloutput reached a peak in 2000. It began declining prior to the recession <strong>and</strong> has continued todecline through most <strong>of</strong> the post-recession period. Growth slowed dramatically in IT servicesindustries—but did not actually decline.The situation for IT-producing industries also differed by market segment. The consumermarket did not slow significantly, reflecting strong consumer spending throughout the recession<strong>and</strong> post-recession period. Indeed, while many firms in today’s IT sector continue to struggle,corporate sales <strong>and</strong> pr<strong>of</strong>it reports suggest that companies selling consumer-oriented technologiesare seeing strong sales <strong>and</strong> earnings growth. 1The business market segment fared much worse. Products produced by IT firms make up a large<strong>and</strong> growing share <strong>of</strong> total business investment in equipment <strong>and</strong> s<strong>of</strong>tware. While overallinvestment spending is still high relative to historic levels, spending has dropped <strong>of</strong>f since 2000<strong>and</strong> has only recently begun to recover. (Figure 1.)Although current growth rates <strong>of</strong> business investment rival those that occurred during the latterhalf <strong>of</strong> the 1990s, it may take a while to see the levels reached during that period. Arguably,there were a number <strong>of</strong> one-time only factors driving investment during those years. Forexample, the investment associated with the year 2000 conversion, the initial build out <strong>of</strong> theInternet, <strong>and</strong> a post-deregulation surge in telecommunications spending will not occur again.On the other h<strong>and</strong>, it is impossible to foresee future events that might have the same positiveeffect on business IT spending.Some observers have suggested that the high levels <strong>of</strong> overall business investment at the end <strong>of</strong>the 1990s <strong>and</strong> into 2000 reflect some over-investment in IT, or even an IT investment bubble.This resulted from the stock market bubble, which reduced the cost <strong>of</strong> capital to firms, <strong>and</strong> theinitial exuberance associated with the Internet <strong>and</strong> dot.com companies, which encouraged1Ken Belson, “Consumer Electronics Surge Ahead <strong>of</strong> Office Computers,” New York Times, 1 Aug. 2003.2
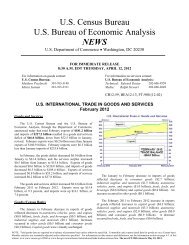
DIGITAL ECONOMY 20031,200Figure 1.Private Fixed Investment in Equipment <strong>and</strong> S<strong>of</strong>tware(nominal dollars)Total Equipment <strong>and</strong> S<strong>of</strong>tware Investment$ Billions (nominal, seasonally adjusted, annual rate)1,000800600400200RecessionJuly 1990toMarch1991Other EquipmentInformation ProcessingEquipment <strong>and</strong> S<strong>of</strong>twareRecessionMarch 2001toNovember2001090Q191Q192Q193Q194Q195Q196Q197Q198Q199Q100Q101Q102Q103Q1Source: Bureau <strong>of</strong> Economic Analysis, National Income <strong>and</strong> Product Accounts, Table 5.4.IT (Information processing equipment <strong>and</strong> s<strong>of</strong>tware) represents a large (40–45 percent) <strong>and</strong> stableshare (in nominal dollars) <strong>of</strong> business spending on equipment <strong>and</strong> s<strong>of</strong>tware. Since IT equipment hasseen rapid price declines relative to other equipment, IT’s contribution to real business investment hasgrown. Overall investment spending—<strong>and</strong> consequently IT spending—peaked in 2000 <strong>and</strong> has onlyrecently begun to recover.investment in IT. 2 Such over-investment, if it indeed occurred, would foreshadow a longerrecovery period for IT producers because businesses would need to work <strong>of</strong>f the IT investmentoverhang before renewing IT investments.Evidence <strong>of</strong> over-investment is mixed. For example, one would expect falling pr<strong>of</strong>its toaccompany over-investment or an investment bubble because such retrospectively unwiseinvestments would not earn returns at the same rate as more rational investments.In fact, the pr<strong>of</strong>it data are ambiguous. After-tax returns to capital—a basic measure <strong>of</strong> pr<strong>of</strong>itspeaked in 1997 at 8.1 percent <strong>and</strong> fell to 5.5 percent in 2001, which is consistent with someover-investment. However, the levels <strong>of</strong> after-tax return to pr<strong>of</strong>its are still higher than the levelthat prevailed during the mid-1980s. (Figure 2.) This overall increase is consistent with capital2Kevin J. Lansing, “Growth in the Post-Bubble Economy,” Federal Reserve <strong>of</strong> San Francisco Economic Letter 2003-17(2003) (http://www.frbsf.org/publications/economics/letter/index.html).3
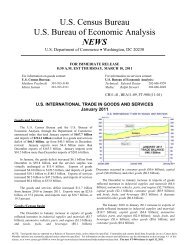
DIGITAL ECONOMY 2003Figure 2.After-Tax Return to CapitalAfter-Tax Corporate Pr<strong>of</strong>its as a Share <strong>of</strong> Capital Stock (percent)1098765432101960196519701975198019851990ShadedAreasIndicateRecessions19952000Source: Bureau <strong>of</strong> Economic AnalysisAfter-tax return to capital—the ratio <strong>of</strong> after-tax corporate pr<strong>of</strong>its to the value <strong>of</strong> the corporate capitalstock (current cost)—achieved a local peak <strong>of</strong> 8.1 percent in 1997. The measure has since declined.Levels remain higher than during the mid-1980s.becoming more efficient (for example via technological change), <strong>and</strong> more pr<strong>of</strong>itable—i.e.,consistent with the conclusion that IT investments in the 1997–2001 period were not excessive.Declining IT investment <strong>and</strong> retrenchment among IT-producers were among the reasons for ITrelatedjob losses throughout the economy. (Chapter 2.) In the IT producing sector itself, thenumber <strong>of</strong> jobs fell by 10.7 percent during 2002. Preliminary 2003 data suggest no improvement.The Employment SituationJob losses in the IT-producing sector are part <strong>of</strong> a larger picture <strong>of</strong> job losses <strong>and</strong> slowemployment growth economy-wide that has been the conundrum <strong>of</strong> the post-recession period.(Figure 3.)The current employment situation is complex. First, there is always churn in employment.Lay<strong>of</strong>fs in one industry are <strong>of</strong>ten <strong>of</strong>fset by new hires in another, <strong>and</strong> there are always peoplelooking for work <strong>and</strong> firms seeking workers. Employment in the bioinformatics field is a casein point. (Chapter 6.) Even in the current, relatively slack job market, firms in this field—whichmerges IT capabilities with life science research <strong>and</strong> development—continue to seek workers.4
DIGITAL ECONOMY 2003Figure 3.Non-farm Payroll EmploymentChange from previous month in thous<strong>and</strong>s600Change from Previous Month (thous<strong>and</strong>s <strong>of</strong> jobs)5004003002001000-100-200-300RecessionMarch 2001toNovember2001-4001998 1998 1999 2000 2001 2002 2003Source: Bureau <strong>of</strong> Labor <strong>Statistics</strong>, Employment Situation, Table B.Since the 2001 recession, U.S. workers have experienced a slack job market for an extended period.The employment picture has only recently begun to improve.Second, there is some evidence that structural changes in employment may be occurring in theU.S. economy. A recent study by the Federal Reserve Bank <strong>of</strong> New York suggests that, duringthis recession <strong>and</strong> post-recession period, there have been permanent shifts in employmentamong various industries. 3 Research presented in Chapter 4 suggests some possibility <strong>of</strong> ITdrivenstructural changes. Among industries that invest intensively in IT, employees inmanagement <strong>and</strong> <strong>of</strong>fice administrative support occupations appear to account for most <strong>of</strong> the2001 employment losses. Anecdotal evidence has long suggested that occupations such as theseare vulnerable to elimination when routine tasks are automated. In addition, this <strong>and</strong> previousDigital Economy reports have found evidence that, in a number <strong>of</strong> occupations, the use <strong>of</strong> IT isassociated with dem<strong>and</strong> for workers with higher skill levels.Third, some businesses have moved certain operations overseas. The practice, called <strong>of</strong>fshoring,has long been associated with manufacturing firms. Anecdotal evidence now suggests that3Erica L. Groshen <strong>and</strong> Simon Potter, “Has Structural Changes Contributed to a Jobless Recovery?,” Current Issues in<strong>Economics</strong> <strong>and</strong> Finance, Federal Reserve Bank <strong>of</strong> New York, 9–8 (2003) (http://www.newyorkfed.org/research/current_issues/ci9-8.html).5
DIGITAL ECONOMY 2003cheaper communications costs <strong>and</strong> increasing IT skills abroad enable the <strong>of</strong>fshoring <strong>of</strong> someservices. Many U.S. call centers, for example, are now located in countries like India that havea highly skilled, English-speaking labor pool. Although there are widely ranging privateestimates <strong>of</strong> this phenomenon, hard statistical evidence is lacking.U.S. foreign direct investment, which produces jobs in other countries, is part <strong>of</strong> a larger pattern<strong>of</strong> globalization. (Chapter 3.) The IT-producing sector, for example, is composed <strong>of</strong> firms thatoperate globally. The sector depends on a network <strong>of</strong> foreign affiliates to meet dem<strong>and</strong> in bothU.S. <strong>and</strong> foreign markets. It is clearly a vital <strong>and</strong> usually vibrant sector <strong>of</strong> the U.S. economy, yetit runs a large <strong>and</strong> increasing trade deficit.Labor Productivity Growth <strong>and</strong> Firm PerformanceA recent Bureau <strong>of</strong> Labor <strong>Statistics</strong> report indicates that overall lay<strong>of</strong>fs peaked during 2001 <strong>and</strong>have since decreased. The current employment situation stems largely from slow job creation. 4Businesses are simply not hiring. One factor in businesses’ ability to delay hiring <strong>and</strong>simultaneously increase output is the continued strong growth <strong>of</strong> labor productivity.Labor productivity is the amount <strong>of</strong> output produced by the labor force in a period <strong>of</strong> time (e.g.,one widget per worker per hour). For example, the labor productivity growth rate measures theincrease in output achieved using the same number <strong>of</strong> workers over time (or a stable outputachieved using fewer workers). The trend rate <strong>of</strong> labor productivity growth is also a key longrunmeasure <strong>of</strong> the improvement in people’s st<strong>and</strong>ards <strong>of</strong> living.Around 1995, the labor productivity growth rate accelerated (see Chapter 4, Figure 4.1).Economists are keenly interested in determining what caused this acceleration <strong>and</strong> whether thisnew, faster rate <strong>of</strong> labor productivity growth is sustainable. Insights into these questions areemerging as the research has exp<strong>and</strong>ed.A growing body <strong>of</strong> evidence suggests that investment in <strong>and</strong> use <strong>of</strong> IT have played a role in therecent, strong labor productivity growth. Analysis in Chapter 4 shows that U.S. industries thathave invested relatively more in IT equipment contribute more to productivity growth than thosethat are less IT-intensive in their investments.In addition, since the mid-1990s, popular consensus has held that businesses that invest in IT aremore productive <strong>and</strong> perform better than businesses that do not invest in IT. Economists,however, have argued that simply purchasing IT will not necessarily yield benefits; additionalinvestments, such as the reorganization <strong>of</strong> workflow <strong>and</strong> re-training the labor force are alsonecessary.To underst<strong>and</strong> more clearly the role <strong>of</strong> IT in this phenomenon, we need a clearer underst<strong>and</strong>ing4U.S. <strong>Department</strong> <strong>of</strong> Labor, Bureau <strong>of</strong> Labor <strong>Statistics</strong>, New Quarterly Data on Business Employment Dynamics fromBLS (Washington, DC, 30 Sept. 2003) (http://www.bls.gov/news.release/cewbd.toc.htm).6
DIGITAL ECONOMY 2003<strong>of</strong> how IT is being used within businesses. New micro-level research indicates that ITinvestments do contribute positively to firm performance in many, but not all, settings. They doso, however, in t<strong>and</strong>em with many other factors, such as firm ownership structure, managementpractices, worker training, <strong>and</strong> willingness to innovate. (Chapter 5.)IT Continues to Transform the EconomyThe lingering questions about long-term economic change <strong>and</strong> the difficulties that the ITproducingsector has faced since 2000 should not be confused with a decline in the importance <strong>of</strong>IT in the economy today. IT producers invest intensively in research <strong>and</strong> development (Chapter 1)<strong>and</strong> those investments have yielded dramatic advances in data processing, storage, <strong>and</strong>transmission capabilities. These IT-related innovations have <strong>and</strong> are diffusing through the U.S.economy in computers, communications equipment, s<strong>of</strong>tware, <strong>and</strong> other products. Use <strong>of</strong> thesetechnologies is transforming many aspects <strong>of</strong> our economy, our society, <strong>and</strong> our day-to-day lives.Many <strong>of</strong> today’s most important life sciences discoveries, such as the mapping <strong>of</strong> the humangenome, can be traced back to the use <strong>of</strong> computers to process enormous quantities <strong>of</strong> data. Theintersection <strong>of</strong> traditional life sciences with IT-enabled data processing capabilities has, in fact,spawned new fields, such as bioinformatics. This field is notable for the increasing number <strong>of</strong>collaborations between life science <strong>and</strong> IT researchers that seek to advance the frontier <strong>of</strong> ITcapabilities in the interest <strong>of</strong> advancing life sciences research <strong>and</strong> development. (Chapter 6.)Even in fields less closely wedded to IT capabilities, IT is widely used. For example, manybusinesses rely on IT equipment to support a substantial share <strong>of</strong> their transactions. In 2001, e-commerceshipments accounted for $725 billion or 18.3 percent <strong>of</strong> manufacturers’ shipments (i.e., thebusinesses relied on computer networks for the exchange <strong>of</strong> shipping <strong>and</strong> purchasing data).Similarly, in 2001, e-commerce sales represented 10 percent <strong>of</strong> sales by merchant wholesalers. 5Individuals rely on these technologies as well. Over 60 percent <strong>of</strong> the U.S. population usescomputers <strong>and</strong> over 50 percent <strong>of</strong> the U.S. population uses the Internet at home, work, or both. 6Like any new technology, the capabilities made possible by IT are accompanied by challengesthat must be resolved in order to fully realize its benefits. (Chapter 7.) As individuals, we arenow able to access a vast amount <strong>of</strong> data. However, many issues remain with regard tosearching, archiving, <strong>and</strong> controlling or limiting access to certain information. New managementchallenges accompany new means <strong>of</strong> interaction, such as e-commerce <strong>and</strong> e-businessprocesses (e.g., business-to-business data exchange). And, finally, issues related to identity—from identity theft to privacy <strong>and</strong> rights to anonymity—intersect with almost all IT capabilities.5U.S. Bureau <strong>of</strong> the Census, E-commerce 2001 Highlights, 19 March 2003 (http://www.census.gov/eos/www/papers/2001/2001estatstext.pdf).6U.S. <strong>Department</strong> <strong>of</strong> Commerce, A Nation Online, How Americans Are Exp<strong>and</strong>ing Their Use <strong>of</strong> the Internet, Feb. 2002(http://www.ntia.doc.gov/ntiahome/dn/index.html).7
CHAPTER I:INFORMATION TECHNOLOGY PRODUCINGINDUSTRIES—HOPEFUL SIGNS IN 2003By David Henry <strong>and</strong> Donald Dalton *After two years <strong>of</strong> retrenchment, IT-producing industries (Box 1.1. 1 ) now show signs <strong>of</strong>resuming the dynamic role they played during 1996–2000. Based on evidence through the thirdquarter <strong>of</strong> 2003, we estimate that, during 2003, IT-producing industries, which account forabout 8 percent <strong>of</strong> U.S. GDP, contributed 0.8 percentage points <strong>of</strong> the estimated 2.9 percent rate<strong>of</strong> real U.S. economic growth. (Table 1.1.)Published data on recent spending for IT goods <strong>and</strong> services, <strong>and</strong> our estimates <strong>of</strong> IT productionfor 2002 <strong>and</strong> 2003 indicate: (1) while computer <strong>and</strong> semiconductor manufacturers have begunto rebound from major output losses suffered in 2001–2002, communications equipmentmakers show continued weakness; (2) IT service industries, which grew faster than ITmanufacturing industries during 1996–2000, continued to grow during the economic slowdown<strong>of</strong> 2001–2002 though at a reduced rate, <strong>and</strong> contributed to the mildness <strong>of</strong> the recession; <strong>and</strong>(3), in 2003, IT producing industries became once again an important ingredient in an overallU.S. economic expansion. 2* Mr. Henry (david.henry@esa.doc.gov) is a senior industry analyst <strong>and</strong> Mr. Dalton (donald.dalton@esa.doc.gov) is aneconomist in the Office <strong>of</strong> Policy Development, Office <strong>of</strong> the Chief Economist, <strong>Economics</strong> <strong>and</strong> <strong>Statistics</strong> <strong>Administration</strong>.1The industries listed in Text Box 1, above, are classified under the 1997 North American Industry Classification System(NAICS). Production data do not yet exist based on the 2002 version <strong>of</strong> the NAICS.2Estimates <strong>of</strong> IT industry output (GDP by industry) for 2002 <strong>and</strong> 2003 are based on quarterly National Income <strong>and</strong>Product Accounts data <strong>and</strong> monthly production indicators through the first nine months <strong>of</strong> 2003. The Bureau <strong>of</strong> EconomicAnalysis (BEA) publishes quarterly data on types <strong>of</strong> spending by businesses, consumers, <strong>and</strong> governments (Federal, state,<strong>and</strong> local) on IT equipment, s<strong>of</strong>tware, <strong>and</strong> communication services. The Census Bureau publishes monthly shipments,new orders <strong>and</strong> changes in inventories for computers, semiconductors, <strong>and</strong> communications equipment. Annual industrydata for 2003 will become available in 2005. Likewise, industry data from the Census Bureau’s economic (business)census for 2002 will become available in 2004. (See the Digital Economy 2003 Technical Appendices (http://www.esa.doc.gov/reports.cfm) for the method used to estimate IT producing industry output in 2002 <strong>and</strong> 2003.)9
DIGITAL ECONOMYTable 1.1.IT Producing Industries’ Contribution to Real Economic GrowthActual <strong>and</strong> Estimated1997 1998 1999 2000 2001 2002* 2003*(Percent)(1) Changes in Real Gross Domestic Product 3 4.5 5.0 4.2 4.7 0.1** 2.3 2.9(Percentage Points)(2) IT Contribution 1.5 1.6 1.5 1.1 0.1 0.1 0.8(3) All Other Industries 3.0 3.4 2.7 3.6 0.0 2.2 2.1Notes: *Estimates based on Census <strong>and</strong> BEA data.** The table attributes the entire 0.1 percent change in GDP in 2001 to IT industries because numbers have been rounded tothe nearest tenth. In 2001, if we round to the nearest hundredth, the IT share <strong>of</strong> GDP change is 72 percent. Estimates forother years are not affected. See the Digital Economy 2003 Technical Appendices for additional information.Box 1.1. Information Technology Producing IndustriesHardware IndustriesComputers <strong>and</strong> equipmentWholesale trade <strong>of</strong> computers <strong>and</strong> equipment*Retail trade <strong>of</strong> computers <strong>and</strong> equipment*Calculating <strong>and</strong> <strong>of</strong>fice machinesMagnetic <strong>and</strong> optical recording mediaElectron tubesPrinted circuit boardsSemiconductorsPassive electronic componentsIndustrial instruments for measurementInstruments for measuring electricityLaboratory analytical instrumentsCommunications Equipment IndustriesHousehold audio <strong>and</strong> video equipmentTelephone <strong>and</strong> telegraph equipmentRadio <strong>and</strong> TV communications equipmentS<strong>of</strong>tware/Services IndustriesComputer programmingPrepackaged s<strong>of</strong>twareWholesale trade <strong>of</strong> s<strong>of</strong>tware*Retail trade <strong>of</strong> s<strong>of</strong>tware*Computer-integrated system designComputer processing, data preparationInformation retrieval servicesComputer services managementComputer rental <strong>and</strong> leasingComputer maintenance <strong>and</strong> repairComputer related services, necCommunications Services IndustriesTelephone <strong>and</strong> telegraph communicationsCable <strong>and</strong> other TV services*Wholesale <strong>and</strong> retail from computer manufacturer sales from branch <strong>of</strong>fices. See the Digital Economy 2003 TechnicalAppendices (http://www.esa.doc.gov/reports.cfm).3Gross domestic product is estimated by gross domestic income; see “Gross Domestic Product by Industry for 1999–2001,” Survey <strong>of</strong> Current Business (November 22, 2002), p. 23, Box.10
DIGITAL ECONOMYThe following sections examine: the growth <strong>and</strong> recomposition <strong>of</strong> output <strong>of</strong> IT industries;recent indicators <strong>of</strong> increasing dem<strong>and</strong> for IT goods <strong>and</strong> services (i.e., investment patterns <strong>and</strong>manufacturers’ shipments, new orders <strong>and</strong> inventories); IT industries’ contributions to outputgrowth; <strong>and</strong> IT industries’ contribution to U.S. research <strong>and</strong> development spending.IT Producing Industries Weather the Recession<strong>and</strong> Recover SlowlyOn average, between 1996 <strong>and</strong> 2000, IT producing industries, which represented between 8 <strong>and</strong>9 percent <strong>of</strong> the economy, 4 supplied 1.4 percentage points <strong>of</strong> the Nation’s 4.6 percent annualaverage real GDP growth. 5 In 2001, IT-producing industries grew a scant 0.9 percent, though ina recession year that was still enough to account for practically all <strong>of</strong> the Nation’s 0.3 percenteconomic growth. Overall, continued strength in IT producing industries, particularly communicationsservices, helped to keep the recession comparatively mild.In 2002, the U.S. economy gathered momentum, growing at over 2 percent. Unlike the 1996–2000 period, however, developments in IT producing industries were not a driving force. Lossesin these industries, which had begun in 2001, accelerated in 2002; in the sector as a whole,revenues declined almost as rapidly in these two years as they had increased in the prior four.The poor showing was due largely to the slow recovery <strong>of</strong> business spending for capitalequipment. Unlike the investment-led expansion <strong>of</strong> 1996–2000, growth in 2002 was drivenmainly by increases in personal consumption, changes in private inventories, <strong>and</strong> governmentspending. Almost none <strong>of</strong> the real growth <strong>of</strong> the U.S. economy in 2002 reflected output growthfrom the IT-producing industries.Happily, the investment picture has begun to change. Recent evidence indicates that businessesare once again investing in IT capital equipment. However, the pattern <strong>of</strong> recovery in 2003contrasts with experience in 1996–2000. In the goods producing sector, renewed strength isconcentrated in computers <strong>and</strong> semiconductors; while shipments <strong>of</strong> communications equipmenthave continued to decline. (These trends are detailed below in the section on IT manufacturers’shipments, new orders, <strong>and</strong> inventories <strong>and</strong> in Table 1.3.)The services <strong>and</strong> s<strong>of</strong>tware component <strong>of</strong> the IT-producing sector—which continued to growduring the economic slowdown <strong>of</strong> 2001 <strong>and</strong> the slowly developing recovery <strong>of</strong> 2002—continued to grow as well in 2003. But because IT service industries weathered the recession<strong>and</strong> its aftermath without sharply declining output, they are unlikely to rebound to the doubledigitgrowth rates achieved during 1997–2000 as the current recovery gains strength. (Apossible exception is the communications services industry, which appeared to grow at aboutthe same rate in 2003 as it did during 1997–2000.)4See Table A-1.2. Digital Economy 2003 Technical Appendices (http://www.esa.doc.gov/reports.cfm).5Gross Domestic Income (GDI) is used in this calculation in place <strong>of</strong> GDP since we use GDP by industry as a measure<strong>of</strong> the industries’ outputs. The sum <strong>of</strong> all industries’ GDP by industry is equal to GDI. GDI <strong>and</strong> GDP should theoreticallybe the same, but are not because <strong>of</strong> some statistical discrepancies.11
DIGITAL ECONOMYAs a consequence <strong>of</strong> continued, if slower growth in IT service industries, <strong>and</strong> the period <strong>of</strong>negative growth in IT goods industries, the composition <strong>of</strong> IT-producing industry output hasbecome significantly more concentrated in services. In 1996, IT s<strong>of</strong>tware <strong>and</strong> computer services<strong>and</strong> communications services represented about 59 percent <strong>of</strong> the total output (nominal dollars)<strong>of</strong> IT-producing industries. We estimate that in 2003, the output share <strong>of</strong> s<strong>of</strong>tware <strong>and</strong> ITservices industries increased to 71 percent.The shift toward services in the composition <strong>of</strong> IT output suggests that future growth in the ITsector may be more modest <strong>and</strong> less volatile than in the past. We estimate that, between 2001<strong>and</strong> 2003, the output <strong>of</strong> the IT S<strong>of</strong>tware <strong>and</strong> Computer services sector, on average, increased by1.3 percent per year. The IT Communications services sector increased, on average, 4.8 percentper year. In contrast, output growth in the IT Hardware <strong>and</strong> IT Communications equipmentsectors fluctuated between double-digit declines <strong>and</strong> single-digit increases.Our estimates <strong>of</strong> IT-producing industries’ 2003 output are based on available first-, second-, <strong>and</strong>third-quarter data on dem<strong>and</strong> for IT goods <strong>and</strong> services, <strong>and</strong> industry production indicatorsthrough the first nine months <strong>of</strong> the year. This section <strong>of</strong> the chapter <strong>and</strong> the one that followslook at available dem<strong>and</strong> data <strong>and</strong> production indicators. A third section uses these data <strong>and</strong>indices to estimate the performance <strong>of</strong> IT producing industries for the year as a whole.Dem<strong>and</strong> for IT Goods <strong>and</strong> Services Through theThird Quarter <strong>of</strong> 2003Business spending for equipment <strong>and</strong> s<strong>of</strong>tware represents the largest source <strong>of</strong> dem<strong>and</strong> for thehardware <strong>and</strong> communication equipment portion <strong>of</strong> the IT-producing sector. In the third quarter<strong>of</strong> 2003, businesses were buying IT equipment <strong>and</strong> s<strong>of</strong>tware (information processing (IP) inTable 1.2) at a $446 billion annual rate (seasonally adjusted), with IT spending accounting forhalf <strong>of</strong> all business investment in new equipment. In the second quarter, business investment inIT equipment <strong>and</strong> s<strong>of</strong>tware contributed about 21 percent <strong>of</strong> the overall 3.3 percent real GDPgrowth <strong>and</strong> in the third quarter contributed 10 percent <strong>of</strong> the 8.2 percent GDP growth. Incontrast, during 2002 as a whole, business spending for IT equipment <strong>and</strong> s<strong>of</strong>tware contributedonly 4 percent <strong>of</strong> the total 2.4 percent increase in GDP.Reversing declines in 2001–2002, business spending for IT equipment <strong>and</strong> s<strong>of</strong>tware rosethrough the third quarter <strong>of</strong> 2003 by a quarterly average <strong>of</strong> 2.3 percent. (Table 1.2.) Spending inthe second quarter was up 3.7 percent over the previous quarter <strong>and</strong> 4.5 percent in the thirdquarter. In the third quarter <strong>of</strong> 2003, spending on computers <strong>and</strong> equipment rose 7.3 percentfollowing an 8.0 percent increase in the second quarter. Business spending for s<strong>of</strong>tware roseover 2 percent in the second <strong>and</strong> 4 percent in the third quarter. In addition, following a 14percent decline in 2001 <strong>and</strong> a 5 percent decline in 2002, spending for other IT equipment roseover 3 percent for each <strong>of</strong> the three quarters <strong>of</strong> 2003.12
DIGITAL ECONOMYTable 1.2.Private Fixed Investment2001 <strong>and</strong> 2002 Annual Growth Rates<strong>and</strong> 2003-I, 2003-II, <strong>and</strong> 2003-III Quarterly Growth Rates* (percent)2001 2002 2003-1* 2003-II* 2003-III*Private Fixed Investment –2.7 –3.5 0.4 1.5 4.1Nonresidential structures <strong>and</strong> equipment –5.1 –7.0 –1.2 1.4 3.4Nonresidential structures 3.3 –17.0 0.3 0.9 0.5Nonresidential equipment <strong>and</strong> s<strong>of</strong>tware –7.8 –3.3 –1.7 1.5 4.2Information processing (IP)equipment <strong>and</strong> s<strong>of</strong>tware –9.5 –1.1 1.4 3.7 4.5Computers <strong>and</strong> peripheral equipment –20.5 0.0 1.2 8.0 7.3S<strong>of</strong>tware 0.6 1.3 0.2 2.1 4.0Other IP equipment <strong>and</strong> s<strong>of</strong>tware –14.0 –4.7 3.0 3.4 3.5Industrial equipment –3.6 –4.3 –1.1 –0.1 1.5Transportation equipment –12.6 –10.2 –10.4 –2.6 4.2Other equipment –1.4 –0.4 –1.6 –1.1 6.3Residential 4.4 6.1 4.3 1.7 5.7Note: *Current quarter over previous quarter, billions <strong>of</strong> current dollars, seasonally adjusted at annual rates.Source: BEA, Table 5.4, Private Fixed Investment by Type.While business investment is the major source <strong>of</strong> IT dem<strong>and</strong>, the market for IT goods <strong>and</strong>services is broad <strong>and</strong> varied. Non-investment sources <strong>of</strong> dem<strong>and</strong> for IT goods <strong>and</strong> servicesinclude businesses’ purchase <strong>of</strong> IT goods <strong>and</strong> services (e.g., computer <strong>and</strong> communicationsservices), personal consumption, <strong>and</strong> government spending:• In 2002, in addition to investing in IT equipment <strong>and</strong> s<strong>of</strong>tware, businesses spent approximately$270 billion on communications services, up from $258 billion in 2001. 6 Foraccounting purposes, these expenditures are considered current expenses (i.e., costs <strong>of</strong>production) rather than investment spending. Nonetheless, business spending on communicationsservices constitutes the second most important market for IT-producing industries(after business investment).• Personal consumption provides a second <strong>and</strong> growing (non-investment) market for IT goods<strong>and</strong> services. In the second quarter <strong>of</strong> 2003, personal consumption <strong>of</strong> IT goods <strong>and</strong> servicesalmost certainly continued to rise. 7 In the second quarter <strong>of</strong> 2003, personal consumption in6We have not provided estimates <strong>of</strong> business spending for communications through the first half <strong>of</strong> 2003 since we haveno current data available to make these estimates. This spending is, however, incorporated into our overall estimate <strong>of</strong> ITproducing industry output for 2003. Business spending estimates for 2001 <strong>and</strong> 2002 are provided here to give themagnitude <strong>and</strong> direction <strong>of</strong> this type <strong>of</strong> spending in the previous two years. See the Digital Economy 2003 TechnicalAppendices (http://www.esa.doc.gov/reports.cfm).7Table 2.2, Personal Consumption Expenditures by Major Type <strong>of</strong> Product <strong>and</strong> Table 2.6, Personal Consumption Expendituresby Type <strong>of</strong> Product, Bureau <strong>of</strong> Economic Analysis, http://www.bea.gov, interactive tables.13
DIGITAL ECONOMYthe category <strong>of</strong> durable goods that includes computers, computer peripherals <strong>and</strong> s<strong>of</strong>tware(furniture <strong>and</strong> household equipment) rose by 7.4 percent. In the third quarter, consumptionin this category <strong>of</strong> durables rose another 2.7 percent. In 2001, the latest year for which dataare available, personal consumption <strong>of</strong> computers, computer peripherals <strong>and</strong> s<strong>of</strong>tware was$32.9 billion representing about 11 percent <strong>of</strong> furniture <strong>and</strong> household equipment purchases.• Through the third quarter <strong>of</strong> 2003, personal consumption <strong>of</strong> communications services,almost certainly continued to rise. In the second quarter <strong>of</strong> 2003, consumption in the nonenergycategory <strong>of</strong> personal spending on household operation (i.e., the category <strong>of</strong> personalspending that includes telephone service) increased by 0.3 percent. In the third quarter, itrose another 0.7 percent. In 2001, consumer spending for communications was $136.5billion, about 54 percent <strong>of</strong> the non-energy portion <strong>of</strong> spending for household operation.• Through the third quarter <strong>of</strong> 2003, growth in government spending for equipment, whichincludes IT equipment <strong>and</strong> s<strong>of</strong>tware has remained positive. 8 Federal spending (defense <strong>and</strong>non-defense) for IT equipment <strong>and</strong> s<strong>of</strong>tware during the period was about $14.8 billion; state<strong>and</strong> local government spending was about $8.3 billion. 9IT Manufacturers’ Shipments, New Orders, <strong>and</strong> InventoriesShow Positive Trends Through AugustProduction indicators for the first nine months <strong>of</strong> 2003 support the view that IT-producingindustries are gaining strength. (Table 1.3.) Though manufacturers’ shipments <strong>and</strong> new ordersfor communications equipment remained depressed, reports on shipments for the computer <strong>and</strong>semiconductor industries were generally positive. Shipments <strong>of</strong> computers, for the first ninemonths <strong>of</strong> 2003, were 14 percent higher than in the same period in 2002. Shipments <strong>of</strong>semiconductors were 22 percent higher. In contrast, over the same period, shipments <strong>of</strong>communication equipment dropped 9 percent. New orders for computers <strong>and</strong> communicationequipment were up—by 7 percent <strong>and</strong> 8 percent, respectively.Through September, manufacturers’ inventories <strong>of</strong> computers <strong>and</strong> communication equipmentcontinued to decline (by 11 percent <strong>and</strong> 23 percent, respectively). Inventories <strong>of</strong> computersappear to have reached a balance indicating that new production will be necessary to meetdem<strong>and</strong>. However, inventories for communications equipment continue to decline, <strong>and</strong> it isunclear clear how long manufacturers will continue to rely on existing stocks.8Table 3.7, Government Consumption Expenditures <strong>and</strong> Gross Investment By Type, Bureau <strong>of</strong> Economic Analysis, http://www.bea.gov, interactive tables.9We made no estimates <strong>of</strong> government purchases <strong>of</strong> communications equipment, computer services, <strong>and</strong> communicationsservices.14
DIGITAL ECONOMYTable 1.3. Shipments, New Orders, <strong>and</strong> Total Inventories for Computers,Communications Equipment <strong>and</strong> Semiconductors, 2003(Percent)*Month to Month 2003August-January-September July-August June-July September,(2003/2002)Computer <strong>and</strong> related productsShipments –1.3 5.6 25.1 13.9New Orders –3.2 8.3 9.2 7.0Total Inventories 1.3 2.9 –6.7 –10.8Communications equipment (non-defense)Shipments –1.2 –0.8 –1.8 –8.9New Orders 5.2 1.7 13.4 8.1Total Inventories 0.0 –2.3 –1.9 –22.9SemiconductorsShipments –8.2 19.9 –12.8 22.3New Orders n.a. n.a. n.a. n.aTotal Inventories n.a. n.a. n.a. n.a.Note: *Based on current dollars, seasonally adjusted.Source: Bureau <strong>of</strong> the Census, Manufacturer’s Shipments, Orders, <strong>and</strong> Inventories (M3)IT Producing Industry Performance in 2003Based on assumptions <strong>and</strong> methods described in the Digital Economy 2003 TechnicalAppendices (http://www.esa.doc.gov/reports.cfm), we estimate that, after a decline <strong>of</strong> 5.6percent in 2001 <strong>and</strong> 0.3 percent growth in 2002, output 10 in IT producing industries increased by4.8 percent in 2003, in nominal dollars. 11 (Table 1.4) Our overall estimate for the year assumesa continuation <strong>of</strong> the recent turnaround in IT-producing manufacturing industries <strong>and</strong> continuedslow but steady growth in IT-producing service industries.We estimate that, in 2003, IT hardware industries (computers, semiconductors, electroniccomponents, <strong>and</strong> electronic measuring instruments) increased their output by 9.8 percent. Inaddition, after steep declines in 2001 <strong>and</strong> 2002, output <strong>of</strong> communications equipment declinedby 5.6 percent, a slowdown in the decline in the previous years.10GDP by industry equals an industry’s total output less the cost <strong>of</strong> goods <strong>and</strong> services used to produce it. Basically, GDPby industry is used here as a measure <strong>of</strong> the industry’s performance because it can be compared directly to the growth <strong>of</strong>the economy, as measured by its Gross Domestic Income (GDI). GDI is the income side measurement <strong>of</strong> the economywhile Gross Domestic Product (GDP) is expenditures. In theory, GDI should equal GDP. In practice, they do not because<strong>of</strong> some accounting differences.11Estimates <strong>of</strong> GDP by industry <strong>and</strong> GDP by industry growth for each IT producing industry that make up the aggregateindustries—Hardware, S<strong>of</strong>tware <strong>and</strong> computer services, Communications equipment, <strong>and</strong> Communications services—areprovided in Tables A-1.2 <strong>and</strong> A-1.3, Digital Economy 2003 Technical Appendices (http://www.esa.doc.gov/reports.cfm).15
DIGITAL ECONOMYTable 1.4.IT-Producing Industries Gross Domestic Product (GDP) by SectorActual <strong>and</strong> Estimated1996 1997 1998 1999 2000 2001 2002* 2003*Billions <strong>of</strong> Current DollarsTotal 589.0 666.1 739.5 821.7 877.8 828.9 831.6 871.9Hardware 201.1 231.6 242.2 252.2 244.1 189.6 189.3 208.0S<strong>of</strong>tware <strong>and</strong> Services 166.3 193.6 238.0 278.3 316.6 320.3 323.7 328.8Communications Equipment 39.0 52.7 53.2 60.6 67.3 54.9 46.6 43.5Communications Services 182.6 188.2 206.1 230.6 249.8 264.3 272.1 291.6Annual Change-PercentTotal n.a. 13.1 11.0 11.1 6.8 –5.6 0.3 4.8Hardware n.a. 15.2 4.6 4.1 –3.2 –22.4 –0.2 9.8S<strong>of</strong>tware <strong>and</strong> Services n.a. 16.4 22.9 16.9 13.8 1.2 1.0 1.6Communications Equipment n.a. 35.1 0.8 14.0 10.9 –18.4 –15.1 –5.6Communications Services n.a. 3.1 9.5 11.9 8.3 5.8 3.0 7.2Source: Estimates are derived from BEA <strong>and</strong> Census data for 1996 through 2001.*Estimates for 2002 are based on BEA data on GDP <strong>and</strong> the INFORUM LIFT model to estimate outputs. Estimates for 2003 arebased on the Global Insights’ economic forecast.Output from the IT-producing services sectors continued to grow in 2003, though at a pace thatwas significantly slower than the double-digit growth <strong>of</strong> the latter 1990s. Our overall estimatereflects industry-level estimates <strong>of</strong> 1.6 percent growth in s<strong>of</strong>tware <strong>and</strong> computer services <strong>and</strong>7.2 percent growth in communications services.Adjusting output estimates for inflation results in a similar picture <strong>of</strong> modest improvement.(Table 1.5.) Prices <strong>of</strong> computers fell by about 24 percent per year, from 1997 through 2000, then16 percent through 2002. Semiconductor prices fell an average 15 percent per year during1997–2000, followed by an average 9 percent reduction through 2002. For the purpose <strong>of</strong>estimating real output in 2003, we have assumed that computer <strong>and</strong> semiconductor pricesdeclined throughout 2003 at the 2002 rate (16 percent <strong>and</strong> 9 percent, respectively). Reflectingthese continuing price declines, in 2003, real growth in the IT hardware sector increasedsharply. 12The average inflation-adjusted annual growth for IT producing industries between 1997 <strong>and</strong>1999 was about 20 percent. In 2000, growth dropped to 13 percent. And in 2001 <strong>and</strong> 2002,despite the continued decline in prices in hardware, there was virtually no real growth in output.In 2003, however, reversing this trend, real growth in IT producing industries was about 6percent.12For BEA’s use <strong>of</strong> hedonic price indexes, see “A Note on the Impact <strong>of</strong> Hedonics <strong>and</strong> Computers on Real GDP” bySteven L<strong>and</strong>efeld <strong>and</strong> Bruce Grimm, Survey <strong>of</strong> Current Business, December 2000, pgs. 17 to 22 <strong>and</strong> “Measuring the NewEconomy” by Steven L<strong>and</strong>efeld <strong>and</strong> Barbara Fraumeni, Survey <strong>of</strong> Current Business, March 2001, pgs. 23–40.16
DIGITAL ECONOMYTable 1.5.IT-Producing Industries Inflation Adjusted OutputActual <strong>and</strong> Estimated1996 1997 1998 1999 2000 2001 2002* 2003*Billions <strong>of</strong> Chained (1996) DollarsTotal 589.0 706.4 849.0 1,012.0 1,138.4 1,149.1 1,167.3 1,241.5Hardware 201.1 275.5 364.1 464.5 524.5 485.6 527.7 665.4S<strong>of</strong>tware <strong>and</strong> Services 166.3 192.7 236.1 271.1 300.2 302.5 301.7 306.3Communications Equipment 39.0 53.3 56.0 66.3 76.2 64.1 52.4 48.9Communications Services 182.6 187.8 204.0 235.7 267.7 304.0 313.7 318.7Annual Change-PercentTotal n.a. 19.9 20.2 19.2 12.5 0.9 1.6 6.4Hardware n.a. 37.0 32.2 27.6 12.9 –7.4 8.7 26.0S<strong>of</strong>tware <strong>and</strong> Services n.a. 15.9 22.5 14.8 10.7 0.8 –0.3 1.5Communications Equipment n.a. 36.6 5.2 18.3 14.9 –15.9 –18.3 –6.7Communications Services n.a. 2.8 8.7 15.5 13.6 13.5 3.2 1.6Source: Estimates are derived from BEA <strong>and</strong> Census data for 1996 through 2001.*Estimates for 2002 are based on BEA data on GDP <strong>and</strong> the INFORUM LIFT model to estimate outputs. Estimates for 2003 arebased on the Global Insights’ economic forecast.IT Research <strong>and</strong> Development Expenditures Remain StrongThe rapid pace <strong>of</strong> technological change in IT producing industries, particularly IT hardwareindustries, drives a high rate <strong>of</strong> spending on investment in research <strong>and</strong> development (R&D) inthese industries. The sector uses more R&D inputs than other areas <strong>of</strong> the economy <strong>and</strong> itsR&D intensity (i.e., R&D spending divided by industry sales) is three times the nationalaverage. Recent growth patterns in R&D investment by the IT sector are influenced by thetransition to digital technology in several large markets: television, photography, <strong>and</strong> motionpicture reproduction (DVD).IT companies accounted for a disproportionate share <strong>of</strong> company-funded R&D (31 percent),relative to the sector’s small share <strong>of</strong> the economy. Moreover, R&D investment has fundedinnovations that contributed to the rapid decline in the price indexes for computers <strong>and</strong>semiconductors. R&D spending by the IT sector has contributed to economic growth—throughR&D’s role in technological change 13 —<strong>and</strong> created spillovers to local communities by creatinghigh paid jobs for 300,000 scientists <strong>and</strong> engineers in all IT industries.In contrast to the cyclical swings in IT industry production <strong>and</strong> employment, IT industryinvestment in R&D has shown greater stability. Strong growth in R&D spending by the IT13A brief survey <strong>of</strong> the literature on technological change <strong>and</strong> growth is discussed in Subodh Kumar <strong>and</strong> R. RobertRussell. “Technological Change, Technological Catch-up, <strong>and</strong> Capital Deepening: Relative Contributions to Growth <strong>and</strong>Convergence.” American Economic Review, June 2002.17
DIGITAL ECONOMYTable 1.6.R&D Expenditures, Company-funded$ billionsIndustry 1997 1998 1999 2000 2001Total U.S. R&D (including federal) 212.4 226.9 244.1 264.6 281.1Company-funded R&D 133.6 145.0 160.2 180.4 181.6IT R&D, total 35.2 38.4 36.2 46.9 56.5Computers <strong>and</strong> peripheral equipment 7.7 8.3 4.1 5.2 5.2Communications equipment 2.8 8.4 5.8 11.1 15.2Semiconductors, other components 14.0 9.1 10.6 12.8 14.2Other electronics 0.5 0.6 0.8 0.3 0.3Total, IT equipment 25.0 26.4 21.3 29.4 34.9S<strong>of</strong>tware publishing 7.2 9.2 10.9 12.6 13.0Computer systems design 3.0 2.9 4.0 4.9 8.7Total, IT services 10.2 12.0 14.9 17.5 21.7IT Share <strong>of</strong> Company R&D (percent) 26.4 26.5 22.6 26.0 31.2Source: National Science Foundation, Survey <strong>of</strong> Industrial R&Dsector occurred in 2001 <strong>and</strong> R&D investment reached $56.5 billion, according to the latestavailable data from the National Science Foundation. 14 (See Table 1.6.) Compared withcompany-funded R&D by all industries, which was flat in 2001, growth in R&D by the ITsector boosted the IT share <strong>of</strong> total R&D to 31 percent from an average share <strong>of</strong> 26 percent inprevious years. Another year <strong>of</strong> growth in R&D investment by IT industries is likely to bereported in 2002, because the NSF estimates an increase in R&D spending by all industries. 15A variety <strong>of</strong> factors contributed to the growth in R&D expenditures in 2001 that occurreddespite the decline in IT industry sales. R&D investment was required to develop products fornew applications with rapid growth potential. Semiconductor industries increased investment inR&D to meet dem<strong>and</strong> for a number <strong>of</strong> rapidly growing markets, such as a new generation <strong>of</strong>televisions with thin screen features (LCD <strong>and</strong> plasma displays <strong>and</strong> high-definition TV (HDTV)with much better resolution), digital cameras, camera-equipped cell phones, video gamemachines, <strong>and</strong> personal computers with editing features for video <strong>and</strong> digital photos. In thecommunications equipment industry, R&D growth was stimulated by rapidly growing markets,such as broadb<strong>and</strong> (including computer modems), wireless networks, HDTV broadcasting,instant messaging, <strong>and</strong> enhanced mobile phone equipment to allow users to send <strong>and</strong> receivephotos <strong>and</strong> video.14Infobrief. “U.S. Industry Sustains R&D Expenditures During 2001 Despite Decline in Performers’ Aggregate Sales.”National Science Foundation, October 2003.15Infobrief. “Slowing R&D Growth Expected in 2002.” National Science Foundation, December 2002.18
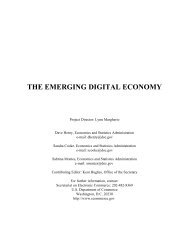
CHAPTER II:INFORMATION TECHNOLOGY WORKERSIN THE DIGITAL ECONOMYBy S<strong>and</strong>ra D. Cooke *The rapid diffusion <strong>of</strong> information <strong>and</strong> communications technologies throughout the U.S.economy <strong>and</strong> globally during the 1990s led to unprecedented dem<strong>and</strong> for informationtechnology (IT) workers. From 1993 to 2000, employment in IT-producing industries grewmore than twice as fast as employment in all private industries <strong>and</strong> added over 1.8 million jobs.But, since 2000, this trend has reversed. During the 2000–2002 period, IT-producing industrieslost over 600,000 jobs.In recent years, the IT workforce has endured a number <strong>of</strong> events that have negatively affectedthe dem<strong>and</strong> for IT workers. The recession <strong>of</strong> 2001 <strong>and</strong> subsequent slow recovery havedepressed dem<strong>and</strong> for workers in IT industries <strong>and</strong> IT-related occupations. However, foreignoutsourcing <strong>of</strong> IT jobs <strong>and</strong> labor saving productivity improvements are among other factors thathave contributed to a weak job market for IT workers.This chapter begins with a section that pr<strong>of</strong>iles employment in IT-producing industries <strong>and</strong> thencompares trends in employment <strong>and</strong> wages during the 1993 to 2000 period with the past twoyears (2001 <strong>and</strong> 2002) when IT-producing industry employment declined. The next sectionexamines trends in IT occupational employment <strong>and</strong> wages according to education <strong>and</strong> trainingrequirements. The remainder <strong>of</strong> the chapter discusses the factors that have contributed to recentdeclining dem<strong>and</strong> for IT workers.IT-Producing IndustriesIT workers develop, design, manufacture, operate, repair <strong>and</strong> maintain the IT infrastructure thatsupports e-commerce, the Internet or network-related activities, <strong>and</strong> IT-enabled processesthroughout businesses <strong>and</strong> organizations. IT-producing industries consist <strong>of</strong> four major* Ms. Cooke (s<strong>and</strong>ra.cooke@esa.doc.gov) is an economist in the Office <strong>of</strong> Policy Development, Office <strong>of</strong> the ChiefEconomist, <strong>Economics</strong> <strong>and</strong> <strong>Statistics</strong> <strong>Administration</strong>.19
DIGITAL ECONOMY 2003segments: computer hardware, s<strong>of</strong>tware <strong>and</strong> computer services, communications equipment,<strong>and</strong> communications services. (See Box A-2.1 in the appendix to this chapter for a list <strong>of</strong> ITproducingindustries.) 1 Workers in IT-producing industries cover a broad range <strong>of</strong> occupations(e.g., management, production, <strong>and</strong> administrative occupations in addition to IT-relatedoccupations).IT-PRODUCING INDUSTRIES EXPERIENCE MAJOR JOB LOSSESAfter several years <strong>of</strong> unprecedented job creation, employment in IT-producing industries hasfallen sharply. From 1993 to 2000, employment in IT-producing industries grew more thantwice as fast as employment in all private industries (annually 6.2 percent <strong>and</strong> 3.2 percentrespectively). (Figure 2.1A) Over the period, IT-producing industries added over 1.8 millionjobs. (Figure 2.1B) But, since 2000, employment in IT-producing industries has fallen morethan six times faster than all private industries. Between 2000 <strong>and</strong> 2002, IT-producing industrieslost over 600,000 jobs, about one-fourth <strong>of</strong> the total private industry jobs lost over the sameperiod. (Table 2.1)160Figure 2.1.A. Index <strong>of</strong> Changes in Industry Employment:IT-Producing Industries <strong>and</strong> All Private Industries150IT-Producing IndustriesEmployment (Index 1993=100)140130120110All Private Industries100RecessionMarch toNovember2001901993 1994 1995 1996 1997 1998 1999 2000 2001 2002Source: Estimates derived from BLS data.1IT-producing industries referenced in this Chapter do not exactly match those in Chapter 1. Chapter 1 uses CensusBureau data based on the 1997 North American Industrial Classification System (NAICS) <strong>and</strong> this chapter uses Bureau <strong>of</strong>Labor <strong>Statistics</strong> (BLS) data based on the 2002 NAICS. See the Appendix at the end <strong>of</strong> this chapter for additionalinformation.20
DIGITAL ECONOMY 2003IT-producing industry employment increased from 3.5 million workers in 1993 to a peak <strong>of</strong> 5.4million in 2000 <strong>and</strong> then fell to 4.8 million in 2002. Until 2000, IT-producing industryemployment was characterized by “churning,” meaning that most sub-industries especially inIT services industries gained jobs while many IT manufacturing sub-industries lost jobs.However, during the most recent period, job losses have occurred across the board. Figure 2.2shows that, from 1993 to 2002, IT services employment outpaced IT manufacturing employmentgrowth, but, since 2000, both IT manufacturing <strong>and</strong> IT services industries have beenrapidly shedding jobs.Figure 2.1.B.IT-Producing Industry Employment Levels(1993 to 2002)65.38 5.35543.543.653.864.104.434.745.044.78(Millions)3Page 2101993 1994 1995 1996 1997 1998 1999 2000 2001 2002Source: Estimates derived from BLS data.Employment in IT manufacturing industries declined from 1998 to 1999 because <strong>of</strong> decliningexports to countries affected by the Asian financial crisis, but quickly rebounded in 2000. Asrecently as mid-2001, while the economy at large had started shedding jobs, many IT servicesindustries were still adding jobs. However, in 2002, almost all IT-producing industries lostjobs. 2 From 2001 to 2002, employment declined 8.8 percent for IT services <strong>and</strong> 15.8 percent for2See Appendix Table 2.1 in Digital Economy 2003 Technical Appendices for a complete list <strong>of</strong> employment in IT services<strong>and</strong> IT manufacturing industries. (http://www.esa.doc.gov/reports.cfm)21
DIGITAL ECONOMY 200315.0Figure 2.2.IT ServicesIT-Services <strong>and</strong> IT-Manufacturing EmploymentYear-to-Year Rates <strong>of</strong> Change10.0Year-to-Year Rate <strong>of</strong> Change (percent)5.00.0-5.0-10.0-15.0All Private IndustriesIT ManufacturingRecessionMarch toNovember2001-20.01994 1995 1996 1997 1998 1999 2000 2001 2002Source: Estimates derived from BLS data.IT manufacturing industries, much faster than the 1.6 percent average rate <strong>of</strong> job loss for allprivate industries. Some individual industries have seen employment fall by more than 20percent in one year. These industries include telephone apparatus, electrical capacitors, bareprinted circuits, electrical components, <strong>and</strong> fiber optic cable manufacturing. The only ITproducingindustries that added jobs in 2002 were satellite <strong>and</strong> related telecommunications <strong>and</strong><strong>of</strong>fice machine rental <strong>and</strong> leasing, two relatively small industries.At a more disaggregated level, we find similar trends. Of all IT-producing industries, s<strong>of</strong>tware<strong>and</strong> services industry employment grew the fastest over the 1993 to 2000 period, (more than 12percent per year), adding over 1 million jobs. Since 2000, this IT group has lost 166,000 jobs. 3(Table 2.1.) Communications services, fueled by growth in Internet, fax, pager, <strong>and</strong> cell phoneuse, grew at 4 percent per year from 1993 to 2000. Expectations <strong>of</strong> future high dem<strong>and</strong> led torapid investment in fiber optic networks <strong>and</strong> equipment during the 1990s. By 2002, excesscapacity without the expected dem<strong>and</strong> led to increased competition <strong>and</strong> industry consolidation.As a result, the communications services industry has eliminated almost 60,000 jobs since2000. 4 Employment <strong>of</strong> both computer equipment <strong>and</strong> communications equipment workers grew3See Appendix Table 2.2 in Digital Economy 2003 Technical Appendices for a complete list <strong>of</strong> employment in ITproducingindustry groupings. (http://www.esa.doc.gov/reports.cfm)4Terence M. McMenamin, Rachel Krantz, <strong>and</strong> Thomas J. Krolik, “U.S. Labor Market in 2002: Continued Weakness,”Monthly Labor Review. February 2003: 6.22
DIGITAL ECONOMY 2003over the earlier period, but started to decline before the two IT services groups. In 2002,computer <strong>and</strong> related exports slowed <strong>and</strong> the communications equipment industry continued tosuffer from excess capacity.Table 2.1.IT-Producing Industry Employment By Major IT SectorAverage AnnualMajor IT Sectors 1 Employment (000s) Rate <strong>of</strong> Change (%)1993 2000 2001 2002 93-00 00-01 01-02ComputerHardware 1,357.2 1,679.6 1,596.4 1,376.4 3.1 –5.0 –13.8S<strong>of</strong>tware <strong>and</strong>Computer Services 951.9 2,127.5 2,160.8 1,961.0 12.2 1.6 –9.2CommunicationsEquipment 283.3 322.0 301.5 248.4 1.8 –6.4 –17.6CommunicationsServices 951.4 1,252.5 1,291.8 1,193.1 4.0 3.1 –7.6All IT-ProducingIndustries 3,543.8 5,381.6 5,350.4 4,779.0 6.2 –0.6 –10.7All PrivateIndustries 91,855.0 110,996.0 110,707.0 108,886.0 2.7 –0.3 –1.6Note: 1 Based on 2002 NAICS.Source: Estimates derived from BLS data.IT-PRODUCING INDUSTRY WAGES DECLINE SLIGHTLYIn 2002, the average annual wage for workers in IT-producing industries was $67,440, down 1.3percent from the average <strong>of</strong> $68,330 for 2001. In contrast, the average annual wage for allprivate workers increased 1 percent to $36,520 in 2002. 5 One explanation for the much higherthan average wages in IT-producing industries relative to all private industries is that most ITjobs tend to be high skilled, high wage jobs as explained in the next section.In 2002, s<strong>of</strong>tware publishing <strong>and</strong> s<strong>of</strong>tware reproducing ranked among the IT-producingindustries with the highest annual wages, ($99,440 <strong>and</strong> $92,260, respectively). 6 Reflecting thedot com shakeout, workers in the Internet service provider <strong>and</strong> web search portal industry sawannual wages decline by 16.6 percent.5Previous analyses showed that the gap between IT-producing industry wages <strong>and</strong> the average for private industries haswidened over time. See for example, Figure 5.3 on page 43 <strong>of</strong> Digital Economy 2002. (http://www.esa.doc.gov/pdf/DE2002_CH5.pdf) NAICS-based industry wages are only available for 2001 <strong>and</strong> 2002.6See Appendix Table 2.3 in Digital Economy 2003 Technical Appendices for the complete ranking <strong>of</strong> IT-producingindustries. (http://www.esa.doc.gov/reports.cfm)23
DIGITAL ECONOMY 2003IT-Related OccupationsWorkers in IT-related occupations develop, design, manufacture, operate, maintain, <strong>and</strong> repairIT products <strong>and</strong> provide related services across all industries, including IT-producing industries.For example, network administrators work in education, health, legal, engineering <strong>and</strong>government services industries as well as in IT-producing industries. Our definition is broaderthan other definitions <strong>of</strong> IT-related occupations <strong>and</strong> includes workers in occupations that build,maintain, <strong>and</strong> repair the IT infrastructure such as telecommunications <strong>and</strong> computer equipmentoperators, repairers, <strong>and</strong> installers as described in Box 2.1.Box 2.1. IT-Related OccupationsSkill Level: HighComputer <strong>and</strong> information systems managersEngineering managersComputer <strong>and</strong> information scientists, researchComputer programmersComputer s<strong>of</strong>tware engineers, applicationsComputer s<strong>of</strong>tware engineers, systemss<strong>of</strong>twareComputer support specialistsComputer systems analystsDatabase administratorsNetwork <strong>and</strong> computer systems administratorsNetwork systems <strong>and</strong> data communicationsanalystsComputer hardware engineersElectrical engineersElectronics engineers, except computerElectrical <strong>and</strong> electronic engineeringtechniciansSkill Level: ModerateData entry keyersComputer, automated teller, <strong>and</strong> <strong>of</strong>fice machinerepairersTelecommunications equipment installers <strong>and</strong>repairers, exc. line installersElectrical <strong>and</strong> electronics repairers, commercial<strong>and</strong> industrial equipmentElectrical power-line installers <strong>and</strong> repairersTelecommunications line installers <strong>and</strong> repairersElectrical <strong>and</strong> electronic equiptment assemblersElectromechanical equipment assemblersSemiconductor processorsSkill Level: LowCommunications equipment operatorsBilling <strong>and</strong> posting clerks <strong>and</strong> machineoperatorsComputer operatorsOther <strong>of</strong>fice machine operators, exc. computer24
DIGITAL ECONOMY 2003IT OCCUPATIONAL EMPLOYMENT IS ALSO DECLININGAs in IT-producing industries, job losses in IT-related occupations began after 2000. In 2002,workers in IT-related occupations totaled 5.9 million, roughly 3.2 percent (197,000) fewer thanin 2001. Most IT jobs are highly skilled; i.e., occupations that require formal education <strong>and</strong>training <strong>and</strong>/or work experience. For the nation as a whole, the opposite is true. Proportionatelymore workers fall into the low-skilled category that requires much less formal education <strong>and</strong>training. (Figure 2.3) Education <strong>and</strong> training requirements for IT occupations have increasedover time, as they have for the workforce at large. In contrast to past years when IT job losseswere concentrated in low-skilled categories, since 2000, IT occupations have experienced joblosses across all skill levels.More than half <strong>of</strong> the jobs in IT-related occupations (3.5 million) require an associate degree orhigher. 7 (Table 2.2) 8 Occupations in the high educational <strong>and</strong> training category includecomputer engineers, systems analysts, programmers <strong>and</strong> support specialists. From 1999 to2000, all high skilled occupations gained jobs except engineering managers <strong>and</strong> computer <strong>and</strong>information scientists in research. After 2000, all high skilled occupations lost jobs exceptFigure 2.3. IT Occupational Employment,by Education <strong>and</strong> Training Requirement, 20021008030.8 millionHigh3.5 millionEducation <strong>and</strong>Training Category:(percent)60402025.9 millionFigures CH_2.xlsModerate1.4 millionHIGH: Associate degreeor higherMODERATE: Long-termon-the-job training (OJT),related work experience,or post secondaryvocational trainingLOW: Short- tomoderate-term OJTLow070.8 million 1.0 million1All OccupationsIT Workers1Estimate based on 2000 employment distribution.Source: Estimates derived from BLS data.7The grouping <strong>of</strong> the nine <strong>of</strong>ficial BLS education <strong>and</strong> training categories into High, Moderate, <strong>and</strong> Low reflects theauthor’s interpretation <strong>of</strong> training intensity <strong>of</strong> IT-related occupations <strong>and</strong> therefore, are not <strong>of</strong>ficial BLS estimates.8Analysis is limited to four years (1999–2002) because <strong>of</strong> recent changes to the occupational classification system.25
DIGITAL ECONOMY 2003network systems <strong>and</strong> data communications analysts <strong>and</strong> computer hardware engineers. Thehigh skilled group as a whole accounted for almost half <strong>of</strong> the 516,000 IT-related jobs lost since2000. 9IT workers that fall into the moderate education <strong>and</strong> training category generally require longtermon-the-job training, related work experience, or post secondary vocational training.Moderately skilled IT workers totaled 1.4 million in 2002 <strong>and</strong> included such occupations astelecommunications <strong>and</strong> electronic equipment installers <strong>and</strong> repairers. Although this groupaccounts for only a fourth <strong>of</strong> all IT workers, from 1999 to 2002, it suffered more than a third <strong>of</strong>the total IT occupational job losses. Semiconductor processors, data entry keyers <strong>and</strong> electronicequipment assemblers led the job losses in this group.Table 2.2. IT Occupational Employmentby Education <strong>and</strong> Training Requirement1999 to 2002Education <strong>and</strong>Average AnnualTraining Category 1 Employment (000s) Rate <strong>of</strong> Change (%)1999 2000 2001 2002 99-00 00-01 01-02High 3,434.7 3,763.0 3,595.0 3,512.5 9.6 –4.5 –2.3Moderate 1,652.0 1,646.7 1,522.2 1,410.7 –0.3 –7.6 –7.3Low 1,150.8 1,060.1 1,034.0 1,030.3 –7.9 –2.5 –0.4IT-relatedoccupations 6,237.5 6,469.9 6,151.2 5,953.5 3.7 –4.9 –3.2All occupations 127,274.0 129,739.0 127,980.4 127,523.7 1.9 –1.4 –0.4Notes: 1 HIGH: Associate degree or higher;MODERATE: Long-term on-the-job training (OJT), related work experience or post secondary vocational trainingLOW: Short- to moderate-term OJTSource: Estimates derived from BLS data.Low skilled IT jobs such as communications equipment operators <strong>and</strong> billing <strong>and</strong> postingmachine operators, require only short- or moderate-term job training. This group lost thefewest jobs during 2000–2002 mainly because low skilled jobs have been declining over time.IT jobs requiring little training are more apt to be replaced by technology. For example, voicerecognition technology <strong>and</strong> on-line telephone directories likely have reduced the need fortelephone operators <strong>and</strong> directory assistants. Similarly, sophisticated billing <strong>and</strong> sales trackings<strong>of</strong>tware can eliminate some functions performed by billing <strong>and</strong> posting clerks.9See Appendix Table 2.4 in Digital Economy 2003 Technical Appendices for a complete list <strong>of</strong> IT occupational employment<strong>and</strong> Appendix Table 2.6 for a description <strong>of</strong> duties <strong>of</strong> each IT-related occupation. (http://www.esa.doc.gov/reports.cfm)26
DIGITAL ECONOMY 2003Despite high requirements for formal education <strong>and</strong> training for IT occupations, a recent studyby the Commerce <strong>Department</strong>’s Technology <strong>Administration</strong> found that formal education in anIT field only provides part <strong>of</strong> what employers seem to be requiring. 10 In addition to formaleducation, employers are seeking IT workers with specific technical skills, certifications, workexperience <strong>and</strong> s<strong>of</strong>t skills such as interpersonal or business skills. This is evident in an emergingIT occupation called the “IT business technologist or IT business analyst,” which requirestechnical, business, <strong>and</strong> communication skills. A worker in this occupation would serve as aliaison between non-IT workers who have a business problem <strong>and</strong> the IT department, which ischarged with solving the problem. 11OCCUPATIONAL WAGE GROWTH HAS SLOWEDEarnings <strong>of</strong> IT workers vary based on their skills <strong>and</strong> educational levels. For specificoccupations, we find that in 2002, average earnings ranged from $95,740 for highly skilledengineering managers, who typically have a bachelor’s degree plus experience, to $23,220 forcommunications equipment operators, positions that require little formal training. 12 Althoughwages continue to increase, the rate <strong>of</strong> growth slowed starting in 1999 for most IT occupations.Annual wages <strong>of</strong> both computer <strong>and</strong> engineering managers increased by almost 8 percent since2001.A survey by Foote Partners LLC found that, on average, IT earnings are down from previousyears <strong>and</strong> large signing bonuses are much less common. During 2002, base salaries in 85 IToccupations studied, declined by an average <strong>of</strong> 2.8 percent while bonuses declined by 32percent. Only a few occupations experienced increased dem<strong>and</strong>, including IT securityspecialists, whose earnings increased by 5.5 percent. 13The National Association <strong>of</strong> Colleges <strong>and</strong> Employers reports that average starting salaries for2003 computer sciences graduates declined 4.1 percent to $47,109 (but computer scienceremains the highest paid specialty). The average <strong>of</strong>fer to information sciences <strong>and</strong> systemsgraduates fell by 7.5 percent to $38,282. 1410U.S. <strong>Department</strong> <strong>of</strong> Commerce, Technology <strong>Administration</strong>, Office <strong>of</strong> Technology Policy, Education <strong>and</strong> Training forthe Information Technology Workforce, <strong>Report</strong> to Congress from the Secretary <strong>of</strong> Commerce (Washington, DC: U.S.<strong>Department</strong> <strong>of</strong> Commerce, June 2003): 57.11Mary Stevens, “Bridging the Gap,” E-Week April 14, 2003. (http://www.eweek.com/print_article/0,3048,a=40332,00.asp)12See Appendix Table 2.5 in Digital Economy 2003 Technical Appendices for a complete list <strong>of</strong> IT occupational earnings<strong>and</strong> Appendix Table 2.6 for a description <strong>of</strong> duties <strong>of</strong> each IT-related occupation. (http://www.esa.doc.gov/reports.cfm)13David Foote, “IT Job Trends Yield Surprises,” Computerworld, February 10, 2003. (http://www.computerworld.com/careertopics/careers/story/0,10801,78304,00.html)14NACE’s Fall 2003 Salary Survey, National Association <strong>of</strong> Colleges <strong>and</strong> Employers (http://www.naceweb.org)27
DIGITAL ECONOMY 2003IT Employment Dem<strong>and</strong> <strong>and</strong> the Recession <strong>of</strong> 2001IT-PRODUCING INDUSTRIESOverall weakness in the economy has affected workers across all industries <strong>and</strong> occupations,including IT workers. Since 2001, the U.S. economy has lost 1.8 million private sector jobs <strong>and</strong>the decline in IT employment has been a part <strong>of</strong> this overall trend. IT-producing industries havelost over 570,000 jobs since 2001. During the 1991 business cycle, IT-producing industryemployment sank lower than other industries <strong>and</strong> was slower to recover, but grew much fasterthan average after that. By 1992, the economy on average was adding jobs, but employmentgrowth only turned positive for IT-producing industries in 1993. 15 Since the 2001 recessionended, IT-producing industry employment has continued to decline.A recent report by the Federal Reserve Bank <strong>of</strong> New York compares the current “jobless”recovery with the previous one (1991) to determine whether job losses were cyclical orstructural. 16 The authors examined industry job flows before <strong>and</strong> after the past recessions. Ifemployment recovered quickly, they determined the change in employment was cyclical. If theindustries lost jobs during the recession <strong>and</strong> continued to lose jobs afterwards, they concludedthat the job losses were structural. Some IT-producing industries ranked among the industriesthat lost jobs during the recent recession <strong>and</strong> that continue to lose jobs, indicating a permanentrelocation or loss <strong>of</strong> jobs.The authors suggest that despite some structural job losses, the similarities between the current<strong>and</strong> previous recoveries, specifically, a recovery driven by productivity growth, with little initialjob creation, could bode well for the future. Thus, if the current recovery eventually follows thepattern <strong>of</strong> the previous one, once the economy does turn around, we can expect a lengthy period<strong>of</strong> economic growth.IT-RELATED OCCUPATIONSIT occupational employment does not show consistent patterns across the last two businesscycles. During the 1990–91 recession, the average unemployment rate <strong>of</strong> all computer relatedoccupations (computer scientists, systems analysts, <strong>and</strong> engineers <strong>and</strong> computer programmers)was 2.7 percent. 17 The unemployment rate for these occupations was higher during the 2001recession (3.7 percent), but has since continued to climb to a historically high rate <strong>of</strong> 5.2 percentin 2002. From 1993 to 2000, the unemployment rate for computer-related occupations wasmuch lower than the national average <strong>and</strong> basically tracked the national average in direction <strong>and</strong>15See Table A-4.1 in U.S. <strong>Department</strong> <strong>of</strong> Commerce, <strong>Economics</strong> <strong>and</strong> <strong>Statistics</strong> <strong>Administration</strong>, Appendices to theEmerging Digital Economy II (Washington, DC: U.S. <strong>Department</strong> <strong>of</strong> Commerce, June 1999): 26. (http://www.esa.doc.gov/pdf/EDE2appendix.pdf)16Erica Groshen <strong>and</strong> Simon Potter, “Has Structural Change Contributed to a Jobless Recovery?” in Current Issues in<strong>Economics</strong> <strong>and</strong> Finance Federal Reserve Bank <strong>of</strong> New York, Vol. 9, No. 8, August 2003: 2–4. (http://www.newyorkfed.org/research/current_issues/ci9-8.html)17These computer-related occupations account for about one-third <strong>of</strong> all IT-related occupations.28
DIGITAL ECONOMY 2003magnitude <strong>of</strong> change. During the same period, the unemployment rate for pr<strong>of</strong>essional specialtyoccupations—a category that includes computer-related, engineering, legal, health, <strong>and</strong> otherpr<strong>of</strong>essional occupations that require similar, high levels <strong>of</strong> education <strong>and</strong> training—followed asimilar trend. (Figure 2.4). After 2000, the unemployment rate <strong>of</strong> workers in computeroccupations started to converge with the national average <strong>and</strong> diverge from the rate forpr<strong>of</strong>essional specialty occupations.The rapid increase in the unemployment rate in computer related occupations (between 2000<strong>and</strong> 2002) relative to the national average suggests that factors in addition to the economic cyclecould be influencing dem<strong>and</strong> for workers in these occupations. The slowdown following theY2K buildup is one likely explanation for the decline in dem<strong>and</strong>, especially for computerprogrammers. Subsequently, the bursting <strong>of</strong> the dot.com bubble resulted in the loss <strong>of</strong> IT-relatedjobs. Also, recent growth in the number <strong>of</strong> foreign workers in computer <strong>and</strong> related occupations,Figure 2.4. Unemployment Rates in Computer-Related Occupations Comparedwith Pr<strong>of</strong>essional Specialty Occupations <strong>and</strong> the National Average1098Unemployment Rate (percent)76543Pr<strong>of</strong>essional SpecialtyOccupationsComputer-RelatedOccupations21019831984198519861987198819891990199119921993199419951996199719981999200020012002All OccupationsRecession July1990 to March1991RecessionMarch toNovember 2001Note: Computer occupations include computer analyst, computer scientist, computer-systems planning, computer-systemsanalyst, data processing consultant, information scientist, s<strong>of</strong>tware specialist, computer programmer, <strong>and</strong> related occupations.Pr<strong>of</strong>essional specialty occupations include computer, engineering, legal, health, <strong>and</strong> other pr<strong>of</strong>essional occupations that requiresimilar education <strong>and</strong> training.Source: Bureau <strong>of</strong> Labor <strong>Statistics</strong> Current Population Survey data.29
DIGITAL ECONOMY 2003specifically H-1B workers, could have displaced some IT workers. 18 Given the non-cyclicalfactors that have influenced the IT labor market (including <strong>of</strong>fshoring discussed in the nextsection), it is unclear how soon unemployment rates for workers in computer-related occupationswill return to pre-2000 levels.Offshoring <strong>and</strong> IT Job LossesThe information technology revolution that gave rise to the growth in dem<strong>and</strong> for IT workers isnow enabling the shift <strong>of</strong> some types <strong>of</strong> IT jobs to other countries. This practice <strong>of</strong> “<strong>of</strong>fshoring”or “foreign outsourcing” occurs when a U.S. company either relocates part <strong>of</strong> its operationsphysically outside <strong>of</strong> U.S. borders, outsources work to a company located in another country, oroutsources to another U.S.-based company that then sends the work <strong>of</strong>fshore. Lack <strong>of</strong> adequatedata makes it difficult to determine the extent <strong>of</strong> <strong>of</strong>fshoring, but press reports <strong>of</strong> companyannouncements <strong>and</strong> private surveys support the contention that IT <strong>of</strong>fshoring has contributed tothe recent decline in dem<strong>and</strong> for IT workers. 19According to most accounts, <strong>of</strong>fshoring is occurring in countries where many people speakEnglish as a first or second language such as Canada, India, Irel<strong>and</strong>, Israel, <strong>and</strong> the Philippines.Some IT jobs have also moved to China. The types <strong>of</strong> jobs being outsourced abroad haveevolved from low skilled, low wage call-center jobs to high skilled, high wage programming<strong>and</strong> s<strong>of</strong>tware development jobs. The availability <strong>and</strong> declining cost <strong>of</strong> high speed communicationssystems are facilitating this trend.No government data measure the extent to which U.S. companies are moving jobs to othercountries. However, a growing number <strong>of</strong> private research firms are <strong>of</strong>fering forecasts <strong>of</strong> IT joblosses based on proprietary surveys <strong>of</strong> U.S. companies. These research studies are not comparablein scope or measurement techniques <strong>and</strong> the findings vary widely, indicating the difficulty intracking labor mobility <strong>and</strong> its economic effects. But the common theme throughout is that manyU.S. companies that are not already <strong>of</strong>fshoring are planning to do so in the near future.• Forrester Research estimates that 3.3 million U.S. services jobs will be relocated abroadover the next 15 years, accounting for $136 billion in wages. Over 400,000 will be ITrelatedjobs, with the greatest level <strong>of</strong> outsourcing expected in s<strong>of</strong>tware development <strong>and</strong>customer service/call centers. 2018The H-1B visa program allows foreign workers to enter the country for the purpose <strong>of</strong> temporarily filling skilled jobs (alarge share <strong>of</strong> which are IT jobs). The original annual limit on visa approvals was set at 65,000. Congress raised the limitto 115,000 for FY1999 <strong>and</strong> FY2000 <strong>and</strong> to 195,000 in FYs 2001, 2002 <strong>and</strong> 2003. The cap reverted to 65,000 on October1, 2003.According to the Office <strong>of</strong> Immigration <strong>Statistics</strong>, H-1B petitions increased each year the cap was raised until FY2002,when H-1B petition approvals dropped by more than half to 89,000. This suggests that H-1B workers in computer-relatedoccupations are beginning to feel the impact <strong>of</strong> the weak economy, too.19In light <strong>of</strong> concern about <strong>of</strong>fshoring, Congress has requested that the General Accounting Office conduct a study <strong>of</strong> theeconomic implications <strong>of</strong> <strong>of</strong>fshoring.20John McCarthy, et al., “3.3 Million U.S. Services Jobs to go Offshore,” Forrester Research Tech Strategy Brief (November11, 2002): 1. (http://www.forrester.com)30
DIGITAL ECONOMY 2003• Goldman Sachs estimates the cumulative services jobs lost to <strong>of</strong>fshoring at 200,000, butprojected job losses could reach 6 million over the next decade. They suggest that whilebusinesses could realize cost savings <strong>and</strong> higher pr<strong>of</strong>its in the short-term, over timecompetition will erode the cost savings. In the end, they contend increased <strong>of</strong>fshoring wouldreduce labor dem<strong>and</strong>, raise imports, <strong>and</strong> place downward pressure on the value <strong>of</strong> thedollar. 21• A survey <strong>of</strong> hiring managers conducted by the Information Technology Association <strong>of</strong>America (ITAA) found that 12 percent <strong>of</strong> IT companies had opened outsourcing operationsoverseas. The ITAA survey also revealed that most <strong>of</strong> the foreign outsourcing was beingconducted by large IT companies <strong>and</strong> that programming <strong>and</strong> s<strong>of</strong>tware engineering positionstopped the list <strong>of</strong> types <strong>of</strong> positions most likely to be outsourced. 22• Gartner Inc. expects one in 10 jobs at IT services firms to move <strong>of</strong>fshore by the end <strong>of</strong> 2004<strong>and</strong> that many <strong>of</strong> the job losses will be structural. Despite the short-term fiscal advantages<strong>of</strong> <strong>of</strong>fshoring, they warn that companies need to consider the long-term implications <strong>of</strong><strong>of</strong>fshoring including the loss <strong>of</strong> seasoned IT pr<strong>of</strong>essionals, the loss <strong>of</strong> intellectual assets, <strong>and</strong>the effect <strong>of</strong> <strong>of</strong>fshoring on the functioning <strong>of</strong> their organizations. 23McKinsey Global Institute (MGI) attempted to quantify the benefits from <strong>of</strong>fshoring. Forexample, despite the job losses associated with <strong>of</strong>fshoring, U.S. consumers could benefit fromlower prices as businesses pass on the cost savings. Also, <strong>of</strong>fshoring could raise the st<strong>and</strong>ard <strong>of</strong>living in other countries, whose residents would be able to import goods <strong>and</strong> services from theUnited States. MGI found that overall, the positive effects outweigh the costs in lost jobs. Inaddition, MGI notes that Forrester Research’s estimated job losses over the next 10 years (about200,000 per year) are less than the number <strong>of</strong> mass lay<strong>of</strong>fs that typically occur in a dynamic,global economy for reasons other than <strong>of</strong>fshoring. MGI also suggests that <strong>of</strong>fshoring might helpto ease domestic labor supply issues expected to result as the U.S. population ages. 24Effects <strong>of</strong> Productivity Improvements <strong>and</strong> AutomationDespite the positive benefits <strong>of</strong> technological advances such as higher productivity growth,which leads to faster economic <strong>and</strong> wage growth, job displacement can occur. Technologicaladvances can contribute to job displacement by either eliminating the job or automatingprocesses so that they require fewer workers. Such labor saving innovations result inproductivity improvements that allow firms to produce more with the same number <strong>of</strong> workersor maintain current output with fewer workers. Often the types <strong>of</strong> jobs displaced by technology21Andrew Tilton, “Offshoring: Where have all the Jobs Gone?” Goldman, Sachs & Co. U.S. <strong>Economics</strong> Analyst, Issue 03/38 (September 19, 2003): 6.22Information Technology Association <strong>of</strong> America, 2003 IT Workforce Survey (Arlington, VA: ITAA, May 5, 2003): 11.(http://www.itaa.org/workforce/studies/03execsumm.pdf)23Diane Morello, “U.S. Offshore Outsourcing: Structural Changes, Big Impact,” Gartner Research Note CommentaryCOM-20-4837 (July 15, 2003): 2. (http://www4.gartner.com/Init)24McKinsey Global Institute, “Offshoring: Is It a Win-Win Game?” August 2003: 10–12. (http://www.mckinsey.com/knowledge/mgi/)31
DIGITAL ECONOMY 2003are low-skilled jobs or repetitive tasks that become automated. Office <strong>and</strong> administrativefunctions that were once performed by workers in those occupations can now be done byindividual staff members. For example, s<strong>of</strong>tware <strong>and</strong> the Internet can allow workers to securetravel, training, <strong>and</strong> other services directly rather than using administrative personnel. InChapter IV <strong>of</strong> this report, the authors describe job losses in <strong>of</strong>fice <strong>and</strong> administrativeoccupations among IT-intensive industries. 25High skilled IT occupations can also be affected by changes in technology. For example, anoccupation that requires narrowly specialized training can become obsolete when a platform oroperating system changes. Newer generations <strong>of</strong> s<strong>of</strong>tware provide self-testing features that oncerequired someone to conduct the testing. In the case <strong>of</strong> communications, repairing a problemwith a telephone line used to require that a person physically go to the site <strong>and</strong> inspect thetelephones <strong>and</strong> lines. Now testing <strong>and</strong> problem-solving can be done remotely. In Chapter IV, theauthors note that within businesses services, an IT-intensive industry, job losses were not onlyconcentrated among <strong>of</strong>fice <strong>and</strong> administrative occupations, but in higher skilled installation,maintenance, <strong>and</strong> repair occupations <strong>and</strong> computer <strong>and</strong> mathematical occupations.Sprint PCS is a firm-level example <strong>of</strong> how technology has increased productivity <strong>and</strong> replacedworkers. Sprint PCS, a wireless carrier, substituted voice recognition s<strong>of</strong>tware for humanoperators. Sprint’s productivity increased by 15 percent from 2001 to 2002 as it shed 11,500workers. 26ConclusionAfter almost a decade <strong>of</strong> rapid job growth during the 1990s, dem<strong>and</strong> for IT workers has fallensharply during the past two years. Recent job losses have been widespread across almost all ITproducingindustries <strong>and</strong> IT-related occupations. Job losses have been both cyclical <strong>and</strong>structural. The recent recession <strong>and</strong> continued economic sluggishness have slowed the return <strong>of</strong>some IT jobs. However, productivity improvements <strong>and</strong> foreign outsourcing <strong>of</strong> IT jobs meansome types <strong>of</strong> IT job losses may be permanent.25See Chapter IV, Digital Economy 2003, Appendix Table 4.B for a complete ranking <strong>of</strong> IT-intensive industries.26Del Jones <strong>and</strong> Barbara Hansen, “Companies Do More With Less,” USAToday online, 14 August 2003: 3.32
DIGITAL ECONOMY 2003Appendix 2.AThe North American Industrial Classification SystemIn 1997, the North American Industrial Classification System (NAICS) was created from a jointeffort by the statistical agencies <strong>of</strong> the United States, Canada, <strong>and</strong> Mexico. NAICS classifies inthe same industry, establishments with similar production processes. Thus, NAICS focuses onhow products <strong>and</strong> services are created, as opposed to the St<strong>and</strong>ard Industrial Classification(SIC), which focused on what is produced.The NAICS approach created significantly different industry groupings than those under theSIC system, especially for services, <strong>and</strong> thus more accurately reflects the workings <strong>of</strong> the U.S.economy. The pace <strong>of</strong> NAICS adoption has differed across statistical organizations. The Bureau<strong>of</strong> the Census was the first U.S. statistical agency to adopt NAICS; however, since 1997, NAICShas been revised <strong>and</strong> the Bureau <strong>of</strong> Labor <strong>Statistics</strong> (BLS), which had not implemented the1997 NAICS, went directly to the 2002 NAICS. The 2002 NAICS includes further revisionsthat include new industries. Therefore, the industry classifications listed in Box A-2.1 <strong>and</strong> usedin this chapter are not exactly comparable to those used in Chapter 1, which are groupedaccording to the 1997 NAICS.BLS revised some <strong>of</strong> their estimates historically according to NAICS (e.g., the CurrentEmployment Survey (CES) data used to estimate IT-producing industry employment). However,the Covered Employment <strong>and</strong> Wages (CEW) survey that is used to compile IT-producingindustry wages have not been revised historically <strong>and</strong> are currently available for only 2001 <strong>and</strong>2002.33
DIGITAL ECONOMY 2003Box A-2.1. Information Technology-Producing Industries(2002 NAICS)NAICSCODEComputer Hardware334111 Electronic Computers334112 Computer Storage Devices334113 Computer Terminals334119 Other Computer PeripheralEquipment423430 Computer <strong>and</strong> S<strong>of</strong>twareWholesalers (part)443120 Computer <strong>and</strong> S<strong>of</strong>tware Stores(part)334411 Electron Tubes334412 Bare Printed Circuit Boards334413 Semiconductor <strong>and</strong> RelatedDevices334414 Electronic Capacitors334417 Electronic Connectors334418 Printed Circuit Assembly334415,6,9 Miscellaneous ElectronicComponents334513 Industrial Process ControlInstruments334515 Electricity Measuring <strong>and</strong> TestingEquipment334516 Analytical Laboratory Instruments333295 Semiconductor Machinery333313 Office Machinery ManufacturingCommunications Equipment334210 Telephone Apparatus334220 Broadcast <strong>and</strong> WirelessCommunications Equipment334310 Audio <strong>and</strong> Video Equipment335921 Fiber Optic Cables334611 S<strong>of</strong>tware Reproducing334613 Magnetic <strong>and</strong> Optical RecordingMediaNAICSCODES<strong>of</strong>tware <strong>and</strong> Computer Services511210 S<strong>of</strong>tware Publishers518111,2 Internet Service Providers <strong>and</strong>Web Search Portals518210 Data Processing, Hosting, <strong>and</strong>Related Services423430 Computer <strong>and</strong> S<strong>of</strong>twareWholesalers (part)443120 Computer <strong>and</strong> S<strong>of</strong>tware Stores(part)541511 Custom ComputerProgramming541512 Computer Systems Design541513 Computer FacilitiesManagement541519 Other Computer RelatedServices532420 Office Machinery <strong>and</strong>Equipment Rental <strong>and</strong> Leasing811212 Computer <strong>and</strong> Office MachineRepair <strong>and</strong> MaintenanceCommunications Services517110 Wired TelecommunicationsCarriers517212 Cellular <strong>and</strong> Other WirelessCarriers517310 Telecommunications Resellers517510 Cable <strong>and</strong> Other ProgramDistribution517410,910 Satellite <strong>and</strong> OtherTelecommunications811213 Communications EquipmentRepair <strong>and</strong> Maintenance34
CHAPTER III:INTERNATIONAL SALES OFINFORMATION TECHNOLOGY GOODS AND SERVICESBy Dennis Pastore <strong>and</strong> Donald Dalton *In an increasingly integrated world economy, U.S. IT industries illustrate a paradox <strong>of</strong> industrialcompetitiveness. American-owned IT companies lead their foreign rivals in almost everysegment <strong>of</strong> business activity—from research <strong>and</strong> development to design, production, <strong>and</strong>marketing. The United States remains the world’s largest exporter <strong>of</strong> IT goods <strong>and</strong> services;<strong>and</strong>, in 2002 (the most recent year for which data are available), estimated sales by U.S. ITcompanies <strong>and</strong> their overseas affiliates topped $1 trillion. 1 Yet, in 2002, the United Statesregistered a deficit in IT goods trade <strong>of</strong> more than $86 billion—the nation’s thirteenthconsecutive deficit in IT goods since 1990, <strong>and</strong> the largest on record.To help explain this contrast, the present chapter examines recent developments in U.S. IT goods<strong>and</strong> services trade <strong>and</strong> indices <strong>of</strong> the globalization <strong>of</strong> U.S.- <strong>and</strong> foreign-owned IT production. Thechapter focuses especially on sales abroad by foreign affiliates <strong>of</strong> U.S. IT companies, <strong>and</strong> intrafirmtrade by U.S.- <strong>and</strong> foreign-owned IT firms, as well as the globalization <strong>of</strong> U.S. R&Dinvestments. The analysis links the large deficits in U.S. IT goods trade to the fact that U.S. ITproducers are global companies that supply foreign markets from foreign production sites. It lendssupport to the view that, in some industries at least, the global deployment <strong>of</strong> production <strong>and</strong>distribution capacity is both a requirement <strong>and</strong> an indication <strong>of</strong> competitive success.Trade in IT Manufactured GoodsLackluster U.S. trade performance in IT manufactured goods during 2001 <strong>and</strong> 2002 reflectedthe global economic response to the events <strong>of</strong> September 2001 <strong>and</strong> the end <strong>of</strong> the IT investment* Mr. Pastore (dennis.pastore@esa.doc.gov) <strong>and</strong> Mr. Dalton (donald.dalton@esa.doc.gov) are economists in the Office <strong>of</strong>Policy Development, Office <strong>of</strong> the Chief Economist, <strong>Economics</strong> <strong>and</strong> <strong>Statistics</strong> <strong>Administration</strong>.1Based on Chapter 1’s estimate <strong>of</strong> total IT producing industry output <strong>and</strong> the present chapter’s estimate <strong>of</strong> sales byforeign affiliates <strong>of</strong> U.S. IT companies.35
DIGITAL ECONOMY 2003boom <strong>of</strong> the 1990s. In 2002, for the second year in a row, exports <strong>of</strong> U.S.-made IT productsdeclined. IT imports also fell sharply, by almost 20 percent in 2001, before leveling <strong>of</strong>f in 2002.The combination <strong>of</strong> continuing export declines <strong>and</strong> the stability <strong>of</strong> imports in 2002 pushed thatyear’s deficit in IT-goods trade to an all-time high <strong>of</strong> $86.5 billion—26 percent over the 2001level ($68.7 billion) <strong>and</strong> 4 percent above the previous high <strong>of</strong> $82.8 billion in 2000. (Figure 3.1.)Figure 3.1.U.S. Trade in IT Goods300250IT ExportsIT ImportsBalance (X-M)200150$ Billions100500(50)(100)(150)1990199119921993199419951996199719981999200020012002Sources: Calculations based on data from Census Bureau <strong>and</strong> Bureau <strong>of</strong> Economic Analysis (BEA).At a more disaggregated level, the largest negative balances appeared in cross-border sales <strong>of</strong>computer <strong>and</strong> peripheral equipment ($33.2 billion) <strong>and</strong> audio <strong>and</strong> video equipment ($26.8billion). Smaller imbalances persisted in sales <strong>of</strong> IT-related communications equipment ($15.4billion), <strong>and</strong> semiconductors <strong>and</strong> other electronic components ($13.7 billion). The deficit insemiconductors trade continues to contract. The balances on sales <strong>of</strong> IT-related instruments,s<strong>of</strong>tware, semiconductor machinery, <strong>and</strong> fiber optic cable remained positive. (Table 3.1.)While the deficit in IT goods trade continues to exp<strong>and</strong>, this trend has occurred in a period <strong>of</strong>rising trade deficits for the overall economy. Growth in the IT trade deficit was less than theupward trend in the national trade deficit from 1995 to 2002. Measured as a ratio <strong>of</strong> the IT tradedeficit to the total trade deficit in goods, the IT share <strong>of</strong> the overall deficit peaked at 27.8 percentin 1995 <strong>and</strong> declined almost every year since then to 17.8 percent in 2002. See Table 3.1.36
DIGITAL ECONOMY 2003Table 3.1.U.S. Trade in IT Goods$Billions 1990 1995 1998 1999 2000 2001 2002ExportsComputer <strong>and</strong> Peripheral Equipment 23.0 34.4 38.3 38.5 44.3 37.2 29.1Semiconductors <strong>and</strong> OtherElectronic Components 17.2 34.3 44.1 52.7 65.2 49.8 44.7Audio <strong>and</strong> Video Equipment 2.1 3.4 4.6 3.8 4.2 4.1 4.0IT-related Communications Equipment 4.9 11.2 15.4 16.6 18.4 15.0 11.8IT-related Instruments 5.7 9.5 11.6 12.7 15.7 13.7 12.5Other IT 4.2 8.8 10.0 11.1 14.7 10.1 8.3S<strong>of</strong>tware 1.2 3.2 3.2 3.3 3.3 2.9 2.8Total IT Exports 57.1 101.6 123.9 135.4 162.5 129.8 110.3ImportsComputer <strong>and</strong> Peripheral Equipment 15.0 40.8 54.8 61.2 68.5 59.1 62.3Semiconductors <strong>and</strong> OtherElectronic Components 27.0 67.8 68.2 78.3 98.1 66.7 58.4Audio <strong>and</strong> Video Equipment 11.0 18.2 21.5 24.2 28.7 27.3 30.8IT-related Communications Equipment 7.6 10.6 14.2 19.3 30.2 26.4 27.2IT-related Instruments 2.9 5.8 7.5 8.3 10.5 10.2 9.8Other IT 3.4 6.1 7.2 7.1 9.3 8.9 8.3S<strong>of</strong>tware 0.2 0.6 0.6 0.5 0.5 0.5 0.4Total IT Imports 66.9 149.4 173.4 198.4 245.3 198.5 196.7IT Goods Trade BalanceComputer <strong>and</strong> Peripheral Equipment 8.0 –6.5 –16.5 –22.7 –24.3 –21.9 –33.2Semiconductors <strong>and</strong> OtherElectronic Components –9.8 –33.5 –24.1 –25.6 –32.9 –16.9 –13.7Audio <strong>and</strong> Video Equipment –8.9 –14.8 –16.9 –20.4 –24.5 –23.2 –26.8IT-related Communications Equipment –2.8 0.6 1.2 –2.7 –11.8 –11.4 –15.4IT-related Instruments 2.8 3.7 4.1 4.4 5.2 3.5 2.7Other IT 0.8 2.7 2.8 4.0 5.4 1.2 0.0S<strong>of</strong>tware 1.0 2.6 2.6 2.8 2.7 2.4 2.4Overall IT Trade Balance –9.8 –47.8 –49.5 –63.0 –82.8 –68.7 –86.5IT Goods Trade Relative to Total U.S. Goods TradeTotal U.S. Trade Balance –111.0 –174.2 –246.8 –346.0 –452.4 –427.2 –482.9IT Share <strong>of</strong> U.S. Trade Balance (percent) 8.9 27.4 20.0 18.2 18.3 16.1 17.8Sources: Calculations based on Census data obtained via the Trade Policy Information System (TPIS), International Trade<strong>Administration</strong> (ITA), U.S. <strong>Department</strong> <strong>of</strong> Commerce. Data on s<strong>of</strong>tware trade from BEA, Balance <strong>of</strong> Trade Division.37
DIGITAL ECONOMY 2003Table 3.2. U.S. Trade in IT Services$Billions 1995 1996 1997 1998 1999 2000 2001 2002ExportsTelecommunications 3.2 3.3 3.9 5.6 4.5 3.9 4.5 4.1Computer <strong>and</strong> data processing services 1.3 1.6 2.0 1.9 3.3 3.3 3.2 3.0Data base <strong>and</strong> otherinformation services 1.1 1.2 1.5 1.8 2.1 2.4 2.2 2.4S<strong>of</strong>tware royalties <strong>and</strong> license fees(unaffiliated) 1.7 2.1 2.7 3.2 3.7 4.8 5.0 4.8Total IT Services Exports 7.4 8.2 10.1 12.5 13.7 14.4 14.9 14.3ImportsTelecommunications 7.3 8.3 8.3 7.7 6.6 5.4 4.8 4.2Computer <strong>and</strong> data processing services 0.1 0.3 0.6 0.9 1.0 1.4 1.4 1.0Data base <strong>and</strong> otherinformation services 0.2 0.1 0.1 0.2 0.2 0.2 0.2 0.2S<strong>of</strong>tware royalties <strong>and</strong> license fees(unaffiliated) 1 0.3 0.2 0.5 0.5 0.5 0.5 0.4 0.5IT Services Imports 7.9 8.9 9.6 9.2 8.3 7.5 6.8 5.9IT Services Trade Balance (X-M)Telecommunications –4.1 –5.0 –4.4 –2.1 –2.1 –0.9 –0.3 –0.1Computer <strong>and</strong> data processing services 1.2 1.3 1.4 1.0 2.3 1.9 1.8 2.0Data base <strong>and</strong> otherinformation services 0.9 1.0 1.4 1.6 2.0 2.2 2.0 2.2S<strong>of</strong>tware royalties <strong>and</strong> license fees(unaffiliated) 1 1.4 2.0 2.2 2.7 3.2 4.3 4.6 4.3IT Services Balance (X-M) –0.5 –0.7 0.5 3.2 5.4 6.9 8.1 8.4Note: The Bureau <strong>of</strong> Economic Analysis does not separately identify intrafirm payments involving s<strong>of</strong>tware royalties <strong>and</strong> licensefees. However, unpublished data indicate that net payments to U.S. companies are substantial <strong>and</strong> could add a few billiondollars a year to the trade surplus.Source: Tabulations based on data in Maria Borga <strong>and</strong> Michael Mann, “U.S. International Services: Cross-Border Trade in 2002<strong>and</strong> Sales Through Affiliates in 2001,” Survey <strong>of</strong> Current Business 82 (October 2003).Trade in IT ServicesDespite a persistently negative balance in IT goods trade, the United States has regularly posteda trade surplus in IT services. In 2002 (the most recent year for which data are available), thesurplus in U.S. IT services trade continued for the sixth consecutive year, reaching $8.4billion. 2 This strong showing reflected a continuation <strong>of</strong> the recent pattern <strong>of</strong> sharp reductionsin U.S. payments for foreign telecommunications services, along with increased earnings ons<strong>of</strong>tware <strong>and</strong> license fees. (Table 3.2 <strong>and</strong> Figure 3.2.)2The charts <strong>and</strong> discussion in this section are based on data <strong>and</strong> analysis in Maria Borga <strong>and</strong> Michael Mann, “U.S.International Services: Cross-Border Trade in 2001 <strong>and</strong> Sales Through Affiliates in 2001,” Survey <strong>of</strong> Current Business 82(October 2003): 67–124.38
DIGITAL ECONOMY 2003Figure 3.2. U.S. Trade in Computer-Related Services 31210ExportsImports8$ Billions64201990199119921993199419951996199719981999200020012002Source: Calculations based on data in Maria Borga <strong>and</strong> Michael Mann, “U.S. International Services: Cross-Border Trade in 2002<strong>and</strong> Sales through Affiliates in 2001,” Survey <strong>of</strong> Current Business 82 (October 2003).At a more disaggregated level, in 2002, the United States posted a near balance in telecommunicationsservices—the second surplus after a long string <strong>of</strong> deficits. This improvement owedmuch to the influence <strong>of</strong> the WTO Basic Telecommunications Agreement <strong>and</strong> the FCCBenchmarks Order (both <strong>of</strong> 1997). As a result <strong>of</strong> these measures, even as the volume <strong>of</strong>international calls originating in the United States continues to increase, the rates that foreignproviders charge for basic services have been falling. Lower import bills for U.S. customers alsoreflect a shift toward alternative channels <strong>of</strong> communication, including e-mail.Although U.S. receipts on cross-border sales <strong>of</strong> computer <strong>and</strong> information services wereroughly flat in 2001 <strong>and</strong> 2002, computer services <strong>and</strong> s<strong>of</strong>tware royalty payments still accountfor the lion’s share <strong>of</strong> U.S. cross-border sales <strong>of</strong> IT services. Income from s<strong>of</strong>tware royaltiesdropped in 2002, <strong>and</strong> the growth rate <strong>of</strong> database <strong>and</strong> other information services exportsremained positive.3Consist <strong>of</strong> cross-border payments for computer <strong>and</strong> data processing services <strong>and</strong> database <strong>and</strong> other information servicesbetween unaffiliated parties as well as income from s<strong>of</strong>tware royalties <strong>and</strong> license fees.39
DIGITAL ECONOMY 2003Globalization <strong>of</strong> Production <strong>and</strong> Distribution <strong>of</strong>IT Goods <strong>and</strong> ServicesThe side-by-side occurrence <strong>of</strong> world-class U.S. IT-producing companies <strong>and</strong> the nation’schronic deficit in IT goods trade appears to be largely a result <strong>of</strong> the globalization <strong>of</strong> production<strong>and</strong> distribution <strong>of</strong> IT goods <strong>and</strong> services. U.S. IT companies <strong>of</strong>ten supply foreign <strong>and</strong> U.S.markets from <strong>of</strong>f-shore production centers. These companies also increasingly conduct intrafirmIT trade.Table 3.3 shows that U.S. IT firms are more likely to service foreign markets by locatingproduction capacity overseas than by exporting from production facilities in the United States.Indeed, the value <strong>of</strong> U.S. IT firms’ direct sales through foreign affiliates to overseas customerhas generally exceeded earnings from exports by a wide margin. In 2000 (the most recent yearfor which data are available), sales through foreign affiliates by U.S. manufacturers <strong>of</strong>computers <strong>and</strong> peripheral equipment, semiconductors <strong>and</strong> other electronic components, communicationsequipment, <strong>and</strong> audio <strong>and</strong> video equipment totaled nearly $200 billion. Bycontrast, in the same year, U.S. companies exported $132 billion worth <strong>of</strong> these IT goods.In the case <strong>of</strong> IT services, the relative differences are even more striking. In 2000, foreignaffiliates <strong>of</strong> U.S. computer services providers sold more than fifteen times the value <strong>of</strong> computerservices exported that year by all U.S.-based companies; for telecommunications affiliates, themultiple was about four. In both instances, the data are consistent with the observed tendencyfor service providers to base operations in close proximity to their customers.The growing imbalance in U.S. IT goods trade also reflects an increasing deficit in cross-bordertrade within U.S. <strong>and</strong> foreign-owned multinational IT firms. More than two-thirds <strong>of</strong> U.S. ITgoods imports in 2002, or $131.2 billion, involved shipments from affiliated companies. 4 Thus,the deficit in trade with affiliated firms more than accounted for the negative overall balance <strong>of</strong>U.S. IT goods trade. (Table 3.4.)At a more disaggregated level, some imbalances in intra-firm trade seem especially salient. Forexample, in 2002 related firms accounted for more than 90 percent <strong>of</strong> U.S. imports <strong>of</strong> portablecomputers ($10.4 billion). Most <strong>of</strong> these imports came from affiliates in Malaysia ($2.8 billion),Mexico ($1.3 billion), Taiwan ($1.0 billion), the Philippines ($0.7 billion), <strong>and</strong> Japan ($0.6billion). Shipments from affiliates made up over 90 percent <strong>of</strong> the value <strong>of</strong> portable computersentering the United States from Malaysia, Mexico, the Philippines, <strong>and</strong> Japan. In contrast, wellover half <strong>of</strong> the value <strong>of</strong> those arriving from Taiwan came from non-affiliated firms. The same4For purposes <strong>of</strong> imports, firms are affiliated if the firm on either end <strong>of</strong> the transaction controls 6 percent or more <strong>of</strong> thevoting stock <strong>of</strong> the other. For exports, the ownership threshold is 10 percent. The analysis <strong>of</strong> affiliated trade is based on aspecial tabulation <strong>of</strong> the related-party trade data provided to OPD by the Foreign Trade Division <strong>of</strong> the Census Bureau. Itis not possible from these data to determine the direction <strong>of</strong> the ownership relationship; i.e., to distinguish betweentransactions involving U.S. firms or parents <strong>and</strong> their overseas affiliates, on the one h<strong>and</strong>, <strong>and</strong> those involving foreigncompanies <strong>and</strong> their affiliates in the United States. Tabulations based on the related-party data also do not take intoconsideration cross-border shipments <strong>of</strong> s<strong>of</strong>tware products, for which a breakdown between affiliated <strong>and</strong> unaffiliatedparties is not available.40
DIGITAL ECONOMY 2003Table 3.3. Sales <strong>of</strong> Foreign Affiliates versus U.S. Exports in 2000$billionsFOREIGN AFFILIATESU.S.-BASED ENTITIESForeign Sales (1) <strong>of</strong>Majority-Owned Affiliates 195.1 132.1 Merch<strong>and</strong>ise Exports (2)Industry <strong>of</strong> U.S. Parent (3) IT Goods (4)Computers <strong>and</strong> peripheral equipment 100.1 44.3 Computers <strong>and</strong> peripheral equipmentSemiconductors <strong>and</strong> otherSemiconductors <strong>and</strong> otherelectronic components 59.1 65.2 electronic componentsCommunications equipment 33.1 18.4 Communications equipment (5)Audio <strong>and</strong> video equipment 2.8 4.2 Audio <strong>and</strong> video equipmentForeign Sales (6) <strong>of</strong>Majority-Owned Affiliates 99.6 10.0 Services (7) ExportsIndustry <strong>of</strong> U.S. Parent (3)IT ServiceTelecommunications 20.9 4.8 TelecommunicationsComputer services (8) 78.7 5.2 Computer services (9)Notes: (1) Local (i.e., host country) <strong>and</strong> other foreign (non-U.S.) sales net <strong>of</strong> imports from U.S.(2) Census merch<strong>and</strong>ise trade obtained through the Trade Policy Information System, ITA.(3) Affiliates <strong>of</strong> U.S. parent firms in the IT industries listed. Sales include both goods <strong>and</strong> services sold by these firms. Affiliatesmay be in other industries (e.g., wholesale).(4) Exports <strong>of</strong> these kinds <strong>of</strong> goods regardless <strong>of</strong> the industry classification <strong>of</strong> the firm exporting them.(5) Includes telephone apparatus as well as radio <strong>and</strong> TV broadcasting <strong>and</strong> wireless communications equipment.(6) Sales are gross sales to unaffiliated firms including unaffiliated U.S. firms. Disclosure restrictions make it impossible to netout purchases by affiliated firms in the U.S. for all segments. However, it seems reasonable to assume that the figures for thecomputer systems design <strong>and</strong> related services segment <strong>of</strong> the industry are broadly representative. In that industry, over90 percent <strong>of</strong> sales are local, <strong>and</strong> imports from the U.S., negligible.(7) U.S. receipts for cross-border sales. BEA data on services trade is classified by type <strong>of</strong> service regardless <strong>of</strong> the industry <strong>of</strong>the service provider.(8) Consist <strong>of</strong> information services <strong>and</strong> data processing services <strong>and</strong> computer systems design <strong>and</strong> related services.(9) Consist <strong>of</strong> computer <strong>and</strong> data processing services <strong>and</strong> database <strong>and</strong> other information services. These are conceptuallysame, since BEA includes computer system design <strong>and</strong> related services in reporting trade in computer <strong>and</strong> data processingservices.Source: Bureau <strong>of</strong> Economic Analysis, U.S. Direct Investment Abroad: Operations <strong>of</strong> U.S. Parent Companies <strong>and</strong> Their ForeignAffiliates, Preliminary 2000 Estimates, Tables III.F 9 <strong>and</strong> II.T 1. (http://www.bea.doc.gov/).was also true for portables shipped from China, South Korea, Singapore, <strong>and</strong> Hungary, althoughthe combined value <strong>of</strong> shipments from these four countries amounted to less than a third <strong>of</strong>those entering from Taiwan.GLOBALIZATION OF INDUSTRIAL R&DMultinational involvement in overseas research <strong>and</strong> development (R&D) has increasedsignificantly during the past decade, particularly in information technology. Overseas R&D hashistorically followed foreign investment in the later stages <strong>of</strong> the international product lifecycle, but U.S. <strong>and</strong> foreign multinational companies have recently increased the pace <strong>of</strong>overseas investment in R&D <strong>and</strong> are integrating these laboratories into global R&D networks.41
DIGITAL ECONOMY 2003Table 3.4.Computer Goods Trade Between Related Parties$MillionsTo/FromRelated Unrelated Relation Not2002 Total Party Party SpecifiedIT Exports 107,473.4 41,568.4 63,362.7 2,542.3IT Imports 193,867.0 131,154.5 62,650.1 62.3Balance (X-M) –86,393.5 –89,586.1 712.6 2,480.0ExportsComputer <strong>and</strong> Peripheral Equipment 29,059.6 11,665.9 16,664.6 729.1Portable computers 1,045.8 375.6 640.2 30.0Destination: Malaysia 7.4 1.2 6.1 0.0Mexico 218.1 112.7 104.9 0.6Taiwan 26.2 0.6 24.4 1.1Philippines 1.6 0.3 1.3 0.0Japan 52.5 11.6 40.9 0.1China 13.3 1.7 11.4 0.2Irel<strong>and</strong> 35.6 20.1 15.3 0.1South Korea 12.3 0.3 12.0 0.1Singapore 26.4 4.4 22.0 0.0Israel 7.5 0.3 7.2 0.0Hungary 0.5 0.0 0.5 0.0ImportsComputer <strong>and</strong> Peripheral Equipment 62,284.2 43,699.2 18,568.3 16.6Portable computers 10,442.1 6,804.6 3,637.4 0.1Source: Malaysia 2,911.7 2,764.5 147.2 0.0Mexico 1,368.6 1,276.7 91.9 0.0Taiwan 3,407.8 988.7 2,419.1 0.0Philippines 927.4 747.0 180.4 0.0Japan 651.5 590.8 60.7 0.0China 632.2 214.3 417.9 0.0Irel<strong>and</strong> 93.0 214.3 0.4 0.0South Korea 232.9 45.2 187.7 0.0Singapore 122.4 44.9 77.5 0.0Israel 8.2 7.2 1.0 0.0Hungary 15.5 5.1 10.4 0.0Source: Calculations based on special tabulation by Census Bureau <strong>of</strong> related party trade data. Tallies may differ slightly fromthose in Table 3.1 above due to rounding <strong>and</strong> the use <strong>of</strong> a more recent concordance between HS commodity codes <strong>and</strong> NAICS.These networks are exp<strong>and</strong>ing rapidly into Asia <strong>and</strong> Latin America—e.g., Singapore, Korea,China, India, Mexico, <strong>and</strong> Brazil. U.S. firms invest in R&D abroad to gain access to educatedworkers at lower salaries than the home country, but also to gain access to technology <strong>and</strong>skilled workers in areas where the United States lags other countries.42
DIGITAL ECONOMY 2003The United States appears to be the primary host country beneficiary <strong>of</strong> the globalization <strong>of</strong>R&D. In 2001, the most recent year for which Bureau <strong>of</strong> Economic Analysis (BEA) data areavailable, foreign-owned IT companies invested $7.1 billion in R&D in the United States, about13 percent <strong>of</strong> total company-funded R&D in the U.S. IT sector. In addition, foreign-owned ITcompanies in the United States employed about 35,600 R&D workers. 5U.S. R&D funded by foreign-owned companies tends to be concentrated in a few IT industriesin which these companies have a competitive advantage <strong>and</strong> substantial U.S. market share.About half <strong>of</strong> foreign company R&D spending goes to telephone communications equipment(central <strong>of</strong>fice <strong>and</strong> cellular switching), followed by R&D in memory semiconductors, <strong>and</strong>consumer electronics.Foreign-owned companies’ decisions about where to locate U.S. R&D facilities seem to begoverned by considerations <strong>of</strong> proximity to U.S. universities <strong>and</strong> availability <strong>of</strong> skilled workers.Many foreign-owned R&D facilities are located in Silicon Valley, CA, Research Triangle Park,NC, Princeton, NJ, <strong>and</strong> Richardson, TX. 6In 2001, U.S. companies spent less on R&D abroad than foreign-owned companies spent in theUnited States. In the IT sector, U.S. companies spent $6.7 billion on overseas R&D accordingto BEA, or 12 percent <strong>of</strong> their total R&D investment. Makers <strong>of</strong> communications equipment forcomputer networks <strong>and</strong> the Internet accounted for a majority <strong>of</strong> this overseas spending ($3.9billion in 2001), followed by semiconductor companies ($0.9 billion). 75William J. Zeile, “U.S. Affiliates <strong>of</strong> Foreign Companies’ Operations in 2001,” Survey <strong>of</strong> Current Business, August 2003.R&D data include Computers <strong>and</strong> electronic products, Information, <strong>and</strong> Computer systems design.6Donald H. Dalton <strong>and</strong> Manuel Serapio. Globalizing Industrial Research <strong>and</strong> Development. U.S. <strong>Department</strong> <strong>of</strong> Commerce,Technology <strong>Administration</strong>, September 1999.7Raymond J. Mataloni, Jr., “U.S. Multinational Companies: Operations in 2001,” Survey <strong>of</strong> Current Business, November2003.43
CHAPTER IV:INDUSTRY-LEVEL EFFECTS OF INFORMATIONTECHNOLOGY USE ON OVERALL PRODUCTIVITYBy Jesus Dumagan, Gurmukh Gill <strong>and</strong> Cass<strong>and</strong>ra Ingram*Beginning in the mid-1990s <strong>and</strong> continuing until mid-2000, the U.S. economy experienced aresurgence <strong>of</strong> labor productivity growth—accompanied by high output growth, low overallprice growth, <strong>and</strong> low unemployment. (Figure 4.1.) This resurgence in labor productivitygrowth stemmed mostly from investment in <strong>and</strong> use <strong>of</strong> information technology (IT). Usingindustry-level BEA data, this chapter examines the role <strong>of</strong> IT in reviving <strong>and</strong> spreadingproductivity growth in the U.S. non-farm economy during 1989–2001.The widespread dispersion <strong>of</strong> productivity growth across major sectors <strong>of</strong> the economy—largely paralleling the spread <strong>of</strong> IT—suggests that massive IT investments by U.S. industriesare producing positive <strong>and</strong> probably lasting changes in the nation’s economic potential. Theseconclusions add to recent findings by other economists concerning the widespread <strong>and</strong> lastingimpacts <strong>of</strong> IT on the revival <strong>of</strong> U.S. productivity growth. 1* Mr. Dumagan (jess.dumagan@esa.doc.gov) is a senior economist; Mr. Gill (gurmukh.gill@esa.doc.gov) is seniorexecutive for economic research; <strong>and</strong> Ms. Ingram (cass<strong>and</strong>ra.ingram@esa.doc.gov) is an economist, all in the Office <strong>of</strong>Policy Development, Office <strong>of</strong> the Chief Economist, <strong>Economics</strong> <strong>and</strong> <strong>Statistics</strong> <strong>Administration</strong>.1The findings in this chapter are consistent with those <strong>of</strong> recent studies by Baily <strong>and</strong> Lawrence, ibid.; Council <strong>of</strong>Economic Advisers, “Annual <strong>Report</strong> <strong>of</strong> the Council <strong>of</strong> Economic Advisers,” in Economic <strong>Report</strong> <strong>of</strong> the President (January2001); Kevin J. Stiroh, “Information Technology <strong>and</strong> the U.S. Productivity Revival: What Do the Industry Data Say?,”Federal Reserve Bank <strong>of</strong> New York, Staff <strong>Report</strong>s, no. 115 (January 2001); Kevin J. Stiroh, “Investing in InformationTechnology: Productivity Pay<strong>of</strong>fs for U.S. Industries,” Federal Reserve Bank <strong>of</strong> New York, Current Issues in <strong>Economics</strong><strong>and</strong> Finance, vol. 7, no. 6 (June 2001), pp. 1–6; McKinsey Global Institute, “US Productivity Growth 1995–2000:Underst<strong>and</strong>ing the Contribution <strong>of</strong> Information Technology Relative to Other Factors,” Washington, DC (October 2001);Stephen D. Oliner <strong>and</strong> Daniel E. Sichel, “Information Technology <strong>and</strong> Productivity: Where Are We Now <strong>and</strong> Where AreWe Going?” The Federal Reserve Board, Washington, DC (May 10, 2002), available at http://www.federalreserve.gov//pubs/feds/2002/200229/200229abs.html; <strong>and</strong> Dale W. Jorgenson, Mun S. Ho, <strong>and</strong> Kevin J. Stiroh, “Lessons from the U.S.Growth Resurgence,” presented at the U.S. <strong>Department</strong> <strong>of</strong> Commerce Transforming Enterprise Conference, Washington,DC (January 27–28, 2003), available at http://post.economics.harvard.edu/faculty/jorgenson/papers/CESIfo6final.pdf.45
DIGITAL ECONOMY 2003Figure 4.1. Average Annual Productivity Growth Acceleratedin Non-farm Business Sector after 1995Index 1992 = 100140130120Trend = 3.2 percentannual growth(1995-2003)110100Trend = 1.4 percentannual growth(1973-1995)9080701973 1976 1979 1982 1985 1988 1991 1994 1997 2000 2003Source: Bureau <strong>of</strong> Labor <strong>Statistics</strong>. Index on logarithmic scaleProductivity growth from 1973 to 1995 averaged about 1.4 percent annually. After mid-1995, including therecession year <strong>and</strong> the strong productivity growth experienced during 2002 <strong>and</strong> 2003, productivity growth hasbeen robust <strong>and</strong> maintained a trend growth rate <strong>of</strong> 3.2 percent annually.Data <strong>and</strong> MethodsIn this study we calculate the contributions <strong>of</strong> individual industries to the growth <strong>of</strong> grossdomestic product (GDP), total full-time equivalent (FTE) workers, <strong>and</strong> overall productivity(GDP/FTE). This industry-by-industry approach provides building blocks for reviewing theperformance <strong>of</strong> individual industries, sectors or selected groups <strong>of</strong> industries across time <strong>and</strong>across industries. The analysis is based on BEA annual data for the period 1989–2001 onindustry-level GDP <strong>and</strong> FTE workers for 55 industries <strong>of</strong> the U.S. private non-farm businesssector. 22Since this study is an update, we start from 1989, the starting year <strong>of</strong> our earlier analysis in Chapter 4 <strong>of</strong> DE 2002, <strong>and</strong>add one more year 2001 for which the latest data are available. (See Appendix 4.A <strong>and</strong> Appendix 4.B for more details.)As in Digital Economy 2002, Chapter 4, the nonfarm business sector industries include those classified by BEA undermining, construction, manufacturing durables, manufacturing nondurables, transportation <strong>and</strong> public utilities, wholesaletrade, retail trade, finance <strong>and</strong> insurance, <strong>and</strong> services. Real estate in the usual FIRE group <strong>of</strong> industries (consisting <strong>of</strong>finance, insurance, <strong>and</strong> real estate) is excluded in this analysis because real estate includes value-added from owneroccupiedhousing for which there is no corresponding FTE.46
DIGITAL ECONOMY 2003To determine IT’s effects on productivity growth, we ranked industries based on the intensity intheir use <strong>of</strong> IT equipment 3 per worker (FTE). We then grouped these industries into two groups,either IT-intensive or less IT-intensive, each group accounting for 50 percent <strong>of</strong> aggregate GDP. Thisgrouping enables us to compare the performance <strong>of</strong> the IT-intensive to less IT-intensive industries.Appendix 4.A explains in more detail the method used in this chapter to estimate eachindustry’s contribution to the economy’s productivity growth <strong>and</strong> to calculate IT-intensities.Appendix 4.B presents the industry rankings. Appendix 4.C compares the methods used in thisstudy with those used in similar studies that analyze the impacts <strong>of</strong> IT on productivity growthrevival <strong>and</strong> acceleration (see footnote 1).IT <strong>and</strong> Growth in GDP <strong>and</strong> FTEOverall productivity growth is growth in the economy’s GDP/FTE ratio. Alternatively,productivity growth is the difference between GDP growth <strong>and</strong> FTE growth. Thus, as abackground to the analysis <strong>of</strong> the effects <strong>of</strong> IT on productivity growth, we first review growthtrends in GDP <strong>and</strong> FTE separately for the IT-intensive group <strong>of</strong> industries, the less IT-intensivegroup, <strong>and</strong> for all industries in the non-farm business sector.GDP GROWTHTable 4.1 presents real GDP growth figures for various analytically interesting time periods <strong>and</strong>by IT-intensity grouping. From 1989 to 2001, the average annual GDP growth <strong>of</strong> 4.41 percentin the IT-intensive industries was almost twice the 2.44 percent growth in the less IT-intensiveindustries. During sub-periods in the time span 1989 to 2001, GDP growth in the IT-intensiveindustries was consistently greater than GDP growth in less IT-intensive industries.Average annual GDP growth also accelerated (1995–2001 over 1989–1995) more in ITintensiveindustries (2.55 percentage points) than in less IT-intensive industries (1.29 percentagepoints). In the economic downturn <strong>of</strong> 2001, however, GDP growth was weak <strong>and</strong> slowed to0.29 percent in IT-intensive <strong>and</strong> to 0.17 percent in less IT-intensive industries.Table 4.1. GDP Growth, 1989–2001Avg GDP Avg GDP Avg GDP Avg GDPIndustry Growth Growth Growth 2000–01 Growth1989–2001 1989–1995 1995–2000 1995–2001IT-Intensive 4.41 3.13 6.76 0.29 5.68Less IT-Intensive 2.44 1.80 3.68 0.17 3.09All Industries 3.41 2.45 5.20 0.23 4.37Note: GDP is gross domestic product. The industries covered are those in the non-farm business sector excluding real estate, asexplained in footnote 2.Source: ESA estimates derived from BEA data.3IT equipment covers computers <strong>and</strong> peripheral equipment, s<strong>of</strong>tware, <strong>and</strong> other information processing equipment.47
DIGITAL ECONOMY 2003Table 4.2. FTE Growth, 1989–2001Avg FTE Avg FTE Avg FTE Avg FTEIndustry Growth Growth Growth 2000–01 Growth1989–2001 1989–1995 1995–2000 1995–2001IT-Intensive 1.33 0.73 2.87 –2.73 1.93Less IT-Intensive 2.01 1.80 2.59 0.43 2.23All Industries 1.77 1.42 2.69 –0.68 2.13Note: FTE is full-time equivalent worker. The industries covered are those in the non-farm business sector excluding real estate,as explained in footnote 2.Source: ESA estimates derived from BEA data.FTE GROWTHTable 4.2 presents information on employment growth, as measured by change in the number <strong>of</strong>FTE workers for various time periods, highlighting differences between IT-intensive <strong>and</strong> lessIT-intensive industries. From 1989 to 2001, average annual FTE growth was lower in the ITintensiveindustries (1.33 percent) than in less IT-intensive industries (2.01 percent). Thischanged during the 1995 to 2000 period, when average annual FTE growth was somewhatgreater in the IT-intensive industries (2.87 percent) compared to the less IT-intensive industries(2.59 percent). During the economic downturn <strong>of</strong> 2001, however, FTE growth in IT-intensiveindustries declined dramatically to –2.73 percent, whereas FTE growth in less IT-intensiveindustries recorded a modest increase <strong>of</strong> 0.43 percent.Major FindingsPRODUCTIVITY GROWTH REMAINS HIGH IN IT-INTENSIVE INDUSTRIESOur industry-level analysis shows that between 1989 <strong>and</strong> 2001 average productivity growth forall industries was 1.60 percent (Table 4.3 <strong>and</strong> Figure 4.2). Average growth for IT-intensiveindustries for this period was 3.03 percent, far exceeding growth in the less IT-intensiveindustries which averaged 0.42 percent. During the economic downturn <strong>of</strong> 2001, productivitygrowth in IT-intensive industries remained strong <strong>and</strong> relatively stable at 3.10 percent, buoyingproductivity growth for all industries into positive territory at 0.91 percent. 4 Growth in the lessIT-intensive industries, however, fell to –0.26 percent.4The calculations in this chapter are based on BEA industry-level GDP <strong>and</strong> FTE data for nonfarm business sectorindustries (defined in footnote 2) available at the start <strong>of</strong> this year. BEA has not updated these data since then. At the timewe calculated the above 2001 GDP per FTE annual growth rate <strong>of</strong> 0.91 percent, BLS released a comparable 2001 annualoutput per hour growth rate <strong>of</strong> 1.1 percent for the nonfarm business sector. The slight difference could be explained bydifferences in industry coverage. This could lead to differences (1) between our aggregate GDP <strong>and</strong> the aggregate outputused by BLS <strong>and</strong> (2) between our total FTE <strong>and</strong> the equivalent total hours used by BLS. However, BLS has since updatedthe 2001 annual output per hour growth from 1.1 to 1.9 percent based largely on BLS’ revised estimates <strong>of</strong> 2001 totalhours. However, we are unable to update our 2001 GDP per FTE annual growth rate <strong>of</strong> 0.91 percent, or any <strong>of</strong> ourcalculations, because the next updates will be released after the release <strong>of</strong> this report. BEA’s NIPA ComprehensiveRevision will be released in December 2003 <strong>and</strong> BEA’s GDP-by industry Comprehensive Revision will be released inJune 2004.48
DIGITAL ECONOMY 2003Table 4.3. Productivity (GDP per FTE) Growth, 1989–2001Avg Avg Avg AvgGDP/FTE GDP/FTE GDP/FTE GDP/FTEIndustry Growth Growth Growth 2000–01 Growth1989–2001 1989–1995 1995–2000 1995–2001IT-Intensive 3.03 2.39 3.79 3.10 3.67Less IT-Intensive 0.42 0.00 1.05 –0.26 0.83All Industries 1.60 1.02 2.44 0.91 2.19Note: GDP is gross domestic product. FTE is full-time equivalent worker. The industries covered are those in the non-farmbusiness sector excluding real estate, as explained in footnote 2.Source: ESA estimates derived from BEA data.For comparison purposes, Table 4.3 <strong>and</strong> Figure 4.2 also present productivity growth for theabove grouping <strong>of</strong> industries by IT-intensity for analytically interesting time periods. All post-1995 groupings, for IT-intensive industries, including even the recession year <strong>of</strong> 2001, exhibitstronger productivity growth than the pre-1995 groupings, suggesting that the increase in laborproductivity growth in IT-intensive industries is not transitory.Figure 4.2. Labor Productivity Growth in IT-Intensive, Less IT-Intensive<strong>and</strong> All Industries <strong>of</strong> the U.S. Non-Farm Business Sector1989–2001543Percent210-1-21990 1991 1992 1993 1994 1995 1996 1997 1998 1999 2000 2001IT-Intensive (3.03 percent average, 1989-2001)Less IT-Intensive (0.42 percent average, 1989-2001)All (1.60 percent average, 1989-2001)Note: The industries covered are those in the non-farm business sector, excluding real estate.Source: ESA estimates derived from BEA data.49
DIGITAL ECONOMY 2003Figure 4.3. Contributions to Overall Labor Productivity Growth by IT-Intensive<strong>and</strong> Less IT-Intensive Industries <strong>of</strong> the U.S. Non-farm Business Sector1990–200132.362.22 2.222.322.242Percentage Point10-10.68-0.561.350.111.280.631.47 1.52-0.85-0.181.23-0.55-0.320.170.590.120.301.11-0.20-21990 1991 1992 1993 1994 1995 1996 1997 1998 1999 2000 2001IT-Intensive IndustriesLess IT-Intensive IndustriesNote: The industries covered are those in the non-farm business sector, excluding real estate.Source: ESA estimates derived from BEA data.IT’S CONTRIBUTION TO PRODUCTIVITY GROWTH ALSO SIGNIFICANTAnnual comparisons <strong>of</strong> contributions to overall productivity growth further demonstrate thatcontributions <strong>of</strong> IT-intensive industries to productivity growth were much greater than those <strong>of</strong>less IT-intensive industries (Figure 4.3).For the 1989–2001 period as a whole, the contribution <strong>of</strong> IT-intensive industries to the averageannual labor productivity growth for the non-farm economy <strong>of</strong> 1.60 percent was 1.67percentage points. This was more than 100 percent <strong>of</strong> this overall labor productivity growth.Less IT-intensive industries had a slightly negative contribution <strong>of</strong> –0.06 percentage points. 5LABOR PRODUCTIVITY GROWTH WIDELY SPREAD ACROSS INDUSTRIESContributions to long-run productivity growth (1989 to 2001) are widely dispersed amongindustries (Figure 4.4.) While manufacturing durables made the largest contribution, 0.63percentage points (39 percent), to the average annual growth <strong>of</strong> 1.60 percent, sectors outside <strong>of</strong>manufacturing durables also made significant contributions. Wholesale trade contributed 0.44percentage points (28 percent) to productivity growth <strong>and</strong> accounts for a larger percent <strong>of</strong>productivity growth contribution than even the finance <strong>and</strong> insurance industry.5Because Figure 4.3 involves additive “contributions,” productivity growth <strong>of</strong> all industries for each year can be calculatedby adding the IT-intensive industries’ contribution to the less IT-intensive industries’ contribution. For example, in2001, productivity growth was 0.91 percent or 1.11 percentage points plus –0.20 percentage points. To get the averagegrowth contribution by either the IT-intensive or less IT-intensive industries over the 1989–2001 period, simply sum thecontributions for each industry group across 12 years <strong>and</strong> then divide by twelve.50
DIGITAL ECONOMY 2003Figure 4.4. Contributions to Labor Productivity Growth inU.S. Non-Farm Business Sector by Major Industry Group1989–2001Mining0.02Construction-0.04Manufacturing, Durable Goods0.63Manufacturing, Nondurable Goods0.08Transportation <strong>and</strong> Public UtilitiesWholesale TradeRetail TradeFinance <strong>and</strong> Insurance0.310.440.190.41Services-0.43-1.0 -0.5 0.0 0.5 1.0Percentage PointNote: The Finance <strong>and</strong> Insurance group excludes real estate.Source: ESA estimates derived from BEA data.Other recent studies have reached similar conclusions. 6 McKinsey Global Institute (MGI) foundthat 38 industry sectors recorded productivity increases after 1995; together, these sectorsaccounted for 70 percent <strong>of</strong> GDP. Analyses by the Council <strong>of</strong> Economic Advisers (CEA) <strong>and</strong>Kevin Stiroh, each found that more than half <strong>of</strong> the industry sectors registered productivityincreases. Robert Gordon, who asserted in 2000 that labor productivity growth was narrowlyconcentrated in durable manufacturing sectors has updated his analysis. He now also findsevidence <strong>of</strong> acceleration <strong>of</strong> productivity growth well beyond the durable goods sector. 7 Finally,a 2002 study by Jack Triplett <strong>and</strong> Barry Bosworth took a detailed look at the service sector(examining 27 industries in this sector) <strong>and</strong> concluded that IT-intensive industries in the USeconomy are predominantly services industries <strong>and</strong> that the labor productivity growth in thissector has been comparable with that in the overall economy. Moreover, within services,productivity is broad-based <strong>and</strong> not just limited to a few large industries. 86For a review <strong>and</strong> synthesis <strong>of</strong> the relevant literature, see Jason Dedrick, Vijay Gurbuxani, <strong>and</strong> Kenneth L. Kraemer,“Information Technology <strong>and</strong> Economic Performance: A Critical Review <strong>of</strong> Empirical Evidence,” Center for Research onInformation Technology <strong>and</strong> Organization, University <strong>of</strong> California, Irvine (March 2003).7See the studies by Kevin Stiroh, CEA, MGI noted in footnote 1, Robert J. Gordon, “Does the ‘New Economy’ MeasureUp to the Great Inventions <strong>of</strong> the Past?,” Journal <strong>of</strong> Economic Perspectives (Fall 2000), 49–74 <strong>and</strong> Robert J. Gordon,“Technology <strong>and</strong> Economic Performance in the American Economy,” National Bureau <strong>of</strong> Economic Research, WorkingPaper, no. 8771 (2002).8Jack Triplett <strong>and</strong> Barry Bosworth, “Services Industries <strong>and</strong> U.S. Productivity Acceleration: Contributions <strong>of</strong> IT <strong>and</strong>MFP,” presented at the Brookings Institution Workshop on Economic Measurement, Washington, DC (May 17, 2002).51
DIGITAL ECONOMY 2003LABOR PRODUCTIVITY GROWTH WIDELY SPREADEVEN DURING THE 2001 RECESSIONDuring the 2001 recession, productivity growth for all industries averaged 0.91 percent. Positivegrowth contributions were widely spread among 29 <strong>of</strong> the 55 industries comprising the U.S.non-farm economy. Five major sectors (mining, wholesale trade, retail trade, finance <strong>and</strong>insurance, <strong>and</strong> services) had positive contributions while four major sectors (construction,durable manufacturing, nondurable manufacturing, <strong>and</strong> transportation <strong>and</strong> public utilities) madenegative contributions to productivity growth in 2001. (Figure 4.5.)Among major sectors that made positive contributions, the finance <strong>and</strong> insurance sector contributedmost. It contributed about 0.62 percentage points (68 percent) <strong>of</strong> the 0.91 percent productivitygrowth in 2001. A more detailed analysis <strong>of</strong> this sector showed that the largest contributions camefrom IT-intensive industries, namely, securities <strong>and</strong> commodity brokers (26 percent), holdings <strong>and</strong>other investment <strong>of</strong>fices (26 percent) <strong>and</strong> nondepository institutions (15 percent).Among the remaining major industry sectors, retail trade (one <strong>of</strong> the less IT-intensiveindustries) made the second highest contribution (54 percent)—largely because <strong>of</strong> its largeweight in the economy—followed by IT-intensive wholesale trade (27 percent). The mining <strong>and</strong>services sectors made small positive contributions to productivity growth in 2001.Figure 4.5. Contributions to Labor Productivity Growth inU.S. Non-Farm Business Sector by Major Industry Group, 2001Mining0.06ConstructionManufacturing, Durable Goods-0.15-0.06Manufacturing, Nondurable Goods-0.34Transportation <strong>and</strong> Public Utilities-0.02Wholesale TradeRetail TradeFinance <strong>and</strong> InsuranceServices0.060.240.500.62-1.0 -0.5 0.0 0.5 1.0Percentage PointNote: The Finance <strong>and</strong> Insurance group excludes real estate.Source: ESA estimates derived from BEA data.52
DIGITAL ECONOMY 2003Figure 4.6. Contributions to Productivity Growth Acceleration inU.S. Non-Farm Business Sector by Major Industry Group1995–2001 Over 1989–1995MiningConstruction-0.05-0.07Manufacturing, Durable Goods0.14Manufacturing, Nondurable GoodsTransportation <strong>and</strong> Public Utilities-0.18-0.15Wholesale TradeRetail TradeFinance <strong>and</strong> InsuranceServices0.340.440.500.20-1.0 -0.5 0.0 0.5 1.0Percentage PointNote: The Finance <strong>and</strong> Insurance group excludes real estate.Source: ESA estimates derived from BEA data.Within the services sector, IT-intensive business services stood out with a large positivecontribution <strong>of</strong> 0.37 percentage points (41 percent). This was mostly <strong>of</strong>fset by the negativecontributions <strong>of</strong> many other industries in this sector.Even within sectors that made negative contributions overall, some individual IT-intensiveindustries had notable positive contributions. For example, the electronic <strong>and</strong> other electricequipment industry (which includes IT-producers among others in the durable manufacturingsector) made a robust 0.24 percentage points (26 percent) contribution to the 0.91 percentproductivity growth in 2001. Likewise, the telephone <strong>and</strong> telegraph along with the radio <strong>and</strong>television industries (in the transportation <strong>and</strong> public utilities sector) made robust contributions<strong>of</strong> 0.31 percentage points (34 percent) <strong>and</strong> 0.11 percentage points (12 percent), respectively, tooverall productivity growth.ACCELERATION IN LABOR PRODUCTIVITY GROWTHWIDELY SPREAD ACROSS INDUSTRIESContributions to productivity growth acceleration (i.e., growth during 1995–2001 over thatduring 1989–1995) <strong>of</strong> 1.17 percentage points were also widely distributed across industries <strong>and</strong>also differed from the analysis <strong>of</strong> long-run (1989–2001) <strong>and</strong> 2001 growth contributions. (Figure4.6.) The bulk <strong>of</strong> this acceleration during the post-1995 period can be attributed to IT-intensive53
DIGITAL ECONOMY 2003industries, which accounted for 0.82 percentage points (71 percent) <strong>of</strong> this growth acceleration.In contrast, the less IT-intensive half <strong>of</strong> industries contributed only 0.34 percentage points (29percent) to overall acceleration in productivity growth.Twenty-nine industries contributed positively to the 1.17 percentage point growth accelerationduring 1995 to 2001 over growth during 1989 to 1995. Productivity growth accelerated not onlyin manufacturing durables but also in wholesale trade, retail trade, finance <strong>and</strong> insurance <strong>and</strong>services. Manufacturing durables contributed 0.14 percentage points (12 percent) to the overall1.17 percentage point productivity growth acceleration. The largest contribution came fromfinance <strong>and</strong> insurance (42 percent), followed by retail trade (38 percent), wholesale trade (29percent) <strong>and</strong> services (17 percent).EMPLOYMENT AND PRODUCTIVITY GROWTH IN 2001—THE RECESSION YEAROur analysis <strong>of</strong> the components <strong>of</strong> productivity growth, finds that modest GDP growth coupledwith a sharp decline in FTE growth in the 2001 recession year kept productivity growth in ITintensiveindustries high. Therefore, productivity growth in the IT-intensive industries in 2001appears to arise largely from the ability <strong>of</strong> these industries to shed jobs during lean periods.Moreover, some <strong>of</strong> this job shedding may be related directly to IT. A review <strong>of</strong> OccupationalEmployment <strong>Statistics</strong> data in some industries suggests that management <strong>and</strong> <strong>of</strong>fice <strong>and</strong>administrative support occupations represent the bulk <strong>of</strong> employment losses in a number <strong>of</strong> ITintensiveindustries. 9For example, <strong>of</strong> the IT-intensive industries that contributed significantly to productivity growth,wholesale trade <strong>and</strong> business services had the largest job losses or reductions in employmentgrowth <strong>and</strong> only a slight decline in GDP growth. The shares <strong>of</strong> total jobs eliminated inwholesale trade, by occupation, were <strong>of</strong>fice <strong>and</strong> administrative services (24 percent), managementoccupations (18 percent), <strong>and</strong> transportation <strong>and</strong> material moving occupations (16percent). Similarly, in business services, the largest decline in jobs was in the <strong>of</strong>fice <strong>and</strong>administrative support occupations (27 percent), followed by installation, maintenance <strong>and</strong>repair occupations (20 percent) <strong>and</strong> computer <strong>and</strong> mathematical occupations (12 percent).While occupations, such as <strong>of</strong>fice <strong>and</strong> administrative occupations, were clearly IT-displaceable,others such as management occupations also appear susceptible to IT-enabled cost-cuttingduring a recessionary environment. Many <strong>of</strong> these occupations also have been susceptible tooutsourcing/<strong>of</strong>fshoring.9Bureau <strong>of</strong> Labor <strong>Statistics</strong>, “Occupational Employment <strong>Statistics</strong> by Industry” (January 2003) at http://www.bls.gov/oes/home.htm.54
DIGITAL ECONOMY 2003Appendix 4.A. Data <strong>and</strong> MethodsThe present analysis applies the growth decomposition methodology <strong>of</strong> Chapter 4, U.S.<strong>Department</strong> <strong>of</strong> Commerce, Digital Economy 2002, Washington, DC (February 2002), to moredata over a longer period. [The DE 2002 report is available at http://www.esa.doc.gov/pdf/DE2002r1.pdf.] A description <strong>of</strong> this methodology is included in Box 4.1, p. 32, <strong>of</strong> that report<strong>and</strong> spelled out in a separate mathematical Appendix to Chapter 4. The methodology followsBEA’s chained-dollar procedures to determine aggregate real (chained 1996 dollars) GDP <strong>and</strong>to decompose real GDP growth into the contributions <strong>of</strong> industries. The appendix also presentsa decomposition <strong>of</strong> total FTE growth into the contributions <strong>of</strong> industries. These two decompositionsare then combined to show the decomposition <strong>of</strong> aggregate GDP/FTE growth intoindustry-level contributions. The procedure is described below.DECOMPOSING AGGREGATE PRODUCTIVITY GROWTH (GDP PER FTE)INTO INDUSTRY-LEVEL CONTRIBUTIONSThe contribution <strong>of</strong> an industry to growth <strong>of</strong> aggregate GDP equals the growth <strong>of</strong> the industry’sGDP multiplied by its share in aggregate GDP. Similarly, an industry’s contribution to total FTEgrowth equals the growth <strong>of</strong> the industry’s FTE multiplied by its share in total FTE. In thisstudy, overall labor productivity growth equals growth <strong>of</strong> aggregate GDP minus growth <strong>of</strong> totalFTE. Therefore, an industry’s contribution to overall labor productivity growth equals thegrowth <strong>of</strong> the industry’s GDP multiplied by its share in aggregate GDP minus the growth <strong>of</strong> theindustry’s FTE multiplied by its share in total FTE. Contrast this, however, with the laborproductivity growth <strong>of</strong> an industry viewed in isolation. In the latter case, the industry’sproductivity growth equals the growth <strong>of</strong> its GDP minus the growth <strong>of</strong> its FTE. Thus, it can beseen that an industry with a positive productivity growth viewed in isolation could make anegative contribution to overall productivity growth if the industry has a smaller share inaggregate GDP than its share in total FTE. The converse case is possible that an industry witha negative productivity growth viewed in isolation could make a positive contribution to overallproductivity growth if the industry has a larger share in aggregate GDP than its share in totalFTE. In general, these possibilities imply that it could be misleading to gauge an industry’scontribution to the overall performance <strong>of</strong> the economy simply by looking at the performance<strong>of</strong> the industry in isolation. These considerations underlie this chapter’s decomposition <strong>of</strong>overall productivity growth into the contributions <strong>of</strong> individual industries.DETERMINING MORE IT-INTENSIVE TOP-HALF AND LESS IT-INTENSIVEBOTTOM-HALF GROUPS OF INDUSTRIESIn Chapter 4 <strong>of</strong> DE 2002, the IT-intensity ranking was determined for 55 two-digit SICindustries based on the highest to lowest 1996 value <strong>of</strong> the ratio <strong>of</strong> IT capital to FTE workersfor each industry divided by the overall ratio <strong>of</strong> IT capital to FTE workers for all industries.Industries were then divided into a top-half group (i.e., those relatively more IT-intensiveindustries accounting for a 50 percent share <strong>of</strong> aggregate nominal GDP) <strong>and</strong> a bottom-halfgroup (i.e., those relatively less IT-intensive industries accounting for the remaining 50 percent<strong>of</strong> GDP). Each industry’s share is the average <strong>of</strong> its annual shares <strong>of</strong> nominal GDP during1989–2000. Data on IT capital, GDP <strong>and</strong> FTE are from BEA. IT data are net stocks at currentcost that include 15 <strong>of</strong> BEA’s nonresidential fixed asset types from mainframe computers to<strong>of</strong>fice <strong>and</strong> accounting equipment.55
DIGITAL ECONOMY 2003In this analysis, the IT-intensity ranking <strong>of</strong> industries is new in that it is no longer based only onthe 1996 value defined above but on the average <strong>of</strong> similar annual values for each industryduring 1989–2001. This matches the determination <strong>of</strong> the top-half <strong>and</strong> bottom-half groups <strong>of</strong>industries above based on the average <strong>of</strong> annual shares <strong>of</strong> nominal GDP for the period 1989–2001, which adds 2001 to the period covered by Chapter 4, DE 2002. As a result, threeindustries that were close to the cut-<strong>of</strong>f between the top-half <strong>and</strong> bottom-half groups in theprevious ranking were shifted in this new ranking. (See Appendix 4.B for a listing <strong>of</strong> industriesbased on the new ranking.) Two industries [nonmetallic minerals, except fuels (SIC 14) <strong>and</strong>miscellaneous repair services (SIC 76)] that were in the top-half group <strong>of</strong> industries in theearlier analysis <strong>of</strong> Chapter 4 above are now in the bottom-half. In exchange, one industry group[primary metal industries (SIC 33)] that was in the bottom-half <strong>of</strong> Chapter 4 is in the top-halfgroup in the present analysis.56
DIGITAL ECONOMY 2003Appendix 4.B. IT-Intensity RankingsTable 4.B. Part 1. IT-Intensity Rankings byRatio <strong>of</strong> Individual Industry Average ITEQ/FTE to Overall Average ITEQ/FTE<strong>and</strong> Cumulative Sum <strong>of</strong> Average Shares <strong>of</strong> Nominal GDPIndustry Average Cumulative SumITEQ/FTE over <strong>of</strong> Average SharesIndustry SIC Overall Average <strong>of</strong> NominalITEQ/FTE GDP (%)(1989–2001) (1989–2001)Top-Half IT-intensive Industries with 50 Percent Nominal GDP SharesTelephone <strong>and</strong> telegraph 481,482,489 22.21 2.82Nondepository institutions 61 11.41 3.55Pipelines, except natural gas 46 9.96 3.65Radio <strong>and</strong> television 483,484 9.70 4.49Electric, gas, <strong>and</strong> sanitary services 49 6.22 8.08Petroleum <strong>and</strong> coal products 29 5.80 8.66Oil <strong>and</strong> gas extraction 13 3.59 10.11Chemicals <strong>and</strong> allied products 28 3.23 12.67Transportation services 47 2.27 13.11Depository institutions 60 2.17 17.48Holding <strong>and</strong> other investment <strong>of</strong>fices 67 2.13 17.69Security <strong>and</strong> commodity brokers 62 2.12 19.30Motion pictures 78 2.00 19.73Tobacco products 21 1.99 20.00Metal mining 10 1.98 20.10Insurance carriers 63 1.73 22.17Railroad transportation 40 1.71 22.59Instruments <strong>and</strong> related products 38 1.51 23.56Wholesale trade 50,51 1.44 32.73Transportation by air 45 1.35 33.92Electronic <strong>and</strong> other electric equipment 36 1.19 36.40Paper <strong>and</strong> allied products 26 0.93 37.35Printing <strong>and</strong> publishing 27 0.85 38.93Industrial machinery <strong>and</strong> equipment 35 0.83 41.35Business services 73 0.79 47.20Other transportation equipment 37exc 371 0.77 48.28Primary metal industries 33 0.57 49.15Coal mining 12 0.57 49.35Note: BEA’s industry GDP at the 2-digit SIC level is too broad or lumpy for our purposes. IT intensity within a 2-digit industryvaries a great deal because some component 3-digit or 4-digit industries are IT-intensive while other are not. However, because<strong>of</strong> data constraints, we had to apply our IT intensity criterion at the 2-digit level. Thus, IT intensive <strong>and</strong> non-IT intensiveindustries within a 2-digit level are assigned the same 2-digit ranking. For example, SIC 35 <strong>and</strong> SIC 36 include the IT-producingindustries in this report (see Chapter I) that are IT-intensive. However, the IT intensity ranking <strong>of</strong> SIC 35 <strong>and</strong> SIC 36 puts themnear the bottom <strong>of</strong> the Top-Half group above because these 2-digit categories include3-digit <strong>and</strong> 4-digit industries that are non-IT-intensive.Source: ESA estimates derived from BEA data.57
DIGITAL ECONOMY 2003Table 4.B. Part 2. IT-Intensity Rankings byRatio <strong>of</strong> Individual Industry Average ITEQ/FTE to Overall Average ITEQ/FTE<strong>and</strong> Cumulative Sum <strong>of</strong> Average Shares <strong>of</strong> Nominal GDPIndustry Average Cumulative SumITEQ/FTE over <strong>of</strong> Average SharesIndustry SIC Overall Average <strong>of</strong> NominalITEQ/FTE GDP (%)(1989–2001) (1989–2001)Bottom-Half Less IT-intensive Industries with 50 Percent Nominal GDP ShareFood <strong>and</strong> kindred products 20 0.57 51.44Personal services 72 0.56 52.31Nonmetallic minerals, except fuels 14 0.55 52.48Legal services 81 0.55 54.35Miscellaneous repair services 76 0.52 54.73Motor vehicles <strong>and</strong> equipment 371 0.47 56.25Stone, clay, <strong>and</strong> glass products 32 0.45 56.83Water transportation 44 0.43 57.05Health services 80 0.41 64.81Other services, n.e.c. 83,84,86,87,89 0.37 70.21Insurance agents, brokers, <strong>and</strong> service 64 0.37 71.07Local <strong>and</strong> interurban passenger transit 41 0.34 71.31Trucking <strong>and</strong> warehousing 42 0.32 72.98Fabricated metal products 34 0.29 74.54Miscellaneous manufacturing industries 39 0.27 74.97Rubber <strong>and</strong> miscellaneous plastics products 30 0.24 75.81Textile mill products 22 0.24 76.26Auto repair, services, <strong>and</strong> parking 75 0.21 77.46Retail trade 52–59 0.17 89.54Lumber <strong>and</strong> wood products 24 0.17 90.24Hotels <strong>and</strong> other lodging places 70 0.15 91.37Leather <strong>and</strong> leather products 31 0.15 91.45Furniture <strong>and</strong> fixtures 25 0.15 91.82Amusement <strong>and</strong> recreation services 79 0.13 92.80Apparel <strong>and</strong> other textile products 23 0.12 93.29Construction 15,16,17 0.08 98.98Educational services 82 0.06 100.00Note: BEA’s industry GDP at the 2-digit SIC level is too broad or lumpy for our purposes. IT intensity within a 2-digit industryvaries a great deal because some component 3-digit or 4-digit industries are IT-intensive while other are not. However, because<strong>of</strong> data constraints, we had to apply our IT intensity criterion at the 2-digit level. Thus, IT intensive <strong>and</strong> non-IT intensiveindustries within a 2-digit level are assigned the same 2-digit ranking. For example, SIC 35 <strong>and</strong> SIC 36 include the IT-producingindustries in this report (see Chapter I) that are IT-intensive. However, the IT intensity ranking <strong>of</strong> SIC 35 <strong>and</strong> SIC 36 puts themnear the bottom <strong>of</strong> the Top-Half group above because these 2-digit categories include3-digit <strong>and</strong> 4-digit industries that are non-IT-intensive.Source: ESA estimates derived from BEA data.58
DIGITAL ECONOMY 2003Appendix 4.C. Comparison With Other Studies onIT’s Role in U.S. Productivity Growth AccelerationThis study decomposes overall productivity (aggregate GDP over total FTE) growth into thepercentage point contributions <strong>of</strong> individual industries (see Appendix 4.A) for each year during1989–01. This entire period is then broken into two sub-periods, 1989–95 <strong>and</strong> 1995–01, <strong>and</strong> thesimple averages <strong>of</strong> each industry’s annual percentage point contributions are computed for eachsub-period. The difference between the 1995–2001 average <strong>and</strong> the 1989–95 average is theindustry’s contribution to the acceleration (i.e., average overall growth during 1995–2001 lessthe average overall growth during 1989–95) in overall productivity growth. IT’s role in thisacceleration is assessed by classifying the industries into two groups, the more IT-intensive tophalfgroup <strong>and</strong> the less IT-intensive bottom-half group. (See Appendix 4.B.) Because thecontributions above are additive across industries, the sum <strong>of</strong> the contributions <strong>of</strong> the industriesin each sub-group can be obtained <strong>and</strong> compared as a basis for gauging IT’s role in productivitygrowth acceleration.Kevin J. Stiroh, “Information Technology <strong>and</strong> the U.S. Productivity Revival: What Do theIndustry Data Say?,” Federal Reserve Bank <strong>of</strong> New York, Staff <strong>Report</strong>s, no. 115 (January 2001)provides alternative methods for determining IT’s productivity impacts both at the aggregatelevel (employing separately a growth accounting framework, regression analysis, as well asproduction function estimation) <strong>and</strong> at the industry level, implementing a decomposition <strong>of</strong>overall productivity growth into percentage point contributions <strong>of</strong> individual industries. Stiroh’sdecomposition is conceptually similar to the decomposition framework <strong>of</strong> this chapter, but thereare some differences. One is that he defines productivity as output per hour where output is avalue-added measure, as it should be, for aggregate productivity but is either gross output (hispreferred definition) or value-added at the industry level. In contrast, in this chapter,productivity is defined as GDP per FTE for both aggregate <strong>and</strong> industry level productivity. Ouruse <strong>of</strong> GDP is based on the fact that GDP is value-added <strong>and</strong>, by definition, is the industry’scontribution to aggregate output. Moreover, the use <strong>of</strong> GDP at the industry level makes thedecomposition simpler because it does not involve intermediate inputs that cancel out at theaggregate level.To assess IT’s growth impacts in his decomposition framework, Stiroh classifies industries intoIT-producing, IT-using, <strong>and</strong> others. IT-using industries are those that have an “above-medianvalue for the preferred IT-intensity indicator, the 1995 nominal IT share <strong>of</strong> capital services.” Incontrast, IT-producing industries are not separated in this chapter but are part <strong>of</strong> the more ITintensivegroup defined above. On the whole, Stiroh’s IT-producing <strong>and</strong> IT-using groupscorrespond to this chapter’s more IT-intensive group <strong>and</strong> his “other industries” correspond tothe less IT-intensive group. Finally, he employs a similar framework for analyzing contributionsto productivity growth acceleration comparing average growth during 1987–95 to that during1995–99.Martin Neil Baily <strong>and</strong> Robert Z. Lawrence, “Do We Have a New E-conomy,” presented at theAmerican Economic Association Meetings, New Orleans, LA (January 5, 2001) also assess atthe industry level the role <strong>of</strong> IT in aggregate productivity growth. However, they do notdecompose aggregate productivity growth into industry-level contributions. Instead, they59
DIGITAL ECONOMY 2003determine the acceleration in productivity (an income-side measure <strong>of</strong> value-added per FTE)growth for each industry by the difference between an industry’s average productivity growthduring 1995–99 <strong>and</strong> the average during 1989–95. Then they compare each industry’sproductivity growth acceleration to the overall (for all private industries) average productivitygrowth acceleration from 1989–95 to 1995–99. The role <strong>of</strong> IT is then assessed by showing thatthose industries that are “intense IT users” (based on “IT spending relative to value added”)generally have higher individual productivity growth acceleration compared to the overallacceleration.McKinsey Global Institute, US Productivity Growth, 1995–2000, Washington, DC (October2001) implemented a procedure similar to this chapter’s framework for decomposing aggregateproductivity growth into individual industry contributions where at both the aggregate <strong>and</strong>industry levels output is a value-added measure (GDP) from BEA. One difference is that MGIuses BEA’s “persons engaged in production” (PEP) for employment while this chapter usesBEA’s FTE. The other difference is that, as part <strong>of</strong> the decomposition <strong>of</strong> aggregate productivitygrowth, this chapter uses BEA’s exact formula for an industry’s contribution to the growth <strong>of</strong>aggregate chained dollar GDP, while MGI uses an approximate formula (MGI, op. cit., ExhibitA4 <strong>of</strong> the chapter on “Objectives & Approach.”) Overall, however, this chapter’s <strong>and</strong> MGI’sempirical findings are quantitatively similar.A more recent study by Dale Jorgenson, Mun Ho, <strong>and</strong> Kevin Stiroh, “Lessons from the U.S.Growth Resurgence” (January 17, 2003), presented at the First International Conference on theEconomic <strong>and</strong> Social Implications <strong>of</strong> Information Technology, <strong>Department</strong> <strong>of</strong> Commerce,Washington DC, January 27–28, 2003, re-examined the role <strong>of</strong> IT during 1995 to 2000 when theU.S. experienced the unusual combination <strong>of</strong> rapid growth <strong>and</strong> lower inflation. They concludethat the U.S. productivity revival remains intact <strong>and</strong> that IT is the predominant source <strong>of</strong> thisrevival. Specifically, they found that the contribution <strong>of</strong> IT capital deepening from computerhardware, s<strong>of</strong>tware, <strong>and</strong> telecommunications equipment greatly exceeded the contribution fromall other forms <strong>of</strong> investment to labor productivity growth after 1995. Their findings areconsistent with those <strong>of</strong> this chapter.60
CHAPTER V:IT AND ECONOMIC PERFORMANCE:EVIDENCE FROM MICRO DATA STUDIESBy B.K. Atrostic <strong>and</strong> Ron Jarmin *Micro data—that is, data on individual businesses that underlie key economic indicators—allowus to go behind published statistics <strong>and</strong> ask how IT affects businesses’ economic performance.Years ago, analyses indicated a positive relationship between IT <strong>and</strong> productivity, even when<strong>of</strong>ficial aggregate statistics still pointed towards a “productivity paradox.” Now, such analysesshed light on how varied that relationship is across businesses, <strong>and</strong> how IT makes its impacts.This chapter focuses on research about businesses based on micro data collected by the U.S.Census Bureau. We highlight the kinds <strong>of</strong> questions about the use <strong>and</strong> impact <strong>of</strong> IT that onlymicro data allow us to address.Micro data studies in the United States <strong>and</strong> in other OECD countries show that IT affects theproductivity <strong>and</strong> growth <strong>of</strong> individual economic units. Specific estimates <strong>of</strong> the size <strong>of</strong> the effectvary among studies. Researchers comparing manufacturing plants in the United States <strong>and</strong>Germany, for example, find that in each country investing heavily in IT yields a productivitypremium, but that the premium is higher in the United States than it is in Germany. They als<strong>of</strong>ind that the productivity premium varies much more for U.S. manufacturers. This greatervariability is consistent with the view that the U.S. policy <strong>and</strong> institutional environments may bemore conducive to experimentation by U.S. businesses.What kind <strong>of</strong> IT investments do U.S. businesses make? Census Bureau data on U.S.manufacturing establishments show that they invest in both computer networks <strong>and</strong> the kind <strong>of</strong>complex s<strong>of</strong>tware that coordinates multiple business processes within <strong>and</strong> among establishments.About 50 percent <strong>of</strong> these plants have networks, while fewer than 10 percent haveinvested in this complex s<strong>of</strong>tware. Such a wide difference between the presence <strong>of</strong> networks <strong>and</strong>* Ms Atrostic (barbara.kathryn.atrostic@census.gov) is Senior Economist, <strong>and</strong> Mr. Jarmin (ron.s.jarmin@census.gov) isActing Director, Center for Economic Studies, U.S. Census Bureau.61
DIGITAL ECONOMY 2003complex s<strong>of</strong>tware in manufacturing, <strong>and</strong> equally wide-ranging differences in their presenceamong detailed manufacturing industries, highlight the diversity <strong>of</strong> IT use among businesses.Plants with networks have higher productivity, even after controlling for many <strong>of</strong> the plant’seconomic characteristics in the current <strong>and</strong> prior periods. Similar results are found in otherOECD countries. Some studies suggest that businesses need to make parallel investments inworker training <strong>and</strong> revised workplace practices before IT investments yield productivity gains.Careful micro data research shows that the relationship between IT <strong>and</strong> economic performanceis complex. “IT” emerges as a suite <strong>of</strong> alternatives from which businesses make differentchoices. Estimates <strong>of</strong> the size <strong>of</strong> the effect, <strong>and</strong> how IT makes its impact, remain hard topinpoint. Data gaps make it hard to conduct careful analyses on the effect <strong>of</strong> IT. Continuingefforts by researchers <strong>and</strong> statistical organizations are filling some <strong>of</strong> the data gaps, but the gapsremain largest for the sectors outside manufacturing—the sectors that are the most IT-intensive.More definitive research requires that statistical agencies make producing micro data a priority.What Are Micro Data?Micro data generally contain information about many characteristics <strong>of</strong> the economic unit, suchas plant employment, years in business, share <strong>of</strong> IT in costs, ways it uses IT, <strong>and</strong> its economicperformance. Micro data exist for both businesses <strong>and</strong> individuals, <strong>and</strong> can be developed byprivate <strong>and</strong> public organizations. This chapter focuses on research using micro data aboutbusinesses that are collected by the U.S. Bureau <strong>of</strong> the Census.BENEFITS OF MICRO DATA RESEARCHSt<strong>and</strong>ard analyses <strong>of</strong> productivity <strong>and</strong> similar economic phenomena frequently assume thatbusinesses are identical, at least within an industry, <strong>and</strong> therefore also respond similarly tochanges in economic circumstances. However, it is easy to challenge this assumption simply byobserving the variety <strong>of</strong> businesses in any industry, no matter how narrowly the industry isdefined, <strong>and</strong> how diverse their responses appear to be. Case studies in specific industriesrepeatedly bear out this observation.Micro data allow us to assess the diversity <strong>of</strong> businesses <strong>and</strong> track behaviors such as their entry<strong>and</strong> exit into an industry. They also allow us to document changes in businesses’ performance,such as employment, sales, <strong>and</strong> productivity, <strong>and</strong> see whether those changes are uniform amongindustries, within industries, or among businesses <strong>of</strong> given ages, sizes, <strong>and</strong> so forth. Twodecades <strong>of</strong> research using micro data reveal tremendous variety in the economic characteristics<strong>and</strong> performance <strong>of</strong> businesses at any time, <strong>and</strong> over time. 11An excellent summary is E. Barltesman <strong>and</strong> M. Doms, “Underst<strong>and</strong>ing Productivity: Lessons from LongitudinalMicrodata,” Journal <strong>of</strong> Economic Literature, Vol. 38 (September 2000). It reviews research conducted at the U.S. CensusBureau <strong>and</strong> gives references for reviews <strong>of</strong> micro data research conducted elsewhere. A detailed report on initial microdata research on productivity is provided in M. Baily, C. Hulten, <strong>and</strong> D. Campbell, “Productivity Dynamics in ManufacturingPlants,” Brookings Papers on Economic Activity: Microeconomics 1992.62
DIGITAL ECONOMY 2003Micro data can paint a clearer picture <strong>of</strong> how aggregate economic statistics change. They alsoallow researchers to apply econometric techniques that take account <strong>of</strong> the kinds <strong>of</strong> complexrelationships that simply cannot be presented in tables or other aggregated formats. Comparingfindings from research studies using different data sets allows us to see which estimates appearto be robust, <strong>and</strong> which ones seem to depend on the specific data we use, <strong>and</strong> on the specificequations we estimate.RESEARCH REQUIRES GOOD MICRO DATAMicro data research takes advantage <strong>of</strong> the high-quality information about individual businessesthat underlies major economic indicators. The micro data sets typically are large <strong>and</strong> nationallyrepresentative, making it more likely that they capture the tremendous diversity amongbusinesses. 2Researchers <strong>of</strong>ten are able to link data at the micro level across surveys <strong>and</strong> over time. Forexample, consider the new information on whether businesses have computer networks, <strong>and</strong>how they use those networks that was collected in the Computer Network Use Supplement(CNUS) to the 1999 Annual Survey <strong>of</strong> Manufactures (ASM). 3 The plant-level micro data aboutcomputer networks collected in the CNUS can be linked to information about employment,shipments, use <strong>of</strong> other inputs, etc., collected about the same plants in the 1999 ASM <strong>and</strong> toASMs for other years, <strong>and</strong> to data that was collected about the same plants in the 1997Economic Census. Such exact linkages yield much richer information bases than any singlesupplement, survey, or census alone. When micro data can be linked, researchers also can useeconometric techniques to control for unobserved characteristics that are specific to anindividual plant or business. These techniques allow researchers to have more confidence thatfindings, such as the effect <strong>of</strong> IT actually are due to IT <strong>and</strong> not to related but unmeasuredcharacteristics, such as good management or a skilled work force.The Role <strong>of</strong> Information Technologies in Business PerformanceRecent research using micro data generally concludes that IT <strong>and</strong> productivity are related.Indeed, micro data analyses indicated a positive relationship between IT <strong>and</strong> productivity when<strong>of</strong>ficial aggregate statistics still pointed towards a “productivity paradox.” Two recent reviews <strong>of</strong>plant- or firm-level empirical studies <strong>of</strong> information technology (including but not limited tocomputers) <strong>and</strong> economic performance conclude that the literature shows positive relationshipsbetween information technology <strong>and</strong> productivity. However, specific estimates <strong>of</strong> the size <strong>of</strong> theeffect vary widely among studies. How IT makes its impact also remains hard to pinpoint.2While micro data provide raw material for important analyses, they are not a panacea. Researchers must addresssignificant challenges when using existing micro data to analyze questions about the economic performance <strong>of</strong> businesses.See Z. Griliches, “Productivity, R&D, <strong>and</strong> the Data Constraint,” American Economic Review, Vol. 84 No. 1 (March 1994);<strong>and</strong> Z. Griliches, <strong>and</strong> J. Mairesse, “Production functions: The Search for Identification,” NBER Working Paper 5067(March 1995).3More information on these surveys is available at http://www.census.gov/eos/www/ebusiness614.htm.63
DIGITAL ECONOMY 2003THE ROLE OF IT IN PRODUCTIVITY—A BRIEF SURVEY OF THE LITERATUREMany recent studies use micro data to document <strong>and</strong> describe the productivity <strong>of</strong> different kinds<strong>of</strong> businesses, <strong>and</strong> to examine its sources. The simple model that suggests productivity growthoccurs among all existing plants simply does not fit with what the micro data show. Instead, themicro data show that much <strong>of</strong> aggregate productivity growth comes about through a much morediversified <strong>and</strong> dynamic process. Less productive plants go out <strong>of</strong> business, relativelyproductive plants continue, <strong>and</strong> the new entrants that survive are more productive than either.Micro data research on the effect <strong>of</strong> IT explores how IT fits into this complex picture <strong>of</strong> businessbehavior.Dozens <strong>of</strong> research papers over the last decade examine various facets <strong>of</strong> the relationshipbetween IT <strong>and</strong> productivity. Two recent reviews summarizing the current literature on IT <strong>and</strong>productivity conclude that there is an impact, although there is much variation among studies inthe estimated magnitudes <strong>of</strong> that effect (Dedrick, J., Gurbaxani, V., <strong>and</strong> K. Kraemer, 2003,“Information Technology <strong>and</strong> Economic Performance: A Critical Review <strong>of</strong> the EmpiricalEvidence,” ACM Computing Surveys, Vol. 35, No. 1, March <strong>and</strong> Stiroh, K. J., 2002,“Reassessing the Impact <strong>of</strong> IT in the Production Function: A Meta-Analysis,” Federal ReserveB<strong>and</strong> <strong>of</strong> New York, November). 4Dedrick et al. (2003) review over 50 articles published between 1985 <strong>and</strong> 2002, many <strong>of</strong> whichare firm-level studies with productivity as the performance measure. They conclude that firmlevelstudies show positive relationships, <strong>and</strong> that gross returns to information technologyinvestments exceed returns to other investments. They warn against concluding that highergross returns mean that plants are under-investing in information technology. Most studies donot adjust for the high obsolescence rate <strong>of</strong> information technology capital, which lowers netreturns. Also, total investment in information technology may be understated because moststudies measure only computer hardware, but not related labor or s<strong>of</strong>tware, or costs <strong>of</strong> coinvention,such as re-engineering business processes to take advantage <strong>of</strong> the new informationtechnology.Stiroh (2002) reviews twenty recent empirical studies <strong>of</strong> the relationship between informationtechnology <strong>and</strong> output <strong>and</strong> productivity. The studies generally find a positive effect <strong>of</strong>information technology on output. However, the estimates differ across studies, <strong>and</strong> the studiesdiffer in many dimensions, including time periods covered <strong>and</strong> specific estimation techniquesused. Stiroh looks for predictable effects <strong>of</strong> differences in characteristics <strong>of</strong> the studies, such astime periods, level <strong>of</strong> aggregation (e.g., industry, sector, or entire economy), <strong>and</strong> estimationtechniques. He finds that much <strong>of</strong> the variation across studies in the estimates <strong>of</strong> the effect <strong>of</strong>information technology probably reflects differences in characteristics <strong>of</strong> the studies.4Many <strong>of</strong> those studies, including many studies discussed in this chapter, were conducted at the Center for EconomicStudies (CES) at the U.S. Census Bureau. Appendix 5.A describes both CES, a research unit that conducts research <strong>and</strong>supports the needs <strong>of</strong> researchers <strong>and</strong> decision makers throughout government, academia, <strong>and</strong> business, <strong>and</strong> some <strong>of</strong> themajor data sources available there for micro data research on the impact <strong>of</strong> IT.64
DIGITAL ECONOMY 2003Stiroh also reports the findings <strong>of</strong> additional research he conducts using a single industry-leveldatabase to estimate many <strong>of</strong> the different equations used in the studies he reviewed. Hisresearch finds that information technology matters, but that even within a single database,estimates <strong>of</strong> the magnitude <strong>of</strong> that effect depend on the particular equation that is estimated.Finally, Stiroh notes a potential for publication bias. Because theory predicts a positiverelationship between IT <strong>and</strong> productivity, researchers may tend to report, <strong>and</strong> editors may tendto accept for publication, only those papers with the “right” results on the impact <strong>of</strong> IT.However, as his research demonstrates, estimates are sensitive to both the data used <strong>and</strong> theparticular equation that is estimated. He concludes that information technology matters, but thewide variation in empirical estimates means that much “depends on the details <strong>of</strong> theestimation” <strong>and</strong> “one must be careful about putting too much weight on any given estimates.”The conclusion that recent studies show a positive effect <strong>of</strong> information technology st<strong>and</strong>s incontrast to earlier studies, many <strong>of</strong> which found no relationship. Both Dedrick (2003) <strong>and</strong>Stiroh (2002) note that the best data available to early researchers suffered from small samplesizes, few or no small firms or plants, <strong>and</strong> lack <strong>of</strong> data on information technology investment.These data gaps may be why early micro data studies failed to find a relationship between IT<strong>and</strong> performance.CAUSE AND EFFECT: DOES USING IT MAKE BUSINESSES MORE PRODUCTIVE?The literature so far yields mixed findings on cause <strong>and</strong> effect between IT <strong>and</strong> plant-leveleconomic performance. Early research is limited to manufacturing. The first findings in thisarea were that more productive plants may be more likely to adopt best practices, including newtechnologies, <strong>and</strong> that they are able to afford to do so. 5 However, later research suggests that lessproductive plants may invest in those technologies, perhaps trying to boost their productivity. 6Recent research exp<strong>and</strong>s the scope <strong>of</strong> analysis <strong>of</strong> the effect <strong>of</strong> IT in the retail sector. It examinesthe relationship between investments in information technology <strong>and</strong> two performance measuresfor retail firms, productivity <strong>and</strong> growth in the number <strong>of</strong> establishments. The research findsthat, in retail, IT is closely related to productivity growth, but not to growth in the number <strong>of</strong>establishments that retail firms operate. 75R.H. McGuckin, M.L. Streitwieser, <strong>and</strong> M.E. Doms, “The Effect <strong>of</strong> Technology Use on Productivity Growth,” EconomicInnovation <strong>and</strong> New Technology Journal, 7 (October 1998).6Stolarick Kevin M., “Are Some Firms Better at IT? Differing Relationships between Productivity <strong>and</strong> IT Spending,”Center for Economic Studies Working Paper CES-WP-99-13, U.S. Census Bureau, Washington, DC (1999); <strong>and</strong> B.K.Atrostic, <strong>and</strong> S. Nguyen, “IT <strong>and</strong> Productivity in U.S. Manufacturing: Do Computer Networks Matter,” Center forEconomic Studies Working Paper CES-02-01, U.S. Bureau <strong>of</strong> the Census, Washington, DC (2002).7M. Doms, R. Jarmin, <strong>and</strong> S. Klimek, “IT Investment <strong>and</strong> Firm Performance in U.S. Retail Trade,” Center for EconomicStudies Working Paper CES-WP-02-14, U.S. Bureau <strong>of</strong> the Census, Washington, DC (2002).65
DIGITAL ECONOMY 2003Does the Business Environment Matter?—International ComparisonsAlthough researchers have found evidence <strong>of</strong> the effect <strong>of</strong> IT on productivity at the micro levelacross many countries, the effect on aggregate productivity <strong>and</strong> economic growth has variedacross countries. This is true even though IT is universally available. While the United States<strong>and</strong> a few other economies enjoyed the boom <strong>of</strong> the late 90s, many European economiesexperienced sluggish growth. Several explanations have been put forward including differencesin the policy <strong>and</strong> institutional settings across countries, measurement issues, <strong>and</strong> time lags(micro data research showed positive effects <strong>of</strong> IT in the United States before aggregatestatistics). Some have hypothesized that the U.S. economy was able to make more effective use<strong>of</strong> the new general-purpose technology <strong>of</strong> IT because its regulatory <strong>and</strong> institutional environmentpermits firms to experiment more. An important component <strong>of</strong> the U.S. ability in thisregard is the efficient reallocation <strong>of</strong> resources away from firms whose experiments in themarketplace fail, to those whose experiments succeed.The OECD’s Growth Project (Box 5.1) study found evidence that the Schumpeterian processes<strong>of</strong> churning <strong>and</strong> creative destruction (or market selection) yield greater economic effects in theUnited States than in other OECD countries. These processes affect aggregate productivitygrowth as lower productivity firms shrink <strong>and</strong> exit <strong>and</strong> higher productivity firms enter <strong>and</strong> grow.Is it the case that IT has had a greater impact on business performance in the United Statesbecause the U.S. policy <strong>and</strong> institutional environment is more conducive to market selection <strong>and</strong>learning?Box 5.1. OECD International Micro Data InitiativeNo single country has the resources <strong>and</strong> technical expertise to independently resolve all themeasurement issues <strong>and</strong> fill all the information gaps associated with measuring the impact <strong>of</strong> IT. TheOECD Growth Project provided a comprehensive analysis <strong>of</strong> the impact <strong>of</strong> information <strong>and</strong>communication technology (ICT) on productivity <strong>and</strong> economic growth in several OECD countries,using aggregate, industry-level, <strong>and</strong> plant-level data. Based on that project’s success, U.S.Commerce Secretary Evans requested additional micro data research, <strong>and</strong> provided the OECD withseed money. This new project seeks to build on efforts already under way in several OECD membercountries. One facet <strong>of</strong> the OECD micro data project on ICT is a series <strong>of</strong> multi-nationalcollaborations, with a small number <strong>of</strong> countries involved in each collaboration. Each group isdeveloping its own way <strong>of</strong> reconciling the differences in each country’s existing micro data that areimportant to comparative studies, such as the sectors covered, the scope <strong>of</strong> businesses included ineach sector, <strong>and</strong> the specific questions asked. The OECD project also seeks explicitly to fostercoordination <strong>and</strong> collaboration on e-business issues between data producers <strong>and</strong> data users in eachcountry. Project members are from both the OECD’s Statistical Working Party <strong>of</strong> the Committee onIndustry <strong>and</strong> Business Environment (largely data users focused on productivity <strong>and</strong> growth statistics)<strong>and</strong> the new Working Party on Indicators on the Information Society (largely producers <strong>of</strong> statisticalindicators).66
DIGITAL ECONOMY 2003Recent research using micro data from the United States <strong>and</strong> Germany attempts to address thisquestion. 8 The analysis first compares the differences between various groups (e.g., young vs.old, or those that invest heavily in IT vs. those that do not) <strong>of</strong> manufacturing establishmentswithin each country. These differences are then compared across the two countries. This allowsthe researchers to contrast the impact <strong>of</strong> IT on economic performance between the twocountries. The results suggest that U.S. manufacturing establishments benefit more frominvesting in IT <strong>and</strong> are more likely to experiment with different ways <strong>of</strong> conducting businessthan their German counterparts even after controlling for several plant specific factors such asindustry, age, size, <strong>and</strong> so on.Figure 5.1 summarizes results from an analysis <strong>of</strong> the impact <strong>of</strong> changing technologies onproductivity outcomes. For the analysis, businesses undergoing an episode <strong>of</strong> high investmentare assumed to be actively changing their technology. Manufacturers in both countries weregrouped according to investment intensity as defined by investment per worker. The researchersexamined investment in both general <strong>and</strong> IT-specific equipment. The core comparison grouphad no investment. The other two groups—with investment in any equipment, <strong>and</strong> investment inIT equipment—were split into “high” <strong>and</strong> “low” investment groups at the 75th percentile <strong>of</strong> theinvestment intensity distributions. Plants with “high” investment intensities were those withintensities exceeding at least 75 percent <strong>of</strong> all other investing plants. These computations weredone for both overall investment in equipment (excluding structures) <strong>and</strong> for IT equipment,giving a combined seven investment intensity categories. Businesses undergoing an episode <strong>of</strong>high investment intensity can be thought <strong>of</strong> as actively changing their technologies. The marketwill reward some <strong>of</strong> these <strong>and</strong> punish others.The crux <strong>of</strong> the analysis summarized in Figure 5.1 is to first compare the performance <strong>of</strong> plantsacross the various investment intensity groups to a baseline <strong>of</strong> firms with no investment withineach country (i.e., the bars for the listed investment intensity categories in the figure representthe percent difference from the omitted zero investment category for each country). Then theresearchers compared the within country differences across the United States <strong>and</strong> Germany tosee in which country the reward for experimentation (as measured by high investment episodes)is highest.Panel A shows that U.S. businesses that invest heavily, both overall <strong>and</strong> in IT, are much moreproductive than those that invest little or none at all. The same holds true for Germany, but theproductivity premium is much higher in the United States. Panel B shows that U.S. businessesthat invest heavily (i.e., are experimenting with new technologies) have more varied productivityoutcomes as measured by the st<strong>and</strong>ard deviation than do firms that invest little or not at all.This is not the case in Germany. In fact, the German data show that firms that invest intensivelyhave less varied productivity outcomes. This is consistent with the notion that the U.S. policy<strong>and</strong> institutional environment is more conducive to market experimentation. These resultsshould be viewed with caution as they relate to only two countries <strong>and</strong> there are many factorsthe researchers do not control for.8J. Haltiwanger, R. Jarmin, <strong>and</strong> T. Schank, “Productivity, Investment in ICT <strong>and</strong> Market Experimentation: Micro Evidencefrom Germany <strong>and</strong> the U.S.,” Center for Economic Studies Working Paper CES-03-06, U.S. Bureau <strong>of</strong> the Census,Washington, DC (2003).67
DIGITAL ECONOMY 2003Figure 5.1. Differences in Productivity Outcomesbetween Germany <strong>and</strong> the United States% Difference in Mean Productivity Relative toGroup with No Investment100%90%80%70%60%50%40%30%20%10%0%Panel A: U.S. Firms Investing Heavily in IT <strong>and</strong> Other Capital Have HigherProductivity PremiumsU.S.GermanyLow / 0 High / 0 Low / Low Low / High High / Low High / HighInvestment Intensity (Equipment / IT)Panel B: U.S. Firms Investing Heavily in IT <strong>and</strong> Other Capital Experience MoreVaried Productivity Outcomes% Difference in St<strong>and</strong>ard Deviation <strong>of</strong>Productivity Relative to Group with NoInvestment50%40%30%20%10%0%-10%-20%-30%U.S.Germany-40%Low / 0 High / 0 Low / Low Low / High High / Low High / HighInvestment Intensity (Equipment / IT)Note: Differences are in logs <strong>and</strong> are shown relative to a reference group <strong>of</strong> firm with zero total investment.Source: Haltiwanger, Jarmin <strong>and</strong> Schank 2003.DOES IT MATTER HOW IT IS USED?Businesses in the United States have used IT for fifty years. Originally, firms that used IT mayhave had advantage over competitors who did not. But today, simply investing in IT may nolonger be enough. The question for economic performance is no longer whether IT is used, buthow it is used.68
DIGITAL ECONOMY 2003Figure 5.2. Computer Networks Were Common inU.S. Manufacturing Industries in 1999,But Sophisticated Network S<strong>of</strong>tware Was Not10090Plants with NetworksEmployment at Plants with NetworksPlants with Fully Integrated Enterprise Resource Planning S<strong>of</strong>tware807060Percent50403020100ALL MANUFACTURINGDurable goods industries321 – Wood products327 – Nonmetallic mineral products331 – Primary metals332 – Fabricated metal products333 – Machinery334 – Computer <strong>and</strong> electronic products335 – Electrical equipment, <strong>and</strong> related336 – Transportation equipment337 – Furniture <strong>and</strong> related products339 – MiscellaneousNondurable goods industries311 – Food products312 – Beverage <strong>and</strong> tobaccoNAICS 3-Digit Industry313 – Textile mills314 – Textile product mills315 – Apparel316 – Leather <strong>and</strong> allied products322 – Paper323 – Printing <strong>and</strong> related activities324 – Petroleum <strong>and</strong> coal products325 – Chemicals326 – Plastics <strong>and</strong> rubber productsSource: Atrostic, B.K. <strong>and</strong> J. Gates, 2001, “U.S. Productivity <strong>and</strong> Electronic Business Processes in Manufacturing,”CES-WP-01-11, Center for Economic Studies, U.S. Bureau <strong>of</strong> the Census, Washington, DC.New data from the 1999 Computer Network Use Supplement (CNUS) to the 1999 AnnualSurvey <strong>of</strong> Manufactures (ASM) are beginning to be used to model how manufacturing plantsuse computer networks in the United States. Respondents’ answers to questions about processescan be linked to the information the same respondents reported on regular ASM survey forms,such as the value <strong>of</strong> shipments, employment, <strong>and</strong> product class shipments. Figure 5.2 presentsresearchers’ estimates <strong>of</strong> the diffusion <strong>of</strong> computer networks. The research finds that computernetworks are widely diffused within manufacturing, with networks at about half <strong>of</strong> all plants.The share <strong>of</strong> employment at plants with networks is almost identical in durable <strong>and</strong> non-durablemanufacturing. Use <strong>of</strong> networks varies a great deal within those sub-sectors; the share <strong>of</strong> plantswith networks ranges from lows <strong>of</strong> about 30 percent to highs <strong>of</strong> about 70 percent.The CNUS also provides new information about some aspects <strong>of</strong> how plants use computernetworks. Figure 5.2 reports estimates <strong>of</strong> the diffusion <strong>of</strong> fully integrated enterprise resourceplanning s<strong>of</strong>tware (FIERP); that is, the kind <strong>of</strong> s<strong>of</strong>tware that links different kinds <strong>of</strong> applications(such as inventory, tracking, <strong>and</strong> payroll) within <strong>and</strong> across businesses. Plants in all manufacturingindustries use this complex s<strong>of</strong>tware. However, FEIRP s<strong>of</strong>tware remains relatively rarecompared to computer networks. While about half <strong>of</strong> all manufacturing plants have networks,fewer than 10 percent have this kind <strong>of</strong> s<strong>of</strong>tware.69
DIGITAL ECONOMY 2003Initial research finds that computer networks have a positive <strong>and</strong> significant effect on plant’slabor productivity. After accounting for multiple factors <strong>of</strong> production <strong>and</strong> plant characteristics,productivity is about five percent higher in plants with networks. 9 When economic characteristicsin prior periods <strong>and</strong> investment in computers are also accounted for, there continues to bea positive <strong>and</strong> statistically significant relationship between computer networks <strong>and</strong> U.S.manufacturing plant productivity. 10These initial findings for the United States are consistent with findings for other countries.Recent research for Canada, the Netherl<strong>and</strong>s, <strong>and</strong> the United Kingdom, for example, all findpositive relationships between using computer networks <strong>and</strong> productivity. 11 Research for Japanfinds that computer expenditures <strong>and</strong> computer networks both affected productivity between1990 <strong>and</strong> 2001. In more recent years, the effects are larger, but they also vary much more amongindustries. 12Some micro data research for the United States during the 1990s suggests that IT needs to beused together with worker training <strong>and</strong> revised workplace practices to yield productivity gains.These findings are based on data containing detailed information about the use <strong>of</strong> computers inthe workplace. They also contain information rarely available in other sources on the employers’management <strong>and</strong> worker training policies. 13 Research for Australia <strong>and</strong> Canada, previously cited,also finds that returns to IT are intertwined with the use <strong>of</strong> R&D, innovation, <strong>and</strong> changes inworkplace practices <strong>and</strong> organization. This line <strong>of</strong> research suggests that IT is important, but thatit makes its impact when accompanied by changes in other factors <strong>and</strong> practices.IS THE IMPACT OF IT THE SAME FOR ALL KINDS OF IT, EVERYWHERE?—EVIDENCEFROM STUDIES OF MARKET STRUCTUREIT was widely expected to alter the structure <strong>of</strong> markets. The direction, however, was unclear.Lower information costs might make it easier for smaller businesses to collect, analyze, <strong>and</strong> useinformation <strong>and</strong> so allow them to enter distant markets or compete more effectively with largerfirms. At the same time, the lower information costs might make it easier for larger businesses9Atrostic <strong>and</strong> Nguyen (2002).10Atrostic <strong>and</strong> Nguyen, “The Impact Of Computer Investment And Computer Network Use On Productivity,” paperpresented NBER-CRIW Conference on “Hard-to-Measure Goods <strong>and</strong> Services: Essays in Memory <strong>of</strong> Zvi Griliches,”Washington, DC (September 2003).11J. Baldwin, <strong>and</strong> D. Sabourin, “Impact <strong>of</strong> the Adoption <strong>of</strong> Advanced Information <strong>and</strong> Communication Technologies onFirm Performance in the Canadian Manufacturing Sector,” Research Paper Series, 174, Analytical Studies Branch,<strong>Statistics</strong> Canada (October 2001) present findings for Canada. E. Bartlesman, G. van Leeuwen, <strong>and</strong> H.R. Nieuwenhuijsen,“Advanced Manufacturing Technology <strong>and</strong> Firm Performance in the Netherl<strong>and</strong>s,” Netherl<strong>and</strong>s Official <strong>Statistics</strong>, Vol. 11(Autumn 1996) present findings for the Netherl<strong>and</strong>s. C. Criscuolo <strong>and</strong> K. Waldron, “e-Commerce use <strong>and</strong> firm productivity,”Economic Trends (November 2003) present findings for the United Kingdom.12K. Motohashi, “Firm level analysis <strong>of</strong> information network use <strong>and</strong> productivity in Japan,” presented at the conferenceon Comparative Analysis <strong>of</strong> Enterprise (micro) Data, London (September 2003).13S. Black, <strong>and</strong> L. Lynch, “How to Compete: The Impact <strong>of</strong> Workplace Practices <strong>and</strong> Information Technology onProductivity,” Review <strong>of</strong> <strong>Economics</strong> <strong>and</strong> <strong>Statistics</strong>, Vol. 83 No. 3 (August 2001); <strong>and</strong> D. Neumark <strong>and</strong> P. Cappelli, “Do‘High Performance’ Work Practices Improve Establishment-Level Outcomes?” Industrial <strong>and</strong> Labor Relations Review(July 2001).70
DIGITAL ECONOMY 2003to retain a competitive advantage. Similarly, use <strong>of</strong> the Internet might make it easier forconsumers to compare prices, <strong>and</strong> so lead to a reduction in prices for products sold on-line orin “bricks <strong>and</strong> mortar” establishments. At the same time, a firm building an on-line sales-basedbusiness may incur costs that brick <strong>and</strong> mortar businesses might not, such as cost associatedwith having inventories available for immediate delivery anywhere in the United States (or theworld). The issues are scarcely settled. In this section, selected examples from micro dataresearch illustrate IT’s multifaceted nature <strong>and</strong> complex economic effects.TruckingA series <strong>of</strong> studies make use <strong>of</strong> public-use truck-level data from the Census’ Vehicle Inventory<strong>and</strong> Use Surveys to examine how IT has affected the trucking industry. Each <strong>of</strong> these studiesindicates the importance <strong>of</strong> knowing not just that IT is used, but also the details <strong>of</strong> the IT <strong>and</strong>how it is used.These studies examine the impact <strong>of</strong> two classes <strong>of</strong> on-board computers (OBCs). St<strong>and</strong>ardOBCs function as trucks’ “black boxes,” recording how drivers operate the trucks. These enabledispatchers to verify how truck drivers drive. Advanced OBCs also contain capabilities that,among other things, allow dispatchers to determine where trucks are in real time <strong>and</strong>communicate schedule changes to drivers while drivers are out on the road. These advancedcapabilities help dispatchers make <strong>and</strong> implement better scheduling decisions, <strong>and</strong> help themavoid situations where trucks <strong>and</strong> drivers are idle, awaiting their next haul.One <strong>of</strong> these studies assesses OBCs’ impact on productivity by estimating how much they haveincreased individual trucks’ utilization rate, as measured by their loaded miles during the timethey are in service. 14 It finds that advanced OBCs have increased truck utilization by 13 percentamong trucks that adopt them; overall, this effect implies a three percent increase in capacityutilization industry-wide, which translates to about $16 billion in annual benefits. The vastmajority <strong>of</strong> this increase comes from trucks in the for-hire, long-haul segment <strong>of</strong> the industry,<strong>and</strong> most <strong>of</strong> these returns only began to accrue years after trucking firms first began to adoptOBCs. In contrast, the study finds no evidence that st<strong>and</strong>ard OBCs have led to increased truckutilization. Combined, these results indicate not just the magnitude <strong>of</strong> IT’s impact onproductivity in the industry but also its nature <strong>and</strong> timing. IT adoption has led to largeproductivity gains due to advanced OBCs’ real-time communication capabilities, which enabletrucking firms to ensure that trucks operating far from their base are on the road <strong>and</strong> loaded.These gains, however, appear to have lagged adoption by several years.The other two studies examine how OBCs have affected how the industry is organized. Onestudy investigates how OBCs affect whether shippers use internal fleets or for-hire carriers toship goods. 15 This study finds that the different classes <strong>of</strong> OBCs have different effects on this14T. Hubbard, 2003, “Information, Decisions, <strong>and</strong> Productivity: On-Board Computers <strong>and</strong> Capacity Utilization inTrucking,” American Economic Review, September.15G. Baker <strong>and</strong> T. Hubbard, “Make Versus Buy in Trucking: Asset Ownership, Job Design, <strong>and</strong> Information,” AmericanEconomic Review, Vol. 93 No. 3 (June 2003).71
DIGITAL ECONOMY 2003decision. The diffusion <strong>of</strong> st<strong>and</strong>ard OBCs has tended to increase shippers’ use <strong>of</strong> internal fleets,but the diffusion <strong>of</strong> advanced OBCs has tended to increase their use <strong>of</strong> for-hire fleets. Thisimplies that IT-enabled improvements in monitoring drivers have led shippers to integrate moreinto trucking, but IT-enabled improvements in scheduling capabilities have led to morecontracting-out <strong>of</strong> trucking. This systematic difference indicates that whether IT tends to lead tolarger, more integrated firms or to smaller, more focused firms depends critically on the newcapabilities the IT provides.The second <strong>of</strong> the two organizational studies is similar: it investigates how OBCs have affectedwhether drivers own the trucks they operate. 16 Traditionally, “owner-operators” have been animportant part <strong>of</strong> the industry. An advantage associated with owner-operators is that they havestrong incentives to drive in ways that preserve their trucks’ value; these incentives havetraditionally been far weaker for “company drivers,” who do not own their trucks. This studyshows that OBC diffusion has diminished the use <strong>of</strong> owner-operators. By allowing firms tomonitor how drivers drive, OBCs have eliminated an important incentive advantage <strong>of</strong> owneroperators,<strong>and</strong> have led trucking firms to subcontract fewer hauls out to such individuals.Residential Real EstateThe Internet vastly increases the amount <strong>of</strong> information on housing vacancies that is readilyavailable to consumers. Previous research had shown that high costs <strong>of</strong> information <strong>and</strong> lack <strong>of</strong>access to information limited housing searches. The best information available to consumerstended to be for properties near their current location. In addition, research found thatinformation intermediaries such as real estate agents influenced the options that consumersconsidered. The increased information that the Internet makes available to consumers potentiallyreduces or eliminates those limits. Consumers can readily learn about properties far fromtheir current locations, <strong>and</strong> can do so relatively directly (there still may be some influenceexerted in how web sites are set up, for example, <strong>and</strong> consumers may not immediately, or ever,get to the best web site for their needs).Two recent studies use micro data to assess the effect <strong>of</strong> using the Internet to search for housing.In these cases, micro data from the public-use Current Population Survey provide basicinformation on what kinds <strong>of</strong> consumers use the Internet to search for housing. However, theCPS does not have information about the homes that Internet users purchased. To addressquestions about the kinds <strong>of</strong> homes purchased, the researchers surveyed a sample <strong>of</strong> recenthome purchasers in a county in North Carolina. Characteristics <strong>of</strong> buyers who used the Internetas a source <strong>of</strong> information about housing vacancies were generally similar to those <strong>of</strong> buyerswho only used conventional information sources, except that Internet users were younger. Theresearchers conclude that using the Internet to shop for housing does not seem to effectgeographic search patterns, or to lead consumers to pay lower prices for comparable homes.Although using the Internet might be expected to decrease the number <strong>of</strong> homes buyers visited,because they would have more information about the houses <strong>and</strong> neighborhoods, the studies16G. Baker <strong>and</strong> T. Hubbard, “Contractibility <strong>and</strong> Asset Ownership: On-Board Computers <strong>and</strong> governance in U.S. Trucking,”http://gsbwww.uchicago.edu/fac/thomas.hubbard/research/papers/paper_424.pdf (April 2003).72
DIGITAL ECONOMY 2003instead find that homebuyers who use the Internet as an information source make personal visitsto more houses. 17The Impact <strong>of</strong> IT on WagesDo “knowledge workers” receive wage premiums because they use computers? Does the use <strong>of</strong>IT increase the dem<strong>and</strong> for more-educated workers? Does the growing use <strong>of</strong> computers byworkers in some sectors <strong>of</strong> the economy explain shifts in the distribution <strong>of</strong> wages? Initial microdata research answered the first question with a resounding “yes.” One early study, for example,found that the pay <strong>of</strong> workers who used computers was 10 to 15 percent higher than the pay <strong>of</strong>similar workers who did not. 18 However, more recent studies that make use <strong>of</strong> more detailedinformation about workers <strong>and</strong> jobs over multiple periods find that the answer is more nuanced.IT potentially affects many aspects <strong>of</strong> the performance <strong>of</strong> businesses. It also may affect thewages, <strong>and</strong> other characteristics <strong>of</strong> jobs. Asking how IT affects wages is actually asking twoquestions. The first question is whether jobs where workers use computers pay higher wages. Ifthe answer is yes, the second question is why.As with IT use in businesses, determining cause <strong>and</strong> effect <strong>of</strong> IT use on wages is hard. The jobsmight pay higher wages because they require high skill levels. Some IT-using jobs, such ascomputer programmers <strong>and</strong> systems analysts, clearly require high skill levels, as do jobs suchas architects who use computer-assisted design programs. However, computers appear throughoutmany workplaces. Workers may use computerized diagnostic equipment <strong>and</strong> programmablelogic controllers, for example, in production applications. Office <strong>and</strong> service workers may useword processors <strong>and</strong> spreadsheets, e-mail, computerized billing systems, <strong>and</strong> so forth. Suchjobs might pay higher wages if using a computer makes a worker with a given skill level moreproductive, but they generally do not require the workers to know much about principles <strong>of</strong>programming, or system or network design. Finally, the use <strong>of</strong> IT may allow computers tosubstitute for low-skilled workers performing repetitive tasks.Micro data studies in the United States, Europe, <strong>and</strong> Canada all find that workers usingcomputers at work have much higher wages than workers who do not. The difference typicallyis on the order <strong>of</strong> 10 to 20 percent. However, these studies all used data from a single period, <strong>and</strong>many <strong>of</strong> them lack information about other aspects <strong>of</strong> the job, the worker, <strong>and</strong> the employer.This makes it hard to determine whether the workers have higher wages because they use acomputer, or because important unobserved characteristics <strong>of</strong> the employer (is it highlyproductive regardless <strong>of</strong> the use <strong>of</strong> computers?) or the worker (is the worker already highlyskilled before using a computer?) may affect managers’ decisions on investing in computers <strong>and</strong>17R. Palm <strong>and</strong> M. Danis, “Residential Mobility: The Impacts <strong>of</strong> Web-Based Information on the Search Process <strong>and</strong>Spatial Housing Choice Patterns,” Urban Geography, Vol. 22, No. 7 (2001); <strong>and</strong> R. Palm <strong>and</strong> M. Danis, “The Internet <strong>and</strong>Home Purchase,” Journal <strong>of</strong> Economic <strong>and</strong> Social Geography, Vol. 93, No. 5 (2002).18A. Krueger, “How Computers Have Changed the Wage Structure: Evidence from Microdata, 1984–1989,” QuarterlyJournal <strong>of</strong> <strong>Economics</strong>, Vol. 108 No. 1 (February 1993).73
DIGITAL ECONOMY 2003assigning them to which employees. A new study reviewing recent research on the impact <strong>of</strong> ITon employment, skills, <strong>and</strong> wages concludes that the story is complex. 19Studies find that having information on plant characteristics <strong>and</strong> work practices matters. Forexample, a study finding that workers using computers in Germany had higher wages thanworkers who did not also found that a similar wage differential accrued to workers usingtelephones or pencils, or who worked sitting down. 20 The implication is that the wagedifferential really reflected the fact that workers using computers, telephones, or pencils, or whowork sitting down, receive higher wages because they have higher skills. This research suggeststhat IT is associated with substantial wage differentials, but does not cause them. Studies forFrance <strong>and</strong> Canada find similar wage differentials. 21Researchers using French <strong>and</strong> Canadian micro data also have matched sets <strong>of</strong> data on employers<strong>and</strong> workers in those countries, <strong>and</strong> have two or more years <strong>of</strong> data. Studies using these matcheddata all find that substantial cross-section returns to computer use fall sharply when they makeuse <strong>of</strong> information about changes in both the worker <strong>and</strong> employer characteristics. Estimatesdiffer by country <strong>and</strong> study, but the final differentials are modest, 1 to 4 percent. 22These studies also find that the relatively modest wage differential associated with computer usevaries markedly across occupations <strong>and</strong> among workers with different levels <strong>of</strong> education. Forexample, a study for Canada finds that more highly educated workers, white-collar workers, <strong>and</strong>those adopting the computer for scientific applications receive higher than average wagepremiums, while other workers do not receive wage premiums when they start using computerson the job. The reasons for such differences remain unresolved. It may be more costly to teachsome groups <strong>of</strong> workers to use computers, or groups may differ in the proportion <strong>of</strong> computertraining costs that they share with the employer (with lower employer shares resulting in higherwages). The researchers find that controlling for training increases the small or zero wagepremiums they otherwise find for many low-skilled groups. They speculate that, if appropriatedata were available to test for long-run effects, controlling for training <strong>and</strong> other workercharacteristics might show positive wage differentials for most workers using computers. 23Some detailed case studies (studies <strong>of</strong> specific businesses, usually anonymous) suggest anotherreason for differences in the wage differential associated with using computers at work. One19M. H<strong>and</strong>el, “Implications <strong>of</strong> Information Technology for Employment, Skills, <strong>and</strong> Wages: A Review <strong>of</strong> Recent Research,”SRI International, SRI Project Number P10168, Final <strong>Report</strong> (July 2003).20J. DiNardo <strong>and</strong> J. Pischke, “The Returns to Computer Use Revisited: Have Pencils Changed the Wage Structure Too?”The Quarterly Journal <strong>of</strong> <strong>Economics</strong>, Vol. 112 No. 1 (February 1997).21H. Entorf, M. Gollac, <strong>and</strong> F. Kramarz, “New Technologies, Wages, <strong>and</strong> Worker Selection.” Journal <strong>of</strong> Labor <strong>Economics</strong>(1999), <strong>and</strong> H. Entorf, <strong>and</strong> F. Kramarz, “Does Unmeasured Ability Explain the Higher Wages <strong>of</strong> New TechnologyWorkers?” European Economic Review, Vol. 41 (1997); <strong>and</strong> C. Zoghi <strong>and</strong> S. Pabilonia, “Which Workers Gain fromComputer Use?” Paper presented at NBER Summer Meetings (July 2003).22E.g., Entorf <strong>and</strong> Kramarz 1997.23C. Zoghi <strong>and</strong> S. Pabilonia 2003.74
DIGITAL ECONOMY 2003case study examined the effect <strong>of</strong> introducing computers into the operations <strong>of</strong> a financialorganization. For some occupations, the case study found that computers substitute for theroutine work that individuals previously performed, reducing the need for such workers. Inother occupations, however, computers appear to take on routine tasks <strong>and</strong> free workers toperform more complex, higher skilled, problem-solving activities. 24 If IT also allows thebusiness to alter the way it works <strong>and</strong> organize itself more productively, it may raise the skillrequirements for all workers in the business, even if they do not directly use computers.Insights from the International Micro Data InitiativeA wave <strong>of</strong> new literature in plant- or firm-level research on the effects <strong>of</strong> IT has been conductedin countries participating in the OECD. 25 (See box 5.1.) As with research using U.S. micro data,the micro data research conducted in other countries also find links between IT <strong>and</strong>productivity. Where information on computer networks is available, or other measures <strong>of</strong> howcomputers are used, the research again suggests that it is not just having IT, but how IT is usedthat effects economic performance measures such as productivity.Two kinds <strong>of</strong> studies are being undertaken. Some studies base their research on new data on ITfor a single country. They make use <strong>of</strong> as much information as they can, <strong>and</strong> choose empiricaltechniques best suited to their data. Studies such as these contribute important insights,particularly when one country has information that other countries do not, or researchers areable to use techniques that help ensure that the measured effects indeed are due to IT. However,this strength also makes it hard to compare such estimates across countries.Studies from individual OECD countries find that IT has an impact on productivity <strong>and</strong>economic performance. Significant effects <strong>of</strong> IT on productivity are found in the service sectorin Germany. 26 Recent research for France finds that one specific kind <strong>of</strong> network, the Internet,is associated with productivity gains, but other kinds <strong>of</strong> networks, which have been in use muchlonger, are not. 27 Canadian research finds that adopting IT is associated with growth in bothproductivity <strong>and</strong> market share. 28 Use <strong>of</strong> computers in Australia also is associated withproductivity growth, with effects that vary across industries <strong>and</strong> are intertwined with otherfactors, such as the skill <strong>of</strong> a business’ work force, its organization <strong>and</strong> re-organization, <strong>and</strong> itsinnovativeness. 2924D. Autor, F. Levy <strong>and</strong> R. Murnane, “Upstairs, Downstairs: Computer-Skill Complementarity <strong>and</strong> Computer-LaborSubstitution on Two Floors <strong>of</strong> a Large Bank,” Industrial & Labor Relations Review 55(3) (2002).25Research to date is summarized in D. Pilat, ICT <strong>and</strong> Economic Growth: Evidence from OECD Countries, Industries,<strong>and</strong> Firms (Paris: OECD, 2003).26T. Hempell, “What’s Spurious, What’s Real? Measuring the Productivity Impacts <strong>of</strong> ICT at the Firm-Level,” DiscussionPaper 02-42, Centre for European Economic Research (Zentrum für Europäische Wirtschaftsforschung GmbH; ZEW,2002), ftp://ftp.zew.de/pub/zew-docs/dp/dp0242.pdf.27B. Crépon, T. Heckel, <strong>and</strong> N. Riedinger, http://www.nber.org/CRIW/papers/crepon.pdf, Paper presented at “R&D,Education, <strong>and</strong> Productivity,” NBER CRIW conference in honor <strong>of</strong> Zvi Griliches (Paris: August 2003).28J. Baldwin <strong>and</strong> D. Sabourin 2001.29G. Gretton, J. Gali, <strong>and</strong> D. Parham, “Uptake <strong>and</strong> impacts <strong>of</strong> ICTs in the Australian economy,” paper presented atOECD, Paris, December 2002.75
DIGITAL ECONOMY 2003Another group <strong>of</strong> studies tries to use as many variables <strong>and</strong> analytical techniques as possiblethat are similar to those used by researchers in a few other countries. 30 This approach mayexclude some variables <strong>and</strong> some analytical techniques, if researchers in several countriescannot use them. On the other h<strong>and</strong>, this kind <strong>of</strong> coordination makes it more likely that similarempirical findings are actually due to IT, <strong>and</strong> that differences in empirical findings are due todifferences in economic conditions <strong>and</strong> other factors among countries.An example is a group <strong>of</strong> researchers conducting parallel analyses for the United States,Denmark, <strong>and</strong> Japan. 31 Preliminary findings are that IT is positively related to productivity in allthree countries, but that the relationship depends on the type <strong>of</strong> IT used, the sector, <strong>and</strong> timeperiod. Early results for Denmark show a significant correlation between several measures <strong>of</strong>the firm’s performance <strong>and</strong> use <strong>of</strong> the Internet, but not for other uses <strong>of</strong> IT. For Japan,productivity levels are consistently higher for firms using IT networks. However, growth inlabor productivity varies by type <strong>of</strong> network <strong>and</strong> how the network is used, <strong>and</strong> the effect <strong>of</strong>Internet use is higher for retail trade firms than for manufacturing firms. For U.S. manufacturingplants, there is a strong relationship between use <strong>of</strong> computer networks <strong>and</strong> labor productivity.Better Micro Data Research Requires Better Micro DataBecause the micro data are typically collected for other purposes, such as constructing keyeconomic indicators, we almost always find that they lack some (<strong>of</strong>ten, much) <strong>of</strong> theinformation needed to address questions such those about the pervasiveness <strong>of</strong> IT <strong>and</strong> its effect.These gaps simply do not allow us to draw firm conclusions about the effect <strong>of</strong> IT. For example,research exploring the micro-level link between IT <strong>and</strong> economic performance may not alwaysbe able to separate the role <strong>of</strong> IT from other related but unobserved characteristics <strong>of</strong> the plant.Well-managed plants may use IT as one <strong>of</strong> many tools to achieve performance goals. If we haveinformation about IT, but not about management practices, the research may attributeperformance effects to IT that really are due to good management.Estimating plant-level relationships among computers, computer networks, <strong>and</strong> productivityalso is hard to do with existing data because many <strong>of</strong> the most important concepts—what abusiness produces (output), <strong>and</strong> all the factors it uses to make its product (such as labor, capital,energy, etc., known as “inputs”), as well as IT itself—are difficult to define, <strong>and</strong> data based onthese concepts are hard to collect. 32 Continuing research on these concepts leads to improve-30For example, researchers in several countries are using the approach taken by U.S. researchers (Atrostic <strong>and</strong> Nguyen2002), <strong>and</strong> using its findings as the benchmark against which they are comparing research findings using their owncountries’ data.31B.K. Atrostic, P. Boegh-Nielsen, K. Motohashi, <strong>and</strong> S. Nguyen, “Information Technology, Productivity, <strong>and</strong> Growth inEnterprises: Evidence from New International Micro Data,” L’acutalité économique (forthcoming 2004).32A large literature lays out major data gaps in estimating the impact <strong>of</strong> information technology on economic performance.For example, conferences conducted by the NBER Conference on Research in Income <strong>and</strong> Wealth (CRIW)addressing capital <strong>and</strong> labor measurement over the last 20 years include D. Usher, The Measurement <strong>of</strong> Capital (NBERCRIW Volume 45 (Chicago University Press, 1980)); J. Triplett, The Measurement <strong>of</strong> Labor Cost (NBER CRIW Volume48 (Chicago University Press, 1983)); <strong>and</strong> C. Corrado, J. Haltiwanger, <strong>and</strong> D. Sichel, Measuring Capital in the New76
DIGITAL ECONOMY 2003ments in what statistical agencies collect, but a dynamic <strong>and</strong> evolving economy continuallypresents new challenges.Even when concepts are well defined, it is costly for statistical agencies to collect data <strong>and</strong> forrespondents to provide the requested information. As a result, some key information needed foranalysis may not be collected <strong>of</strong>ten or at all. Examples include information such as the number<strong>of</strong> computers <strong>and</strong> computer networks that businesses have, how they use them, <strong>and</strong> how muchbusinesses invest in computers <strong>and</strong> other IT. The divergent findings in the resulting empiricalliterature on the effects <strong>of</strong> IT are likely related to these data gaps, <strong>and</strong> to differences in thetechniques researchers use to try to deal with them. 33One way to improve the micro data available for research would be by better integratingaggregate economic indicators <strong>and</strong> their underlying micro data. It currently is not always easyto reconcile movements in the aggregate statistics with changes observed in the micro data.Aggregate indicators <strong>of</strong>ten are constructed from multiple micro data sources, <strong>and</strong> differentsources <strong>of</strong> data for any concept (such as employment or payroll) may disagree. Collecting more<strong>of</strong> the data underlying aggregate statistics in ways that enrich their value as micro data, such asusing common sampling frames <strong>and</strong> keeping information that allows linkage <strong>of</strong> same economicunit over time <strong>and</strong> across surveys, would improve both the micro data <strong>and</strong> our ability tounderst<strong>and</strong> changes in the aggregate economic indicators.ConclusionMicro data research conducted in the United States <strong>and</strong> in OECD countries shows that IT isrelated to economic performance <strong>and</strong> productivity. Careful research also shows that therelationships are complex. IT emerges as a multifaceted factor. The kind <strong>of</strong> IT that is used <strong>and</strong>how it is used appear to matter in many (but not all) settings, including the ownership structure<strong>of</strong> trucking markets, the relative dynamism <strong>of</strong> retailing, <strong>and</strong> the relative risk taking <strong>and</strong>innovativeness <strong>of</strong> manufacturing sectors across countries. At the same time, the use <strong>of</strong> IT alonedoes not appear to be enough to affect economic performance. When researchers haveinformation about the characteristics <strong>of</strong> businesses, workers, jobs, <strong>and</strong> markets, they find that ITappears to work instead in t<strong>and</strong>em with those factors.Economy (NBER CRIW Volume 65 (Chicago University Press, forthcoming)). A series <strong>of</strong> meetings <strong>of</strong> internationalexperts, known as the “Canberra Group,” addressed capital measurement issues during the late 1990s (http://unstats.un.org/unsd/methods/citygroup/capitalstock.htm). An excellent manual describing how to calculate productivitydevoted considerable text to issues in measuring capital can be found in P. Schreyer, Measuring Productivity: Measurement<strong>of</strong> Aggregate <strong>and</strong> Industry-Level Productivity Growth—OECD Manual (Paris: OECD 2001). Measuring intangiblecapital, potentially important in both IT <strong>and</strong> non-IT capital, received much attention recently (see for example B. Lev,Intangibles: Management, Measurement, <strong>and</strong> <strong>Report</strong>ing (Brookings Institution Press: 2001)).33See, for example, Dedrick et al. (2003); D. Pilat, 2003; B.K. Atrostic, J. Gates, <strong>and</strong> R. Jarmin, 2000, “Measuring theElectronic Economy: Current Status <strong>and</strong> Next Steps,” Working Paper CES-WP-00-10, Center for Economic Studies, U.S.Bureau <strong>of</strong> the Census, Washington DC; <strong>and</strong> J. Haltiwanger, <strong>and</strong> R. Jarmin (2000), “Measuring the Digital Economy,” inE. Byrnjolfsson <strong>and</strong> B. Kahin (eds.), Underst<strong>and</strong>ing the Digital Economy (MIT Press 2000).77
DIGITAL ECONOMY 2003Separating out the effect <strong>of</strong> IT remains difficult because the analysis requires detailedinformation, <strong>and</strong> requires it for multiple periods. However, such detailed <strong>and</strong> repeatedinformation is rare. Most business micro data contain only the information needed to calculateimportant economic indicators. The micro data are most sparse for the sectors outsidemanufacturing—the most IT-intensive sectors. More definitive research on the impact <strong>of</strong> ITrequires that producing micro data sets becomes a statistical agency priority.78
DIGITAL ECONOMY 2003Appendix 5.A. Conducting Micro Data Researchon the Impact <strong>of</strong> ITTHE CENTER FOR ECONOMIC STUDIES, U.S. CENSUS BUREAUThe Center for Economic Studies (CES) is a research unit <strong>of</strong> the Office <strong>of</strong> the Chief Economist,U.S. Bureau <strong>of</strong> the Census, established to encourage <strong>and</strong> support the analytic needs <strong>of</strong>researchers <strong>and</strong> decision makers throughout government, academia, <strong>and</strong> business. CEScurrently operates eight Research Data Centers (RDCs) throughout the United States. RDCs<strong>of</strong>fer qualified researchers restricted access to confidential economic data collected by theCensus Bureau in its surveys <strong>and</strong> censuses. CES <strong>and</strong> the RDCs conduct, facilitate, <strong>and</strong> supportresearch using micro data to increase the utility <strong>and</strong> quality <strong>of</strong> Census Bureau data products.The best way for the Census Bureau to assess the quality <strong>of</strong> the data it collects, edits, <strong>and</strong>tabulates is for knowledgeable researchers to use micro records in rigorous analyses. Eachmicro record results from dozens <strong>of</strong> decisions about definitions, classifications, codingprocedures, processing rules, editing rules, disclosure rules, <strong>and</strong> so on. Analyses test the validity<strong>of</strong> all these decisions <strong>and</strong> uncover the data’s strengths <strong>and</strong> weaknesses.Research projects at CES <strong>and</strong> its RDCs are examining how facets <strong>of</strong> the electronic economyaffect productivity, growth, business organization, <strong>and</strong> other aspects <strong>of</strong> business performanceusing both new data collected specifically to provide new information about IT, <strong>and</strong> existingdata. Projects using existing Census Bureau micro data on businesses include McGuckin et al.1998; Dunne, Foster, Haltiwanger <strong>and</strong> Troske, 2000; Stolarick 1999; <strong>and</strong> Doms, Jarmin, <strong>and</strong>Klimek, 2002). Research making use <strong>of</strong> the new 1999 supplement to the Annual Survey <strong>of</strong>Manufactures linked to existing Census Bureau micro data include Atrostic <strong>and</strong> Gates 2001;Atrostic <strong>and</strong> Nguyen 2002; Haltiwanger, Jarmin, <strong>and</strong> Schank 2002; <strong>and</strong> Bartelsman et al. 2002.Research findings from many <strong>of</strong> these projects are discussed in this chapter. The research alsohelps the Census Bureau assess what current data collections can say about the electroniceconomy so that we can more efficiently allocate resources to any new measurement activities.More information about CES, RDCs, requirements for access to data, <strong>and</strong> examples <strong>of</strong> researchproduced at the RDCs is at http://www.ces.census.gov/ces.php/home.DATA SOURCES AT CESResearchers at CES <strong>and</strong> the RDCs built, <strong>and</strong> use, a longitudinal data set linking manufacturingplants over time. The data are based on surveys <strong>and</strong> economic censuses, <strong>and</strong> contain detaileddata on shipments <strong>and</strong> factors used to produce them, such as materials <strong>and</strong> labor, as well ascharacteristics <strong>of</strong> the plant, such as whether it exports.Recent CES research broadens the range <strong>of</strong> available micro data beyond manufacturing. A newmicro data set, the Longitudinal Business Database, currently contains the universe <strong>of</strong> all U.S.business establishments with paid employees from 1976 to present. It allows researchers toexamine entry <strong>and</strong> exit, gross job flows, <strong>and</strong> changes in the structure <strong>of</strong> the U.S. economy. TheLBD can be used alone or in conjunction with other Census Bureau surveys at the establishment79
DIGITAL ECONOMY 2003<strong>and</strong> firm level. In addition, micro data from surveys <strong>and</strong> censuses <strong>of</strong> the retail, wholesale, <strong>and</strong>some service sectors is now becoming available.The National Employer Survey, conducted by the Census Bureau for the National Center on theEducational Quality <strong>of</strong> the Workforce, collects detailed information about work practices,worker training, <strong>and</strong> the use <strong>of</strong> computers. Restricted access to confidential data from the surveyis available to qualified researchers through the RDCs. Information about the NationalEmployer Survey can be found at http://www.census.gov/econ/overview/mu2400.html.PUBLIC-USE DATAThis chapter also refers to research conducted using two other sets <strong>of</strong> micro data collected bythe Census Bureau. The Current Population Survey (CPS) is a survey <strong>of</strong> households that iscollected by the Census Bureau for the Bureau <strong>of</strong> Labor <strong>Statistics</strong>. The CPS periodicallycollects information about people’s use <strong>of</strong> computers at work <strong>and</strong> at home. More informationcan be found at http://www.census.gov/population/www/socdemo/computer.html. The TruckInventory <strong>and</strong> Use Surveys collect information about on-board trip computers <strong>and</strong> electronicvehicle management systems as part <strong>of</strong> the Census <strong>of</strong> Transportation. Information about theCensus <strong>of</strong> Transportation can be found at http://www.census.gov/econ/www/tasmenu.html.80
CHAPTER VI:INFORMATION TECHNOLOGY’S ROLE INLIFE SCIENCES RESEARCH & DEVELOPMENTBy Cass<strong>and</strong>ra Ingram <strong>and</strong> Gurmukh Gill *Information technology (IT) has dramatically reduced the costs, increased the speed, <strong>and</strong>improved the productivity <strong>of</strong> life sciences research <strong>and</strong> development (R&D). Life sciencesR&D, in turn, has opened up new challenges <strong>and</strong> opportunities for IT applications. Thisvirtuous cycle has contributed to a whole new frontier for knowledge generation. For example,the confluence <strong>of</strong> IT <strong>and</strong> biological advances made possible the mapping <strong>of</strong> the entire humangenome <strong>and</strong> genomes <strong>of</strong> many other organisms in just over a decade. These discoveries, alongwith current efforts to determine gene <strong>and</strong> protein functions, have improved our ability tounderst<strong>and</strong> the root causes <strong>of</strong> human, animal <strong>and</strong> plant diseases <strong>and</strong> find new cures.Furthermore, many future IT innovations will likely be spurred by the data <strong>and</strong> analysisdem<strong>and</strong>s <strong>of</strong> the life sciences.This chapter describes the relationship between IT <strong>and</strong> life sciences R&D. We provideinformation on the life sciences market for IT goods <strong>and</strong> services. While currently the lifesciences market comprises only a small part <strong>of</strong> the total IT market, it is a vibrant market <strong>and</strong>growing rapidly. Job opportunities that combine the skills <strong>of</strong> life <strong>and</strong> computer scientists arealso expected to exp<strong>and</strong>.Bioinformatics Is Vital for Advances in the Life SciencesIn recent years, innovations where IT <strong>and</strong> the life sciences converge have created vast quantities<strong>of</strong> data. The development <strong>of</strong> automated DNA sequencing <strong>and</strong> other innovative methods havereduced the costs <strong>and</strong> time needed to discover the genetic makeup <strong>of</strong> various organisms.* Ms. Ingram (cass<strong>and</strong>ra.ingram@esa.doc.gov) is an economist <strong>and</strong> Mr. Gill (gurmukh.gill@esa.doc.gov) is seniorexecutive for economic research in the Office <strong>of</strong> Policy Development, Office <strong>of</strong> the Chief Economist, <strong>Economics</strong> <strong>and</strong><strong>Statistics</strong> <strong>Administration</strong>.81
DIGITAL ECONOMY 2003Additionally, innovations such as high-throughput screening <strong>and</strong> microarrays are enablingstudies <strong>of</strong> gene <strong>and</strong> protein functions (i.e., genomics <strong>and</strong> proteomics).The exp<strong>and</strong>ing complexity <strong>and</strong> diversity <strong>of</strong> information also pose new challenges. For example,data produced from studies <strong>of</strong> protein <strong>and</strong> gene function <strong>and</strong> interaction can require theconsolidation <strong>of</strong> information in various formats <strong>and</strong> from diverse sources. Additionally, datamay not be in a st<strong>and</strong>ard or readily usable format, particularly if they are not availableelectronically or are text-based information from scientific literature, patents <strong>and</strong> clinical trials.Critical biological information also is found throughout various scientific disciplines, such asthe chemical sciences. 1 The ability <strong>of</strong> researchers to manage <strong>and</strong> analyze these diverse <strong>and</strong>extensive data is critical to the future success <strong>of</strong> life sciences R&D.THE NEED FOR DATA MANAGEMENT AND ANALYTIC IT TOOLSThe needs described above have spawned the research field “bioinformatics,” 2 which focuses onthe use <strong>of</strong> IT to collect, organize, store, interpret, share, <strong>and</strong> analyze biological data.Developments in bioinformatics will be critical for facilitating R&D in areas such as human <strong>and</strong>animal health, agriculture, industrial processing, natural resource recovery, <strong>and</strong> environmentalremediation. Figure 6.1 illustrates the IT <strong>and</strong> life sciences components <strong>of</strong> bioinformatics.Figure 6.1. Bioinformatics Uses Information Technology to Manage<strong>and</strong> Analyze Information Generated by the Life SciencesLife Science DataBiological Data:-Genes-Proteins-Gene <strong>and</strong> protein function<strong>and</strong> interactionClinical <strong>and</strong> FieldTrials DataScientific Literature:-Journal articlesOther Disciplines:-Chemical dataBioinformaticsEnabling Research <strong>and</strong> ProductDevelopment in the Life Sciences, e.g.PharmaceuticalsNew Plant VarietiesBioremediationIndustrial ProcessingAlternative EnergyInformation TechnologyAutomated Techniques:-DNA sequencing-DNA microarrays-High throughput screeningComputers:-Storage capacity-Computing capabilityNavigational S<strong>of</strong>tware:-Database searching-Data retrievalAnalysis S<strong>of</strong>tware:-Data mining-Visualization-Molecular modelingNetwork:-Sharing data <strong>and</strong> s<strong>of</strong>tware-Grid computing1For example, patient response to chemically-formulated pharmaceuticals.2Computational biology research is the more traditional discipline that relates to bioinformatics, <strong>and</strong> consists <strong>of</strong> dataanalysis <strong>and</strong> interpretation <strong>and</strong> the development <strong>of</strong> new algorithms <strong>and</strong> statistics in the biological sciences.82
DIGITAL ECONOMY 2003Computing Power <strong>and</strong> NetworksData storage, management, <strong>and</strong> analysis requirements in the life sciences are outpacing currentcomputing capabilities, even though computing power continues to increase. Computing powerhas exp<strong>and</strong>ed at roughly the same rate as public DNA sequences located at the NationalInstitutes <strong>of</strong> Health (NIH)—both have been doubling every 18 to 24 months for several years(Figure 6.2). 3 In 1971, only 2,250 transistors were on an integrated circuit; by 2002 there were42 million. Similarly, only 606 DNA sequences were housed at NIH’s Genbank in 1982. Thenumber <strong>of</strong> sequences climbed to 22.3 million in just 20 years.45,000Figure 6.2.Number <strong>of</strong> Transistors per Integrated Circuit vs.DNA Sequences in Genbank25,00040,000Thous<strong>and</strong>s <strong>of</strong> Transistors35,00030,00025,00020,00015,00010,000TransistorsDNA Sequences20,00015,00010,0005,000Thous<strong>and</strong>s <strong>of</strong> DNA Sequences5,000019711973197519771979198119831985198719891991199319950199719992001Source: Data on computing power, or the number <strong>of</strong> transistors per integrated circuit, is from Intel athttp://www.intel.com/research/silicon/mooreslaw.htm. Data for the number <strong>of</strong> public DNA sequences <strong>of</strong> severalorganisms in Genbank is from the National Center for Biotechnology Information, National Institutes <strong>of</strong> Health athttp://www.ncbi.nlm.nih.gov/Genbank/genbankstats.html.Researchers are exploring strategies to increase computing capabilities for diverse life sciencespurposes, such as computer-based drug design. One strategy is to exp<strong>and</strong> the potential <strong>of</strong>supercomputers. Another is to unify computing resources through development <strong>of</strong> global, orgrid, computing networks. These networks link the power <strong>of</strong> individual PCs or supercomputers. 4Researchers have achieved teraflop speeds (a trillion floating point operations per second) using3Mark S. Boguski, “Bioinformatics—A New Era,” Trends Guide to Bioinformatics (Elsevier Science, 1998).4See http://www.cs.mu.oz.au/~raj/papers/TheGrid.pdf (accessed Sept., 2003).83
DIGITAL ECONOMY 2003these grid networks. In the future they hope to achieve petaflop speeds (a thous<strong>and</strong> trillionfloating point operations per second). 5The Internet is a particularly valuable tool for life sciences researchers, especially for those withlimited resources. It enables researchers to tap into data, s<strong>of</strong>tware, <strong>and</strong> computing power.New s<strong>of</strong>tware developments also promise life sciences researchers’ the ability to acquire,format, search, <strong>and</strong> analyze disparate data sources <strong>and</strong> types. Data mining <strong>and</strong> visualizations<strong>of</strong>tware 6 are improving scientists’ ability to screen data <strong>and</strong> identify important relationships.One s<strong>of</strong>tware analysis tool, 3-D molecular modeling, facilitates studies <strong>of</strong> the function <strong>and</strong>relationships between biological molecules. These analysis tools are enabling scientists toconduct some research at the computer instead <strong>of</strong> at the lab bench, reducing the time <strong>and</strong> costs<strong>of</strong> life sciences R&D.St<strong>and</strong>ardization enables researchers to link different databases <strong>and</strong> s<strong>of</strong>tware programs, therebymaking the discovery process more efficient. St<strong>and</strong>ardizing scientific nomenclature, databases<strong>and</strong> s<strong>of</strong>tware helps researchers exchange <strong>and</strong> analyze information more easily. 7 Researchersalso benefit from the development <strong>of</strong> technical <strong>and</strong> computational st<strong>and</strong>ards for hardware <strong>and</strong>s<strong>of</strong>tware.Given the diversity <strong>of</strong> <strong>and</strong> rapid developments in life sciences databases <strong>and</strong> s<strong>of</strong>tware,st<strong>and</strong>ardization is too difficult <strong>and</strong> costly for any organization to undertake alone. To overcomethis obstacle, the Interoperable Informatics Infrastructure Consortium (I3C) 8 was founded in2001 to collectively address some st<strong>and</strong>ardization problems. I3C is an international consortiumthat includes life science <strong>and</strong> IT participants from private industry, government institutions,academia <strong>and</strong> other research organizations. They develop <strong>and</strong> promote “global, vendor-neutralinformatics solutions that improve data quality <strong>and</strong> accelerate the development <strong>of</strong> life scienceproducts.” I3C’s accomplishments include st<strong>and</strong>ards developed to identify <strong>and</strong> access biologicallysignificant data <strong>and</strong> a method that simplifies data retrieval from multiple databases.BIOINFORMATICS ASSISTS DRUG DISCOVERY AND DEVELOPMENTBioinformatics is improving the R&D process in drug discovery <strong>and</strong> development. IT tools havebecome important for managing <strong>and</strong> screening genetics data <strong>and</strong> for modeling outcomes in drugdevelopment. New developments in bioinformatics <strong>and</strong> genetics, such as pharmacogenetics(i.e., the study <strong>of</strong> the relationships between diseases, genes, proteins, <strong>and</strong> pharmaceuticals), will5See whatis?com at http://whatis.techtarget.com/definition/0,,sid9_gci212778,00.html (accessed Sept., 2003).6Instrument Business Outlook. Vol. 11, i12 (Sept 30, 2002) 3(1).7Bioinformatics Workshop. A report produced for the Research <strong>and</strong> Resources Infrastructure Working Group, Subcommitteeon Biotechnology, National Science <strong>and</strong> Technology Council, White House Office <strong>of</strong> Science <strong>and</strong> Technology Policy,<strong>and</strong> prepared by Tracor Systems Technologies, Inc. under contract with Krasnow Institute <strong>of</strong> Advanced Studies <strong>and</strong>George Mason University. (February, 1998).8Information on I3C can be found on their website at http://www.i3c.org/ <strong>and</strong> http://www.i3c.org/demos/bio2002/i3cdatasheet.pdf (accessed Aug., 2003).84
DIGITAL ECONOMY 2003enable researchers to identify quickly a patient’s genetic predisposition to contract certaindiseases as well as their potential drug response.Costs <strong>of</strong> drug discovery have been escalating, nearly tripling since 1991. 9 It now costs $900million <strong>and</strong> takes 15 years on average to develop a new drug. 10 Clinical trials constitute most <strong>of</strong>these costs. Additionally, about 75 percent <strong>of</strong> drug development costs can be attributed t<strong>of</strong>ailures. Analysts anticipate that advances in IT <strong>and</strong> the biological sciences—such as thecomputer-enabled ability to quickly screen drug c<strong>and</strong>idates <strong>and</strong> predict drug responses—couldlower failure rates substantially, reducing costs by as much as one-third <strong>and</strong> time by as much astwo years.BIOINFORMATICS IS A KEY LIFE SCIENCES R&D ACTIVITYIT tools <strong>and</strong> bioinformatics R&D are key to remaining competitive for biotechnology <strong>and</strong>pharmaceutical companies. These companies are exp<strong>and</strong>ing IT capabilities by developing inhouseR&D programs in bioinformatics, acquiring bioinformatics companies, <strong>and</strong> partneringwith IT companies, bioinformatics firms, <strong>and</strong> the public sector (e.g., the federal government <strong>and</strong>universities).Survey <strong>of</strong> Firms Engaged in Biotechnology ActivitiesResults from a survey on the use <strong>of</strong> biotechnology in U.S. industry 11 demonstrate theimportance <strong>of</strong> bioinformatics to life sciences firms. Table 6.1 displays some <strong>of</strong> the biotechnologyactivities <strong>of</strong> survey participants. About 30 percent <strong>of</strong> survey respondents indicated thatbioinformatics was one <strong>of</strong> their biotechnology R&D activities. While 29 percent conductedbioinformatics research, only 3 percent reported having bioinformatics products or processesthat were marketed or in production. Firms were also substantially engaged in activities highlydependent on bioinformatics such as genomics, DNA sequencing <strong>and</strong> synthesis, drug design<strong>and</strong> delivery, synthesis <strong>and</strong> sequencing <strong>of</strong> proteins <strong>and</strong> peptides, <strong>and</strong> combinatorial chemistry<strong>and</strong> 3-D molecular modeling.Table 6.2 presents information on bioinformatics activities by application. Firms focusing onhuman health applications constituted the greatest number <strong>of</strong> survey respondents. Therefore, itis not surprising that 81 percent <strong>of</strong> the respondents (i.e., 247 out <strong>of</strong> 304) that conductbioinformatics research were addressing human health problems. Within any application,between 19 to 45 percent <strong>of</strong> firms indicated that they conducted bioinformatics research.9The Boston Consulting Group, A Revolution in R&D: How Genomics <strong>and</strong> Genetics Are Transforming the BioPharmaceuticalIndustry, (2001) at http://www.bcg.com <strong>and</strong> http://www.bcg.com/publications/files/eng_genomicsgenetics_rep_11_01.pdf (accessed Oct., 2003).10Tufts Center for the Study <strong>of</strong> Drug Development at http://csdd.tufts.edu/ <strong>and</strong> http://csdd.tufts.edu/NewsEvents/RecentNews.asp?newsid=29 (accessed Oct., 2003).11Survey data from Critical Technology Assessment <strong>of</strong> Biotechnology in U.S. Industry, U.S. <strong>Department</strong> <strong>of</strong> Commerce,Technology <strong>Administration</strong> <strong>and</strong> Bureau <strong>of</strong> Industry <strong>and</strong> Security (August 2002).85
DIGITAL ECONOMY 2003Table 6.1. Percent <strong>of</strong> Survey Respondents by Biotechnology Activity, 2002Conduct Approved, marketed, orresearch on/in in production TotalProduct(s)Process(es)DNA-basedBioinformatics 29 2 1 30Genomics, pharmacogenetics 29 3 2 30DNA sequencing/synthesis/ amplification,genetic engineering 39 5 3 43Biochemistry/ImmunologyDrug design & delivery 33 4 2 38Synthesis/sequencing <strong>of</strong> proteins <strong>and</strong> peptides 27 3 1 30Combinatorial chemistry, 3-D molecular modeling 18 1 0 19Note: The total number <strong>of</strong> responses to the biotechnology activity question was 1021. Percents do not add up to 100 percentbecause firms can have more than one activity.Source: Survey data from Critical Technology Assessment <strong>of</strong> Biotechnology in U.S. Industry, U.S. <strong>Department</strong> <strong>of</strong> Commerce,Technology <strong>Administration</strong> <strong>and</strong> Bureau <strong>of</strong> Industry <strong>and</strong> Security, August 2002.Table 6.2. Number <strong>of</strong> Survey Respondents IndicatingBioinformatics Research Activities by Application, 2002Number <strong>of</strong> firmsConductApplication in application bioinformatics researchHuman Health 780 247Animal Health 144 37Agricultural & Aquacultural/Marine 128 41Marine & Terrestrial Microbial 41 19Industrial <strong>and</strong> Agricultural-Derived Processing 132 45Environmental Remediation <strong>and</strong> Natural ResourceRecovery 41 12Other 160 30Note: The total number <strong>of</strong> firms that responded to the biotechnology survey was 1,031, <strong>and</strong> 304 <strong>of</strong> these firms indicated thatthey had some activity in bioinformatics. The number <strong>of</strong> firms by biotechnology application does not add up to the totalnumber <strong>of</strong> firms that responded to the survey because firms were classified in an application if they indicated it as either a“primary” or “secondary” focus.Source: Survey data from Critical Technology Assessment <strong>of</strong> Biotechnology in U.S. Industry, U.S. <strong>Department</strong> <strong>of</strong> Commerce,Technology <strong>Administration</strong> <strong>and</strong> Bureau <strong>of</strong> Industry <strong>and</strong> Security, August 2002.PUBLIC INSTITUTIONS SUPPORT BIOINFORMATICS R&DPublic institutions have made significant investments in research areas where the life sciences<strong>and</strong> IT converge. They supported <strong>and</strong> organized endeavors to map the genomes <strong>of</strong> severalorganisms, created databases, developed data retrieval <strong>and</strong> analysis s<strong>of</strong>tware, conducted IT <strong>and</strong>other bioinformatics-related R&D, <strong>and</strong> funded bioinformatics training programs. These activitieshelp drive the dem<strong>and</strong> for IT goods <strong>and</strong> services in the life sciences.86
DIGITAL ECONOMY 2003The National Institutes <strong>of</strong> Health (NIH) represents a majority <strong>of</strong> Federal spending for lifesciences R&D, which is focused on human health. A five-year campaign to double NIH R&Dfunding to $27.3 billion was completed in 2003.Several NIH programs <strong>and</strong> initiatives that are closely linked with bioinformatics R&D, such asthe Human Genome Project, 12 will get funding boosts in 2004. 13 Also in 2004, NIH plans todevote $35 million for developing new life science approaches <strong>and</strong> technologies, such asbioinformatics. The National Institute <strong>of</strong> Allergy <strong>and</strong> Infectious Diseases, which is the leadinstitute in bioterrorism research, will receive increased funding. Bioinformatics is a keyelement in developing drug <strong>and</strong> vaccine c<strong>and</strong>idates as countermeasures to potential bioterrorismpathogens. NIH also makes sizable investments in IT R&D. In 2003, NIH allocated $336million for information technology R&D, representing about 1.3 percent <strong>of</strong> their $23.6 billionR&D budget.Other federal agencies, such as the National Science Foundation (NSF) <strong>and</strong> the <strong>Department</strong> <strong>of</strong>Energy (DOE), also support life sciences <strong>and</strong> IT R&D, especially in disciplines other thanhuman health (e.g., environmental biology, the plant sciences <strong>and</strong> alternative energy sources). 14A little over 10 percent <strong>of</strong> NSF’s $5 billion budget <strong>and</strong> 2 percent <strong>of</strong> DOE’s $22 billion budgetare devoted to biological R&D. NSF’s biological sciences R&D budget in 2004 shows a 20percent increase (to $82 million) in emerging frontiers research, which includes bioinformatics.Of this, information technology research for the biological sciences would rise 10.3 percent to$7.5 million. DOE is a major supporter <strong>of</strong> advanced scientific computing research. R&Dspending for this program is expected to increase 4.2 percent, to $173.5 million.IT Market <strong>and</strong> Job Opportunities in the Life SciencesThe life sciences are opening up a new frontier for pr<strong>of</strong>itable IT innovations <strong>and</strong> applications.Although the life sciences represent only a small fraction <strong>of</strong> the entire IT market, that portionis growing at a substantial rate. A number <strong>of</strong> market research reports describe the life sciencemarket for IT in the United States <strong>and</strong> globally as dynamic with vast growth potential. 15 Global12The Human Genome Project funding will increase 2.8 percent, from $465 million in 2003 to $478 million in 2004.13See “Summary <strong>of</strong> the FY2004 President’ Budget” for NIH at http://www.nih.gov/news/budgetfy2004/fy2004presidentsbudget.pdf (accessed Sept., 2003) <strong>and</strong> NIH budget highlights from the American Association for theAdvancement <strong>of</strong> Science at http://www.aaas.org/spp/rd/nih04p.pdf.14See NSF’s FY 2004 budget request at http://www.nsf.gov/bfa/bud/fy2004/toc.htm <strong>and</strong> budget request for the biologicalsciences http://www.nsf.gov/bio/bio_bdg04/bionarr04.htm (accessed Sept., 2003). See DOE’s FY 2004 budget request athttp://www.mbe.doe.gov/budget/04budget/content/highlite/highlite.pdf (accessed Oct., 2003). DOE also has contributed toHuman Genome research <strong>and</strong> has a new Genomes to Life program, which is focused on the “function <strong>and</strong> control <strong>of</strong>molecular machines for energy <strong>and</strong> environmental applications.”15The four primary market research firms that estimate the bioinformatics market are the International Data Corporation(http://www.idc.com/getdoc.jhtml?containerId=TEA001604), Frost & Sullivan (http://www.frost.com/prod/servlet/frosthome.pag),Strategic Directions International (http://www.strategic-directions.com/), <strong>and</strong> Front Line Strategic Consulting(http://www.frontlinesmc.com/).87
DIGITAL ECONOMY 2003bioinformatics market estimates vary widely, ranging from $0.8 billion to $14.6 billion in2002. 16The life sciences market for IT is small relative to the whole IT market. The most optimisticestimate <strong>of</strong> the U.S. life science market for IT was $7.4 billion 17 in 2002. This was less than 0.9percent <strong>of</strong> the value added <strong>of</strong> the IT-producing industries (which was $829 billion in 2002). 18However, the life sciences market segment appears to have strong growth potential. During theeconomic downturn <strong>of</strong> 2001, growth in value added <strong>of</strong> IT producing industries declined by 5.6percent (see chapter 1). Market research firms reported that during this same period growthrates in the IT life science market were high overall. They also expect growth rates to continueto rise, ranging from 19 to 25 percent annually 19 until at least 2006.JOB OPPORTUNITIES IN BIOINFORMATICSIncreasingly companies <strong>and</strong> research organizations are seeking workers with more formalizedtraining that have the skills <strong>of</strong> both computer <strong>and</strong> life scientists. The high starting salaries <strong>of</strong>bioinformaticians, $65,000 to $90,000 per year, reflect the strong dem<strong>and</strong> for bioinformaticsemployees. 20Computer specialists 21 in the life sciences are among the high-technology employmentcategories currently experiencing job growth. Occupational projections by the Bureau <strong>of</strong> Labor<strong>Statistics</strong> 22 (BLS) suggest that employment <strong>of</strong> computer specialists in the Drug <strong>and</strong> Research &16The large discrepancy in market <strong>and</strong> growth estimates mostly depends on market segment covered <strong>and</strong> organizationsincluded, the years spanned, <strong>and</strong> assumptions made related to future market projections.17The International Data Corporation estimated that the IT life science market was about $14.6 billion worldwide <strong>and</strong> thatthe U.S. market represented 51 percent <strong>of</strong> this total.18The estimate <strong>of</strong> 0.9 percent is based on total revenue <strong>and</strong> is not value added; i.e., where purchased inputs <strong>and</strong> laborcosts from outside the firm are excluded. See chapter 1 on information technology producing industries.19Growth rates presented in the market research reports were compound annual growth rates.20Stephan, Paula E. <strong>and</strong> Grant Black, “Bioinformatics: Emerging Opportunities <strong>and</strong> Emerging Gaps,” Capitalizing on NewNeeds <strong>and</strong> New Opportunities in Biotechnology <strong>and</strong> Information Technologies: Government-Industry Partnerships inBiotechnology <strong>and</strong> Information Technologies, ed. Charles W. Wessner., Board on Science, Technology <strong>and</strong> EconomicPolicy, National Research Council (Washington, DC: National Academy Press, 2001).21The occupations included in the BLS aggregate “Computer Specialists” are computer programmers, computer <strong>and</strong>information scientists (research), computer systems analysts, computer s<strong>of</strong>tware engineers (applications), computers<strong>of</strong>tware engineers (systems s<strong>of</strong>tware), computer support specialists, database administrators, network <strong>and</strong> computersystems administrators, network systems <strong>and</strong> data communications analysts, <strong>and</strong> all other computer specialists.22See the following BLS websites for data <strong>and</strong> analysis http://www.bls.gov/oco/cg/cgs009.htm, http://ftp://ftp.bls.gov/pub/special.requests/ep/ind-occ.matrix/ind_pdf/i808730.pdf, <strong>and</strong> http://ftp://ftp.bls.gov/pub/special.requests/ep/ind-occ.matrix/ind_pdf/i422830.pdf (accessed Sept., 2003).88
DIGITAL ECONOMY 2003Testing Services industries 23 will continue to grow rapidly for several years. BLS estimates thatDrug industries will increase computer specialist jobs by 60 percent, from 5,545 in 2000 to8,859 in 2010. BLS expects computer specialist jobs in Research & Testing Services industriesto increase 68 percent, from 42,567 in 2000 to 71,549 in 2010.A survey <strong>of</strong> biotechnology use in U.S. industries further demonstrates the dem<strong>and</strong> for computerspecialists in the life sciences. 24 While computer specialists only accounted for 6.2 percent <strong>of</strong>the respondents’ biotechnology R&D workforce, growth in this occupational category was thefastest among the biotechnology R&D job categories. Between 2000 <strong>and</strong> 2002, respondingcompanies added 1,236 computer specialist jobs, a 20 percent increase.ConclusionResearchers have become increasingly reliant on IT tools to reduce the costs <strong>and</strong> boost theproductivity <strong>of</strong> life sciences R&D. At the moment, the life sciences market for IT goods <strong>and</strong>services is small. However, the life sciences market for IT remained strong even during the 2001recession <strong>and</strong> is expected to grow rapidly. Bioinformatics employment opportunities also havebeen exp<strong>and</strong>ing.23While the Drug <strong>and</strong> Research & Testing industries are not entirely composed <strong>of</strong> life sciences industries, a study entitledCritical Technology Assessment <strong>of</strong> Biotechnology in U.S. Industry, U.S. <strong>Department</strong> <strong>of</strong> Commerce, Technology <strong>Administration</strong><strong>and</strong> Bureau <strong>of</strong> Industry <strong>and</strong> Security (October 2003), (http://www.technology.gov/reports/Biotechnology/CD120a_0310.pdf) found that firms engaged in biotechnology activities mostly were classified under one <strong>of</strong> two industries,either Drugs or Research & Testing Services, using the St<strong>and</strong>ard Industrialized Codes. These two industries wereused in this analysis as the most representative <strong>of</strong> the life sciences industries.24U.S. <strong>Department</strong> <strong>of</strong> Commerce, Technology <strong>Administration</strong> <strong>and</strong> Bureau <strong>of</strong> Industry <strong>and</strong> Security, Critical TechnologyAssessment <strong>of</strong> Biotechnology in U.S. Industry (October 2003), (http://www.technology.gov/reports/Biotechnology/CD120a_0310.pdf).89
CHAPTER VII:DIGITAL TRANSFORMATION:INFORMATION, INTERACTION, AND IDENTITYBy Patricia Buckley *Just as the Industrial Revolution led to changes in existing laws, regulations, managementpractices, <strong>and</strong> patterns <strong>of</strong> social interactions, so too is the Information Age reshaping today’seconomic <strong>and</strong> social environment. Narrowly viewed, the Industrial Revolution resulted frommanufacturers applying newly available power systems to their production processes that, inturn, enabled the emergence <strong>of</strong> mass production. This innovation increased productivity <strong>and</strong> ledto the production <strong>of</strong> completely new products at relatively low costs. However, the IndustrialRevolution also drove change in the economic, social, <strong>and</strong> legal l<strong>and</strong>scapes: towns grew,workers began to organize <strong>and</strong>, in time, concerns about issues such as plant safety <strong>and</strong> airquality arose. Similarly, the information technology (IT) that underlies the digital revolution iscreating new economic, social, <strong>and</strong> legal challenges, even as it increases productivity.One <strong>of</strong> the most obvious shifts resulting from the digital revolution is the change in ourrelationship to information itself. We now expect that any information we need is easily <strong>and</strong>almost instantaneously accessible. However, that expectation is based on the assumption thatinformation has been stored so it can be easily found <strong>and</strong> retrieved. Further, it requires that new,updated information continues to be produced <strong>and</strong> made available.Digital capabilities are also reshaping interactions among individuals <strong>and</strong> organizations.Communication devices <strong>and</strong> channels continue to proliferate, exp<strong>and</strong>ing opportunities forinteraction. The power inherent in new IT applications is being harnessed to improve theperformance <strong>of</strong> organizations <strong>of</strong> all types by automating key interaction points. Effectivemanagement in this digital environment presents special challenges—from dealing with“interaction overload” (from unwanted telephone calls <strong>and</strong> email) to a loss <strong>of</strong> control (due to thecomplexity introduced by IT).* Ms. Buckley (patricia.buckley@esa.doc.gov) is a Senior Policy Advisor in the Office <strong>of</strong> Policy Development, Office <strong>of</strong>the Chief Economist, <strong>Economics</strong> <strong>and</strong> <strong>Statistics</strong> <strong>Administration</strong>.91
DIGITAL ECONOMY 2003However, it is the issue <strong>of</strong> identity that may prove to be one <strong>of</strong> the most fundamental challengeswe encounter in the shift to a digital economy. Challenges to the security <strong>of</strong> identity come inmany forms. They range from identity theft to unauthorized access to a network (hacking) or afacility. One important area <strong>of</strong> IT research <strong>and</strong> development is in the evolution <strong>of</strong> reliableidentity verification technologies. Such technologies are needed in both the physical <strong>and</strong> virtualworlds. Although such security tools are a necessity, they must be designed <strong>and</strong> implemented sothat they do not ignite privacy concerns.This chapter considers some <strong>of</strong> the changes <strong>and</strong> challenges posed by the shifts that haveoccurred in the environments surrounding information, interaction, <strong>and</strong> identity during thisperiod <strong>of</strong> digital transformation.InformationImprovements in technology continue to increase our ability to capture, store, manipulate, <strong>and</strong>display information. Declining costs <strong>and</strong> shrinking component size have accompanied thesetechnological improvements. The combination <strong>of</strong> these trends has led to a sharp increase in theinformation component <strong>of</strong> many everyday devices—from disposable telephone cards that trackmessage units to pocket-sized telephones that have contact databases <strong>and</strong> games. Businessesalso benefit as IT enables the development <strong>of</strong> manufacturing equipment that not only producesthe product, but also reports production-run quality <strong>and</strong> tracks its own maintenance schedule.Even the authors <strong>of</strong> this report have benefited from the improved functionality <strong>of</strong> ourcomputers. Using sophisticated statistical s<strong>of</strong>tware, we can now manipulate large datasets that,until recently, exceeded the storage capacity <strong>of</strong> most desktop computers.The Internet has become key in information expansion, by providing a common protocol forcommunication among devices. Although increased information content <strong>and</strong> functionality isbeneficial for any single device, when devices are joined together in a network their potentialexp<strong>and</strong>s dramatically. Using the Internet, people can locate everything from the mundane(looking up a pasta salad recipe, checking a bank account balance, verifying the movieschedule) to the important (finding information on evacuation routes following a disaster, ordeodorizing a child who mistook a skunk for her puppy). The Internet also makes availableinformation that was formerly beyond easy reach, such as: a list <strong>of</strong> ongoing clinical trials fromthe National Institutes <strong>of</strong> Health, the English language version <strong>of</strong> Al Jazeera, or historicalphotographs <strong>of</strong> the Wright brothers. In addition to providing benefits to private individuals, theInternet has also become an integral part <strong>of</strong> the l<strong>and</strong>scape in which government, business, <strong>and</strong>organizations function.As individuals <strong>and</strong> organizations continue to weave the Internet into their activities <strong>and</strong>infrastructures, resolving issues <strong>of</strong> search, archiving, <strong>and</strong> protection <strong>of</strong> intellectual propertyrights is critical to realizing the full potential <strong>of</strong> this network <strong>of</strong> networks.SEARCHInternet users depend on their Web browser’s search engine, on navigational guides or portals(e.g., Yahoo!), or on st<strong>and</strong>-alone search engines (e.g., Google, Altavista, <strong>and</strong> NorthernLight) to92
DIGITAL ECONOMY 2003locate information. Since search engines use different algorithms—algorithms that may or maynot have advertising expenditures as a variable—to locate items on the Internet, results can varysubstantially. For example, Table 7.1 shows the top three results obtained when searching forthe phrase “digital economy,” using several search engines.Table 7.1.Top Three Search Results for “Digital Economy”Micros<strong>of</strong>t Explorer Google Altavista Yahoo!Information HighwayAdvisory CouncilBarnes & Noble.com—Cyberbr<strong>and</strong>ingHardcoverInformation Technologyfor Management,Hardcover—Amazon.com<strong>Department</strong> <strong>of</strong>Commerce Home PageAmazon.com: Books:The Digital Economy:Promise <strong>and</strong> Peril InThe ...<strong>Department</strong> <strong>of</strong>Commerce Home PageWalmart.com:Underst<strong>and</strong>ing theDigital Economy byErik BrynjolfssonWired 2.03: TheEconomy <strong>of</strong> IdeasUnderst<strong>and</strong>ing theDigital EconomyUnderst<strong>and</strong>ing theDigital EconomyConferenceAmazon.com: Books:The Digital Economy:Promise <strong>and</strong> Peril InThe ...U.S. GovernmentElectronic CommercePolicySource: Internet search on October 27, 2003.Nor is any search engine capable <strong>of</strong> searching everything. Two <strong>of</strong> the most prominent limitingfactors are related to language <strong>and</strong> file format. During a recent Online Information conference(December 2002, London) it was noted that “the most obvious access problem is that ‘all theworld’s information’ will be provided in documented form in most <strong>of</strong> the world’s languages,<strong>and</strong> while Google <strong>and</strong> other search engines have interfaces in the major languages, theinformation that is retrieved will not necessarily be in the language <strong>of</strong> the interface.” 1 Speakersat the conference went on to note that while there are almost 600 file formats according to onecount (with at least half <strong>of</strong> these found on the Internet), search engines index only a smallportion <strong>of</strong> these. 2ARCHIVINGOrganizations charged with maintaining information collections, such as libraries, facesignificant opportunities <strong>and</strong> challenges in a digital environment. The opportunities arisebecause digital information is easy to replicate <strong>and</strong> transmit with no loss <strong>of</strong> quality, whichmakes sharing articles, books, movies, pictures, <strong>and</strong> audio recordings easy. The procession <strong>of</strong>improvements in information storage—from micr<strong>of</strong>iche <strong>and</strong> micr<strong>of</strong>ilm to the Internet, CDs, <strong>and</strong>DVDs—has substantially increased the opportunities for information collection, storage, <strong>and</strong>sharing. This increase has many benefits. For example, teachers can bring historical photo-1Laurel A. Clyde, “Search Engines are Improving but They Still Can’t Find Everything,” Teacher Librarian, June 2003.2Ibid.93
DIGITAL ECONOMY 2003graphs from the Library <strong>of</strong> Congress collections directly to their classrooms, <strong>and</strong> voters caneasily review statements made by c<strong>and</strong>idates for <strong>of</strong>fice.However, from an archiving st<strong>and</strong>point, content created digitally is <strong>of</strong> particular concern. Somehistoric documents that once would have circulated on paper may now only be circulatedelectronically—for example, an e-mailed note to a member <strong>of</strong> the President’s staff containingcomments on a proposed treaty.Solving the problems <strong>of</strong> digital archiving requires both a strategy <strong>and</strong> improved IT tools. TheNational Archives <strong>and</strong> Records <strong>Administration</strong> (NARA), given its mission <strong>of</strong> preserving the“essential evidence that documents the rights <strong>of</strong> American citizens, the actions <strong>of</strong> federal<strong>of</strong>ficials, <strong>and</strong> the national experience,” faces a particular challenge with regard to the growingvolume <strong>of</strong> e-mail communications. Recognizing that its “current systems for archival preservation<strong>of</strong> electronic records are limited in capability <strong>and</strong> ad hoc in nature…NARA launched theElectronic Records Archives (ERA) initiative,” with the San Diego Supercomputer Center toimprove its capabilities. 3On a broader level, the National Digital Information Infrastructure <strong>and</strong> Preservation Programcharges the Library <strong>of</strong> Congress to work with NARA, the Commerce <strong>Department</strong>, the WhiteHouse Office <strong>of</strong> Science <strong>and</strong> Technology Policy, the National Library <strong>of</strong> Medicine, the NationalAgricultural Library, the National Institute <strong>of</strong> St<strong>and</strong>ards <strong>and</strong> Technology <strong>and</strong> “other federal,research <strong>and</strong> private libraries <strong>and</strong> institutions with expertise in telecommunications technology<strong>and</strong> electronic commerce policy” with developing the “protocols <strong>and</strong> strategies for the longtermpreservation <strong>of</strong> such materials, including the technological infrastructure required at theLibrary <strong>of</strong> Congress.” 4Archiving is not only a concern for organizations, such as the National Archives, but also forother government entities, businesses, <strong>and</strong> individuals that collect, archive, <strong>and</strong> preserve digitalcommunications <strong>and</strong> documents. Every individual <strong>and</strong> organization that deals with informationmust devise a system to organize what they want to, or must, keep—whether paper, disk, ore-mail attachment. Organizing <strong>and</strong> storing information that may be needed in the future is agrowing challenge.CONTROLIt has always been difficult for creators <strong>of</strong> intellectual property to maintain control <strong>of</strong> theiroutput <strong>and</strong> information technology has a long history <strong>of</strong> increasing that difficulty. Makingcopies <strong>of</strong> written text—whether the original was carved in stone or written on paper—hasalways been possible. However, technology continues to make it increasingly easier <strong>and</strong> cheap.The advent <strong>of</strong> the photocopier allowed any individual to make copies cheaply without regard to3The National Academy <strong>of</strong> Sciences, “Building an Electronic Records Archie at the National Archives <strong>and</strong> Record<strong>Administration</strong>: Recommendations for Initial Development,” 2003 Pre-publication copy—subject to further editorialcorrection.4The Library <strong>of</strong> Congress, http://www.loc.gov/today/pr/2003/03-022.html94
DIGITAL ECONOMY 2003the wishes <strong>of</strong> the copyright owner <strong>and</strong> the spread <strong>of</strong> facsimile (fax) machines allowed for quickdissemination <strong>of</strong> written documents. Similarly, the creation <strong>of</strong> relatively low-cost audio <strong>and</strong>video recording devices presented challenges to those who owned music <strong>and</strong> film publishingrights.Maintaining control <strong>of</strong> intellectual property became significantly more difficult in the digitalenvironment. Not only can one create copies <strong>and</strong> disseminate them at virtually no cost, digitalcopies are equal in quality to the original.The audio recording industry is one interesting example <strong>of</strong> an industry trying to find itsequilibrium in the digital world. Napster challenged the recording industry’s business model byenabling Internet users to bypass its distribution systems. In doing so, Napster also made it moredifficult for the industry to control, <strong>and</strong> thereby pr<strong>of</strong>it from, its intellectual property (the rightsto music owned by record companies <strong>and</strong> recording artists).Although the recording industry succeeded in shutting down the free version <strong>of</strong> Napster in2001, other services (ones that are more truly peer-to-peer <strong>and</strong> therefore more difficult to shutdown) such as Morpheus <strong>and</strong> Kazaa have emerged. According to one estimate, Kazaa usersnumber almost a quarter billion worldwide—triple the number <strong>of</strong> users that Napster had priorto its shutdown. 5 The ability <strong>of</strong> users <strong>of</strong> these online music-sharing services to swap music overthe Internet called into question the market for shrink-wrapped compact discs, as well as thelicensing arrangements between recording artists <strong>and</strong> their publishers. Response to thiscontinued challenge has been tw<strong>of</strong>old—litigation <strong>and</strong> the development <strong>of</strong> legitimate onlinemarkets, such as iTunes.InteractionsIT is also transforming information exchange. Not only do people <strong>and</strong> devices have theopportunity to interact over a growing number <strong>of</strong> channels, the differing attributes <strong>of</strong> thesechannels are altering the activities in which people engage. From high-pr<strong>of</strong>ile shifts, such as theproliferation <strong>of</strong> e-mail <strong>and</strong> e-commerce sites, to more behind-the-scenes shifts in activities,such as supply chain management, these new options are having a pr<strong>of</strong>ound effect on theeconomic environment. The increased potential for interaction brings benefits, but also raisesthe specter <strong>of</strong> interaction overload.COMMUNICATION AND COMMERCEInnovations in IT have resulted in a proliferation <strong>of</strong> communication devices operating over avariety <strong>of</strong> channels. These devices <strong>and</strong> channels are more than simple substitutes for each other.Their underlying technologies give them unique attributes that are redefining the terms underwhich communications <strong>and</strong> commerce occur.5“Music Industry’s Aggressive Tactics Tune Out Fans on Net,” USA Today, May 6, 2003.95
DIGITAL ECONOMY 2003CommunicationsAs anyone who has recently filled out a school form can attest, the number <strong>of</strong> communicationschannels available to the members <strong>of</strong> an average household is large—home telephonenumber(s), <strong>and</strong> home e-mail address(es), work telephone number(s), work e-mail address(es),mobile telephone number(s), beeper number(s), etc.Communication devices <strong>and</strong> channels proliferate because each device or channel has a differentset <strong>of</strong> attributes. With communication using basic l<strong>and</strong>line telephony, you make a call to aspecific physical location, <strong>and</strong> someone at the location does (or does not) answer. L<strong>and</strong>linetelephony is extremely robust (system outages are rare, <strong>and</strong> dropped calls are not a problem)<strong>and</strong> relatively cheap. With more sophisticated telephone systems, people can forward calls,identify callers, <strong>and</strong> store messages. Mobile telephones bring another dimension to telephonyby associating the telephone number with an individual, not a location. Channels based onInternet technologies enable the ability to send anything that can be stored in a digital form tomultiple select recipients or to post it for the world-at-large. Text messaging, whether over atelephone or a personal digital assistant, is another new communications type. 6The variety <strong>of</strong> interactions conducted widens considerably as individuals <strong>and</strong> organizations usethese communications tools to redefine how they conduct many common activities. Oneattribute <strong>of</strong> some <strong>of</strong> the channels listed above is to diminish the importance <strong>of</strong> a user’s location.The development <strong>of</strong> l<strong>and</strong>line telephony meant that the parties to a conversation could be locatedat great distances from each other, but at stationary locations. Mobile telephony means that,within certain geographic limits, one need not know where a person is physically tocommunicate with him. E-mails are also non-location dependent because one can send <strong>and</strong>receive messages anywhere in the world to any account accessible over the Internet.Furthermore, Internet access is increasingly becoming a mobile communications channel due tothe spread <strong>of</strong> broadb<strong>and</strong> wireless Internet access (e.g., Wi-Fi). 7A barrage <strong>of</strong> unwanted messages—some legitimate marketing messages <strong>and</strong> other potentiallyfraudulent or dangerous—have accompanied this expansion in communications channels.Anyone with an e-mail account has experienced spam—unsolicited notifications spanning therange from sexual aids to illegal international money laundering schemes. Many individualsfeel overwhelmed by the constant barrage. The volume <strong>of</strong> illegitimate messages also makes itmore difficult for legitimate businesses to communicate with potential customers who would beinterested in their <strong>of</strong>fers. Attempts to provide appropriate remedies have had mixed success.Specific regulations are in place to protect children online, but, in general, individuals <strong>and</strong>organizations must rely on filtering protocols that are less than perfect. Efforts to reduce thenumber <strong>of</strong> telephone solicitations through the use <strong>of</strong> the “Do Not Call” list being administered6This list <strong>of</strong> communication channels is not exhaustive, nor could any complete list be compiled because <strong>of</strong> the linesdividing the various channels are becoming increasingly blurred. Documents can be sent from a computer to a faxmachine, telephone calls can be made using Internet, etc.7See for example, Douglas Heingartner, “Roving the Globe, Laptops Alight on Wireless Hot Spots,” The New York Times,June 5, 2003, p. G4.96
DIGITAL ECONOMY 2003by the Federal Trade Commission are currently under court challenge, even as anti-spamlegislation was passed by Congress.E-CommerceA specific type <strong>of</strong> interaction that has received considerable attention over the past few years iselectronic commerce—that is, buying <strong>and</strong> selling online. The evolution <strong>of</strong> online transactionshas been both “less” <strong>and</strong> “more” than many analysts originally estimated. During the secondquarter <strong>of</strong> 2003, the U.S. Bureau <strong>of</strong> the Census reported that retail e-commerce sales were $12.5billion. 8 Although this represents only 1.5 percent <strong>of</strong> total retail sales—far from replacing instoresales as some proponents promised—it does represent a 28 percent increase over thesecond quarter <strong>of</strong> 2002. E-commerce growth in the business-to-business space, has also fallenshort <strong>of</strong> early expectations. Between 2000 <strong>and</strong> 2001 (the latest data available), manufacturinge-commerce (whether over the Internet or proprietary systems) increased from 18.0 to 18.3percent <strong>of</strong> total shipments, <strong>and</strong> merchant wholesale e-commerce increased from 8.8 to 10.0percent. 9However, if one considers only the dollar value <strong>of</strong> online transactions, the importance <strong>of</strong>e-commerce to the economy is underestimated. Even when the transaction does not take placeonline, the terms <strong>and</strong> conditions <strong>of</strong> the commercial interaction are altered by the availability <strong>of</strong>e-commerce options. A car buyer can go to the nearest dealership armed with detailed researchobtained online. The local bookstore must now consider the pricing <strong>and</strong> service policies <strong>of</strong>online competitors.E-BUSINESS PROCESSThe availability <strong>of</strong> IT products <strong>and</strong> services also impacts the processes that underlie theinteractions. The term “e-business processes” refers to business activities that use information<strong>and</strong> communications technologies. E-commerce is a specific type <strong>of</strong> e-business process, as arehuman resource information systems, <strong>and</strong> enterprise resources planning systems.One particularly interesting area <strong>of</strong> e-business applications is that <strong>of</strong> supply chain management.Use <strong>of</strong> IT products <strong>and</strong> services has enabled interactions between contract participants thatclosely rival (if not match) the quality <strong>of</strong> interaction that occurs within a firm. This givesbusinesses considerable leeway in determining which functions to conduct in-house <strong>and</strong> whichto outsource.While the ability to automate interactions has been available to large organizations for sometime, the development <strong>of</strong> low cost, “<strong>of</strong>f-the-shelf” tools has greatly exp<strong>and</strong>ed the use <strong>of</strong>e-business applications among smaller organizations. IT-driven changes in the ways thatbusinesses are managing their supply chains has been so great that the statistical agencies havehad to reexamine their data collection in a number <strong>of</strong> areas. (See Box 7.1.)8US <strong>Department</strong> <strong>of</strong> Commerce, Bureau <strong>of</strong> the Census News Release, August 22, 2003. http://www.census.gov/mrts/www/current.html9US <strong>Department</strong> <strong>of</strong> Commerce, Bureau <strong>of</strong> the Census, E-Stats, March 19, 2003. http://www.census.gov/estats.97
DIGITAL ECONOMY 2003Box 7.1. Challenges for Economic Data Collection:Changes in the Supply ChainThe supply chain is one area <strong>of</strong> business process where IT is providing the means for businesses tostreamline <strong>and</strong> reduce costs. While new supply chain efficiencies benefit the companies undertakingsuch investments, the new business structures pose challenges for economic data collection.Existing statistical programs classify business locations into industries based on their underlyingproduction function—businesses doing similar activities are grouped together. This classificationsystem assumes that manufacturers, wholesalers, retailers, <strong>and</strong> service businesses each perform adistinct set <strong>of</strong> functions that fit neatly into separate boxes.As electronic information management changes the way businesses interact with each other,boundaries between these formerly distinct sectors are blurring. Manufacturers, wholesalers, <strong>and</strong>retailers all may be selling “services.” Service firms in transportation <strong>and</strong> logistics may be leveragingtheir expertise to take on new functions such as inventory management, or other functions thattraditionally have been associated with manufacturers <strong>and</strong> distributors.The Bureau <strong>of</strong> the Census is taking steps to ensure that the data collected adequately reflects thesechanges in the economy. These steps include adding questions on the supply chain to the 2002Economic Census survey forms for many industries, which were mailed to 5 million Americanbusiness locations in December 2002. The questions asked were customized for particular industries.For example, in manufacturing, respondents were asked if various supply chain activities wereperformed by the individual location, by another establishment within the company, by anothercompany, or not at all. Activities included product design <strong>and</strong> a series <strong>of</strong> activities related to orderfulfillment (bundling or kitting, pick <strong>and</strong> pack, warehousing, breaking bulk, local delivery, longdistance delivery, <strong>and</strong> processing <strong>of</strong> returned merch<strong>and</strong>ise). Census also added several questions oninventory management practices <strong>and</strong> contract manufacturing practices.**Source: US <strong>Department</strong> <strong>of</strong> Commerce, Bureau <strong>of</strong> the Census.MANAGEMENT“When a resource becomes essential to competition but inconsequential to strategy, the risks it createsbecome more important than the advantages it provides.” 10Increasingly, IT is a prerequisite rather than an option for governments, businesses, volunteergroups, <strong>and</strong> households. Possessing information technology may not put you ahead, it may justkeep you from falling behind. In such an environment, effective management <strong>of</strong> IT resources iscritical.The economic research cited earlier in this report indicated that the link between investments inIT <strong>and</strong> increased productivity at the firm level is <strong>of</strong>ten most apparent when IT investment isaccompanied by organizational change. However, as the jumble <strong>of</strong> wires that inhabits the walls,ceiling, <strong>and</strong> floors <strong>of</strong> our homes <strong>and</strong> workspaces attests, adoption <strong>of</strong> IT in most enterprises hasoccurred in a piecemeal fashion that simply automated existing processes. Systems are justified<strong>and</strong> exp<strong>and</strong>ed on the basis <strong>of</strong> how well they address a specific existing need (e.g., human10Nicholas G. Carr, “IT Doesn’t Matter,” Harvard Business Review, May 2003, p. 42.98
DIGITAL ECONOMY 2003resources, acquisition, production, etc.). Often, little thought is given as to whether the processitself needs to be changed or as to how these new systems will interact with existing systems.The new is simply overlaid on the old.Enterprise ArchitectureAn unstructured approach to IT investment can cause management problems. The actualinteractions occurring between people, processes, data, <strong>and</strong> the technology become obscuredunder a wild tangle. Many organizations facing this problem have turned to broad-scaleapproaches, such as enterprise architecture (EA), to gain an underst<strong>and</strong>ing <strong>of</strong> how theorganization is operating <strong>and</strong>, therefore, how it can be improved. Further, since IT increases theamount <strong>of</strong> information available to every member <strong>of</strong> the organization, decision-makers in theseorganizations are thinking about how technology can be used to empower <strong>and</strong> enable eachindividual involved.An enterprise’s leaders must have an accurate underst<strong>and</strong>ing <strong>of</strong> how the enterprise operates tomanage it effectively. As an enterprise’s complexity increases, this task becomes more difficult.One technique for accomplishing this goal is to construct a systematic description <strong>of</strong> theenterprise—an enterprise architecture—that relates the outcome <strong>of</strong> the enterprise’s activities tothe contributions <strong>of</strong> its people, business processes, data, <strong>and</strong> technology. An EA provides theholistic, “outside looking in,” view that enables decision makers to underst<strong>and</strong> where incompatibilities,redundancies, <strong>and</strong> overlaps exist within the enterprise. It also provides insight intothe extent to which individual activities are contributing to (or detracting from) the enterprise’smission.An enterprise’s EA typically reveals a very different organization than the enterprise’sorganizational chart, <strong>and</strong> it forces enterprise management to confront how it actually conductsbusiness. When all the points <strong>of</strong> interaction are described, management then has the informationneeded to begin a review <strong>of</strong> the effectiveness <strong>of</strong> these interactions in supporting the mission <strong>and</strong>goals <strong>of</strong> the enterprise.Collaborative ToolsIT <strong>of</strong>fers opportunities for communities <strong>of</strong> interest to form, share information, <strong>and</strong> work towardcommon goals. Some <strong>of</strong> these collaborative spaces are casual, such as online chat rooms.Others are formal, such as a team working on a design project. Businesses, for example, areincreasingly using collaborative s<strong>of</strong>tware programs to facilitate group discussion <strong>and</strong> decisionmaking.Such s<strong>of</strong>tware allows participants to interact in dedicated online spaces, engage indiscussions, <strong>and</strong> share <strong>and</strong> track information. Collaborative s<strong>of</strong>tware, like most IT tools, cannotcreate efficiency in a vacuum. Organizers <strong>and</strong> participants must establish rules for interaction(i.e., who can participate, how action items are distinguished from extended conversations, whois in charge <strong>of</strong> deleting obsolete items, etc.).99
DIGITAL ECONOMY 2003Box 7.2. E-Gov Initiatives Improving Government through IT:Geospatial One StopThe E-Government Act <strong>of</strong> 2002, signed into law by the President on December 17, 2002, providesexplicit legislative recognition <strong>of</strong> the transformative potential <strong>of</strong> IT. This Act, together with the E-Govinitiatives currently under development, are part <strong>of</strong> the <strong>Administration</strong>’s effort to bring the activities<strong>of</strong> the Federal government into line with the reality <strong>of</strong> the current digital environment.As an integral part <strong>of</strong> the President’s Management Agenda, the cross-agency E-Gov initiatives willmake it easier for citizens <strong>and</strong> businesses to interact with the government, save taxpayer dollars, <strong>and</strong>streamline citizen-to-government transactions. Geospatial One-Stop, one <strong>of</strong> 24 initiatives, illustrateshow cross-agency teams are working to improve the efficiency <strong>and</strong> effectiveness <strong>of</strong> government ITspending. The information below as well as information on the other E-Gov initiatives can be foundat www.egov.govGeospatial data identifies the geographic location <strong>and</strong> characteristics <strong>of</strong> natural orconstructed features <strong>and</strong> boundaries on the Earth. Although a wealth <strong>of</strong> geospatialinformation exists, it is <strong>of</strong>ten difficult to locate, access, share, <strong>and</strong> integrate in a timely<strong>and</strong> efficient manner. Myriad government organizations collect geospatial data indifferent formats <strong>and</strong> st<strong>and</strong>ards to serve specific missions. This results in wastefulspending on information assets, <strong>and</strong> impedes the ability <strong>of</strong> federal, state, <strong>and</strong> localgovernment to perform critical intergovernmental operations, such as homel<strong>and</strong> security.The Geospatial One-Stop initiative will promote coordination <strong>and</strong> alignment <strong>of</strong> geospatialdata collection <strong>and</strong> maintenance among all levels <strong>of</strong> government. Initiative goals include:• Developing a portal for seamless access to geospatial information• Providing st<strong>and</strong>ards <strong>and</strong> models for geospatial data• Creating an interactive index to geospatial data holdings at federal <strong>and</strong> non-federallevels• Encouraging greater coordination among federal, state, <strong>and</strong> local agencies aboutexisting <strong>and</strong> planned geospatial data collectionsSource: http://www.egov.govIdentityTen years ago Peter Steiner succinctly captured one <strong>of</strong> the key issues in Internet interaction ina New Yorker cartoon showing one dog sitting at a computer talking to another dog with thecaption “On the Internet, nobody knows you’re a dog.” 11 And the identity issue remains one <strong>of</strong>critical importance today. The shift online <strong>of</strong> many work <strong>and</strong> personal activities requires thatusers have some level <strong>of</strong> assurance about the identity <strong>of</strong> the people or businesses from whomthey receive information or with whom they conduct business. Effective use <strong>of</strong> networks alsorequires that participants are confident that information <strong>and</strong> transactions are not altered duringtransmission or storage. They must also be confident that access to sensitive or proprietaryinformation is limited to users entitled to access that information. Without adequate safeguards,11New Yorker Magazine, July 1993.100
DIGITAL ECONOMY 2003businesses <strong>and</strong> individuals will bear the brunt <strong>of</strong> increased cost due to fraud <strong>and</strong> theft <strong>and</strong>, as asociety, we will not fully realize the potential benefits <strong>of</strong> online activity.Obviously, identity concerns exist beyond the online environment. The need to verify identity is<strong>of</strong> critical importance in many contexts. Port security requires that seafarers entering a harboron a cargo ship are correctly identified <strong>and</strong> adequately screened. Financial market stabilityrequires that investors are confident that their financial transactions occurred in the mannerrequested <strong>and</strong> that no one has tampered with their account balances. Residents living near achemical or power plant need assurance that only actual employees can access the plant’scontrol facilities.Challenges to the security <strong>of</strong> identity include such disparate activities as identity theft,unauthorized access to a network (hacking), <strong>and</strong> unauthorized access to a facility. Oneimportant area <strong>of</strong> IT research <strong>and</strong> development is the development <strong>of</strong> technologies capable <strong>of</strong>verifying identity with a high degree <strong>of</strong> certainty. However, the use <strong>of</strong> such security tools canignite privacy concerns.SECURITYIdentity is a characteristic <strong>of</strong> an individual or enterprise. It is made up <strong>of</strong> a variety <strong>of</strong> attributes,such as name, social security number, fingerprint, or corporate logo. Both the identity owners<strong>and</strong> those who rely on the assurance <strong>of</strong> correct identity can suffer damage when identity ismisappropriated or identity controls are bypassed. 12 Efforts such as e-authentication, biometrics,<strong>and</strong> firewalls can help increase security around various aspects <strong>of</strong> identity.Identity TheftIdentity theft is a growing problem for both individuals <strong>and</strong> organizations. Over the last fiveyears, the FTC reports that 27.3 million Americans were victims <strong>of</strong> identity theft, including 9.9million during the last year alone. They report further that “identity theft losses to businesses<strong>and</strong> financial institutions totaled nearly $48 billion <strong>and</strong> consumer victims reported $5 billion inout-<strong>of</strong>-pocket expenses.” 13 Sixty-seven percent <strong>of</strong> the identity theft victims reported thatexisting credit card accounts were misused <strong>and</strong> 19 percent reported illegal activity in theirchecking or savings accounts. 14There are many ways in which a criminal can gain enough personal information (credit cardnumber, social security number, blank checks, etc.) to steal the identity <strong>of</strong> someone else. Somemethods are decidedly low tech, such as dumpster diving, stealing a purse or wallet, or usingphony telephone solicitations. However, hacked computers are a growing source for personalinformation that the thief will either use directly or sell to a third party.12See for example, Judith S. Donath, “Identity <strong>and</strong> Deception in the Virtual Community,” prepared for Communities inCyberspace, P. Kollock <strong>and</strong> M. Smith, editors (final draft). http://smg.media.mit.edu./people/judith/Identity/IdentityDeception.html13“FTC Releases Survey <strong>of</strong> Identity Theft in U.S. 27.3 Million Victims in Past 5 Years, Billion in Losses for Businesses<strong>and</strong> Consumers,” News Release, September 3, 2003 www.ftc.gov.14Ibid.101
DIGITAL ECONOMY 2003It is not only individual criminals who are using the Internet to steal <strong>and</strong> sell information, thereis a growing trend toward larger scale criminal organizations. Until recently, the Internet sales<strong>of</strong> stolen credit card information were primarily conducted by individuals. There was littleorganization or automation. However, the Honeynet Project <strong>and</strong> Alliance, which tracks certainillegal online activities, has found an increase in the degree <strong>of</strong> organization involved in theexchange <strong>of</strong> stolen credit card information. Hundreds <strong>of</strong> sellers <strong>of</strong> stolen credit card numbersmight be linked over networks that provide “far greater automation <strong>of</strong> a number <strong>of</strong> illicitactivities contributing to credit card fraud <strong>and</strong> identity theft, including: compromising merchantsites, validating <strong>and</strong> verifying stolen credit card information, <strong>and</strong> the sale or exchange <strong>of</strong> stoleninformation.” 15Computer CrimeIdentity theft is only one <strong>of</strong> a wide variety <strong>of</strong> crimes that can be committed using the Internet.According to the <strong>Department</strong> <strong>of</strong> Justice, online crimes cover the range from multimillion-dollarswindles, online auction scams, <strong>and</strong> business-opportunity frauds to piracy <strong>of</strong> s<strong>of</strong>tware <strong>and</strong> othercopyrighted material. Some progress is being made, however, in catching criminals who use theInternet. For example, under a coordinated initiative called Operation E-Con, the Justice<strong>Department</strong> recently reported the arrest <strong>of</strong> over 130 individuals <strong>and</strong> the seizure <strong>of</strong> more than$17 million. 16Another threat comes from those who—with or without malicious intent—illegally accesscomputer systems. Symantec, an Internet security provider, conducts statistical analysis <strong>of</strong>current trends in cyber security threats by tracking real-time cyber attack activities detected bya sample set <strong>of</strong> more than 400 companies. 17 They categorize attacks into three groups: maliciouscode trends (worms <strong>and</strong> blended threat activity 18 ), other cyber attack trends, <strong>and</strong> vulnerabilitytrends. Symantec reports that “[b]ased on vulnerabilities that surfaced in 2002, a number <strong>of</strong>high-risk future threats have emerged, which attackers <strong>and</strong> malicious code writers are onlybeginning to leverage.” 1915The Honeynet Project is an all volunteer organization <strong>of</strong> security pr<strong>of</strong>essionals dedicated to researching cyber threats.See “Know Your Enemy—A Pr<strong>of</strong>ile,” Assessment Date: June 6, 2003. http://www.honeynet.org/papers/pr<strong>of</strong>iles/cc-fraud.pdf16Operation E-Con is being coordinated by 43 United States Attorney’s Offices nationwide, the Federal Bureau <strong>of</strong>Investment, the Federal Trade Commission, the Postal Inspection Service, Secret Service, <strong>and</strong> the Bureau <strong>of</strong> Immigration<strong>and</strong> Customs Enforcement, in addition to other state, local, <strong>and</strong> foreign law enforcement agencies. US <strong>Department</strong> <strong>of</strong>Justice, “Justice <strong>Department</strong> Announces Dozens <strong>of</strong> Arrests in Nationwide Internet Fraud Takedown, Operation E-Con,”Press Release, May 16, 2003. http://www.justice.gov.17According to Symantec, they maintain “one <strong>of</strong> the world’s largest <strong>and</strong> most detailed repositories <strong>of</strong> cyber attack data …collected from thous<strong>and</strong>s <strong>of</strong> firewalls <strong>and</strong> intrusion detection systems throughout the world.”18Symantec defines blended threats as attacks that combine the characteristics <strong>of</strong> viruses, worms, Trojan horses, <strong>and</strong>malicious code with server <strong>and</strong> Internet vulnerabilities to initiate, transmits <strong>and</strong> spread an attack. By utilizing multiplemethods <strong>and</strong> techniques, blended threats <strong>of</strong>ten spread rapidly <strong>and</strong> cause widespread damage.19Mark Higgins, Ed., “Symantec Internet Security Threat <strong>Report</strong>: Attack Trends for Q3 <strong>and</strong> Q4 2002,” Volume 3,February 2003.102
DIGITAL ECONOMY 2003AuthenticationOne way to decrease the occurrence <strong>of</strong> identity theft <strong>and</strong> other types <strong>of</strong> computer crime is toincrease the level <strong>of</strong> identity certainty—that is, better authentication. For strictly onlinecommunications or transactions, dem<strong>and</strong> continues to grow for an electronic equivalent forsignatures <strong>and</strong> contracts as online communications <strong>and</strong> transactions increase. For situationswhere an individual is physically present, biometric tools are being developed.Even though electronic credentialing or authentication techniques continue to increase insophistication, they must be continually improved to stay ahead <strong>of</strong> hackers. Further, establishing<strong>and</strong> maintaining authentication systems can be costly <strong>and</strong> complicated. For example, toreduce the proliferation <strong>of</strong> duplicative systems at the federal level, the <strong>Administration</strong>’sE-Authentication initiative launched an interim gateway in 2002 as a pilot project to support the24 government-wide E-Government initiatives. Although the gateway was successful in theinterim phase, participants determined that this solution would not scale sufficiently for thegateway to h<strong>and</strong>le the authentication <strong>of</strong> credentials for all <strong>of</strong> the federal agencies. Therefore, the<strong>Administration</strong> is shifting to the federated approach used by industry. 20IT is also playing a role in authenticating identity in situations where an individual is physicallypresent—via technologies, such as biometrics. According to the International BiometricIndustry Association, biometric authentication “is the automatic identification or identityverification <strong>of</strong> an individual based on physiological or behavioral characteristics. Suchauthentication is accomplished by using computer technology in a noninvasive way to matchpatterns <strong>of</strong> live individuals in real time against enrolled records. Examples <strong>of</strong> biometric-basedtechnologies include products that recognize faces, h<strong>and</strong>s, fingers, signatures, irises, voices, <strong>and</strong>fingerprints.” 21Use <strong>of</strong> these technologies is likely to become more common. For example, as part <strong>of</strong> the effortto increase the security <strong>of</strong> U.S. borders, the Enhanced Border Security <strong>and</strong> Visa Entry ReformAct <strong>of</strong> 2002 m<strong>and</strong>ates that all visas issued for entry into the United States incorporatebiometrics by 2006. The Act does not specify what type <strong>of</strong> biometric should be used, but amongthe requirements that might be considered are whether the biometrics can be checked againstcriminal watch lists when the user enrolls, whether they guard against dual enrollment (i.e.,maintaining multiple identities), <strong>and</strong> whether they verify identity at ports <strong>of</strong> entry. 22PRIVACYEven as users dem<strong>and</strong> assurance <strong>of</strong> the correct identity <strong>and</strong> security <strong>of</strong> websites they visit, mostwant to maintain their rights to privacy. For example, visitors to a web site that claims to bemaintained by the National Institutes <strong>of</strong> Health (NIH) want safeguards in place that guarantee20Jason Miller, “New Authentication Plan Takes Shape,” Government Computer News, Nov 10, 2003 http://www.gcn.com/22-32/news/24101-1.html.21http://www.idia.org/faqs.htm.22Michael Geruso, “Looking Visa-Holders in the Eye,” Mechanical Engineering, September 2002, pg. 26.103
DIGITAL ECONOMY 2003that the information provided on the site is indeed the unaltered information supplied by NIH.However, the same visitors do not necessarily want NIH to maintain a record <strong>of</strong> who they are<strong>and</strong> what pages they visited.All federal government websites <strong>and</strong> almost all other reputable private websites will have aprivacy policy statement linked to their website homepage. These statements disclose whatinformation is captured when you visit or request a download, whether tracking agents such ascookies are used, how long data are kept, <strong>and</strong> whether information gathered is ever provided tothird parties. Most sites that do maintain arrangements to sell or trade data <strong>of</strong>fer the opportunityfor a user to opt-out <strong>of</strong> the data sharing arrangement.Statutory <strong>and</strong> regulatory safeguards to personal information privacy continue to be developed,though in a sector-specific manner. For example, the Federal Trade Commission (FTC), as part<strong>of</strong> its consumer protection mission, supports the privacy protections provided under severalpieces <strong>of</strong> legislation. “Under the FTC Act, the Commission guards against unfairness <strong>and</strong>deception by enforcing companies’ privacy promises about how they collect, use <strong>and</strong> secureconsumers’ personal information. Under the Gramm-Leach-Bliley Act, the Commission hasimplemented rules concerning financial privacy notices <strong>and</strong> the administrative, technical <strong>and</strong>physical safeguarding <strong>of</strong> personal information, <strong>and</strong> it aggressively enforces against pretexting.The Commission also protects consumer privacy under the Fair Credit <strong>Report</strong>ing Act <strong>and</strong> theChildren’s Online Privacy Protection Act.” 23Similarly, the <strong>Department</strong> <strong>of</strong> Health <strong>and</strong> Human Services (HHS) is responsible for theregulation that enables the federal privacy protections for individually identifiable healthinformation provided for under the Health Insurance Portability <strong>and</strong> Accountability Act(HIPAA) <strong>of</strong> 1996. Under the Privacy Rule (published December 2000), covered entities had tohave st<strong>and</strong>ards in place to protect <strong>and</strong> guard against the misuse <strong>of</strong> individually identifiablehealth information by April 1, 2003 (April 14, 2004 is the deadline for small health plans). 24ConclusionWhile adjusting to the realities <strong>of</strong> the current digital environment is far from costless,recognizing where the challenges lie <strong>and</strong> addressing them directly will help smooth thetransition.23Federal Trade Commission, Privacy Initiatives http://www.ftc.gov/privacy/index.html24<strong>Department</strong> <strong>of</strong> Health <strong>and</strong> Human Services, “General Overview <strong>of</strong> St<strong>and</strong>ards for Privacy <strong>of</strong> Individually IdentifiableHealth Information,” Revised April 3, 2003. http://www.hhs.gov/ocr/hipaa/guidelines/overview.pdf104