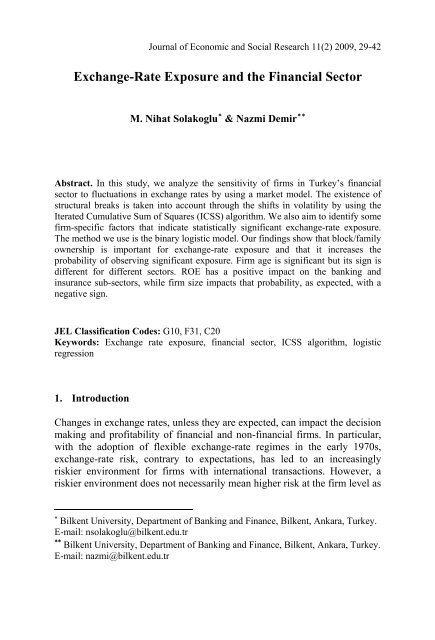
Exchange-Rate Exposure and the Financial Sector - Journal of ...
Exchange-Rate Exposure and the Financial Sector - Journal of ...
Exchange-Rate Exposure and the Financial Sector - Journal of ...
Create successful ePaper yourself
Turn your PDF publications into a flip-book with our unique Google optimized e-Paper software.
<strong>Exchange</strong>-<strong>Rate</strong> <strong>Exposure</strong> <strong>and</strong> <strong>the</strong> <strong>Financial</strong> <strong>Sector</strong> 31breaks to estimate exposure levels for firms in <strong>the</strong> financial sector overdifferent time periods. Secondly, we analyze <strong>the</strong> role <strong>of</strong> firm-specific factorson exposure level. Given <strong>the</strong> widespread problem <strong>of</strong> statistical insignificancewith <strong>the</strong> exposure coefficient, we use logistic regression approach to identifyfactors that are relevant for <strong>the</strong> probability <strong>of</strong> observing a significantexposure to exchange-rate fluctuations for a period that we identify as stable.The remainder <strong>of</strong> <strong>the</strong> paper is organized as follows. In section II, wediscuss <strong>the</strong> data sources <strong>and</strong> report <strong>the</strong> estimation results <strong>of</strong> exchange-rateexposure models. Estimation results for <strong>the</strong> logistic regression are discussedin section 3. The last section presents our main conclusions <strong>and</strong> suggestionsfor fur<strong>the</strong>r research.2. <strong>Exchange</strong> <strong>Rate</strong> <strong>Exposure</strong>The analysis is performed using monthly data at <strong>the</strong> firm level betweenJanuary 1995 <strong>and</strong> September 2006. Firm level data <strong>and</strong> stock prices areobtained from Istanbul Stock <strong>Exchange</strong>, 3 while exchange-rate data isobtained from <strong>the</strong> statistical data web page <strong>of</strong> <strong>the</strong> Central Bank <strong>of</strong> Turkey. 4Considering <strong>the</strong> high correlation between monthly U.S. dollar (USD)<strong>and</strong> Euro returns, <strong>the</strong> analysis is conducted using USD only. 5 Moreover,given that more than 90% <strong>of</strong> international transactions in goods <strong>and</strong> servicesinvolve <strong>the</strong>se two exchange rates, 6 <strong>the</strong> exclusion <strong>of</strong> o<strong>the</strong>r exchange ratesshould not be assumed to be overly restrictive.Following earlier studies, exchange-rate exposure is calculated as <strong>the</strong>sensitivity <strong>of</strong> firm returns to exchange-rate movements. Specifically, weestimate <strong>the</strong> following market model:R i,t = α + β m R m,t + β s R s,t + ε i,t , (1)3 www.ise.gov.tr4 Daily data on USD <strong>and</strong> Euro prices in terms <strong>of</strong> YTL are used to obtain monthlyaverage prices.5 Between January 1999 <strong>and</strong> September 2006, <strong>the</strong> correlation coefficient betweenUSD <strong>and</strong> Euro rate <strong>of</strong> return was 0.89.6 For 2006, about 49% <strong>and</strong> 44% <strong>of</strong> exports used Euro <strong>and</strong> USD, respectively. Forimports, 38% <strong>and</strong> 59% <strong>of</strong> import-contracts were underwritten with <strong>the</strong>se twocurrencies (source: Turkish Statistical Institute).
32Mehmet Nihat Solakoglu & Nazmi Demirwhere R i,t is <strong>the</strong> return on firm stock, R m,t is <strong>the</strong> return on <strong>the</strong> marketportfolio, <strong>and</strong> R s,t is <strong>the</strong> return on a portfolio consisting <strong>of</strong> USD only. 7Results <strong>of</strong> exchange-rate exposure estimations for <strong>the</strong> full sample areprovided in table 1. It appears that average exchange-rate exposure for <strong>the</strong>firms in <strong>the</strong> financial sector is negative, though not overly significant asevidenced by mostly insignificant coefficient estimates. Given that <strong>the</strong>exchange rate is defined as <strong>the</strong> YTL value <strong>of</strong> a US dollar, a negativecoefficient indicates a decline in firm value as a result <strong>of</strong> local currencydepreciation. Interestingly, <strong>the</strong> “banking <strong>and</strong> special finance corporations”sub-sector faces with positive exposure to exchange-rate movements,implying that <strong>the</strong>ir firm value increases with a depreciation <strong>of</strong> localcurrency. 8 In o<strong>the</strong>r words, it appears that foreign-currency-denominatedassets <strong>of</strong> <strong>the</strong>se institutions outweigh foreign-currency-denominatedliabilities. For <strong>the</strong> o<strong>the</strong>r sub-sectors though, average exposure beta isnegative with most significant coefficients having <strong>the</strong> negative sign as well,i.e. a depreciating TL leads to a decline in firm value.Table 1: <strong>Exchange</strong> rate exposure for full sample<strong>Sector</strong> # <strong>of</strong> Firms # Significant Direction (a) Beta σ beta Min Beta Max BetaBanks <strong>and</strong> Special FinanceCorporations 12 1 (+) 0.066 0.254 -0.253 0.576Insurance Companies 6 0 na -0.105 0.272 -0.568 0.283<strong>Financial</strong> Leasing <strong>and</strong>Factoring Companies 9 2 (-) -0.139 0.391 -0.769 0.291Holding <strong>and</strong> InvestmentCompanies 18 2 (+), (-) -0.125 0.367 -1.155 0.440Real Estate InvestmentsTrusts 9 2 (-) -0.195 0.280 -0.587 0.204Investments Trusts 20 1 (-) -0.063 0.291 -0.871 0.434(a): A plus sign indicates that <strong>the</strong> significant beta estimates are positive, while a negative sign indicates negative coefficient estimate. Given USD price <strong>of</strong>YTL is used in calculations, a positive sign indicates that firm value increases with YTL depreciation.7 Since Solakoglu (2005b) study does not find strong evidence for asymmetricexchange rate exposure, we do not apply asymmetry in <strong>the</strong> estimations.8 However, as we indicated earlier, this interpretation is based on <strong>the</strong> sign <strong>of</strong> <strong>the</strong>average exposure, <strong>and</strong> not on <strong>the</strong> significance. The number <strong>of</strong> statistically significantcoefficients is limited implying that ei<strong>the</strong>r firms are successful in hedging that riskor <strong>the</strong>y do not have significant exposure.
<strong>Exchange</strong>-<strong>Rate</strong> <strong>Exposure</strong> <strong>and</strong> <strong>the</strong> <strong>Financial</strong> <strong>Sector</strong> 33Given that importers’ <strong>and</strong> exporters’ preferences for USD <strong>and</strong> Eurodiffer, 9 <strong>the</strong> movements in <strong>the</strong> USD-Euro exchange rate may also increasefirms’ exposure to exchange-rate risk. For financial firms, this parity risk canbe important if foreign-currency-denominated assets <strong>and</strong> liabilities differ in<strong>the</strong> currency denominations. The market model is adjusted to reflect thisadditional risk, as shown by equation 2.R i,t = α + β m R m,t + β s R s,t + β p R p,t + ε i,t (2)In equation 2, R p,t is <strong>the</strong> return on USD-Euro exchange rate, while o<strong>the</strong>rshave <strong>the</strong> same explanation as in equation 1. Table 2 presents results formodel 2 for <strong>the</strong> period between February 1999 <strong>and</strong> September 2006. Ourfindings for <strong>the</strong> sensitivity <strong>of</strong> firm value to USD fluctuations are notsignificantly different from <strong>the</strong> previous findings. Although <strong>the</strong> averagecoefficient for parity risk implies a decline in firm value for all sub-sectorswhen USD depreciates against <strong>the</strong> Euro, <strong>the</strong> first sub-sector significantcoefficient has <strong>the</strong> only positive sign. A positive coefficient, in that case,implies that USD liabilities should be higher than assets so that depreciationcan increase firm value.Table 2: <strong>Exchange</strong> rate exposure <strong>and</strong> Parity risk for full sample<strong>Sector</strong> # <strong>of</strong> Firms # Significant (a) Direction (b) Beta ParityBanks <strong>and</strong> Special FinanceCorporations 12 1,1 (+) 0.043 -0.082Insurance Companies 6 0,1 na -0.037 -0.365<strong>Financial</strong> Leasing <strong>and</strong>Factoring Companies 9 2,3 (-) -0.134 -1.044Holding <strong>and</strong> InvestmentCompanies 18 3,2 (-) -0.138 -0.427Real Estate InvestmentsTrusts 9 2,0 na -0.233 -0.315Investments Trusts 20 1,3 (-) -0.065 -0.495(a) The number before <strong>the</strong> comma shows <strong>the</strong> number <strong>of</strong> significant for exposure beta, while <strong>the</strong> number after <strong>the</strong> commashows <strong>the</strong> number <strong>of</strong> significant parity risk estimates.(b): A plus sign indicates that <strong>the</strong> significant parity risk estimates are positive, while a negative sign indicates negativecoefficient estimate. Since parity is denoted by <strong>the</strong> price <strong>of</strong> Euro in terms <strong>of</strong> USD, a positive sign indicates an increase infirm value as a result <strong>of</strong> USD depreciation.9 See footnote 6. In addition, a survey <strong>of</strong> <strong>the</strong> Turkish textile industry indicated thatfirms prefer USD for imports but Euro for Exports. Even a firm with both exports<strong>and</strong> imports indicate this preference as shown in Solakoglu <strong>and</strong> Ersin (2007).
34Mehmet Nihat Solakoglu & Nazmi DemirHowever, as before, we observe a widespread finding <strong>of</strong> insignificantexchange-rate exposure <strong>and</strong> parity risk. Since we do not observe a perfectoverlap between parity risk <strong>and</strong> exposure beta in terms <strong>of</strong> significance at <strong>the</strong>firm level, we use significance <strong>of</strong> ei<strong>the</strong>r coefficients as an indication <strong>of</strong>exposure to <strong>the</strong> movements in <strong>the</strong> foreign exchange market.In both tables 1 <strong>and</strong> 2, we utilize all available data points. However,world economies <strong>and</strong> <strong>the</strong> Turkish economy encountered several importantcrises <strong>and</strong> alterations during <strong>the</strong> considered timeframe, such as <strong>the</strong>introduction <strong>of</strong> <strong>the</strong> Euro. To determine <strong>the</strong> breakpoints in our series, we use<strong>the</strong> Iterated Cumulative Sum <strong>of</strong> Squares (ICSS) algorithm introduced byInclan <strong>and</strong> Tiao (1994). The ICSS algorithm can be used to detect multiplebreakpoints in a time series by testing for volatility shifts. Let’s assume ε t is<strong>the</strong> series in question with zero mean <strong>and</strong> σ 2 t as <strong>the</strong> unconditional variance.Inclan <strong>and</strong> Tiao (1994) define <strong>the</strong> cumulative sum <strong>of</strong> squares between time 1<strong>and</strong> k as:k2Ck= ∑εt,t=1where t = 1,...,T <strong>and</strong> k = 1,..,TThe centered <strong>and</strong> normalized cumulative sum <strong>of</strong> squares until time k isrepresented by <strong>the</strong> D k statistics.DkC=CkT−k, with D = DTT0=0If <strong>the</strong>re is no volatility shift in <strong>the</strong> series, <strong>the</strong> plot <strong>of</strong> D k against k willoscillate around zero. On <strong>the</strong> o<strong>the</strong>r h<strong>and</strong>, with a volatility shift, we willobserve D k statistics drifting away from zero. Based on Inclan <strong>and</strong> Tiao(1994) study, an asymptotic critical value <strong>of</strong> 1.358 can be used to createboundaries to identify <strong>the</strong> point in time with a volatility shift. 10We use two series to identify <strong>the</strong> sudden changes in volatility. Thetime-points <strong>of</strong> <strong>the</strong> shifts can be used as <strong>the</strong> break points in <strong>the</strong> analysis. The10 Critical values are calculated from <strong>the</strong> distribution <strong>of</strong> D k under <strong>the</strong> <strong>the</strong> nullhypo<strong>the</strong>sis <strong>of</strong> homogeneous variance. One can use <strong>the</strong> critical values to obtain upper<strong>and</strong> lower boundaries to detect volatility shifts. For details on <strong>the</strong> ICSS algorithm<strong>and</strong> some uses, please see: Inclan <strong>and</strong> Tiao (1994), Ewing <strong>and</strong> Malik (2005),Marcelo et al (2006).
<strong>Exchange</strong>-<strong>Rate</strong> <strong>Exposure</strong> <strong>and</strong> <strong>the</strong> <strong>Financial</strong> <strong>Sector</strong> 35series we consider are <strong>the</strong> return on market portfolio, as represented by <strong>the</strong>ISE100 index, <strong>and</strong> <strong>the</strong> return on US dollar. The breakpoints are presented intable 3.Table 3: Return, Beta estimates, <strong>and</strong> BreaksSeries# <strong>of</strong>BreaksPeriodAverageReturnSt<strong>and</strong>ardError<strong>Exposure</strong>BetaParityBeta#significantSig ExpBetaSig ParityBetaExplanationISE100 2 Jan 1995 - Oct 2001 6.61% 28.30% -0.341 na 8,na -1.399 na Turkish financial crisis in 2001Nov 2001 - Sep 2006 4.27% 20.26% 0.2214 -0.1519 8,4 1.027 -1.899 Post-crisis periodUSD 5 Jan 1995 - Nov 1997 8.62% 25.86% ‐0.257 na 2,na -2.138 na*: Included in <strong>the</strong> Dec 2000-Nov 2001 periodDec 1997 - Sep 2000 7.73% 29.37% -2.453 na 13,na -3.990 na Asian crisis period: Russian crisisTurkish crisis first revealed itself in NovOct 2000 - Nov 2000* -11.59% 28.46% na na na na na <strong>of</strong> 2000; Technology bubble burst in USACrisis period in Turkey; EuropeanDec 2000 - Nov 2001 4.64% 28.50% -0.350 -1.385 11,19 -0.769 -2.752 Monetary Union (Euro): September 11Dec 2001 - Sep 2006 3.95% 20.07% 0.239 -0.126 10,5 0.957 -1.268 Post-crisis periodThere are 2 breakpoints identified by <strong>the</strong> ICSS algorithm when <strong>the</strong>market portfolio (ISE100) index is used. The first period, January 1995 toOctober 2001, corresponds to before <strong>the</strong> 2001 crisis in Turkey. Given <strong>the</strong>recent introduction <strong>of</strong> <strong>the</strong> Euro, <strong>and</strong> <strong>the</strong> stickiness <strong>of</strong> transactionsdenominated in US dollars in Turkey, we decided not to include a proxy forparity risk. A comparison <strong>of</strong> pre <strong>and</strong> post-crisis periods shows that only asmall number <strong>of</strong> firms in <strong>the</strong> financial sector have significant exposure toexchange-rate movements. 11 Interestingly, exposure beta is positive postcrisis,while it is negative for <strong>the</strong> pre-crisis period. In o<strong>the</strong>r words, firm valueis positively impacted by <strong>the</strong> depreciation <strong>of</strong> <strong>the</strong> local currency in <strong>the</strong> postcrisisperiod <strong>and</strong> is negatively impacted in <strong>the</strong> pre-crisis period. In addition,<strong>the</strong> depreciation <strong>of</strong> USD against Euro in <strong>the</strong> post-crisis period leads to adecline in firm value. This may imply that assets are mostly denominated inUSD, <strong>and</strong> liabilities are mostly denominated in Euro.11 The reported number <strong>of</strong> significant cases will be underestimating <strong>the</strong> true numberas our dataset includes firms that exist as <strong>of</strong> 2006. However, several companies in<strong>the</strong> financial sector, specifically in banking, went bankrupt after <strong>the</strong> crisis.
<strong>Exchange</strong>-<strong>Rate</strong> <strong>Exposure</strong> <strong>and</strong> <strong>the</strong> <strong>Financial</strong> <strong>Sector</strong> 37<strong>of</strong> <strong>the</strong> future cash-flow expectations. The last variable, ROE, represents <strong>the</strong>current accounting performance <strong>of</strong> <strong>the</strong> firm. Since our dependent variable isbinary, we use logistic distribution as our link function to define <strong>the</strong>probability <strong>of</strong> detecting significant currency exposure. That is:whererepresents <strong>the</strong> predicted value from <strong>the</strong> regression, <strong>and</strong>exp denotes exponential function in this equation. Through this linkfunction, <strong>the</strong> probability <strong>of</strong> detecting significant exposure ranges between 0<strong>and</strong> 1, <strong>and</strong> o<strong>the</strong>r problems associated with <strong>the</strong> linear probability model areeliminated (see, Greene, chap. 21, 1993).We believe firm size <strong>and</strong> age are important determinants <strong>of</strong>exchange-rate exposure. Under <strong>the</strong> globally competitive business conditions,in order to have sustainable growth a firm must search for opportunities notonly in <strong>the</strong> local market but also in foreign markets. Hence, it is natural forlarger firms to have international transactions <strong>and</strong> a higher likelihood <strong>of</strong>exposing <strong>the</strong>mselves to exchange-rate risk. Similarly, younger firms areexpected to be in <strong>the</strong>ir growth stage <strong>and</strong> utilize all opportunities to grow.Hence, we should expect a positive relationship between size <strong>and</strong> currencyexposure. On <strong>the</strong> o<strong>the</strong>r h<strong>and</strong>, larger <strong>and</strong> older firms are expected to have <strong>the</strong>necessary resources to hedge exchange-rate risk through several strategies.Hence, larger <strong>and</strong> older firms may not be sensitive to fluctuations inexchange rates. Thus, it may not be clear how size <strong>and</strong> age variables canimpact firm-level exposure (Dominguez <strong>and</strong> Tesar, 2006). As discussed in<strong>the</strong> literature, family ownership can influence firm performance positively(see, for example, Demsetz <strong>and</strong> Villalonga (2001), Maury <strong>and</strong> Pajuste(2005), Maury (2006)). Moreover, <strong>the</strong>se firms can have a lower exposure toexchange-rate movements as <strong>the</strong>y can have a higher degree <strong>of</strong> risk aversion<strong>and</strong> thus take lower risks in international transactions.Table 4 presents estimation results for <strong>the</strong> logistic regression.Results are presented for all firms, <strong>and</strong> for firms segmented into two groups<strong>of</strong> sectors with <strong>the</strong> first group – sectors 1,2 – including firms in “Banks <strong>and</strong>Special Finance Corporations” <strong>and</strong> “Insurance Companies”, <strong>and</strong> <strong>the</strong> secondgroups including <strong>the</strong> remaining sub-sectors. For all firms, we find that firmage has a negative effect on <strong>the</strong> probability <strong>of</strong> having significant exposure toexchange-rate fluctuations. This should not be surprising as discussedearlier. On <strong>the</strong> o<strong>the</strong>r h<strong>and</strong>, family owned firms appear to have a higher
38Mehmet Nihat Solakoglu & Nazmi Demirprobability than o<strong>the</strong>rs, indicating that <strong>the</strong>se firms are ei<strong>the</strong>r less concernedabout <strong>the</strong> risk or that <strong>the</strong>y do not have <strong>the</strong> required resources. The size <strong>of</strong> <strong>the</strong>firm <strong>and</strong> o<strong>the</strong>r variables do not show any significant impacts.Table 4: Estimation results <strong>of</strong> Logistic regressionVariable<strong>Sector</strong>sAllSample 1,2 3,4,5,6Age <strong>of</strong> <strong>the</strong> Firm -0.8963*** 1.9394* -0.8240**0.1932 1.0095 0.3280Family Ownership (Binary) 0.8793** 5.2948** 2.0373***0.3770 2.0705 0.6533Size <strong>of</strong> <strong>the</strong> Firm 0.1058 -2.1045*** -0.57270.0960 0.7849 0.2333Market Cap/Book Value 0.1040 0.9036 0.02380.0732 0.6284 0.2237ROE 0.3920 19.6270** 0.27470.6276 7.7456 0.8917Log L -94.63 -14.54 -51.55***, **, * represents statistical significance at 1%, 5% <strong>and</strong> 10%, respectively.<strong>Sector</strong>s 1 <strong>and</strong> 2 are "Banks <strong>and</strong> Special Finance Corporations" <strong>and</strong> "InsuranceCompanies".Firm size is measured by <strong>the</strong> number <strong>of</strong> employees.Both Age <strong>and</strong> Size variables are in natural logarithms.For sub-sectors 1 <strong>and</strong> 2, firm age, family control <strong>and</strong> ROE all showpositive <strong>and</strong> significant coefficient estimates. That is, <strong>the</strong> level <strong>of</strong> probabilityis positively associated with <strong>the</strong>se variables. It is surprising that older firmsare more likely to take currency risk, but perhaps older firms are <strong>the</strong> oneswith a larger share <strong>of</strong> family ownership. Higher returns on equity, one canargue, can indicate higher risk-taking for higher pr<strong>of</strong>its. The size <strong>of</strong> <strong>the</strong> firm,on <strong>the</strong> o<strong>the</strong>r h<strong>and</strong>, leads to a decline in that probability. The second segment<strong>of</strong> sectors – sectors 3 to 6 – shows that only firm age <strong>and</strong> family controlimpact probability. While <strong>the</strong> probability <strong>of</strong> exposing firm valuesignificantly to exchange-rate fluctuations declines with age, it increaseswith family control as in <strong>the</strong> first segment.
<strong>Exchange</strong>-<strong>Rate</strong> <strong>Exposure</strong> <strong>and</strong> <strong>the</strong> <strong>Financial</strong> <strong>Sector</strong> 394. Concluding RemarksWe investigate <strong>the</strong> sensitivity <strong>of</strong> firm value to fluctuations in exchange ratesusing a market model for Turkey’s financial sector. With <strong>the</strong> exception <strong>of</strong><strong>the</strong> “Banking <strong>and</strong> Special Finance Corporations” sub-sector, we find that adepreciation <strong>of</strong> <strong>the</strong> local currency leads to a decline in firm value. Moreover,only a small number <strong>of</strong> firms show significant exposure to exchange-ratefluctuations indicating that most firms are successfully protecting <strong>the</strong>mselvesfrom currency risk.By using <strong>the</strong> ICSS algorithm, we identify <strong>the</strong> breakpoints in oursample. A stable period is selected based on <strong>the</strong> breaks to analyze <strong>the</strong> role <strong>of</strong>firm-specific factors on significant exposure to exchange-rate movements.We use <strong>the</strong> logistic regression method <strong>and</strong> consider only significantexposures. Results indicate that larger firms are more likely to be impactedless by exchange-rate movements. Family ownership, on <strong>the</strong> o<strong>the</strong>r h<strong>and</strong>,causes an increase in <strong>the</strong> probability <strong>of</strong> observing significant exposure. Firmage seems to have different effects based on <strong>the</strong> sub-sectors, while ROE hasonly a positive effect for <strong>the</strong> banking <strong>and</strong> insurance sectors.
40Mehmet Nihat Solakoglu & Nazmi DemirReferencesAdler, M. & B. Dumas (1980) “The exposure <strong>of</strong> long-term foreign currencybonds.” The <strong>Journal</strong> <strong>of</strong> <strong>Financial</strong> <strong>and</strong> Quantitative Analysis 15: 973-994.Adler, M., Dumas, B. (1984) “<strong>Exposure</strong> to currency risk: definition <strong>and</strong>measurement.” <strong>Financial</strong> Management 13: 41–50.Bartov, E., Bodnar, G.M. (1994) “Firm valuation, earnings expectations <strong>and</strong><strong>the</strong> exchange-rate exposure effect.” <strong>Journal</strong> <strong>of</strong> Finance 49: 1755–1785.Boratav, Korkut <strong>and</strong> Erinç Yeldan (2002) “Turkey, 1980-2000: <strong>Financial</strong>Liberalization, Macroeconomic (In)-Stability <strong>and</strong> Patterns <strong>of</strong>Distribution.” CEPA <strong>and</strong> The New School for Social Research, mimeo.Demsetz, H., Villalonga, B. (2001) “Ownership structure <strong>and</strong> corporateperformance.” <strong>Journal</strong> <strong>of</strong> Corporate Finance 7: 209–233.Dominguez, K.M.E., Tesar, L.L. (2001) “Trade <strong>and</strong> exposure.” AmericanEconomic Review Papers <strong>and</strong> Proceedings 91: 367–370.Dominguez, K.M.E., Tesar, L.L. (2006) “<strong>Exchange</strong> rate exposure.” <strong>Journal</strong><strong>of</strong> International Economics 68: 188-218.Dumas, B. (1978) “The <strong>the</strong>ory <strong>of</strong> <strong>the</strong> trading firm revisited.” <strong>Journal</strong> <strong>of</strong>Finance 33: 1019–1029.Ewing, B.T. <strong>and</strong> F. Malik. (2005) “Re-examining <strong>the</strong> asymmetricpredictability <strong>of</strong> conditional variances: The role <strong>of</strong> sudden changes invariance.” <strong>Journal</strong> <strong>of</strong> Banking <strong>and</strong> Finance, 29(10): 2655-2673.Fraser, S., Pantzalis, C. (2004) “Foreign exchange rate exposure <strong>of</strong> USmultinational corporations: a firm-specific approach.” <strong>Journal</strong> <strong>of</strong>Multinational <strong>Financial</strong> Management 14: 261–281.Greene, W.H. (1997) Econometric Analysis 3rd edition. Prentice-Hall
<strong>Exchange</strong>-<strong>Rate</strong> <strong>Exposure</strong> <strong>and</strong> <strong>the</strong> <strong>Financial</strong> <strong>Sector</strong> 41Hahm, Joon-Ho (2004) “Interest rate <strong>and</strong> exchange rate exposures <strong>of</strong>banking institutions in pre-crisis Korea.” Applied Economics 36: 1409-1419.Inclan, C. <strong>and</strong> G.C. Tiao. (1994) “Use <strong>of</strong> cumulative sums <strong>of</strong> squares forretrospective detection <strong>of</strong> changes <strong>of</strong> variance.” <strong>Journal</strong> <strong>of</strong> <strong>the</strong>American Statistical Association, 89(427): 913-923.Jorion, P. (1995) “Predicting volatility in <strong>the</strong> foreign exchange market.” The<strong>Journal</strong> <strong>of</strong> Finance, Vol. L, No. 2: 507-528.Kiymaz, H. (2003) “Estimation <strong>of</strong> foreign exchange exposure: an emergingmarket application.” <strong>Journal</strong> <strong>of</strong> Multinational <strong>Financial</strong> Management13: 71–84.Koutmas, G. & A.D. Martin (2003) “Asymmetric <strong>Exchange</strong> <strong>Rate</strong> <strong>Exposure</strong>:<strong>the</strong>ory <strong>and</strong> evidence.” <strong>Journal</strong> <strong>of</strong> International Money <strong>and</strong> Finance 22:365-383.Marcelo, J.L.M., Quiros, J.L.M., <strong>and</strong> M.M.M. Quiros. (2008) “Asymmetricvariance <strong>and</strong> spillover effects: Regime shifts in <strong>the</strong> Spanish stockmarket.” <strong>Journal</strong> <strong>of</strong> International <strong>Financial</strong> Markets, Institutions <strong>and</strong>Money, 18(1): 1-15.Martin, A.D., Mauer, L.J. (2003) “<strong>Exchange</strong> rate exposures <strong>of</strong> US banks: acash flow-based methodology.” <strong>Journal</strong> <strong>of</strong> Banking <strong>and</strong> Finance, 27:851–865.Martin, A.D., Mauer, L.J. (2005) “A note on common methods used toestimate foreign exchange exposure.” <strong>Journal</strong> <strong>of</strong> International,<strong>Financial</strong> Markets Institutions <strong>and</strong> Money 15: 125–140.Maury, B. (2006) “Family ownership <strong>and</strong> firm performance: Empiricalevidence from Western European corporations.” <strong>Journal</strong> <strong>of</strong> CorporateFinance 12: 321-341.Maury, B., Pajuste, A. (2005) “Multiple large shareholders <strong>and</strong> firm value.”<strong>Journal</strong> <strong>of</strong> Banking & Finance 29: 1813-1834.Mehmet Nihat Solakoğlu <strong>and</strong> Halil Zaim (2006) "Şirket Performansı veMülkiyet Yapısı." Istanbul Universitesi Dergisi, C:35: 63-72.
42Mehmet Nihat Solakoglu & Nazmi DemirMuller, A., Verschoor, W.F.C. (2005) “Foreign exchange risk exposure:Survey <strong>and</strong> suggestions.” <strong>Journal</strong> <strong>of</strong> Multinational <strong>Financial</strong>Management article in press.Solakoglu, M.N. (2005) “<strong>Exchange</strong> rate volatility <strong>and</strong> real exports: Asensitivity analysis.” <strong>Journal</strong> <strong>of</strong> Economic <strong>and</strong> Social Research Vol. 7:1-30.Solakoglu, M.N. (2005) “<strong>Exchange</strong> <strong>Rate</strong> Volatility <strong>and</strong> Real Exports: ASensitivity Analysis." <strong>Journal</strong> <strong>of</strong> Economic <strong>and</strong> Social Research 7: 1-30.Solakoglu, M.N., E. Okumuş (2007) “<strong>Exchange</strong> <strong>Rate</strong> Risk <strong>and</strong> InternationalTrade: Survey Results on Turkish Firms.” İstanbul Üniversitesi SosyalSiyaset Konferansları DergisiTai, Chu-Sheng (2005) “Asymmetric currency exposure <strong>of</strong> US bank stockreturns.” <strong>Journal</strong> <strong>of</strong> Multinational <strong>Financial</strong> Management 15: 455-472.


