Public Review JRM INRMP Appendices 092412-4
Public Review JRM INRMP Appendices 092412-4
Public Review JRM INRMP Appendices 092412-4

Create successful ePaper yourself
Turn your PDF publications into a flip-book with our unique Google optimized e-Paper software.
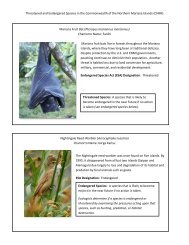
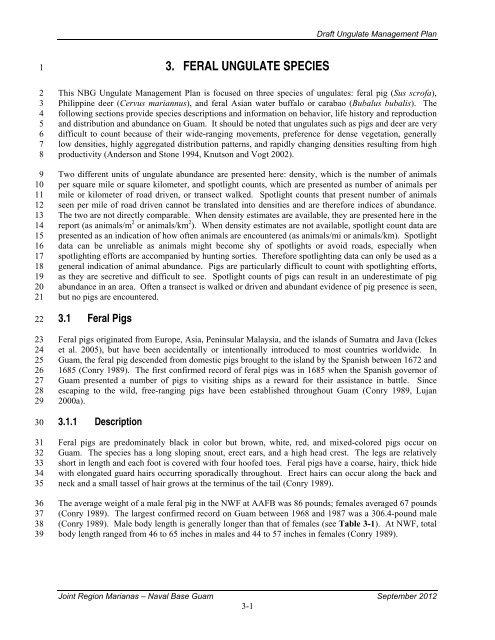
Draft Ungulate Management Plan1234567891011121314151617181920212223242526272829303132333435363738393. FERAL UNGULATE SPECIESThis NBG Ungulate Management Plan is focused on three species of ungulates: feral pig (Sus scrofa),Philippine deer (Cervus mariannus), and feral Asian water buffalo or carabao (Bubalus bubalis). Thefollowing sections provide species descriptions and information on behavior, life history and reproductionand distribution and abundance on Guam. It should be noted that ungulates such as pigs and deer are verydifficult to count because of their wide-ranging movements, preference for dense vegetation, generallylow densities, highly aggregated distribution patterns, and rapidly changing densities resulting from highproductivity (Anderson and Stone 1994, Knutson and Vogt 2002).Two different units of ungulate abundance are presented here: density, which is the number of animalsper square mile or square kilometer, and spotlight counts, which are presented as number of animals permile or kilometer of road driven, or transect walked. Spotlight counts that present number of animalsseen per mile of road driven cannot be translated into densities and are therefore indices of abundance.The two are not directly comparable. When density estimates are available, they are presented here in thereport (as animals/m 2 or animals/km 2 ). When density estimates are not available, spotlight count data arepresented as an indication of how often animals are encountered (as animals/mi or animals/km). Spotlightdata can be unreliable as animals might become shy of spotlights or avoid roads, especially whenspotlighting efforts are accompanied by hunting sorties. Therefore spotlighting data can only be used as ageneral indication of animal abundance. Pigs are particularly difficult to count with spotlighting efforts,as they are secretive and difficult to see. Spotlight counts of pigs can result in an underestimate of pigabundance in an area. Often a transect is walked or driven and abundant evidence of pig presence is seen,but no pigs are encountered.3.1 Feral PigsFeral pigs originated from Europe, Asia, Peninsular Malaysia, and the islands of Sumatra and Java (Ickeset al. 2005), but have been accidentally or intentionally introduced to most countries worldwide. InGuam, the feral pig descended from domestic pigs brought to the island by the Spanish between 1672 and1685 (Conry 1989). The first confirmed record of feral pigs was in 1685 when the Spanish governor ofGuam presented a number of pigs to visiting ships as a reward for their assistance in battle. Sinceescaping to the wild, free-ranging pigs have been established throughout Guam (Conry 1989, Lujan2000a).3.1.1 DescriptionFeral pigs are predominately black in color but brown, white, red, and mixed-colored pigs occur onGuam. The species has a long sloping snout, erect ears, and a high head crest. The legs are relativelyshort in length and each foot is covered with four hoofed toes. Feral pigs have a coarse, hairy, thick hidewith elongated guard hairs occurring sporadically throughout. Erect hairs can occur along the back andneck and a small tassel of hair grows at the terminus of the tail (Conry 1989).The average weight of a male feral pig in the NWF at AAFB was 86 pounds; females averaged 67 pounds(Conry 1989). The largest confirmed record on Guam between 1968 and 1987 was a 306.4-pound male(Conry 1989). Male body length is generally longer than that of females (see Table 3-1). At NWF, totalbody length ranged from 46 to 65 inches in males and 44 to 57 inches in females (Conry 1989).Joint Region Marianas – Naval Base Guam September 20123-1
Draft Ungulate Management Plan1Table 3-1. Average Weights and Measurements of Feral Pigs from Northwest Field, AAFBRelative Age and SexTotal weight(pounds)Total bodylength(feet)Shoulderheight(feet)Tusk length(inches)Adult Male (> 13 months) 86.2 4.6 2.0 0.9* / 1.3**Adult Female (> 13 months) 67.0 4.3 2.0 0.5* / 0.6**Juvenile Male (4–6 months) 17.0 2.6 1.3 0.1* / 0.2**Juvenile Female (4–6 months) 25.1 3.0 1.3 0.2* / 0.2**Source: Conry (1989)Notes: n = 62 pigs; * = upper tusk length; ** = lower tusk length234567891011121314151617181920212223242526272829303132All mature pigs have permanent, enlarged tusks or canine teeth in the upper and lower jaws. Frictionbetween these teeth creates sharp edges on the lower tusks that assist the animals with various behaviorssuch as feeding and fighting. The tusk of a male pig grows continually throughout its life due to an openapical foramen located at the tip of the root. When females reach around 2.5 years their apical foramencloses, causing the tusks to stop growing (Conry 1989). Table 3-1 provides the average weights andmeasurements of feral pigs from NWF, AAFB.3.1.2 BehaviorGroup size and organization of feral pigs depends on a variety of factors including age, sex, andenvironmental conditions such as resource availability and disturbances. In tropical areas, pigs havegenerally been seen in groups of 12 animals or less (Hone 1990). In the MSA at AAFB, group sizeaveraged 2.4 individuals; however, groups as large as 19 were observed (Conry 1989). Adult males olderthan 18 months are usually solitary and secretive (Conry 1989, McGaw and Mitchell 1998, Twigg et al.2005). Feral pigs have been reported to be most active in the early morning and late afternoon in tropicalclimates (Diong 1982); however, they are mostly nocturnal during warm, dry conditions (Wolf andConover 2003). Feral pigs create large mud wallows as a form of thermoregulation, to disinfect wounds,and to reduce ectoparasite loads (Fernández-Llario 2005). Wallow complexes can be quite large; onelarge complex of wallows on AAFB exceeded 5.7 acres (Conry 1989).The feral pig is omnivorous, consuming fruits, seeds, plant material, vertebrates (e.g., bird chicks andeggs, reptiles and reptile eggs, carcasses of larger animals) and invertebrates. They forage for food usingtheir noses to search the soil and expose fresh roots and shoots (Conry 1989). Their diet can includenative species including green sea turtle eggs, sea birds, endemic reptiles and macro-invertebrates (Baberand Coblentz 1987, GISD 2006). Earthworms are a major source of protein in their diet, and foraging forearthworms by rooting in the soil is a major cause of soil disturbance in areas with feral pigs (Hone 2002,Baubet et al. 2003). Plant material comprises a large part of the pigs diet. Fruit is also an importantcomponent, followed by leaves, grass, bark, and roots.The home ranges and movement patterns of feral pigs on Guam have not been studied. In most systems,male pigs have larger home ranges than females. At a density of 21 to 34 pigs/mi 2 , boars on SantaCatalina Island, California, had average home ranges of 494 acres while sows averaged 222 acres (Baberand Coblentz 1986). In South Carolina, the average home range of a male feral pig is 558 acres, while theaverage for females is 447 acres (Wolf and Conover 2003). These home ranges tended to decrease in sizeduring the dry season (Wolf and Conover 2003).Joint Region Marianas – Naval Base Guam September 20123-2
Draft Ungulate Management Plan12345678910111213141516171819202122232425262728293031323334353637383940413.1.3 Life History and ReproductionInformation on the life history and reproductive biology of feral pigs on Guam was obtained by collectingdata on captive pigs obtained from the wild. Sexual maturity, for both domestic and feral pigs, isregulated by weight rather than age (McGaw and Mitchell 1998). Captive pigs of both sexes on Guamhave been reported to reach sexual maturity between 6 and 7 months (Conry 1989). Successfulimpregnation by domestic male pigs occurs shortly after reaching maturity, at an average of 8.3 months.Female pigs can breed as early as 6 months, but successful breeding usually occurs around 10 months.Breeding is highly dependent on food availability and quality because pigs have enhanced energyrequirements during newborn and lactation periods. Approximately 15 percent of the diet of adultmothers must be crude protein to successfully feed their young (McGaw and Mitchell 1998).Feral pigs have more than one estrus cycle (lasting 21 days) in a breeding season (McGaw and Mitchell1998). The average gestation period of the domestic pig on Guam is 113.5 days (McGaw and Mitchell1998). The average lactation period on Guam is between 3 and 4 months. Breeding occurs throughoutthe year, but generally peaks at the beginning (between April and May) and end (December) of the wetseason.The average litter size reported for Guam is five (Conry 1989), which is typical for the species (Baber andCoblentz 1986). Feral sows in Hawaii and the mainland United States average between 0.9 and 1.1 littersper year (Baber and Coblentz 1986, Caley 1997). In the tropics, the potential multiplication rate for pigswith 100 breeding sows is 0.78 (McGaw and Mitchell 1998). Plant material is used to construct nests,which consist of a small mound of vegetation with a channel used to protect piglets during birth andthe nursing periods. Typical nests are 10 to 13 feet long, 6 to 10 feet wide, and range in height from 8 to12 inches (Conry 1989).3.1.4 Distribution and AbundanceFeral pig distribution is dependent on two factors: daily water requirements and dense foliage forprotection from extreme weather (Baber and Coblentz 1986, McGaw and Mitchell 1998). These twofactors occur in abundance on Guam, thereby supporting high pig density. Distribution trends are basedon reports from hunting and depredation (animal control) activities because feral pigs are generallynocturnal and difficult to observe. The highest pig densities are found in the secondary limestone forestsin the north and the ravine forests in the south (Lujan 2000a).Feral pigs were present in all habitats at NBG NMS and NBG TS in a 2009 study (USFWS 2009). Pigswere more abundant at NBG NMS. These results were consistent with observations of pig sign. NBGNMS had noticeably more pig sign (e.g., wallow, rooting, feces, and rubbing on trees) than NBG TS.Feral pigs have no natural predators and both legal hunting and poaching have had minimal effect on theoverall number of feral pigs. There is currently no legal pig hunting on Navy lands on Guam.NBG NMSIn 2009, the number of pigs in the NBG NMS were estimated using vehicle transects and foot transects.Vehicle surveys were conducted to determine the most active time of day (early morning or earlyevening) to survey for pigs. Six transects were driven in the morning and then repeated in the earlyevening to compare pig activity rates. The total length of transects was 20,900 meters. A car was drivenapproximately 10 to12 miles per hour (mph) with an observer in the back to record pigs seen on the roador just adjacent to the road (40-meter strip width) (USFWS 2009).Joint Region Marianas – Naval Base Guam September 20123-3
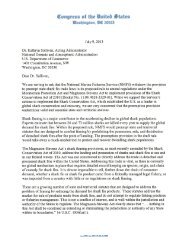
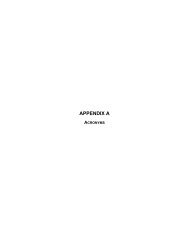
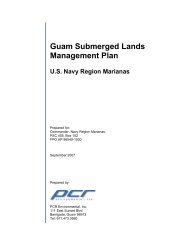
Draft Ungulate Management Plan12345678910111213141516171819202122232425262728293031323334353637383940Pigs were most active in the early morning. Fifteen pigs were observed in the morning for an absoluteabundance of 17.9 pigs/km². In the early evening, only five pigs were seen for an absolute abundance of5.9 pigs/km² (USFWS 2009).In the foot transects, two people started at a randomly selected point and walked in opposite directions250 meters perpendicular to the road for a total transect length of 500 meters, or shorter if terrain wasimpassable. The surveys were conducted in the morning starting at first light usually between 0530 and0600 and lasted approximately 2 to 3 hours. Transect mid-points were systematically positioned on theroads throughout NBG NMS (500 meters apart) using ArcGIS (see Figures 3-1 and 3-2). Two to fivetransects were randomly selected (Microsoft Excel 2003) to complete each morning. Two people startedat the randomly selected point and walked in opposite directions 250 meters perpendicular to the road fora total transect length of 500 meters or shorter if terrain was impassable. Each observer used a compassand either a GPS or hip chain to measure 250 meters. During each survey, all ungulates observed, theirperpendicular distance from transect line, and their sex were recorded. Surveys were conducted in May toJune at NBG NMS (USFWS 2009).Twenty-five transects were randomly selected for a total distance of 11,027 meters traversed over 6 days(see Table 3-2). Eight pigs and three unknown ungulates were observed. The majority of pigs wereobserved at a distance of 15 to 20 meters from the transect line. The farthest distance a pig was observedwas 40 meters; therefore, the strip width used to calculate area was determined to be 80 meters. Due toimpenetrable tall grass, four transects were completed by traversing the road. Strip width was reduced to40 meters for those four transects. Total area surveyed at NBG NMS was .802 km². The density of pigsat NBG NMS ranged from 9.9 pigs/km² to 13.7 pigs/km² (USFWS 2009). Based on the data the numberof pigs on NBG NMS was determined to be between 346 and 479.NBG TSFeral pigs are present in the Haputo ERA and elsewhere at NBG TS. Abundant sign of feral pig damagewas observed on the upper plateau area of NBG TS during recent vegetation surveys (Navy 2010). Pigtracks are routinely observed in the sand at Haputo Beach. Pig damage is prevalent throughout, but ismore intense in areas farther away from human activity (Navy 2010).The 2009 survey of pigs in NBG TS used the same methodology as described for NBG NMS to estimatepig density. These surveys were conducted July to August at NBG TS. Transect mid-points weresystematically positioned on the roads throughout NBG TS (250 meters apart) using ArcGIS (Figure 3-3)(USFWS 2009).Seventeen transects were randomly selected for a total distance of 8,061 meters traversed over 5 days ofsurveys at NBG TS (Table 3-2). No pigs were seen. Two unknown ungulates were heard but could notbe identified. No pigs were seen during surveys, but pig sign (e.g., wallows, rooting, feces, and rubbingon trees) was observed in many of the transects. The approximate distances of the unknown ungulateswas 20 meters from the transect line. Strip width used to calculate area was 40 meters. Total areasurveyed at NBG TS was .322 km². The density of pigs ranged from 0 to 6.2 pigs/km² or a total of 68pigs for the NBG TS property. While this may be an unreliable estimate of density, pig sign wasabundant indicating significant numbers of pigs use the area. The current estimate is most likely anunderestimate based on the observation of pig sign on all transects in the study (USFWS 2009).Joint Region Marianas – Naval Base Guam September 20123-4
Draft Ungulate Management Plan12Figure 3-1. Pig Survey Vehicle Routes on NBG NMSJoint Region Marianas – Naval Base Guam September 20123-5
Draft Ungulate Management Plan12Figure 3-2. Pig Survey Vehicle Routes and Survey Points on NBG NMSJoint Region Marianas – Naval Base Guam September 20123-6
Draft Ungulate Management Plan12Figure 3-3. Map of Pig Survey Points on NBG TSJoint Region Marianas – Naval Base Guam September 20123-7
Draft Ungulate Management Plan1Table 3-2. Randomly Selected Transects Surveyed for Pigs on NBG NMS and NBG TSNaval Munitions SiteRandomly SelectedTransectTransect Length(meters)Naval Communications Transmission StationRandomly SelectedTransectTransect Length(meters)19 500 49 5003 500 54 50018 500 51 50010 450 42 50029 400 65 3651 360 41 50028 365 47 50020 500 71 5005 500 56 50016 450 72 49132 130 45 5007 279 67 50040 481 73 31515 362 48 50021 550 52 5004 500 64 5002 374 69 39036 40013 50012-33 road 50022 50014 42634–35 road 50031–32 road 50032–33 road 500Total Transects: Total Length: Total Transects: Total Length:25 11,027 meters 17 8,061 metersSource: (USFWS 2009).234The estimated number of pigs on NBG TS in 2007 was 350 to 500 individuals (Brooke 2007).NBG MBThere currently is no pig survey data available for NBG MB.Joint Region Marianas – Naval Base Guam September 20123-8
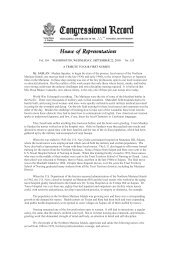
Draft Ungulate Management Plan1234567891011NBG TS Hunting DataNBG TS was open for hunting for pigs and deer between 1990 and 1997. During this time, a largenumber of hunting sorties were made on to the property and a fairly large number of pigs were taken.Figure 3-4 shows the total number of pigs taken each fiscal year at NBG TS for this time period. Datafrom 2 years, 1990 and 1997, are missing. It seems likely that number of pigs taken in 1997 was similarto 1994 to 1996. The time and effort expended for each pig taken varied over the years from 5 to 12hunter days per pig taken (see Figure 3-5). There appears to be a pattern of increasing time to take a pigfrom 1991 to 1993, followed by a rapid decrease in 1994 and a similar pattern of increase from 1994 to1996. It is not clear what might have occurred between 1993 and 1994 (if anything) to set the effortneeded back to lower levels. More data would be needed to determine if this pattern is biologicallysignificant.1213Figure 3-4. Pigs Taken at NBG TS by Hunters (Fiscal Year Totals)Joint Region Marianas – Naval Base Guam September 20123-9
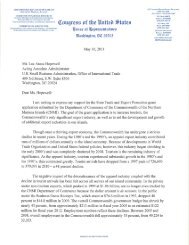
Draft Ungulate Management Plan1234567891011121314151617Figure 3-5. Hunter Effort (8-hour Days) Per Pig Taken at NBG TS (Totals for Fiscal Year)3.2 Philippine DeerThe nonnative Philippine deer was introduced to Guam from the Philippines. These animals werebrought to Guam during the term of Mariano Tobías, who served as the island’s Spanish governorbetween 1771 and 1774. The exact date of introduction is unknown, but it is likely that Tobías importedthe deer as a new meat source for the Chamorro people in 1771 (Wiles et al. 1999). The species wasoriginally described as Cervus unicolor and commonly referred to as Sambar deer (Wheeler 1979). Thelargest populations of Philippine deer in its native range are located on Luzon, Mindanao, Samar, andLeyte islands (IUCN/SSC Deer Specialist Group 1998, Wiles et al. 1999).3.2.1 DescriptionThe Philippine deer is a short, stocky forest-dwelling deer. Males are much larger than females. Geneticstudies by Meijaard and Groves (2004) found that the Philippine deer was morphologically similar toPhilippine spotted deer (C. alfredi). The mean length of a male is 55 inches and mean weight is 141pounds; however, males can reach over 210 pounds (Wiles et al. 1999). Females have a mean length of49.7 inches and mean weight of 89 pounds (Wiles et al. 1999). Mean weights and measurements of adultdeer on Guam are listed in Table 3-3.18Joint Region Marianas – Naval Base Guam September 20123-10
Draft Ungulate Management Plan12Table 3-3. Mean and Standard Deviation of Various Measuresof Adult Philippine Deer (Cervus mariannus) from GuamSexTotal weight(pounds)Total length(feet)Tail length(inches)Shoulderheight (feet)Hind footlength (inches)Ear(inches)MaleFemale141.1 ± 45.2(21)89.1 ± 17.9(21)4.6 ± 0.5(24)4.1± 2.6(24)Source: Wiles et al. (1999)Note: Number of animals sampled is provided in parentheses.4.5 ± 0.6(24)4.2 ±0.6(24)2.6 ± 0.3(25)2.3 ± 0.13(25)13.4 ± 1.0(23)11.4 ± 1.1(23)4.2 ± 0.2(25)4.0 ± 0.2(25)345678910111213141516171819202122232425262728293031The antlers of mature bucks are slender and generally three-tined; however antlers with four or five tineshave been reported (Wheeler 1979). The single, long brow tine is the first division of the antlers thatbranches from the main base and the upper tine features a rear-facing terminal fork. The total antlerlength of a three-tined deer ranges from 2.2 to 5.3 feet (Wheeler 1979, Wiles et al. 1999). Antlermorphology differs slightly between deer populations in Micronesia, suggesting some genetic variation.For example, the enlarged antlers found on Rota, Pohnpei, and Saipan have not been reported on Guam.However, genetic studies among the islands have not been conducted (Wiles et al. 1999). The antlers areshed and new antlers grow yearly. This replacement period varies from 16 to 19 weeks depending on theage of the deer and the number of antler tines. Philippine deer can shed their antlers at any time of theyear (Wheeler 1979).3.2.2 BehaviorPhilippine deer are known to be secretive but produce a range of barks, bleats, and wails that vary withage and sex (Wheeler 1979). Social organization is generally limited to small family groups of mixedage, but some adult-only groups have been documented (Wiles et al. 1999). No comprehensiveinvestigation of movements and specific habitat use has been conducted on Guam. However, movementpatterns and home-range size of tropical ungulate species are typically determined by seasonal changes inthe environment (McShea et al. 2001). Habitat selection is strongly influenced by energy and nutrientneeds particularly during gestation and lactation (Aung et al. 2001, McShea et al. 2001).The Philippine deer forages nocturnally, consuming fruits, shoots, leaves, stems, and bark ofapproximately 65 different plant species on Guam (Wiles et al. 1999). Their diet includes a variety ofwoody and herbaceous plants and grasses (Wheeler 1979), with a preference for native woody speciesover nonnative species (Department of the Navy 2006). In areas where the deer are present, a noticeablebrowse line 2 is evident, and forest regeneration is prevented through browsing of seedlings and saplings.The Philippine deer is known to consume the following on Guam: the fruit and seeds of dugdug(Artocarpus mariannensis); the frond stems, fruit, and bark of queen sago (Cycas circinalis); the foliageand fruit of lemondichina, corkystem passionfruit (Passiflora suberosa), thatch screwpine; the foliage ofChinese banyan (Ficus microcarpa), Pacific banyan, Psychotria mariana, Scaevola sericea, Scleria sp.,fire tree, and mission grass; and the bark of Pipturus argenteus, Ahgao, and vitex (Wiles et al. 1999). Inaddition, Wheeler (1979) reports that Premna integrifolia, mimosa (Leucaena glauca), coconut palm,2 A browse line is defined as the boundary between upper normal plant growth and lower stripped and eaten-backgrowth that indicates the height reached in feeding by large herbivores.Joint Region Marianas – Naval Base Guam September 20123-11
Draft Ungulate Management Plan123456789101112131415161718192021222324252627282930313233areca palm (Arecea catechu), giant miscanthus, Musa sp, Ipomoea sp, and grasses such as slim bristlesandbur (Cenchrus viridis) are part of the Philippine deer’s diet on Guam.3.2.3 Life History and ReproductionBased on records from 1966, Philippine deer do not typically live beyond 8 years (Wheeler 1979). Mostdeer species have a breeding season that is stimulated by seasonal environmental conditions, such aschanges in light intensity and temperature (Wiles et al. 1999). Deer in tropical regions do not have awell-defined breeding season because there is little seasonal variation in the tropics. On Guam, thePhilippine deer breed year-round, generally producing one fawn each time (Wheeler 1979). Pregnantdoes and fawns have been reported in every month and females can breed as early as 6 months of age(Wheeler 1979).3.2.4 Distribution and AbundancePhilippine deer are widely distributed throughout Guam, with the highest densities found on militaryinstallations. They are found mainly in limestone, ravine, and savanna habitats. Deer densities are highon military installations due to presence of large areas of suitable habitat and restricted access for huntingin some areas.Following introduction to Guam, deer numbers increased rapidly. By 1819, annual harvests wereestimated at 1,000 without any significant impact on the total number of deer (Wiles et al. 1999). By themid 1880s, numbers declined due to a lack of compliance and enforcement of hunting laws. DuringWorld War II, the island was occupied by the Japanese, during which time numbers again increased.Deer were most common on Guam’s military bases in the 1950s to 1970s since numbers were moreheavily controlled elsewhere due to intense hunting pressure (Wiles et al. 1999). The number of deerincreased rapidly on Guam after World War II. One reason might be that the initial deer hunting lawswere established to reflect laws in the mainland United States, where deer breed only seasonally.However, because of the tropical climate, deer on Guam are not restricted to a single breeding season. Asa result, Guam hunting laws were too strict and the number of deer increased. Guam Division of Aquaticand Wildlife Resources (GDAWR) has adjusted their hunting regulations in recent years in an attempt torectify this error.Based on spotlight counts conducted by the GDAWR since 1963, the distribution and abundance of thedeer varies depending on hunting and forest clearing (Figure 3-6) Wiles et al. 1999). Deer numbers arehighest in areas with high military security that deters illegal hunting. AAFB and NBG TS (combinedarea of 27.6 mi 2 ) on the northern plateau support the largest deer numbers on the island (Wiles et al.1999). Deer abundance can also be affected by weather patterns (such as droughts), which affect theavailability of food and water.Joint Region Marianas – Naval Base Guam September 20123-12
Draft Ungulate Management Plan1234567891011121314151617181920212223Source: Wiles et al. 1999Note: Data indicate number of deer seen per km of road driven, and are not density estimates, but rather an index of abundance.Figure 3-6. Philippine Deer Sightings During Spotlight Counts at Pati Point AAFB (Dashed Line)and NBG NMS (Solid Line), Guam, Between 1963 and 1996NBG NMSPhilippine deer inhabit limestone, ravine, and savanna plant communities in the NBG NMS. The NBGNMS historically supported lower spotlight counts of deer than the northern part of Guam (Figure 3-6),probably due to rough terrain and heavy poaching (Wiles et al. 1999). Hunting has never been permittedon NBG NMS, but there has been considerable illegal hunting activity. However, deer numbers on theNBG NMS have been steadily increasing. Walker et al. (1996) reported a four-fold increase in pellet andtrack counts between 1989 and 1996. Deer numbers during spotlight surveys increased from 0.97deer/mile between 1980 and 1988 to 4.83 deer/mile between 1993 and 1996 (Wiles et al. 1999). SeeFigure 3-6. Spotlight surveys on NBG NMS in 1998 and 1999 reported an average of 4.6 deer/mile(incorrectly reported as 41 deer/mile in COMNAV Marianas 2001, Navy 2010). See Figure 3-7.Dietary analysis of deer fecal samples showed that nutritional levels were significantly higher on theNBG NMS compared to northern Guam in the 1980s, indicating that deer in the NBG NMS have accessto high-quality forage (Conry 1986). Availability of free-standing water has also likely contributed toincreasing numbers and the good condition of deer on NBG NMS. It is most likely reduced huntingpressure at NBG NMS over the past two decades that has allowed the deer numbers to increase.Deer density at NBG NMS had not been estimated until 2009. Transect surveys conducted on the NBGNMS during 2009 estimated that deer density in the ravine forest area of the main bunker wasapproximately 15.319 deer/km 2 (USFWS 2009). See Figure 3-8 and Table 3-4.Joint Region Marianas – Naval Base Guam September 20123-13
Draft Ungulate Management Plan87NOA sightings of Deer/km 1979-20006Deer/km543211234567891011121314151617181920019801985 1990 1995 2000Source: GDAWR Annual ReportsFigure 3-7. Philippine Deer Sightings During Spotlight Countson NBG NMS Guam Between 1979 and 2000In the 2009 survey, densities of Philippine deer were estimated by distance sampling. To provide enoughdetections of deer, two surveys were conducted (each survey included all routes) at each site. Eachsurvey was conducted over 2 to 3 nights. At NGB NMS the first survey was conducted at the end ofMarch into early April and the second survey was conducted in May. This survey was conducted at NGBTS in June. All surveys were conducted in the dry season (USFWS 2009). A total of 108 deer weredetected in 73 groups over 41.868 km driven. Deer were seen at an average distance of 74 meters(USFWS 2009).NBG TSSpotlight deer counts were initiated at NBG TS in 1999 (GDAWR 2000). Spotlight count data for NBGTS in 1999 reported sightings of 10 deer/mile (6.2 deer/km) of road driven. Spotlight counts in 2000were similar with 10.6 deer/mile (6.6 deer/km) observed (GDAWR 2000). Spotlight data from 2004show an increase in deer, with an average of approximately 16 deer/mile (9.98 deer/km) of road driven.Figure 3-9 shows the NBG TS deer spotlighting data for the period of 1998 to 2004.Hunting was conducted at NBG TS from 1990 to 1997. Hunting records indicate that relatively few deerwere killed (see Figure 3-10), and that the effort per take was quite high for deer (40.5 hunter days perdeer taken, on average). See Figure 3-11. Hunters had more success with pigs on NBG TS.21Joint Region Marianas – Naval Base Guam September 20123-14
Draft Ungulate Management Plan12Figure 3-8. Location of Distance Sampling Routes Throughout NBG NMS in 2009Joint Region Marianas – Naval Base Guam September 20123-15
Draft Ungulate Management Plan12Table 3-4. Estimated Densities of Philippine Deer Calculatedfrom Distance Routes Using Distance SamplingSiteNaval Munitions Site(three lines)Naval CommunicationsTransmission SiteModelFittedAICESWDensity (deer/km²)(95% CI)CVUniform 606.15 105.08 15.319 (2.628–89.131) 0.479Uniform 633.49 145.15 16.775 (11.063–25.437) 0.188Source: USFWS 2009Notes: AIC, Akaike’s Information Criterion; ESW, effective strip width; CI, confidence interval; CV, coefficient ofvariation345Source: DAWR annual reports 1999, 2000, 2001, and 2004.Figure 3-9. Deer Observed Per Km of Road Driven During Spotlight Counts at NBG TSJoint Region Marianas – Naval Base Guam September 20123-16
Draft Ungulate Management Plan12Figure 3-10. Deer Taken at NBG TS by Hunters (Totals for Fiscal Year)34Figure 4. Days Effort for Take of One Deer at NBG TSJoint Region Marianas – Naval Base Guam September 20123-17
Draft Ungulate Management Plan1234567891011121314151617181920212223242526272829303132333435363738Strip transect sampling efforts conducted in 2009 on NBG TS estimated deer density to be 43.5 deer/mi²(16.8 deer/km 2 ). The confidence interval was 95%. Based on the density data, it was estimated thatapproximately 183 deer were on the property (USFWS 2009).The methods of this survey are described in the NBG NMS discussion. Over 16.7 km driven, 109 deerwere detected in 62 groups. Deer were seen at an average distance of 114.15 meters (USFWS 2009). SeeFigure 3-12 and Table 3-4.Abundant sign of Philippine deer was observed on the upper plateau area of NBG TS during recentvegetation surveys (Navy 2010). Evidence of deer browse was particularly noteworthy in the northernportion adjacent to AAFB, resulting in a very open understory (Navy 2010).NBG MBThere currently is no Philippine deer survey data available for NBG MB. Philippine deer are not reportedto occur on NBG MB.Distribution on Other Areas of GuamThere are no detailed deer counts for the remainder of Guam; however, illegal hunting reports suggestthat deer are common in the Nimitz Hill-Mount Tenjo area in central Guam and Bubulao in southernGuam (Wiles et al. 1999). Several areas do not support deer including highly developed urban areas,Orote Peninsula, and small tracts of forest along the eastern coast that grow on extremely ruggedlimestone karst (Wiles et al. 1999).Hunting is the largest source of mortality, either through regulated hunting seasons or poaching.Parasitism by the tropical cattle tick (Boophilus microplus) causes open sores and hair loss, which in turncan lead to direct morality or increased dog predation (Wheeler 1979). Drought and predation by feraldogs also cause mortality, but the exact impact is not known. Feral dogs are common on NBG NMS andare known to actively take deer. Four deer were killed in 2009 by feral dogs in the Fena Reservoir area(A. Brooke, NAVFACMAR, personal communication).3.3 CarabaoCarabao is native to southern Asia. Wild carabao (animals without domesticated ancestors) havesignificantly declined due to loss of habitat, overhunting, and mixing with feral animals of domesticstock. Domestic carabao were introduced to Guam from the Philippines in the 1600s as a valuable workanimal (Wiles 1990). Prior to World War II, approximately 2,000 carabao inhabited Guam (GDAWR2000). During the Japanese occupation, these animals were set free and established feral herds in theinterior region of south-central Guam. Indirect evidence from carabao tracts and dung suggest that theseanimals prefer degraded ravine forest and savanna habitats over undisturbed ravine forest (Lujan 2000b).3.3.1 DescriptionThe carabao physically resembles large domestic cattle, with adults weighing between 1,500 to 1,800pounds. They are covered by long gray or black hair and have a tuft of hair on their forehead and at theterminus of their tail. Both sexes have massive horns (GDAWR 1994). The age of carabao is determinedby the size of horns and bodies. Animals younger than one year of age are referred to as calves, whilethose older than 4 years are considered adults (Vogt 2004).Joint Region Marianas – Naval Base Guam September 20123-18
Draft Ungulate Management Plan12Figure 3-12. Location of Distance Sampling Routes in NBG TS in 2009Joint Region Marianas – Naval Base Guam September 20123-19
Draft Ungulate Management Plan1234567891011121314151617181920212223242526272829303132333435363738394041423.3.2 BehaviorCarabao are herbivores that feed mostly during cooler temperatures in the morning and evenings.Carabao regulate their body temperature by lying in water holes or mud wallows because they have veryfew sweat glands (Prusty 1973); this behavior also helps protect them from unwanted insects (SanAgustin 1973). When startled, carabao will occasionally make snorting sounds (GDAWR 1994).On Guam, carabao congregate in herds of about 10 to 30 individuals. Herds generally consist of cows,calves, sub-adult animals of both sexes, and one dominant bull that will drive other adult males from thearea. Old or less-dominant males tend to be more solitary but will form herds of 3 to 5 individuals. InAustralia, herd size is irregular, with groups containing both sexes and mixed ages (McKnight 1971).3.3.3 Life History and ReproductionOn Guam, carabao are reported to live to 18 years of age. Carabao display distinct seasonal variation intheir reproductive pattern, with peaks in the late wet season and reduced pregnancies during the summer(Singh et al. 2000). Females are considered sexually mature at 2 years of age, can breed year round, andtypically give birth to one calf annually (GDAWR 1994). The species has been described as poorbreeders due to slow growth rates, depressed estrus expression, delayed puberty, prolonged calvingintervals, and seasonal reproductive patterns (Ghanem 1955, Tulloch 1979). The age at first estrus variesdepending on the level of nutrition and body condition (Takkar et al. 1979). Carabao are seasonallypolyestrous and have an average cycle length of 21 days (Drost 2007, Haldar 2007). The averagegestation period is between 229 and 346 days (Tulloh and Holmes 1992).Carabao are not generally restricted by predators. They have a high incidence of pleuro-pneumonia andtuberculosis, but this is not a major source of mortality. The main sources of mortality in most areas arehunting, forage limitation, and becoming stuck in wallows (McKnight 1971).3.3.4 Distribution and AbundanceThere are at least three groups of feral carabao on Guam, the largest on NBG NMS and surrounding areas.NBG NMSSpotlight counts of carabao were conducted on NBG NMS by GDAWR between 1966 and 2000 (Lujan2000b). There are no records of GDAWR spotlight counts after this period. Navy biologists beganconducting daylight counts of carabao on NBG NMS after GDAWR counts were discontinued, and theseare conducted on a yearly basis. Between 1966 and 1978, the average number of carabao sited duringsurveys on NBG NMS was 0.97 to 1.28 carabao/mi driven (Lujan 2000b). Carabao numbers continued toincrease and peaked by 1996, reaching an average of 4.5 carabao/mi road traveled (between 200 and 300carabao) (Lujan and Wiles 1997). By 1998/1999 numbers declined to 3.7 carabao/mile road traveled butincreased to 4.3 carabao/mile in 2000 (Lujan 2000b). The number of carabao on NBG NMS wasestimated at approximately 300 animals as of 2001 (COMNAV Marianas 2001). As of 2011, the numberof carabao was estimated to be 100 individuals (Paul Wenninger, Naval Base Guam, PersonalCommunication). This gives a rough estimate of density of carabao on NBG NMS of 11.1 carabao/mi 2 .Density might be higher, since this estimate assumes that carabao are evenly distributed over the entire13.5 mi 2 area of NBG NMS.Early morning roadside sightings of carabao, dung, and tracks along Route 17 near NBG NMS in 1998prompted an investigation into the movements of these animals in the area. The herds accessed Route 17via various firebreaks on NBG NMS. Residents and farmers in the area reported that these movementsonly occurred during the dry season. Investigations in 2000 recorded between one and five carabao alongJoint Region Marianas – Naval Base Guam September 20123-20
Draft Ungulate Management Plan12345678Route 17 during the months of February, March, April, July, and November (Lujan 2000b).Demographic surveys were conducted on the NBG NMS in 2003. The number of breeding age femaleshad increased, but the number of calves decreased (Vogt 2004) (Figure 3-13). This downward trend inthe number of calves was caused by the fertility-control program conducted at the time. The number ofyearlings remained the same due to a carabao giveaway program conducted in 2002. The NBG NMSherd was skewed towards young carabao and every year more animals entered the breeding female cohort(females older than 2 years; Table 3-5). The solitary behavior of adult males makes them more difficultto survey and might explain why estimated numbers of males is low.90Number of carabao observed8070605040302010malesfemalessubadultsyearlingscalvestotal animals9101112131402000 2001 2002 2003YearSource: Vogt 2004Note: These numbers do not represent total number estimates; rather they are the number of carabao spotted during surveyefforts, and are thus a subsection of the total number.Figure 3-13. Carabao Observed During Survey Effortson the Naval Magazine Between 2000 and 20031516Table 3-5. Number of Carabao Observed on the Naval MunitionsSite During Surveys Conducted in 2003Adultfemale(> 4year)Adultmales(> 4year)Subadult(2–4year)Yearling(1–2 year)Calves(< 1year)TotalBreedingfemales(> 2 year)% breedingfemaleswith calfAverage 36 9 19 16 5 85 46 12% pop 42 11 22 19 6 -- 54 --Source: NBGMS carabao demographic study (Vogt 2004).Key: Ave. = average number observed per survey, % of the total number = percent of the total number made up of that particularsex-age group.Joint Region Marianas – Naval Base Guam September 20123-21
Draft Ungulate Management Plan1THIS PAGE INTENTIONALLY LEFT BLANKJoint Region Marianas – Naval Base Guam September 20123-22