26 Molecular Absorption Spectrometry
26 Molecular Absorption Spectrometry
26 Molecular Absorption Spectrometry

You also want an ePaper? Increase the reach of your titles
YUMPU automatically turns print PDFs into web optimized ePapers that Google loves.
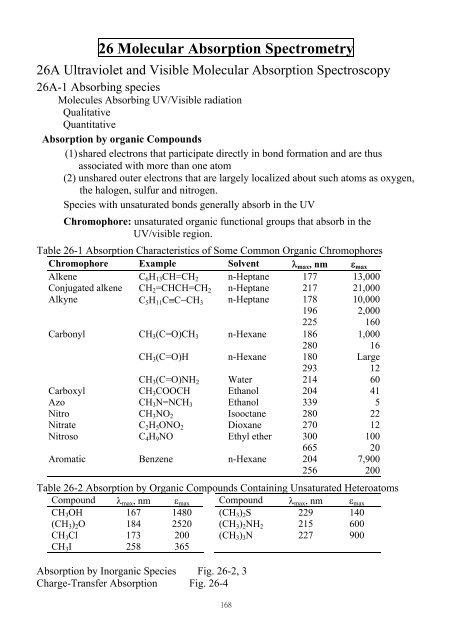
Fig. <strong>26</strong>-1 <strong>Absorption</strong> spectrafor typical organic compounds.Fig. <strong>26</strong>-2 <strong>Absorption</strong> spectra ofaqueous solutions of severaltransition metal ions.Fig. <strong>26</strong>-3 <strong>Absorption</strong> spectraof aqueous solutions ofrare earth ions.Fig. <strong>26</strong>-4 <strong>Absorption</strong> spectra of aqueous charge-transfer complexes.Quantitative: UV/visible spectrophotometryQualitative: infrared spectrophotometry<strong>26</strong>A-2 Qualitative Applications of UV/Visible SpectroscopyTable <strong>26</strong>-1Solvents (Fig. 24-14, Table <strong>26</strong>-3)The Effect of Slit Width (Fig. <strong>26</strong>-5)The Effect of Scattered Radiation at the Wavelength Extremes of aSpectrophotometer (Fig. <strong>26</strong>-6)Table <strong>26</strong>-3 Solvents for the ultraviolet and visible regionsSolventLower wavelengthLower wavelengthLower wavelengthSolventSolventlimit, nmlimit, nmlimit, nmWater 180 Cyclohexane 200 Acetone 330Ethanol 220 Cellosolve 320 Dioxane 320Hexane 200 Diethyl ether 210 CCl 4 <strong>26</strong>0Fig. <strong>26</strong>-5 Spectra for reduced cytochrome c obtained with four spectral bandwidths: (1) 20 nm,(2) 10 nm, (3) 5 nm, and (4) 1 nm. At bandwidths < 1 nm, peak noise became pronounced.169
Fig. <strong>26</strong>-6 Spectra of cerium(IV) obtained with a spectrophotometer having glass optics (A) andquartz optics (B). The false peak in A occurs when stray radiation is transmitted at longwavelengths.<strong>26</strong>A-3 QuantitativeApplications1. Wide applicability.2. High sensitivity3. Moderate to high selectivity4. Good accuracy5. Easy and convenienceFig. <strong>26</strong>-5 Fig. <strong>26</strong>-6Direct measurementNitrate in nature water: NO - 3 : 220 nm1. Absorbance at 220 nm2. Absorbance at 270 nm (correct for the interference)Indirect measurement12 MoO 2- 4 + H 2 PO - 4 + 24 H + ⇔ [H 2 PMo 12 O 40 ] - + 12 H 2 O12-molybdophosphoric acid, 12-MPA (yellow)↓ ascorbic acid or stannous chloridemolybdenum blue (650~890 nm strong absorbance)Application to Absorbing Speciescommon organic chromophore (Tab. <strong>26</strong>-1)inorganic species: ions of transition metals and their complexes (color), nitrite, nitrate,chromate ion, oxides of nitrogen, element halogens and ozone.Applications to Nonabsorbing Speciesreact with chromophoric reagents → products that absorb strongly in the UV andvisible regionsInorganic reagent Analyte Organic chelating agent Analytethiocyanate Fe, Co, Mo diethyldithiocarbamate Cuanion of H 2 O 2 e Ti, V, Cr diphenylthiocarbazone Pbiodide Bi, Pd, Te 1,10-phenanthroline FeCe(IV) low-molecular-weight aliphatic alcohol dimethylglyoxime NiFig. <strong>26</strong>-7 Typical chelating reagents for absorption. (a) Diethyldithiocarbamate. (b)Diphenylthiocarbazone.170
Procedural Detailsdevelopment of conditions that yield a reproducible relationship (preferably linear)between absorbance and analyte concentration.1. Wavelength Selectionmade a wavelength corresponding to an absorption peak → maximum sensitivity2. Variables That Influence Absorbancesolvent, pH of the solution, temperature, high electrolyte concentrations andpresence of interfering substances.3. Determination of the Relationship Between Absorbance and ConcentrationCalibration standardsThe measured absorbance of a given solution will usually vary somewhat frominstrument to instrument. Thus, determination should never be based on molarabsorptivities found in the literature.4. The Standard Addition Methodstandard addition:a known amount of analyte + a second aliquot sample →the difference in Abs. → calculate the analyte conc. of the sampleA2m =bε b Vxc=VkcskV cxxtx→ε b Vsc+Vtscx= ,mVxsbc= kV c + kVss⎛ S⎜⎝ ccx⎞⎟⎠2xcx⎛= ⎜⎝SmmPlot of A s as a function of V s →A s = mV s + b , m = k , b = k V x c x2⎞⎟⎠2⎛ Sb⎞+ ⎜ ⎟⎝ b ⎠→sc= cx⎛⎜⎝Smm2⎞⎟⎠2⎛ Sb⎞+ ⎜ ⎟⎝ b ⎠Ex. <strong>26</strong>-1 10-mL aliquots of a natural water sample were pipetted into 50.00-mL volumetricflasks. Exactly 0.00, 5.00, 10.00, 15.00 and 20.00 mL of a standard solution containing11.1 ppm of Fe 3+ were added to each, followed by an excess of thiocyanate ion to give thered complex Fe(SCN) 2+ . After dilution to volume, absorbances for the five solutions,measured with a photometer equipped with a green filter, were found to be 0.240, 0.437,0.621, 0.809 and 1.009, respectively (.0982-cm cells). (a) What was the [Fe 3+ ] in the watersample? (b) Calculate the standard deviation of the slope, the intercept and the [Fe].(a) c s =11.1 ppm, V s = 10.00 mL, V t = 50.00 mLm = 0.03820, b = 0.2412A s = 0.03820 V s + 0.2412cxbcs=mVx(0.2412)(11.1ppmFe3 +)3== 7.01ppmFe(0.03820/mL)(100mL)(b) s m = 3.07× 10 -4 and s b = 3.76 × 10 -3+sc= cx⎛⎜⎝Smm2⎞⎟⎠⎛+ ⎜⎝Sbb2⎞⎟⎠=−42−32⎛ 3.07 × 10 ⎞ ⎛ 3.76 × 10 ⎞3+7.01⎜ ⎟ + ⎜ ⎟ = 0.12 ppmFe Fig. <strong>26</strong>-8 Determination of Fe 3+⎝0.03820⎠⎝0.2412⎠171as the Fe(SCN) 2+ complex.
Ex. <strong>26</strong>-2 The single-point standard addition method was used in the determination ofphosphate by the molybdenum blue method. A 2.00-mL urine sample was treated withmolybdenum blue reagents to produce a species absorbing at 820 nm, after which thesample was diluted to 100.00 mL. A 25.00-mL aliquot gave an absorbance of 0.428(solution 1). Addition of 1.00 mL of a solution containing 0.0500 mg of phosphate to asecond 25.0-mL aliquot gave an absorbance of 0.517. Use these data to calculate thenumber of milligrams of phosphate per milliliter of the sample.A 1 = εbc xc xA2ε b Vxc=Vtxε b Vsc+Vtsε b(Vxcx+ Vscs)=VA11csV−s 0.428×0.0500mgmL × 1.00mL−1=== 0.00780mgmLA2Vt− A1Vx0.517 × <strong>26</strong>.00mL − 0.428×25.00mLconc. of phosphate = 0.00780 mgmL -1 ×100/2.00 = 0.390 mg/mL6. Analysis of Mixture (Fig. <strong>26</strong>-9)Atotal = A 1 + A 2 + · · · + A n = ε 1 bc 1 + ε 2 bc 2 + · · · +ε n bc ntA 1 = ε M1 bc M + ε N1 bc NA 2 = ε M2 bc M + ε N2 bc NFig. <strong>26</strong>-9 <strong>Absorption</strong> spectrum of a two-component mixture(M+N), with spectra of the individual components.Wavelengths λ 1 and λ 2 are chosen for the analysis because theindividual component spectra are significantly different atthese two wavelength.Ex. <strong>26</strong>-3 Palladium (II) and gold (III) can be analyzed simultaneously through reaction withmethiomeprazine (C 19 H 24 N 2 S 2 ). The absorption maximum for the Pd complex occurs at480 nm, while that for the Au complex is at 635 nm. Molar absorptivity data at thesewavelengths areMolar Absorptivity, ε480 nm 635 nmPd complex 3.55 × 10 3 5.64 × 10 2Au complex 2.96 × 10 3 1.45 × 10 4A 25.0-mL sample was treated with an excess of methiomeprazine and subsequently diluted to50.0 mL. Calculate the molar concentrations of Pd(II), C Pd , and Au(III), C Au , in the sample ifthe diluted solution had an absorbance of 0.533 at 480 nm and 0.590 at 635 nm when measuredin a 1.00-cm cell.At 480 nm: 0.533 = (3.55 × 10 3 )(1.00) × C Pd + (2.96 × 10 3 )(1.00) × C Au30.533 − 2.96 × 10 × CCAuPd =33.55×10At 635 nm: 0.590 = (5.64 × 10 2 )(1.00) × C Pd + (1.45 × 10 4 )(1.00) × C Au172
32 (0.533 − 2.96 × 10 ) × C40.590 = 5.64 × 10 ×Au + 1.45×10 × C3Au3.55 × 1024= 0.0847 − 4.70 × 10 × CAu+ 1.45×10 × CAu(0.590 − 0.0847)−5CAu== 3.60 × 10 M41.403×103−52.96 × 10 × 3.60 × 10−4CPd= 0.53 −= 1.20 × 10 M33.55 × 10Au(III) = 7.20 × 10 5 and Pd(II) = 2.40 × 10 -4 M<strong>26</strong>A-4 Photometric and Spectrophotometric Titrationsone or more of the reactants or products absorb radiation or that an absorbingindicator be present.Titration Curvesplot of absorbance (correct for volumechange) as a function of titrant volume:consists of two straight-line regions withdifferent slopes→ 終 點 : intersection of extrapolated linearportions of the two linesFig. <strong>26</strong>-12 Typical photometric titrationcurves. Molar absorptivities of the analytetitrated, the product and the titrant are ε A , ε Pand ε T , respectively.(Fig. <strong>26</strong>-12) Analyte Titrant Product(a) nonabsorbing (ε = 0) absorbing (ε > 0) (ε = 0)thiosulfatetriiodide(b) colorless (ε = 0)iodide(ε = 0)iodate ionAbsorbing (ε > 0)triiodideApplication of Photometric Titrationsmore accurate than a direct photometric determinationpresence of other absorbing species may not interferemore dilute solution may be titratedphotometric end point →applied to all types of reactionex: successive titration of Bi(III) and Cu(II). At 745nm, cations, reagent and the Bi complex no absorb,but the Cu complex → absorbance ↑additionalreagent cause no further abs. change→ two well-defined end points.Fig. <strong>26</strong>-13 Photometric titration curve at 745 nm for 100 mL of a solution that was 2.0 × 10 -3M in Bi 3+ and Cu 2+173