Structure and Finances of U.S. Farms: Family Farm Report ... - AgWeb
Structure and Finances of U.S. Farms: Family Farm Report ... - AgWeb
Structure and Finances of U.S. Farms: Family Farm Report ... - AgWeb

You also want an ePaper? Increase the reach of your titles
YUMPU automatically turns print PDFs into web optimized ePapers that Google loves.
United StatesDepartment <strong>of</strong>AgricultureEconomicResearchServiceEconomicInformationBulletinNumber 66July 2010<strong>Structure</strong> <strong>and</strong> <strong>Finances</strong><strong>of</strong> U.S. <strong><strong>Farm</strong>s</strong><strong>Family</strong> <strong>Farm</strong> <strong>Report</strong>, 2010 EditionRobert A. Hoppe <strong>and</strong> David E. Banker
Visit Our Website To Learn More!www.ers.usda.govwww.ers.usda.gov/briefing/farmstructureFor paper copies <strong>of</strong> this report, call the ERS order desk at 1-800-363-2068.Recommended citation format for this publication:Hoppe, Robert A., <strong>and</strong> David E. Banker. <strong>Structure</strong> <strong>and</strong> <strong>Finances</strong> <strong>of</strong> U.S.<strong><strong>Farm</strong>s</strong>: <strong>Family</strong> <strong>Farm</strong> <strong>Report</strong>, 2010 Edition, EIB-66, U.S. Dept. <strong>of</strong> Agr.,Econ. Res. Serv. July 2010.Cover photo credit: Natural Resources Conservation Service, USDA.The U.S. Department <strong>of</strong> Agriculture (USDA) prohibits discrimination in all itsprograms <strong>and</strong> activities on the basis <strong>of</strong> race, color, national origin, age,disability, <strong>and</strong>, where applicable, sex, marital status, familial status, parentalstatus, religion, sexual orientation, genetic information, political beliefs, reprisal,or because all or a part <strong>of</strong> an individual’s income is derived from any publicassistance program. (Not all prohibited bases apply to all programs.) Personswith disabilities who require alternative means for communication <strong>of</strong> programinformation (Braille, large print, audiotape, etc.) should contact USDA’sTARGET Center at (202) 720-2600 (voice <strong>and</strong> TDD).To file a complaint <strong>of</strong> discrimination write to USDA, Director, Office <strong>of</strong> CivilRights, 1400 Independence Avenue, S.W., Washington, D.C. 20250-9410 orcall (800) 795-3272 (voice) or (202) 720-6382 (TDD). USDA is an equalopportunity provider <strong>and</strong> employer.
United StatesDepartment<strong>of</strong> AgricultureA <strong>Report</strong> from the Economic Research Servicewww.ers.usda.govEconomicInformationBulletinNumber 66July 2010<strong>Structure</strong> <strong>and</strong> <strong>Finances</strong> <strong>of</strong>U.S. <strong><strong>Farm</strong>s</strong><strong>Family</strong> <strong>Farm</strong> <strong>Report</strong>, 2010 EditionRobert A. Hoppe, rhoppe@ers.usda.govDavid E. Banker, dbanker@ers.usda.govAbstractMost U.S. farms—98 percent in 2007—are family operations, <strong>and</strong> even the largest farmsare predominantly family run. Large-scale family farms <strong>and</strong> nonfamily farms accountfor 12 percent <strong>of</strong> U.S farms but 84 percent <strong>of</strong> the value <strong>of</strong> production. In contrast, smallfamily farms make up most <strong>of</strong> the U.S. farm count but produce a modest share <strong>of</strong> farmoutput. Small farms are less pr<strong>of</strong>itable than large-scale farms, on average, <strong>and</strong> their operatorhouseholds tend to rely on <strong>of</strong>f-farm income for their livelihood. Generally speaking,farm operator households cannot be characterized as low-income when both farm <strong>and</strong> <strong>of</strong>ffarmincome are considered. Nevertheless, limited-resource farms still exist <strong>and</strong> accountfor 3 to 12 percent <strong>of</strong> family farms, depending on how “limited-resource” is defined.Keywords: Contracting, family farms, farm businesses, farm financial performance,farm-operator household income, farm operators, farm structure, farm type, Governmentpayments, limited-resource farms, metropolitan farming, million-dollar farms, smallfarms, tenure.AcknowledgmentsThe authors thank Kevin Barnes <strong>of</strong> the U.S. Department <strong>of</strong> Agriculture (USDA),National Agricultural Statistics Service, Jeffrey Gillespie <strong>of</strong> Louisiana State University,Ani Katchova <strong>of</strong> the University <strong>of</strong> Kentucky, <strong>and</strong> William D. McBride <strong>of</strong> USDA,Economic Research Service (ERS) for their reviews <strong>and</strong> helpful comments. We alsoreceived excellent editing <strong>and</strong> useful comments from John Weber <strong>of</strong> the ERS InformationService Division. Finally, we thank Susan DeGeorge for the design <strong>and</strong> layout <strong>of</strong> thereport.See the companion brochure, America’s Diverse <strong>Family</strong> <strong><strong>Farm</strong>s</strong>, 2010 Edition (EIB-67).
ContentsSummary. . . . . . . . . . . . . . . . . . . . . . . . . . . . . . . . . . . . . . . . . . . . . . . . . . . ivIntroduction . . . . . . . . . . . . . . . . . . . . . . . . . . . . . . . . . . . . . . . . . . . . . . . . . 1U.S. <strong><strong>Farm</strong>s</strong>: Numbers, Size, <strong>and</strong> Other Characteristics. . . . . . . . . . . . . . 4Share <strong>of</strong> <strong><strong>Farm</strong>s</strong>, Production, <strong>and</strong> Assets . . . . . . . . . . . . . . . . . . . . . . . . . . 6<strong>Farm</strong> Size . . . . . . . . . . . . . . . . . . . . . . . . . . . . . . . . . . . . . . . . . . . . . . . . . 6Specialization . . . . . . . . . . . . . . . . . . . . . . . . . . . . . . . . . . . . . . . . . . . . . 12Tenure <strong>and</strong> L<strong>and</strong> Leasing . . . . . . . . . . . . . . . . . . . . . . . . . . . . . . . . . . . . 13Location <strong>of</strong> U.S. <strong><strong>Farm</strong>s</strong> <strong>and</strong> Production . . . . . . . . . . . . . . . . . . . . . . . . . 15Production by Region . . . . . . . . . . . . . . . . . . . . . . . . . . . . . . . . . . . . . . . 15Metropolitan <strong>Farm</strong>ing . . . . . . . . . . . . . . . . . . . . . . . . . . . . . . . . . . . . . . . 15<strong>Farm</strong> Operators, Principal <strong>and</strong> Secondary . . . . . . . . . . . . . . . . . . . . . . . 21Secondary Operators <strong>and</strong> Their <strong><strong>Farm</strong>s</strong> . . . . . . . . . . . . . . . . . . . . . . . . . . 21Aging Principal Operators . . . . . . . . . . . . . . . . . . . . . . . . . . . . . . . . . . . 22Older Operators <strong>and</strong> the Future. . . . . . . . . . . . . . . . . . . . . . . . . . . . . . . . 23<strong>Farm</strong> Income <strong>and</strong> Financial Performance. . . . . . . . . . . . . . . . . . . . . . . . 26Net <strong>Farm</strong> Income . . . . . . . . . . . . . . . . . . . . . . . . . . . . . . . . . . . . . . . . . . 26Selected Financial Ratios . . . . . . . . . . . . . . . . . . . . . . . . . . . . . . . . . . . . 29Operator Household Income <strong>and</strong> Net Worth . . . . . . . . . . . . . . . . . . . . . 30Level <strong>of</strong> Operator Household Income. . . . . . . . . . . . . . . . . . . . . . . . . . . 30Operator Household Net Worth . . . . . . . . . . . . . . . . . . . . . . . . . . . . . . . 30Government Payments . . . . . . . . . . . . . . . . . . . . . . . . . . . . . . . . . . . . . . . 33Commodity-Related Programs . . . . . . . . . . . . . . . . . . . . . . . . . . . . . . . . 33Conservation Programs. . . . . . . . . . . . . . . . . . . . . . . . . . . . . . . . . . . . . . 34Contracting. . . . . . . . . . . . . . . . . . . . . . . . . . . . . . . . . . . . . . . . . . . . . . . . . 37Production Under Contract . . . . . . . . . . . . . . . . . . . . . . . . . . . . . . . . . . . 37Variation by Type <strong>of</strong> <strong>Farm</strong> . . . . . . . . . . . . . . . . . . . . . . . . . . . . . . . . . . . 38<strong><strong>Farm</strong>s</strong> as Contractors. . . . . . . . . . . . . . . . . . . . . . . . . . . . . . . . . . . . . . . . 39Special Feature: Limited-Resource <strong>Farm</strong>ers—Who Are They? . . . . . 40The Original Definition. . . . . . . . . . . . . . . . . . . . . . . . . . . . . . . . . . . . . . 40Alternate Definitions. . . . . . . . . . . . . . . . . . . . . . . . . . . . . . . . . . . . . . . . 40Counts <strong>and</strong> Constraints . . . . . . . . . . . . . . . . . . . . . . . . . . . . . . . . . . . . . . 42Similarities . . . . . . . . . . . . . . . . . . . . . . . . . . . . . . . . . . . . . . . . . . . . . . . 42A Major Difference. . . . . . . . . . . . . . . . . . . . . . . . . . . . . . . . . . . . . . . . . 44Overlap . . . . . . . . . . . . . . . . . . . . . . . . . . . . . . . . . . . . . . . . . . . . . . . . . . 44Conclusions. . . . . . . . . . . . . . . . . . . . . . . . . . . . . . . . . . . . . . . . . . . . . . . . . 46Large-Scale <strong><strong>Farm</strong>s</strong> Produce the Most Output. . . . . . . . . . . . . . . . . . . . . 46<strong>Farm</strong>ing in Metro Areas . . . . . . . . . . . . . . . . . . . . . . . . . . . . . . . . . . . . . 47Financial Status <strong>of</strong> the <strong>Family</strong> <strong>Farm</strong>. . . . . . . . . . . . . . . . . . . . . . . . . . . . 47Limited-Resource <strong><strong>Farm</strong>s</strong>: Few in Number. . . . . . . . . . . . . . . . . . . . . . . 48Different <strong><strong>Farm</strong>s</strong>, Different Policies. . . . . . . . . . . . . . . . . . . . . . . . . . . . . 49ii<strong>Structure</strong> <strong>and</strong> <strong>Finances</strong> <strong>of</strong> U.S. <strong><strong>Farm</strong>s</strong>: <strong>Family</strong> <strong>Farm</strong> <strong>Report</strong>, 2010 Edition / EIB-66Economic Research Service/USDA
References. . . . . . . . . . . . . . . . . . . . . . . . . . . . . . . . . . . . . . . . . . . . . . . . . . 50Appendix I: Comparing the Census <strong>and</strong> ERS <strong>Farm</strong> Classifications. . . 54Limited-Resource <strong><strong>Farm</strong>s</strong>. . . . . . . . . . . . . . . . . . . . . . . . . . . . . . . . . . . . . 54Nonfamily <strong><strong>Farm</strong>s</strong> . . . . . . . . . . . . . . . . . . . . . . . . . . . . . . . . . . . . . . . . . . 54Comparability, Now <strong>and</strong> in the Future . . . . . . . . . . . . . . . . . . . . . . . . . . 55Appendix II: The Agricultural Resource Management Survey . . . . . . 57Phase III Specifics. . . . . . . . . . . . . . . . . . . . . . . . . . . . . . . . . . . . . . . . . . 57Operators <strong>and</strong> Their Households. . . . . . . . . . . . . . . . . . . . . . . . . . . . . . . 58Coordination With the Census <strong>of</strong> Agriculture . . . . . . . . . . . . . . . . . . . . 58Appendix III: Measuring Operator Household Income<strong>and</strong> Net Worth . . . . . . . . . . . . . . . . . . . . . . . . . . . . . . . . . . . . . . . . . . . . . . 59Operator Household Income . . . . . . . . . . . . . . . . . . . . . . . . . . . . . . . . . . 59Operator Household Net Worth . . . . . . . . . . . . . . . . . . . . . . . . . . . . . . . 59Additional Information . . . . . . . . . . . . . . . . . . . . . . . . . . . . . . . . . . . . . . 59Appendix IV: Government Payments—Survey Versus Administrative Data. . . . . . . . . . . . . . . . . . . . . . . . . . . . . 61Total Payments From ARMS <strong>and</strong> the Sector Accounts . . . . . . . . . . . . . 61Capture Rates . . . . . . . . . . . . . . . . . . . . . . . . . . . . . . . . . . . . . . . . . . . . . 63Program Categories. . . . . . . . . . . . . . . . . . . . . . . . . . . . . . . . . . . . . . . . . 63Which Source To Use? . . . . . . . . . . . . . . . . . . . . . . . . . . . . . . . . . . . . . . 63iii<strong>Structure</strong> <strong>and</strong> <strong>Finances</strong> <strong>of</strong> U.S. <strong><strong>Farm</strong>s</strong>: <strong>Family</strong> <strong>Farm</strong> <strong>Report</strong>, 2010 Edition / EIB-66Economic Research Service/USDA
SummaryBroad descriptions <strong>of</strong> farms based on U.S. averages can mask variationamong different sizes <strong>and</strong> types <strong>of</strong> farms. Small family farms dominate thefarm count <strong>and</strong> hold most farm assets, including farml<strong>and</strong>. But large-scalefamily farms <strong>and</strong> nonfamily farms account for the bulk <strong>of</strong> farm production.Averages such as sales per farm, therefore, can be misleading. Informationon the different kinds <strong>of</strong> farms—<strong>and</strong> the farmers who operate them—isimportant for underst<strong>and</strong>ing the economic well-being <strong>of</strong> farm households <strong>and</strong>the impact <strong>of</strong> farm policy.What Is the Issue?Agricultural policymakers require information on how U.S. farming is organized.USDA’s Economic Research Service (ERS) produces a periodic reportwith that information. The <strong>Family</strong> <strong>Farm</strong> <strong>Report</strong>, 2010 Edition, is the mostrecent in the series, providing agricultural policymakers with an accurate,detailed, <strong>and</strong> unbiased source <strong>of</strong> information on the structure <strong>and</strong> finances <strong>of</strong>U.S. farms, including the relationship <strong>of</strong> farm size <strong>and</strong> type to agriculturalproduction, financial performance, sources <strong>of</strong> farm household income, <strong>and</strong>the extent <strong>of</strong> operators’ <strong>of</strong>f-farm work. The report provides a sense <strong>of</strong> thefinancial position <strong>of</strong> family farms in general <strong>and</strong> for different types <strong>of</strong> familyfarms.What Are the Major Findings?Small family farms—annual sales less than $250,000—made up 88 percent<strong>of</strong> U.S. farms in 2007. They also held about 64 percent <strong>of</strong> all farm assets,including 63 percent <strong>of</strong> the l<strong>and</strong> owned by farms. As custodians <strong>of</strong> the bulk<strong>of</strong> farm assets—including l<strong>and</strong>—small farms have a large role in naturalresource <strong>and</strong> environmental policy. Small farms accounted for 76 percent <strong>of</strong>the l<strong>and</strong> enrolled by farmers in USDA l<strong>and</strong>-retirement programs, largely inthe Conservation Reserve Program.Nevertheless, very large family farms <strong>and</strong> nonfamily farms produce thelargest share <strong>of</strong> agricultural output. Large-scale family farms (annual sales<strong>of</strong> $250,000 or more), plus nonfamily farms, made up only 12 percent <strong>of</strong>U.S. farms in 2007 but accounted for 84 percent <strong>of</strong> the value <strong>of</strong> U.S. production.Although small family farms produced only 16 percent <strong>of</strong> agriculturaloutput, they made more significant contributions to the production <strong>of</strong> specificcommodities: hay, tobacco, cash grains <strong>and</strong> soybeans, <strong>and</strong> beef cattle.For the most part, large-scale farms are more viable businesses thansmall family farms. The average operating pr<strong>of</strong>it margin <strong>and</strong> rates <strong>of</strong> returnon assets <strong>and</strong> equity for large farms (annual sales <strong>of</strong> $250,000 to $499,999)<strong>and</strong> very large farms (annual sales <strong>of</strong> $500,000 or more) were all positive in2007, <strong>and</strong> most <strong>of</strong> these farms had a positive operating pr<strong>of</strong>it margin. Smallfarms were less viable as businesses. Average operating pr<strong>of</strong>it margin <strong>and</strong>rates <strong>of</strong> return on assets <strong>and</strong> equity were negative for most small-farm types.Nevertheless, some farms within each small-farm type (see table for farmtypes) had relatively high operating margins <strong>of</strong> at least 20 percent.iv<strong>Structure</strong> <strong>and</strong> <strong>Finances</strong> <strong>of</strong> U.S. <strong><strong>Farm</strong>s</strong>: <strong>Family</strong> <strong>Farm</strong> <strong>Report</strong>, 2010 Edition / EIB-66Economic Research Service/USDA
Distribution <strong>of</strong> farms, total production, <strong>and</strong> assets by farm type, 2007<strong>Farm</strong> type <strong><strong>Farm</strong>s</strong> Value <strong>of</strong> production <strong>Farm</strong> assetsPercent <strong>of</strong> U.S. totalSmall family farms: 1Retirement 18.4 1.6 12.9Residential/lifestyle 45.1 4.2 26.0<strong>Farm</strong>ing-occupationLow-sales 19.8 4.0 17.3Medium-sales 5.1 6.6 7.9Large-scale family farms: 1Large family farms 4.3 12.2 9.3Very large family farms 5.0 53.7 20.1Nonfamily farms 1,2 2.4 17.7 6.61Small farms have sales less than $250,000; large-scale farms have sales <strong>of</strong> $250,000 or more;no sales limit for nonfamily farms.2Nonfamily farms include any farm where the majority <strong>of</strong> the business is not owned by theoperator <strong>and</strong> individuals related to the operator.Source: USDA, National Agricultural Statistics Service <strong>and</strong> Economic Research Service, 2007Agricultural Resource Management Survey, Phase III.Small-farm households rely on <strong>of</strong>f-farm income. Given small farms’ poorfinancial performance, why do so many continue to exist? Small-farm householdstypically receive substantial <strong>of</strong>f-farm income <strong>and</strong> do not rely primarilyon their farms for their livelihood. Most <strong>of</strong> their <strong>of</strong>f-farm income is fromwage-<strong>and</strong>-salary jobs or self-employment. Households operating retirementfarms, however, receive most <strong>of</strong> their <strong>of</strong>f-farm income from such sources asSocial Security, pensions, dividends, interest, <strong>and</strong> rent.<strong>Farm</strong> operator households, generally speaking, cannot be consideredlow-income, but limited-resource farms persist. Median household incomefor only two types <strong>of</strong> farm households—those operating retirement farmsor low-sales farms (annual sales less than $100,000)—was below the U.S.median in 2007. Limited-resource farms, however, make up between 3 <strong>and</strong>12 percent <strong>of</strong> all farms, depending on how “limited-resource” is defined.(The definitions are based on different—but low—levels <strong>of</strong> farm sales, operatorhousehold income, <strong>and</strong> farm assets or operator household net worth.)Different types <strong>of</strong> Government payments go to different types <strong>of</strong> farms.The distribution <strong>of</strong> commodity-related program payments is roughly proportionalto the production <strong>of</strong> program commodities. Medium-sales (annualsales <strong>of</strong> $100,000 to $249,999) <strong>and</strong> large-scale farms received 76 percent<strong>of</strong> commodity-related Government payments in 2007. Likewise, large-scalefarms received 60 percent <strong>of</strong> the payments from working-l<strong>and</strong> programs,which target production indirectly by focusing on l<strong>and</strong> in production. Incontrast, l<strong>and</strong>-retirement programs target environmentally sensitive l<strong>and</strong>rather than production. The bulk <strong>of</strong> l<strong>and</strong>-retirement payments (73 percent)went to retirement, residential/lifestyle, <strong>and</strong> low-sales small farms. However,most farms (61 percent) received no Government payments at all <strong>and</strong> werenot directly affected by farm program payments.v<strong>Structure</strong> <strong>and</strong> <strong>Finances</strong> <strong>of</strong> U.S. <strong><strong>Farm</strong>s</strong>: <strong>Family</strong> <strong>Farm</strong> <strong>Report</strong>, 2010 Edition / EIB-66Economic Research Service/USDA
How Was the Study Conducted?The 2007 Agricultural Resource Management Survey (ARMS) is the mainsource <strong>of</strong> data in the <strong>Family</strong> <strong>Farm</strong> <strong>Report</strong>, 2010 Edition. ARMS is an annualsurvey designed <strong>and</strong> conducted by ERS <strong>and</strong> the National AgriculturalStatistics Service (NASS), another USDA agency. In addition to ARMS,various censuses <strong>of</strong> agriculture <strong>and</strong> ERS farm sector income estimates areused in this report, particularly in the analysis <strong>of</strong> long-term trends. The reportuses the farm classification system developed by ERS to examine farm structurein the United States.vi<strong>Structure</strong> <strong>and</strong> <strong>Finances</strong> <strong>of</strong> U.S. <strong><strong>Farm</strong>s</strong>: <strong>Family</strong> <strong>Farm</strong> <strong>Report</strong>, 2010 Edition / EIB-66Economic Research Service/USDA
IntroductionThe <strong>Family</strong> <strong>Farm</strong> <strong>Report</strong>, 2010 Edition presents comprehensive informationabout the structure <strong>and</strong> finances <strong>of</strong> the diverse types <strong>of</strong> family farms in theUnited States. This report—like earlier editions—covers a variety <strong>of</strong> st<strong>and</strong>ardtopics, such as the number <strong>and</strong> size <strong>of</strong> U.S. farms, the characteristics<strong>of</strong> their operators, <strong>and</strong> the finances <strong>of</strong> farm businesses <strong>and</strong> the householdsthat operate them. The report also presents materials on the geography <strong>of</strong>farming, aging operators <strong>and</strong> the future <strong>of</strong> farming, <strong>and</strong> limited-resourcefarmers.The diversity <strong>of</strong> U.S. farms is partly attributable to the <strong>of</strong>ficial farm definition,which includes farms that are very small in terms <strong>of</strong> sales <strong>of</strong> farm products.A farm is currently defined—for statistical purposes—as any place fromwhich $1,000 or more <strong>of</strong> agricultural products (crops <strong>and</strong> livestock) weresold or normally would have been sold during the year under consideration.This definition has been in place since August 1975, by joint agreementamong USDA, the Office <strong>of</strong> Management <strong>and</strong> Budget, <strong>and</strong> the U.S. CensusBureau (Sommer et al., 1998, p. 4).USDA’s Economic Research Service (ERS) developed a farm classification(see box, “<strong>Farm</strong> Types, 2007”) to group farms—particularly family farms—<strong>Farm</strong> Types, 2007Small family farms(gross farm sales less than $250,000) 1Large-scale family farms(gross farm sales <strong>of</strong> $250,000 or more)Retirement farms. Small farms whose operators reportthey are retired, although they continue to farm on asmall scale. These operations sell enough farm products(at least $1,000 worth) to qualify as farms under thecurrent farm definition. 2Residential/lifestyle farms. Small farms whose operatorsreport a major occupation other than farming. 3 Thecategory also includes a small number <strong>of</strong> farms—8percent <strong>of</strong> the group in 2007—whose operators are notin the labor force.<strong>Farm</strong>ing-occupation farms. Small family farmswhose operators report farming as their majoroccupation. 3• Low-sales farms. Gross sales less than $100,000.• Medium-sales farms. Gross sales between$100,000 <strong>and</strong> $249,999.Large family farms. <strong><strong>Farm</strong>s</strong> with gross sales between$250,000 <strong>and</strong> $499,999.Very large family farms. <strong><strong>Farm</strong>s</strong> with gross sales <strong>of</strong>$500,000 or more.Nonfamily farmsNonfamily farms. Any farm where the operator <strong>and</strong>persons related to the operator do not own a majority <strong>of</strong>the business.Note: Limited-resource farms are no longer a separate category in the classification, starting with the 2005 Agricultural ResourceManagement Survey.1USDA’s National Commission on Small <strong><strong>Farm</strong>s</strong> selected $250,000 in gross sales in a given year as the cut<strong>of</strong>f between small <strong>and</strong> large-scalefarms (USDA, NCSF, 1998, p. 28).2A farm is defined as any place that produced <strong>and</strong> sold—or normally would have produced <strong>and</strong> sold—at least $1,000 <strong>of</strong> agriculturalproducts during a given year (USDA, NASS, 2008).3Major occupation is defined as the occupation at which operators spent the majority <strong>of</strong> their work time.1<strong>Structure</strong> <strong>and</strong> <strong>Finances</strong> <strong>of</strong> U.S. <strong><strong>Farm</strong>s</strong>: <strong>Family</strong> <strong>Farm</strong> <strong>Report</strong>, 2010 Edition / EIB-66Economic Research Service/USDA
into more homogeneous categories based primarily on annual gross sales <strong>of</strong> thefarm, major occupation <strong>of</strong> the operator, <strong>and</strong> family/nonfamily ownership <strong>of</strong> thefarm. Use <strong>of</strong> these homogeneous groups in this report enables a clearer pictureto emerge <strong>of</strong> the status <strong>of</strong> farms in the United States today. 1Two changes were made to the ERS farm classification since the previous<strong>Family</strong> <strong>Farm</strong> <strong>Report</strong> was released in 2007. First, the classification nowincorporates the refined ERS definition <strong>of</strong> “family farm,” which focuses onthe share <strong>of</strong> the farm business held by farm operators <strong>and</strong> their families. Therefined definition had a minor effect on the share <strong>of</strong> farms classified as familyfarms (see box, “What Is a <strong>Family</strong> <strong>Farm</strong>?”).1USDA’s National Agricultural StatisticsService also has released a farm classification,published in the 2007 Census <strong>of</strong>Agriculture. For more information, see“Appendix I: Comparing the Census <strong>and</strong>ERS <strong>Farm</strong> Classifications.”Second, limited-resource farms are now analyzed separately from the classification,not as a category in the classification. The USDA-wide definition<strong>of</strong> limited-resource farms—based on farm sales <strong>and</strong> operator householdincome in both the current <strong>and</strong> previous years—is inconsistent with the rest<strong>of</strong> the classification, which is based on farm sales <strong>and</strong> the operator’s occupationin the current year. This report provides more detailed informationabout limited-resource farmers by analyzing them separately. The analysisappears as a special feature, “Limited-Resource <strong>Farm</strong>ers—Who Are They?”This is the third issue <strong>of</strong> the <strong>Family</strong> <strong>Farm</strong> <strong>Report</strong> series to feature a specialtopic. Previous special features were “Multiple-Operator <strong><strong>Farm</strong>s</strong>” (Hoppe <strong>and</strong>Banker, 2006) <strong>and</strong> the “The Shift to Larger <strong><strong>Farm</strong>s</strong>” (Hoppe et al., 2007).What Is a <strong>Family</strong> <strong>Farm</strong>?There is no hard-<strong>and</strong>-fast definition <strong>of</strong> the “familyfarm.” The ideal definition would allow changes inthe way in which operators structure their farm businessesas they respond to changes in technology, themarketplace, <strong>and</strong> Government policies but still capturethe general concept <strong>of</strong> a family farm in which a familymaintains majority control <strong>and</strong> ownership.The definition <strong>of</strong> family farm used at the EconomicResearch Service (ERS) has been refined over time. Thecurrent definition—introduced in the 2005 AgriculturalResource Management Survey (ARMS)—includesany farm where the majority <strong>of</strong> the business is ownedby the operator <strong>and</strong> individuals related to the operatorby blood or marriage, including relatives who do notreside in the operator’s household. Nonfamily farmsinclude any farm where the operator <strong>and</strong> relatives donot own a majority <strong>of</strong> the business. For example, nonfamilyfarms include farms operated by publicly heldcorporations, but also farms equally owned by threeunrelated business partners, as well as farms operatedby a hired manager for a family <strong>of</strong> absentee owners.Immediately prior to the implementation <strong>of</strong> the currentdefinition, family farms were defined largely on thebasis <strong>of</strong> business organization. <strong>Family</strong> farms includedany farm organized as a sole proprietorship, partnership,or family corporation. <strong>Family</strong> farms excludedfarms organized as cooperatives or nonfamily corporations,as well as farms operated by a hired manager orheld in estates or trusts. Survey respondents, however,found the terms “family corporation” <strong>and</strong> “hiredmanager” to be ambiguous. Redesigning the definitionto focus on the ownership <strong>of</strong> the farm simplifiedthe questionnaire for respondents <strong>and</strong> made the familyfarm definition more precise.The change in the definition had a minor impact on theshare <strong>of</strong> farms classified as family farms. In 2007, 98percent <strong>of</strong> farms in ARMS were classified as familyfarms under the current definition, the same percentagetypically classified as family farms prior to 2005 underthe previous definition.Information in this box is drawn from “<strong>Family</strong> <strong>Farm</strong>” inthe ERS briefing room on <strong>Farm</strong> Household Economics<strong>and</strong> Well-Being at: www.ers.usda.gov/briefing/wellbeing/glossary.htm#familyfarm.2<strong>Structure</strong> <strong>and</strong> <strong>Finances</strong> <strong>of</strong> U.S. <strong><strong>Farm</strong>s</strong>: <strong>Family</strong> <strong>Farm</strong> <strong>Report</strong>, 2010 Edition / EIB-66Economic Research Service/USDA
As in previous issues, the Agricultural Resource Management Survey(ARMS)—an annual farm survey—is the main source <strong>of</strong> data in the <strong>Family</strong><strong>Farm</strong> <strong>Report</strong>, 2010 Edition. ARMS is jointly designed <strong>and</strong> conducted byERS <strong>and</strong> the National Agricultural Statistics Service (NASS), anotherUSDA agency. (For more information about ARMS, see “Appendix II: TheAgricultural Resource Management Survey.”) The report also draws onvarious censuses <strong>of</strong> agriculture <strong>and</strong> the ERS farm sector accounts, particularlywhen following trends over long periods <strong>of</strong> time.This report depicts farm structure <strong>and</strong> financial status as <strong>of</strong> 2007, the mostrecent year for which ARMS data were available at the time <strong>of</strong> writing.Using the 2007 ARMS also allows comparability with the 2007 Census <strong>of</strong>Agriculture, released in early 2009. The year 2007 was above average forfarming—as measured by ERS farm sector income estimates—reflectingsharply increasing commodity prices by the end <strong>of</strong> 2007 that continued intolate 2008 (Harris et al., 2008, p. 1). Real net farm income was $71 billion in2007 (fig. 1), about 18 percent higher than the previous year <strong>and</strong> 7 percenthigher than the average for the previous 10 years. Net farm income increasedanother 20 percent in 2008, but declined to $55 billion in 2009. Real net farmincome is expressed in 2007 dollars here, using the Gross Domestic Productchain-type price index to adjust for price changes.Figure 1Real net farm income, 1997 to 2009Net farm income was 7 percent higher in 2007 than the average for the previous 10 years<strong>and</strong> continued to increase into 2008Billion 2007 dollars1008060402001997 98 99 2000 01 02 03 04 05 06 Average,1997-2006Note: Deflated with the Gross Domestic Product chain-type price index.Source: USDA, Economic Research Service, U.S. <strong>and</strong> State <strong>Farm</strong> Income Data (the farm sector accounts),www.ers.usda.gov/data/farmincome/finfidmu.htm.07 08 093<strong>Structure</strong> <strong>and</strong> <strong>Finances</strong> <strong>of</strong> U.S. <strong><strong>Farm</strong>s</strong>: <strong>Family</strong> <strong>Farm</strong> <strong>Report</strong>, 2010 Edition / EIB-66Economic Research Service/USDA
U.S. <strong><strong>Farm</strong>s</strong>: Numbers, Size, <strong>and</strong>Other CharacteristicsAfter peaking at 6.8 million farms in 1935, the number <strong>of</strong> U.S. farms fellsharply until the early 1970s (fig. 2). Falling farm numbers during this periodreflect growing productivity in agriculture <strong>and</strong> increased nonfarm employmentopportunities (Hoppe, et al., 2007, p. 4). Growing productivity led toexcess capacity in agriculture, farm consolidation, <strong>and</strong> farm operators leavingfarming to work in the nonfarm economy. The decline in farm numbersslowed in the 1980s <strong>and</strong> essentially stopped in the 1990s.The greater stability in farm numbers, however, masks shifts in the sizedistribution <strong>of</strong> farms. For example, though farm numbers stabilized from1978 to 2007, the number <strong>of</strong> farms operating fewer than 70 acres increased12 percentage points, the number <strong>of</strong> “thous<strong>and</strong>-acre farms” increased 1percentage point, <strong>and</strong> the number <strong>of</strong> farms in all acreage classes in betweendecreased (fig. 3, top panel). The shift to farms with more than 1,000 acresis more marked when examined in terms <strong>of</strong> these operations’ l<strong>and</strong> in farms(up 12 percentage points) or market value <strong>of</strong> sales (up 15 percentage points)(middle <strong>and</strong> bottom panel, respectively). Note that farms do not necessarilyown all the l<strong>and</strong> they operate; they can also rent l<strong>and</strong>. For example, a farmoperating 1,000 acres could own 500 acres <strong>and</strong> rent 500 acres, or even ownno l<strong>and</strong> at all <strong>and</strong> rent 1,000 acres.The shifts in farms <strong>and</strong> acres among acreage classes between 1978 <strong>and</strong> 2007are reallocations <strong>of</strong> a fairly stable farm count <strong>and</strong> total acres <strong>of</strong> farml<strong>and</strong>(table 1). Sales grew more rapidly during the period, however, reflectingmore output per hour <strong>of</strong> labor. A recent ERS study found that two-thirds<strong>of</strong> the growth in U.S. agricultural output per hour between 1981 <strong>and</strong> 2004Figure 2<strong><strong>Farm</strong>s</strong>, l<strong>and</strong> in farms, <strong>and</strong> average acres per farm, 1850-2007Most <strong>of</strong> the decline in farms occurred between 1935 <strong>and</strong> 19748<strong><strong>Farm</strong>s</strong> (millions)7Acres per farm (hundred acres)6L<strong>and</strong> in farms (billion acres)5432101850 70 90 1910 25 35 45 54 64 74 82 92 2002Census yearNote: The break in the lines after 1974 reflects the introduction <strong>of</strong> an adjustment to estimates <strong>of</strong> the farm count <strong>and</strong> l<strong>and</strong> in farms. Beginningin 1978, the data are adjusted to compensate for undercoverage by the Census <strong>of</strong> Agriculture. For more information, see Allen (2004).Source: USDA, Economic Research Service, compiled from Census <strong>of</strong> Agriculture data.4<strong>Structure</strong> <strong>and</strong> <strong>Finances</strong> <strong>of</strong> U.S. <strong><strong>Farm</strong>s</strong>: <strong>Family</strong> <strong>Farm</strong> <strong>Report</strong>, 2010 Edition / EIB-66Economic Research Service/USDA
came from technological change, such as biotechnology, improved animalhusb<strong>and</strong>ry, <strong>and</strong> improvements in machinery <strong>and</strong> chemicals (Fuglie et al.,2007). Larger farms—like thous<strong>and</strong>-acre farms—were better able to takeadvantage <strong>of</strong> these technological developments <strong>and</strong> increased their share<strong>of</strong> sales.Figure 3<strong><strong>Farm</strong>s</strong>, l<strong>and</strong> in farms, <strong>and</strong> sales by acreage class, 1978 <strong>and</strong> 2007L<strong>and</strong> <strong>and</strong> sales shifted to farms with at least 1,000 acresPercent <strong>of</strong> U.S. farms80<strong><strong>Farm</strong>s</strong>(excludes institutional, experimental,60<strong>and</strong> research farms)4020197820070Less than 70 70 to 259 260 to 499 500 to 999 1,000 or moreAcreage classPercent <strong>of</strong> U.S. farml<strong>and</strong>80L<strong>and</strong> in farms6040200Less than 70 70 to 259 260 to 499 500 to 999 1,000 or moreAcreage classPercent <strong>of</strong> U.S. sales80Market value <strong>of</strong> agricultural products sold(excludes Government payments)6040200Less than 70 70 to 259 260 to 499 500 to 999 1,000 or moreAcreage classSource: USDA, Economic Research Service, compiled from Census <strong>of</strong> Agriculture data(U.S. Department <strong>of</strong> Commerce, U.S. Census Bureau, 1981; USDA, NASS, 2009).5<strong>Structure</strong> <strong>and</strong> <strong>Finances</strong> <strong>of</strong> U.S. <strong><strong>Farm</strong>s</strong>: <strong>Family</strong> <strong>Farm</strong> <strong>Report</strong>, 2010 Edition / EIB-66Economic Research Service/USDA
Table 1<strong><strong>Farm</strong>s</strong>, l<strong>and</strong> in farms, <strong>and</strong> sales, 1978 <strong>and</strong> 2007YearPct. changeItem 1978 2007 (annualized)<strong><strong>Farm</strong>s</strong> (number) 2,476,340 2,204,792 -0.6L<strong>and</strong> in farms (million acres) 973.7 922.1 -0.3Market value <strong>of</strong> agriculturalproducts sold (billion 2007 dollars) 1 176.3 297.2 2.8Notes: Abnormal farms—defined as institutional, experimental, <strong>and</strong> research farms—are excluded.The count <strong>of</strong> farms from the census is slightly higher than the count from the AgriculturalResource Management Survey (ARMS) because the census includes farms in Alaska <strong>and</strong>Hawaii while ARMS excludes them. For more information, see Appendix II.1Sales are expressed in constant 2007 dollars, using the Producer Price Index for <strong>Farm</strong> Productsto adjust for farm prices. Sales exclude Government payments.Source: USDA, Economic Research Service, compiled from Census <strong>of</strong> Agriculture data (U.S.Department <strong>of</strong> Commerce, U.S. Census Bureau, 1981; USDA, National Agricultural StatisticsService, 2009).Share <strong>of</strong> <strong><strong>Farm</strong>s</strong>, Production, <strong>and</strong> AssetsThree features <strong>of</strong> U.S. farm structure st<strong>and</strong> out (fig. 4). First, small familyfarms make up 88 percent <strong>of</strong> all U.S. farms. Second, large-scale familyfarms—only 9 percent <strong>of</strong> all farms—account for a disproportionately large,66-percent share <strong>of</strong> the value <strong>of</strong> production. Third, farming is still an industry<strong>of</strong> family businesses. Ninety-eight percent <strong>of</strong> farms are family farms, <strong>and</strong>they account for 82 percent <strong>of</strong> production. Only 2 percent <strong>of</strong> U.S farms arenonfamily farms, accounting for the remaining 18 percent <strong>of</strong> production.Despite their 16-percent share <strong>of</strong> total farm production, small farms producea larger share <strong>of</strong> specific commodities: 23 percent <strong>of</strong> the value <strong>of</strong> productionfor cash grains <strong>and</strong> soybeans, 51 percent for hay, 34 percent for tobacco, <strong>and</strong>22 percent for beef. At the other extreme, small farms contribute a minisculeshare to the value <strong>of</strong> production for hogs (5 percent) <strong>and</strong> poultry (3 percent).The largest share <strong>of</strong> small-farm production occurs among medium-salesfarms, which account for 7 percent <strong>of</strong> total U.S. production. 2The share <strong>of</strong> assets <strong>and</strong> l<strong>and</strong> held by small farms is also substantially morethan indicated by their small share <strong>of</strong> production. Small farms hold 64percent <strong>of</strong> all farm assets, including 63 percent <strong>of</strong> the l<strong>and</strong> owned by farms(fig. 5). Because <strong>of</strong> their large l<strong>and</strong> holdings—in aggregate—small farms areimportant in conservation efforts. Small farms account for 76 percent <strong>of</strong> thel<strong>and</strong> farmers enroll in USDA l<strong>and</strong>-retirement programs: the ConservationReserve Program (CRP), the Conservation Reserve Enhancement Program(CREP), the Wetl<strong>and</strong>s Reserve Program (WRP), <strong>and</strong> the <strong>Farm</strong>able Wetl<strong>and</strong>sProgram (FWP).<strong>Farm</strong> SizeVariation in farm size—whether measured in sales, acres, or labor use—helps explain the distribution <strong>of</strong> agricultural production. The 1.4 millionretirement <strong>and</strong> residential/lifestyle farms account for only 6 percent <strong>of</strong>production because most <strong>of</strong> these farms are very small (table 2). Seventy-six2This report measures farm size usinggross farm sales, or the revenue associatedwith all the production <strong>of</strong> the farm,including the production accruing toshare l<strong>and</strong>lords <strong>and</strong> contractors. Othermeasures <strong>of</strong> sales exist, however, <strong>and</strong> thesmall-farm share <strong>of</strong> the value <strong>of</strong> productiondepends on the sales measure used.For example, if the measure used is grosscash farm income (GCFI)—total revenuereceived by the farm business alone—thesmall-farm share <strong>of</strong> production increasesto 22 percent. This increase is mostlydue to an expansion <strong>of</strong> the number <strong>of</strong>poultry farms classified as small whenGCFI is used. For more information, seeHoppe et al. (2010, pp. 3-4).6<strong>Structure</strong> <strong>and</strong> <strong>Finances</strong> <strong>of</strong> U.S. <strong><strong>Farm</strong>s</strong>: <strong>Family</strong> <strong>Farm</strong> <strong>Report</strong>, 2010 Edition / EIB-66Economic Research Service/USDA
percent <strong>of</strong> the farms in both groups have annual sales <strong>of</strong> less than $10,000,including 31 percent with sales <strong>of</strong> less than $1,000.<strong><strong>Farm</strong>s</strong> with less than $1,000 in sales do not appear to satisfy the $1,000 salesrequirement in the current farm definition. However, these “point farms” areincluded in the farm count because they might normally have sales that high<strong>and</strong> satisfy the sales requirement. If a farm does not have $1,000 in sales, aFigure 4Share <strong>of</strong> total farms <strong>and</strong> value <strong>of</strong> production by farm type, 2007Large-scale family farms account for 66 percent <strong>of</strong> production9.32.417.716.488.365.9<strong><strong>Farm</strong>s</strong> Value <strong>of</strong> production 1Small family farms Large-scale family farms Nonfamily farms1The value <strong>of</strong> production measures the value <strong>of</strong> commodities produced in a given year,without the effects <strong>of</strong> inventory change. It is calculated by multiplying the quantity <strong>of</strong> eachcommodity produced by the price <strong>of</strong> the commodity.Source: USDA, National Agricultural Statistics Service <strong>and</strong> Economic Research Service,2007 Agricultural Resource Management Survey, Phase III.Figure 5Share <strong>of</strong> farm assets, acres owned by farms, <strong>and</strong> acres enrolled inl<strong>and</strong>-retirement programs 1 by farm type, 2007Small farms account for most farm assets9.37.18.529.430.115.264.162.876.3AssetsAcres ownedby farmsAcres enrolled in l<strong>and</strong>retirementprograms 1Small family farms Large-scale family farms Nonfamily farms1Conservation Reserve Program, Conservation Reserve Enhancement Program,Wetl<strong>and</strong>s Reserve Program, <strong>and</strong> <strong>Farm</strong>able Wetl<strong>and</strong>s Program.Source: USDA, National Agricultural Statistics Service <strong>and</strong> Economic Research Service,2007 Agricultural Resource Management Survey, Phase III.7<strong>Structure</strong> <strong>and</strong> <strong>Finances</strong> <strong>of</strong> U.S. <strong><strong>Farm</strong>s</strong>: <strong>Family</strong> <strong>Farm</strong> <strong>Report</strong>, 2010 Edition / EIB-66Economic Research Service/USDA
Table 2Sales class, l<strong>and</strong> operated, <strong>and</strong> labor used by farm type, 2007Small family farms<strong>Farm</strong>ing-occupationResidential/ Low- Medium- Large-scale farms Nonfamily AllItem Retirement lifestyle sales sales Large Very large farms farmsNumberTotal farms 403,828 989,830 434,599 111,389 93,601 110,152 53,393 2,196,791Percent <strong>of</strong> U.S. totalDistribution <strong>of</strong>:<strong><strong>Farm</strong>s</strong> 18.4 45.1 19.8 5.1 4.3 5.0 2.4 100.0Value <strong>of</strong> production 1.6 4.2 4.0 6.6 12.2 53.7 17.7 100.0Percent <strong>of</strong> groupSales class:Less than $1,000 1 31.4 31.2 17.1 na na na 11.1 23.5$1,000 to $9,999 44.5 44.4 31.6 na na na 26.3 35.1$10,000 to $49,999 17.0 18.1 32.0 na na na 20.2 18.1$50,000 to $99,999 5.3 3.8 19.3 na na na 9.7 6.8$100,000 to $174,999 1.2 1.8 na 58.8 na na 5.6 4.1$175,000 to $249,999 0.7 0.7 na 41.2 na na 3.0 2.6$250,000 to $499,999 na na na na 100.0 na 6.2 4.4$500,000 to $999,999 na na na na na 63.0 5.1 3.3$1,000,000 to $4,999,999 na na na na na 34.0 9.3 1.9$5,000,000 or more na na na na na 3.0 3.5 0.2Acres per farmAcres operated:Mean 174 148 294 980 1,398 2,132 1,099 400Median 2 69 58 110 414 724 1,062 188 8Annual person equivalents <strong>of</strong> labor per farmAverage person equivalents<strong>of</strong> labor 3,4 0.695 0.821 1.408 2.533 3.107 8.357 11.974 1.747Percent <strong>of</strong> total hoursShare <strong>of</strong> hours worked by: 5Principal operator 4 69.3 56.4 66.0 56.6 47.6 17.8 6.5 40.7Spouse 4 12.5 17.4 16.1 13.8 12.8 4.1 0.6 10.2Hired labor 5.3 12.5 5.8 13.4 21.4 60.7 81.5 34.7na = Not applicable.1Point farms have sales less than $1,000 (including Government payments) but are still considered farms because they would be expected tonormally sell at least $1,000.2Midpoint <strong>of</strong> the distribution <strong>of</strong> farms by acres operated. Half the farms in a group operate more acres than the median, while the other halfoperate fewer acres than the median.3One annual person equivalent equals 2,000 hours <strong>of</strong> labor, or 50 weeks per year times 40 hours per week.4Includes paid <strong>and</strong> unpaid hours.5Shares worked by other operators, unpaid workers, <strong>and</strong> contract labor are not shown separately.Source: USDA, National Agricultural Statistics Service <strong>and</strong> Economic Research Service, 2007 Agricultural Resource Management Survey,Phase III.8<strong>Structure</strong> <strong>and</strong> <strong>Finances</strong> <strong>of</strong> U.S. <strong><strong>Farm</strong>s</strong>: <strong>Family</strong> <strong>Farm</strong> <strong>Report</strong>, 2010 Edition / EIB-66Economic Research Service/USDA
“point system” assigns values for acres <strong>of</strong> various crops <strong>and</strong> head <strong>of</strong> livestockto estimate normal sales. Point farms are farms with less than $1,000 in salesbut points worth at least $1,000. 3Nonfamily farms are also concentrated in the lower sales classes. Fifty-eightpercent have sales less than $50,000, <strong>and</strong> 76 percent have sales less than$250,000 <strong>and</strong> would qualify as small farms. The only criteria necessary to beclassified as a nonfamily farm is that the operator <strong>and</strong> the operator’s relativesdo not own a majority <strong>of</strong> the business. Thus, nonfamily farms include morethan large farms operated by publicly held corporations. They also include,for example, a farm equally owned by unrelated business partners, as well asfarms operated by hired managers unrelated to the owners. Only 15 percent<strong>of</strong> nonfamily farms are corporations, <strong>and</strong> only 11 percent <strong>of</strong> these corporationshave more than 10 stockholders.3For more information, see “What is theDefinition <strong>of</strong> a <strong>Farm</strong>?” on the USDA,National Agricultural Statistics Servicewebsite at: www.agcensus.usda.gov/help/faqs/2002_census/index.asp#1.Median Acres OperatedThe average (or mean) acreage operated is fairly low for both retirement <strong>and</strong>residential/lifestyle farms, 174 <strong>and</strong> 148 acres, respectively. Average acreageoperated, however, may not best indicate the size <strong>of</strong> a typical farm in a groupbecause a few high-acreage farms may raise the average well above theacreage operated on most farms. Median acreage operated—the midpoint<strong>of</strong> the distribution <strong>of</strong> farms by acres operated—is a better indicator. Medianacreage operated is 69 acres for retirement farms <strong>and</strong> 58 acres for residential/lifestyle farms, which means the typical farm in both <strong>of</strong> these groups is evensmaller than suggested by the groups’ average acreages.Median acres operated was 110 acres among low-sales farms, nearly doublethe medians for retirement or residential/lifestyle farms. Median acreage ismuch larger for medium-sales small farms <strong>and</strong> large-scale farms, rangingfrom 414 to 1,062 acres. The high average acreage for nonfamily farms(1,099 acres) reflects a small share <strong>of</strong> farms in the group with very large acreages.In contrast, the median for this group is about one-sixth as large—188acres—which is more consistent with the 76-percent share <strong>of</strong> nonfamilyfarms with annual sales less than $250,000.Million-Dollar <strong><strong>Farm</strong>s</strong>Thirty-seven percent <strong>of</strong> very large family farms <strong>and</strong> 13 percent <strong>of</strong> nonfamilyfarms are “million-dollar farms” with annual sales <strong>of</strong> $1 million or more.There are only 47,600 million-dollar farms—2 percent <strong>of</strong> all U.S. farms—but they account for 53 percent <strong>of</strong> production. They dominate the production<strong>of</strong> five major farm products: high-value crops (vegetables, fruits <strong>and</strong> treenuts, <strong>and</strong> nursery <strong>and</strong> greenhouse products), hogs, dairy, poultry, <strong>and</strong> beef.The largest million-dollar farms—those with sales <strong>of</strong> at least $5 million—by themselves account for 35 to 45 percent <strong>of</strong> the production for beef cattle(largely in feedlots), high-value crops, <strong>and</strong> milk. For more information aboutmillion-dollar farms, see box “Million-Dollar <strong><strong>Farm</strong>s</strong>” or Million-Dollar<strong><strong>Farm</strong>s</strong> in the New Century (Hoppe et al., 2008).9<strong>Structure</strong> <strong>and</strong> <strong>Finances</strong> <strong>of</strong> U.S. <strong><strong>Farm</strong>s</strong>: <strong>Family</strong> <strong>Farm</strong> <strong>Report</strong>, 2010 Edition / EIB-66Economic Research Service/USDA
Million-Dollar <strong><strong>Farm</strong>s</strong>Approximately 47,600 U.S. farms have annual sales <strong>of</strong> $1 million or more. Most million-dollar farmshave annual sales between $1 million <strong>and</strong> $4,999,999, but 11 percent—5,200 farms—sell at least $5million. A large majority <strong>of</strong> million-dollar farms (86 percent) are family farms. <strong>Family</strong> farms account fora smaller share (64 percent) <strong>of</strong> farms with annual sales over $5 million.Million-dollar farms make up about 2 percent <strong>of</strong> all U.S. farms, but they account for 53 percent <strong>of</strong> thevalue <strong>of</strong> production (see figure). They also produce approximately 60 to 70 percent <strong>of</strong> high-value crops,hogs, dairy, poultry, <strong>and</strong> beef. The largest million-dollar farms—those with sales <strong>of</strong> at least $5 million—account for 35 to 45 percent <strong>of</strong> beef (largely in feedlots), milk, <strong>and</strong> high-value crops.As one might expect from the figure, 71 percent <strong>of</strong> farms with more than $5 million in sales specializein beef (largely in feedlots), high-value crops, or dairy. The prevalence <strong>of</strong> these specializations among$5 million farms suggests economies <strong>of</strong> scale persist in the production <strong>of</strong> high-value crops, finished beefcattle, <strong>and</strong> milk, even when annual sales pass $5 million.Consider dairy production, for example. Costs <strong>of</strong> production fall rapidly with herd size. Total costs perhundredweight for farms with 1,000 or more cows—which includes $5 million dairies—are less than halfthose for farms with fewer than 50 cows (see table). The biggest cost advantages for large dairies are inoverhead costs, since these operations can use capital <strong>and</strong> labor more intensively (MacDonald et al., 2007,p. 32).Note that gross farm sales is used to measure farm size in this report. <strong>Farm</strong> size, however, could bemeasured in terms <strong>of</strong> gross cash farm income (GCFI) or the gross revenue <strong>of</strong> the farm. The main differencebetween the two measures is that the gross value <strong>of</strong> sales includes the value <strong>of</strong> commodities removedunder production contracts, while GCFI excludes these removals, since the contractor—rather than thefarm—owns the commodity under production.Value <strong>of</strong> production <strong>of</strong> selected commodities by sales class, 2007Percent <strong>of</strong> sales1009080706050403020100High-valuecrops 1Hogs Dairy Poultry BeefTotal U.S.productionSales class:$5,000,000or more$1,000,000 to$4,999,999$500,000 to$999,999$250,000 to$499,999Less than$250,0001Vegetables, fruits <strong>and</strong> tree nuts, <strong>and</strong> nursery <strong>and</strong> greenhouse products.Source: USDA, National Agricultural Statistics Service <strong>and</strong> Economic Research Service,2007 Agricultural Resource Management Survey, Phase III.10<strong>Structure</strong> <strong>and</strong> <strong>Finances</strong> <strong>of</strong> U.S. <strong><strong>Farm</strong>s</strong>: <strong>Family</strong> <strong>Farm</strong> <strong>Report</strong>, 2010 Edition / EIB-66Economic Research Service/USDA
Full economic costs <strong>of</strong> milk production by herd size, 2005Number <strong>of</strong> dairy cows 1Type <strong>of</strong> cost Less than 50 50 to 99 100 to 199 200 to 499 500 to 999Dollars per hundredweight1,000 ormoreFull economic costs 30.09 25.50 20.82 17.92 16.07 13.59Operating costs 2 12.30 12.94 11.51 11.31 1.07 9.74Allocated overhead 3 17.79 12.56 9.31 6.61 5.00 3.85Note: Organic operations are excluded.1All dairy cows, including dry cows, but excluding calves, heifers, <strong>and</strong> bulls.2Largely feed costs, purchased <strong>and</strong> homegrown.3Includes hired labor, opportunity cost <strong>of</strong> unpaid labor, opportunity cost <strong>of</strong> l<strong>and</strong>, taxes <strong>and</strong> insurance, <strong>and</strong> general overhead.Source: MacDonald et al. (2007, p. 32).For most commodities, the distribution <strong>of</strong> production by farm size is similar using either measure. Poultryfarms, however, will frequently be classed as large farms using gross farm sales, but as small farms usingGCFI (Hoppe et al., 2010, pp. 3-4). Using GCFI instead <strong>of</strong> gross sales decreases the share <strong>of</strong> poultryproduced on million-dollar farms to 20 percent while increasing the share <strong>of</strong> poultry produced by smallfarms to 55 percent, if small is defined as less than $250,000 in GCFI. The size classification <strong>of</strong> poultryfarms is somewhat ambiguous. Many poultry farms are small businesses that feed out large numbers <strong>of</strong>birds owned by contractors.11<strong>Structure</strong> <strong>and</strong> <strong>Finances</strong> <strong>of</strong> U.S. <strong><strong>Farm</strong>s</strong>: <strong>Family</strong> <strong>Farm</strong> <strong>Report</strong>, 2010 Edition / EIB-66Economic Research Service/USDA
Labor HoursOne measure <strong>of</strong> annual labor use is the “person equivalent,” defined as2,000 hours, or 40 hours <strong>of</strong> work per week for 50 weeks per year (see table2). Residential/lifestyle <strong>and</strong> retirement farms use the least labor, less than 1person equivalent. Labor use jumps to 1.4 person equivalents for low-salesfarms <strong>and</strong> increases with sales to 8.4 person equivalents for very large farms.Nonfamily farms use 12 person equivalents, on average. This estimate,however, reflects heavy labor use by relatively few farms. Only 14 percent<strong>of</strong> nonfamily farms use more than 5 person equivalents <strong>of</strong> labor, while 47percent use less than 1.SpecializationBeef cattle are a common specialization among small farms, accounting forabout one-third <strong>of</strong> retirement, residential/lifestyle, <strong>and</strong> low-sales farms (table3). There actually are three basic types <strong>of</strong> beef cattle enterprises (Cash, 2002,p. 21). Cow-calf operations produce <strong>and</strong> sell calves. Stocker operations buythe calves <strong>and</strong> pasture them to gain weight. These operations then finish thecattle themselves on grain or sell them as yearlings to fed-cattle operations.Fed-cattle operations place yearlings in feedlots until they reach slaughterweight <strong>and</strong> ship them to packers. Cow-calf enterprises are typically found onsmall farms.Table 3<strong>Farm</strong> specialization by farm type, 2007Small family farms<strong>Farm</strong>ing-occupatonResidential/ Low- Medium- Large-scale farms Nonfamily AllItem Retirement lifestyle sales sales Large Very large farms farmsNumberTotal farms 403,828 989,830 434,599 111,389 93,601 110,152 53,393 2,196,791Percent <strong>of</strong> groupCommodity specialization: 1Cash grains 2 5.6 8.8 14.4 41.3 48.3 35.5 18.0 14.2Other field crops 3 36.8 21.9 19.6 6.7 7.5 8.4 25.1 22.2High-value crops 4 5.0 4.4 8.4 9.7 7.8 10.3 15.3 6.3Beef 31.6 33.8 33.4 19.4 11.8 10.3 22.2 30.2Hogs d d d d 2.2 6.6 1.4 1.3Dairy d d 2.9 15.8 14.2 10.4 2.7 2.7Poultry d 1.0 d d 6.2 15.7 2.0 1.8Other livestock 5 19.6 28.8 20.3 3.0 2.1 2.7 13.3 21.3d = Data suppressed due to insufficient observations.1Commodity that accounts for at least half <strong>of</strong> the farm’s value <strong>of</strong> production.2Includes barley, corn, rice, grain sorghum, soybeans, wheat, oats, <strong>and</strong> general cash grains where no single cash grain accounts for themajority <strong>of</strong> production.3Tobacco, peanuts, cotton, sugar beets, sugarcane, corn for silage, sorghum for silage, hay, canola, <strong>and</strong> general crops, where no singlecrop accounts for the majority <strong>of</strong> production. Also includes farms with all cropl<strong>and</strong> in l<strong>and</strong>-retirement programs.4Vegetables, fruits <strong>and</strong> tree nuts, <strong>and</strong> nursery <strong>and</strong> greenhouse products.5Includes sheep, lambs, wool, goats, goats’ milk, mohair, horses, ponies, mules, donkeys, bees, honey, aquaculture, mink, rabbits, otherfur-bearing animals, bison, deer, elk, llamas, etc. Also includes farms where no single livestock species accounts for the majority <strong>of</strong>production.Source: USDA, National Agricultural Statistics Service <strong>and</strong> Economic Research Service, 2007 Agricultural Resource Management Survey,Phase III.12<strong>Structure</strong> <strong>and</strong> <strong>Finances</strong> <strong>of</strong> U.S. <strong><strong>Farm</strong>s</strong>: <strong>Family</strong> <strong>Farm</strong> <strong>Report</strong>, 2010 Edition / EIB-66Economic Research Service/USDA
Cow-calf enterprises <strong>of</strong>fer three advantages to operators <strong>of</strong> small farms. First,cattle are less labor-intensive than many other enterprises, which may beattractive to an operator who is retired or holds a full-time job <strong>of</strong>f the farm(Cash, 2002, p. 21). Second, cattle enterprises tend to be low-cost, whichlimits cash requirements. Third, under the existing tax code, losses fromfarming can be written <strong>of</strong>f against income from other sources (Durst, 2009,pp. 4-6). Producing calves allows farmers to group their expenses <strong>and</strong> salesin different years to generate small pr<strong>of</strong>its in some years <strong>and</strong> large losses inothers (Hoppe <strong>and</strong> Banker, 2006, p. 14).Two other specializations are common among retirement, residential/lifestyle,<strong>and</strong> low-sales farms. Roughly 20 to 37 percent <strong>of</strong> the three groupsspecialize in “other field crops,” which includes farms with all their cropacres in l<strong>and</strong>-retirement programs. Another 20 to 29 percent <strong>of</strong> each groupspecializes in “other livestock,” which includes grazing livestock other thancattle (namely, horses, sheep, <strong>and</strong> goats.)Some specializations are more common among family farms with gross salesgreater than $100,000 (medium-sales <strong>and</strong> large-scale farms). <strong><strong>Farm</strong>s</strong> specializingin cash grains account for about 36 to 48 percent <strong>of</strong> these farms, while10 to 16 percent specialize in dairy (versus 3 percent <strong>of</strong> farms in general).Large <strong>and</strong> very large family farms are also more likely than other types tospecialize in poultry. Relatively few farms produce hogs, but the specializationis most common (7 percent) among very large farms.Specialization in high-value crops is common among very large family farms<strong>and</strong> nonfamily farms, which together account for 83 percent <strong>of</strong> the totalproduction <strong>of</strong> these crops. No more than 10 percent <strong>of</strong> any small-farm typespecializes in these crops. High-value crops can generate large sales per acre,but they can require much more labor than cattle <strong>and</strong> they may require moremarketing expertise.Tenure <strong>and</strong> L<strong>and</strong> LeasingThe majority <strong>of</strong> retirement, residential/lifestyle, low-sales, <strong>and</strong> nonfamilyfarms are full owners, owning all the l<strong>and</strong> they operate (fig. 6). Leasing ismost common among family farms with sales <strong>of</strong> at least $100,000. Abouttwo-thirds <strong>of</strong> the farms in each <strong>of</strong> these groups are part owners, meaning thatthey own part <strong>of</strong> the l<strong>and</strong> they operate <strong>and</strong> rent the rest.An additional 12 or 13 percent <strong>of</strong> family farms in these groups are tenantswho own none <strong>of</strong> the l<strong>and</strong> they operate but instead rent it all. Half <strong>of</strong> thesefarms specialize in cash grains, <strong>and</strong> they operate a median <strong>of</strong> 650 acres,with the median increasing with sales. Twenty-one percent <strong>of</strong> the largetenants rent machinery as well as l<strong>and</strong>, <strong>and</strong> 63 percent report using customwork, such as fertilizer application or grain harvesting where machinery <strong>and</strong>machine operators are hired together.Approximately 277,500 farm operators reported renting out 62 million acres<strong>of</strong> farml<strong>and</strong> to others in 2007, which accounted for only a fraction <strong>of</strong> the 395million acres rented for farming. Nonoperator l<strong>and</strong>lords provided the rest<strong>of</strong> the rented l<strong>and</strong>. Information about l<strong>and</strong>lords is sparse. The AgriculturalEconomics <strong>and</strong> L<strong>and</strong> Ownership Survey (AELOS) <strong>of</strong> 1999 is dated but still13<strong>Structure</strong> <strong>and</strong> <strong>Finances</strong> <strong>of</strong> U.S. <strong><strong>Farm</strong>s</strong>: <strong>Family</strong> <strong>Farm</strong> <strong>Report</strong>, 2010 Edition / EIB-66Economic Research Service/USDA
Figure 6<strong><strong>Farm</strong>s</strong> by tenure <strong>and</strong> farm type, 2007Part ownership is most common among medium-sales <strong>and</strong> large-scale farmsPercent <strong>of</strong> group100806040Tenants 1Part ownersFull owners200RetirementResidential/lifestyleSmall family farms(sales less than $250,000)Low-sales Medium-sales<strong>Farm</strong>ing-occupationLargeLarge-scalefamily farmsVery large Nonfamily All farms1<strong><strong>Farm</strong>s</strong> that rent all the l<strong>and</strong> they operate. (Also includes farms owning less than 1 percent <strong>of</strong> the l<strong>and</strong> they operate.)Source: USDA, National Agricultural Statistics Service <strong>and</strong> Economic Research Service, 2007 Agricultural ResourceManagement Survey, Phase III.provides the most current, nationwide information about nonoperator l<strong>and</strong>lords.Ninety-five percent <strong>of</strong> nonoperator l<strong>and</strong>lords were individuals/familiesor partnerships in AELOS (USDA, NASS, 2001, p. 247). Of these unincorporatedl<strong>and</strong>lords, 55 percent were at least 65 years old.14<strong>Structure</strong> <strong>and</strong> <strong>Finances</strong> <strong>of</strong> U.S. <strong><strong>Farm</strong>s</strong>: <strong>Family</strong> <strong>Farm</strong> <strong>Report</strong>, 2010 Edition / EIB-66Economic Research Service/USDA
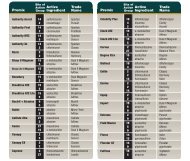
Location <strong>of</strong> U.S. <strong><strong>Farm</strong>s</strong> <strong>and</strong> ProductionThe number <strong>and</strong> characteristics <strong>of</strong> U.S. farms vary substantially by resourceregion (see box, “Geographic Units”). The Heartl<strong>and</strong> has the most farms—436,600, or 20 percent <strong>of</strong> the U.S. total—followed by the Eastern Upl<strong>and</strong>s,with 16 percent <strong>of</strong> all farms (table 4). <strong><strong>Farm</strong>s</strong> are larger in the Heartl<strong>and</strong> thanin the Upl<strong>and</strong>s, however. About 24 percent <strong>of</strong> farms in the Heartl<strong>and</strong> arefamily farms with sales <strong>of</strong> at least $100,000, compared with only 6 percent <strong>of</strong>the farms in the Upl<strong>and</strong>s.Twenty-six percent <strong>of</strong> farms in the Northern Great Plains have sales <strong>of</strong> atleast $100,000, about the same share as in the Heartl<strong>and</strong>. The NorthernPlains, however, accounts for only 6 percent <strong>of</strong> the value <strong>of</strong> U.S. production.Agricultural production is concentrated in the Heartl<strong>and</strong> <strong>and</strong> Fruitful Rim,which together account for 46 percent <strong>of</strong> U.S. production. The Heartl<strong>and</strong> <strong>and</strong>Fruitful Rim also account for the largest shares <strong>of</strong> the Nation’s million-dollarfarms, 25 <strong>and</strong> 21 percent, respectively.Production by RegionDifferent regions concentrate on specific commodities. The Heartl<strong>and</strong> aloneaccounts for more than half the cash grains <strong>and</strong> two-thirds <strong>of</strong> the hogsproduced in the United States. The Fruitful Rim is responsible for nearlytwo-thirds <strong>of</strong> the Nation’s production <strong>of</strong> high-value crops. Two regions—thePrairie Gateway <strong>and</strong> Mississippi Portal—produce three-fifths <strong>of</strong> the cotton.The Eastern Upl<strong>and</strong>s <strong>and</strong> Southern Seaboard together account for four-fifths<strong>of</strong> tobacco <strong>and</strong> two-thirds <strong>of</strong> poultry production, while the Northern Crescent<strong>and</strong> Fruitful Rim each account for about one-third <strong>of</strong> dairy production.Some regional specializations are longst<strong>and</strong>ing <strong>and</strong> were established bythe late 1800s, reflecting local comparative advantages in the production <strong>of</strong>specific commodities (Cochran, 1993, pp. 91-92). Examples include grainproduction—particularly corn—in the Heartl<strong>and</strong> <strong>and</strong> dairy production inthe Northern Crescent. Other specializations are <strong>of</strong> more recent origin. Forexample, the 16-percent share <strong>of</strong> hog production in the Southern Seaboardreflects the expansion <strong>of</strong> hog enterprises in North Carolina in the 1980s <strong>and</strong>1990s, facilitated by the use <strong>of</strong> contracts (McBride <strong>and</strong> Key, 2003, p. 19).Metropolitan <strong>Farm</strong>ing<strong>Farm</strong>ing is popularly viewed as taking place in rural areas (Gale <strong>and</strong>Harrington, 1993, p. 5). Nevertheless, 39 percent <strong>of</strong> U.S. farms are locatedin metropolitan (metro) areas (table 5), defined as a county or group <strong>of</strong>counties with an urban population concentration <strong>of</strong> at least 50,000 people(see box, “Geographic Units”). 4 Metro areas provide both opportunities <strong>and</strong>problems for farms (Heimlich <strong>and</strong> Anderson, 2001, pp. 38-44). For example,farmers may have opportunities to produce <strong>and</strong> sell high-value crops throughfarmers’ markets. Proximity to employment in the metropolitan core mightprovide members <strong>of</strong> farm families with opportunities to work <strong>of</strong>f-farm. Onthe other h<strong>and</strong>, markets for traditional field crops could be reduced as morel<strong>and</strong> is developed. Grain elevators, for example, might go out <strong>of</strong> business.Real estate taxes may increase as l<strong>and</strong> prices rise to reflect the value <strong>of</strong> thel<strong>and</strong> in nonfarm uses.15<strong>Structure</strong> <strong>and</strong> <strong>Finances</strong> <strong>of</strong> U.S. <strong><strong>Farm</strong>s</strong>: <strong>Family</strong> <strong>Farm</strong> <strong>Report</strong>, 2010 Edition / EIB-66Economic Research Service/USDA4According to the <strong>of</strong>ficial U.S. CensusBureau definition, rural areas include theopen countryside plus settlements withfewer than 2,500 inhabitants. Urban areashave larger populations <strong>and</strong> include thedensely settled areas around them. Nevertheless,researchers who follow conditionsin rural areas <strong>and</strong> compare them with conditionsin urban areas <strong>of</strong>ten use nonmetrocounties to represent rural areas <strong>and</strong> metrocounties to represent urban areas becauseannual data are available for counties.This report also follows the convention <strong>of</strong>using metro <strong>and</strong> nonmetro designations,since the rural <strong>and</strong> urban designations arenot available in the Agricultural ResourceManagement Survey. (For more information,see “Measuring Rurality: What isRural?” on the ERS website atwww.ers.usda.gov/briefing/rurality/whatisrural/.)
Geographic UnitsResource regions. The Economic Research Service (ERS) developed farm resource regions based on the characteristics<strong>of</strong> the l<strong>and</strong> <strong>and</strong> the commodities produced (USDA, ERS, 2000). The regions were developed fromfour sources:1. A cluster analysis <strong>of</strong> farm characteristics,2. USDA farm production regions,3. USDA l<strong>and</strong> resource regions, <strong>and</strong>4. USDA, National Agricultural Statistics Service crop reporting districts.Resource regions cross State boundaries but are more homogeneous with respect to natural resources <strong>and</strong> farmproduction than regions based on combinations <strong>of</strong> States (see map).Metropolitan <strong>and</strong> nonmetropolitan residence. The Office <strong>of</strong> Management <strong>and</strong> Budget (OMB) is responsiblefor designating metropolitan (metro) <strong>and</strong> nonmetropolitan (nonmetro) areas. Metro areas are central countieswith one or more urbanized areas—containing an urban nucleus <strong>of</strong> at least 50,000 people—plus any outlyingcounties that are economically connected to the central counties by commuting. Nonmetro counties are aresidual, the counties lying outside metro areas. Based on OMB’s 2003 metro/nometro designations, the UnitedStates currently has 1,090 metro counties <strong>and</strong> 2,052 nonmetro counties.Nonmetro counties are sorted further into two groups: micropolitan <strong>and</strong> noncore. OMB identifies 674 micropolitancounties, using a process silimiar to that used to identify metro counties, except the population criterionis lower for micropolitian counties. Any nonmetro county with an urban cluster <strong>of</strong> at least 10,000 people isthe central county <strong>of</strong> a micropolitan area. Outlying counties are included in the micropolitan area if they areeconomically connected to the central county by commuting. The 1,378 remaining nonmetro counties are designatedas noncore counties.For more information, see “Measuring Rurality: What is Rural?” at www.ers.usda.gov/briefing/rurality/whatisrural/ <strong>and</strong> “Measuring Rurality: What is a Micropolitan Area?” at www.ers.usda.gov/briefing/rurality/micropolitanareas/ on the ERS website.<strong>Farm</strong> Resource RegionsNorthern Great PlainsNorthern CrescentEasternUpl<strong>and</strong>sBasin <strong>and</strong> RangeHeartl<strong>and</strong>Prairie GatewaySouthern SeaboardFruitful RimMississippi Portal16<strong>Structure</strong> <strong>and</strong> <strong>Finances</strong> <strong>of</strong> U.S. <strong><strong>Farm</strong>s</strong>: <strong>Family</strong> <strong>Farm</strong> <strong>Report</strong>, 2010 Edition / EIB-66Economic Research Service/USDA
Table 4<strong><strong>Farm</strong>s</strong> <strong>and</strong> production by resource region, 2007Resource region 1ItemHeartl<strong>and</strong>NorthernCrescentNorthernGreat PlainsPrairieGatewayEasternUpl<strong>and</strong>sSouthernSeaboardFruitfulRimBasin &RangeMississippiPortalAll farmsThous<strong>and</strong>sTotal farms 436.6 318.6 99.4 315.5 345.6 242.5 261.9 89.9 86.8 2,196.8Percent <strong>of</strong> U.S. totalDistribution <strong>of</strong>:All farms 19.9 14.5 4.5 14.4 15.7 11.0 11.9 4.1 4.0 100.0Million-dollar farms 24.7 10.5 5.4 13.4 5.7 12.5 21.0 2.3 4.5 100.0Type <strong>of</strong> farm:Percent <strong>of</strong> groupRetirement 18.1 17.9 20.9 14.0 20.4 17.1 21.6 18.2 20.7 18.4Residential/lifestyle 39.5 44.2 26.9 49.0 53.4 51.2 40.4 41.7 49.9 45.1Lower-sales 16.1 21.7 24.0 20.2 19.8 17.4 22.8 25.9 16.6 19.8Medium-sales 8.1 7.1 9.6 4.6 1.9 2.6 3.5 6.1 1.9 5.1Large 7.8 4.4 8.6 3.7 1.5 2.8 2.8 3.5 2.9 4.3Very large 7.9 3.6 7.4 4.6 2.2 5.7 5.0 2.4 6.3 5.0Nonfamily 2.5 1.1 2.5 3.8 0.9 3.3 3.8 2.1 1.7 2.4Percent <strong>of</strong> U.S. totalValue <strong>of</strong> production 25.9 10.7 6.0 16.3 5.8 9.3 20.4 2.5 2.9 100.0Cash grains 2 53.6 7.2 10.8 15.4 0.4 2.6 2.8 1.6 5.7 100.0Cotton 3.6 0.0 0.0 39.4 d 15.6 18.3 d 21.7 100.0High-value crops 3 3.0 13.1 0.8 3.8 5.0 6.8 62.8 3.9 0.9 100.0Tobacco 9.7 4.3 0.0 0.0 20.4 63.5 d 0.0 d 100.0Beef 22.2 3.5 8.9 41.1 7.7 3.2 8.8 3.7 0.8 100.0Hogs 70.2 5.0 0.4 6.1 1.5 15.7 0.1 0.1 0.9 100.0Dairy 8.9 32.7 3.2 10.0 4.1 2.8 36.5 d d 100.0Poultry 13.2 7.8 0.1 d 22.9 44.2 4.2 d 4.1 100.0d = Data suppressed due to insufficient observations.1For the areas included in each resource region, see box, “Geographic Units,” on page 16.2Includes barley, corn, oats, rice, sorghum, soybeans, wheat, <strong>and</strong> oats.3Vegetables, fruits <strong>and</strong> tree nuts, <strong>and</strong> nursery <strong>and</strong> greenhouse products.Source: USDA, National Agricultural Statistics Service <strong>and</strong> Economic Research Service, 2007 Agricultural Resource Management Survey,Phase III.17<strong>Structure</strong> <strong>and</strong> <strong>Finances</strong> <strong>of</strong> U.S. <strong><strong>Farm</strong>s</strong>: <strong>Family</strong> <strong>Farm</strong> <strong>Report</strong>, 2010 Edition / EIB-66Economic Research Service/USDA
Table 5<strong><strong>Farm</strong>s</strong> <strong>and</strong> population by resource region <strong>and</strong> residence, 2007Distribution <strong>of</strong> farms, by residence 1Resource region 1<strong><strong>Farm</strong>s</strong>NumberMetropolitanNonmetropolitanMicro-Population 22007MetropolitanTotal politan Noncore estimate Density counties 1Percent <strong>of</strong> farms in regionMillion Persons Pct. <strong>of</strong> region’spersons per sq. mile countiesU.S. total 2,196,791 39.1 60.9 24.6 36.3 299.7 101 34.9Heartl<strong>and</strong> 436,572 31.5 68.5 27.7 40.8 37.0 130 32.9Northern Crescent 318,638 46.0 54.0 27.6 26.4 79.2 249 47.6Northern Great Plains 99,423 15.9 84.1 18.7 65.4 3.2 11 7.8Prairie Gateway 315,541 31.0 69.0 22.7 46.2 21.7 53 20.8Eastern Upl<strong>and</strong>s 345,565 34.1 65.9 24.2 41.8 22.2 110 36.6Southern Seaboard 242,471 46.9 53.1 21.9 31.1 36.7 148 45.0Fruitful Rim 261,920 66.5 33.5 16.8 16.7 80.0 167 50.4Basin <strong>and</strong> Range 89,862 35.8 64.2 32.0 32.3 11.5 18 19.3Mississippi Portal 86,800 27.1 72.9 37.3 35.6 8.1 82 29.71Resource region <strong>and</strong> residence are defined in box, “Geographic Units,” on page 16.2Alaska <strong>and</strong> Hawaii are excluded to be consistent with the Agricultural Resource Management Survey.Sources: USDA, National Agricultural Statistics Service <strong>and</strong> Economic Research Service, 2007 Agricultural Resource Management Survey,Phase III. U.S. Department <strong>of</strong> Commerce, U.S. Census Bureau for 2007 population estimates. U.S. Department <strong>of</strong> Commerce, U.S. CensusBureau, 2000 Population Census for l<strong>and</strong> area.Within each region, the share <strong>of</strong> farms in metro areas is generally <strong>of</strong> the samemagnitude as for the United States as a whole, 39 percent plus or minus a fewpercentage points. Two regions, however, st<strong>and</strong> out: the Fruitful Rim <strong>and</strong> theNorthern Great Plains.The Extremes: Fruitful Rim <strong>and</strong> Northern Great PlainsSixty-seven percent <strong>of</strong> farms in the Fruitful Rim are located in metro areas,28 percentage points more than the rate for all U.S. farms (see table 5).California alone accounts for 37 percent <strong>of</strong> metro farms in the region, a largershare than any other State. Metro counties in California <strong>of</strong>ten are extensive<strong>and</strong> have room for both farming <strong>and</strong> a large urban population. For example,Fresno County is classified as metro, has a 2007 population estimate at899,300, <strong>and</strong> has a l<strong>and</strong> area <strong>of</strong> about 6,000 square miles (slightly largerthan Connecticut). <strong>Farm</strong> sales total $3.7 billion in the county, compared with$3.2 billion in the six New Engl<strong>and</strong> States, according to the 2007 Census <strong>of</strong>Agriculture.In contrast to the Fruitful Rim, only 16 percent <strong>of</strong> farms in the NorthernGreat Plains are located in metro areas. This is less than half the 39-percentshare for all U.S. farms, which reflects the region’s small population. Totalpopulation <strong>of</strong> the region is only 3 million—or 11 people per square mile—<strong>and</strong> only 8 percent <strong>of</strong> the region’s counties are classified as metro. The large18<strong>Structure</strong> <strong>and</strong> <strong>Finances</strong> <strong>of</strong> U.S. <strong><strong>Farm</strong>s</strong>: <strong>Family</strong> <strong>Farm</strong> <strong>Report</strong>, 2010 Edition / EIB-66Economic Research Service/USDA
majority <strong>of</strong> farms in the region, 65 percent, are in noncore nonmetro areas,with no urban concentration <strong>of</strong> 10,000 people or more. Fewer <strong>of</strong>f-farm jobopportunities in such sparsely settled areas, combined with economies <strong>of</strong>scale in farming, may contribute to the region’s high share <strong>of</strong> farms withsales <strong>of</strong> at least $100,000.Metropolitan Production<strong><strong>Farm</strong>s</strong> in metro areas account for 40 percent <strong>of</strong> the value <strong>of</strong> U.S. agriculturalproduction (table 6) <strong>and</strong> have a product mix different than farms in nonmetroareas. High-value crops <strong>and</strong> dairy products make up a larger share <strong>of</strong> productionin metro areas than in nonmetro areas, while cash grains <strong>and</strong> beef makeup a smaller share. The mix <strong>of</strong> production in metro areas, however, reflectsthe production mix in the Fruitful Rim, which accounts for 43 percent <strong>of</strong> allmetro production.In the metro Fruitful Rim, high-value crops make up the largest share <strong>of</strong>the value <strong>of</strong> production (52 percent), followed by livestock (35 percent),particularly dairy production (24 percent). In metro areas in other regions, thelargest sources <strong>of</strong> production are a diverse livestock sector (50 percent), cashgrains <strong>and</strong> soybeans (27 percent), <strong>and</strong> high-value crops (16 percent).Table 6Composition <strong>of</strong> the value <strong>of</strong> production by residence <strong>and</strong> region, 2007MetropolitanOther NonmetropolitanItemTotal Fruitful Rim regionsAll farmsNumberTotal U.S. farms 859,274 174,261 685,013 1,337,517 2,196,791Billion dollarsValue <strong>of</strong> production 115.7 49.5 66.3 176.2 292.0Percent <strong>of</strong> U.S. totalDistribution <strong>of</strong>:<strong><strong>Farm</strong>s</strong> 39.1 7.9 31.2 60.9 100.0Value <strong>of</strong> production 39.6 16.9 22.7 60.4 100.0PercentComposition <strong>of</strong> value <strong>of</strong> production:Cash grain <strong>and</strong> soybeans 1 16.6 2.1 27.4 31.1 25.3Other field crops 8.2 10.3 6.7 7.1 7.5High-value crops 2 31.7 52.4 16.3 6.1 16.2Livestock 43.4 35.2 49.6 55.8 50.9Beef 10.6 7.2 13.1 26.6 20.3Hogs 3.3 0.0 5.7 7.6 5.9Dairy 18.3 24.3 13.7 9.0 12.7Poultry 9.4 1.7 15.2 11.3 10.6Other livestock 1.9 2.1 1.8 1.2 1.5Note: Resource regions, metropolitan, <strong>and</strong> nonmetropolitan are defined in box, “GeographicUnits,” on page 16.1Includes barley, corn, oats, rice, sorghum, soybeans, wheat, <strong>and</strong> oats.2Vegetables, fruits <strong>and</strong> tree nuts, <strong>and</strong> nursery <strong>and</strong> greenhouse products.Source: USDA, National Agricultural Statistics Service <strong>and</strong> Economic Research Service, 2007Agricultural Resource Management Survey, Phase III.19<strong>Structure</strong> <strong>and</strong> <strong>Finances</strong> <strong>of</strong> U.S. <strong><strong>Farm</strong>s</strong>: <strong>Family</strong> <strong>Farm</strong> <strong>Report</strong>, 2010 Edition / EIB-66Economic Research Service/USDA
California farms heavily influence the composition <strong>of</strong> production in metroareas <strong>of</strong> the Fruitful Rim, since California alone accounts for 65 percent<strong>of</strong> all production in the metro parts <strong>of</strong> the region. The valleys <strong>of</strong> Californiawere irrigated by the late 1800s <strong>and</strong> have specialized in high-value cropsever since (Cochrane, 1993, pp. 88-93). Irrigation—in combination with theState’s climate—enables farmers to harvest some crops more than once peryear.The composition <strong>of</strong> production in metro areas in regions other than theFruitful Rim shares some characteristics with the composition in nonmetroareas. In nonmetro areas <strong>and</strong> in non-Rim metro areas, livestock makes upabout one-half <strong>of</strong> production, <strong>and</strong> cash grains make up roughly 30 percent.The composition <strong>of</strong> the livestock sector varies between the two areas,however, with beef <strong>and</strong> hogs forming a larger share in nonmetro areas, <strong>and</strong>dairy <strong>and</strong> poultry forming a larger share in metro areas outside the Rim. Inaddition, the share <strong>of</strong> production from high-value crops is more than twice ashigh in non-Rim metro counties as in nonmetro counties.20<strong>Structure</strong> <strong>and</strong> <strong>Finances</strong> <strong>of</strong> U.S. <strong><strong>Farm</strong>s</strong>: <strong>Family</strong> <strong>Farm</strong> <strong>Report</strong>, 2010 Edition / EIB-66Economic Research Service/USDA
<strong>Farm</strong> Operators, Principal <strong>and</strong> SecondaryEvery farm has at least one operator, the farmer who makes everyday decisionsabout the farm business. However, some farms—particularly the largerones—have more than one operator who makes decisions. In such cases, oneoperator is designated as the principal operator, the one most responsible forrunning the farm. The others are secondary operators.Commercial-sized farms <strong>of</strong>ten require more management <strong>and</strong> labor than anindividual can provide. Additional operators can provide the necessary labor<strong>and</strong> management <strong>and</strong> possibly other resources, such as capital or farml<strong>and</strong>.Having a secondary operator may also provide a successor when an olderprincipal operator phases out <strong>of</strong> farming.Secondary Operators <strong>and</strong> Their <strong><strong>Farm</strong>s</strong>There are secondary operators on 880,500 multiple-operator farms (table7). Because farms are generally family businesses, one would expectTable 7Multiple-operator farms by farm type, 2007Small family farms<strong>Farm</strong>ing-occupation Large-scale farmsItemRetirementResidential/lifestyleLowsalesMediumsalesLarge Very largeNonfamilyfarms All farmsNumberTotal operators 549,919 1,449,899 597,035 163,098 149,068 193,827 96,717 3,199,563Principal operators 1 403,828 989,830 434,599 111,389 93,601 110,152 53,393 2,196,791Secondary operators 146,091 460,070 162,437 51,709 55,467 83,675 43,325 1,002,772Spouses 102,458 356,660 123,998 35,091 31,413 33,581 5,245 688,447Other 43,633 103,410 38,439 16,617 24,054 50,093 38,080 314,326Percent <strong>of</strong> farms<strong><strong>Farm</strong>s</strong> with:Spouse as an operator 25.4 36.0 28.5 31.5 33.6 30.5 9.8 31.3Other secondary operator(s) 8.1 8.6 7.5 11.5 18.7 30.5 45.1 10.9Both 1.7 1.7 1.6 3.2 4.1 6.5 3.5 2.1Percent <strong>of</strong> secondary operatorsSpouse share <strong>of</strong>secondary operators 70.1 77.5 76.3 67.9 56.6 40.1 12.1 68.7Operators (principal <strong>and</strong>Numbersecondary) per farm 1.4 1.5 1.4 1.5 1.6 1.8 1.8 1.5Multiple-operator farms 2 128,112 425,748 149,766 44,309 45,037 60,067 27,422 880,460PercentMultiple-operator farmsas share <strong>of</strong> all farms 31.7 43.0 34.5 39.8 48.1 54.5 51.4 40.1Note: The Agricultural Resource Management Survey counts all operators—principal <strong>and</strong> secondary—<strong>and</strong> asks for detailed information on up tothree operators.1The number <strong>of</strong> principal operators equals the number <strong>of</strong> farms. Each farm has one principal operator.2Mulitiple-operator farms report more than one operator . .Source: USDA, National Agricultural Statistics Service <strong>and</strong> Economic Research Service, 2007 Agricultural Resource Management Survey, Phase III.21<strong>Structure</strong> <strong>and</strong> <strong>Finances</strong> <strong>of</strong> U.S. <strong><strong>Farm</strong>s</strong>: <strong>Family</strong> <strong>Farm</strong> <strong>Report</strong>, 2010 Edition / EIB-66Economic Research Service/USDA
family members to serve as secondary operators. In fact, 69 percent <strong>of</strong> thesecondary operators—688,400 out <strong>of</strong> 1 million—are spouses. (The number<strong>of</strong> secondary operators is 14 percent greater than the number <strong>of</strong> multipleoperatorfarms because some multiple-operator farms have more than onesecondary operator.)As one would expect, the number <strong>of</strong> operators per farm is higher for largescalefarms. The number <strong>of</strong> operators per farm reaches 1.8 operators, onaverage, for very large family farms <strong>and</strong> nonfamily farms. The share <strong>of</strong>family farms with two or more operators peaks at 55 percent on very largefarms, 15 percentage points higher than the share for all U.S. farms. About43 percent <strong>of</strong> residential/lifestyle farms have multiple operators—more thanthe corresponding share for other small-farm types—reflecting the highershare <strong>of</strong> residential/lifestyle farms where spouses are operators.About 16 percent <strong>of</strong> all multiple-operator farms (<strong>and</strong> 6 percent <strong>of</strong> all farms)are multiple-generation farms, with at least 20 years’ difference betweenthe ages <strong>of</strong> the oldest <strong>and</strong> youngest operators. Multiple-generation farms aremost common among large-scale <strong>and</strong> nonfamily farms (fig. 7), which haveenough business to keep more than one generation employed.Aging Principal OperatorsPerhaps the most striking characteristic <strong>of</strong> principal farm operators is theiradvanced age. About 28 percent <strong>of</strong> farm operators are at least 65 years old(table 8). In contrast, only 8 percent <strong>of</strong> self-employed workers in nonagriculturalindustries are that old (USDOL, BLS, 2008, p. 224). Retired operatorsFigure 7Multiple-operator <strong>and</strong> multiple-generation farms by farm type, 2007Multiple-generation farms are most common among large-scale <strong>and</strong> nonfamily farmsPercent <strong>of</strong> farms in group706050403020100Retirement Residential/lifestyleLow-sales Medium-sales<strong>Farm</strong>ing-occupationLargeMultiple-operator <strong>and</strong> multiple-generationMultiple-operator but not multiple-generationVery large Nonfamily All farmsSmall family farms(sales less than $250,000)Large-scalefamily farmsNotes: Multiple-operator farms have more than one operator. Multiple-generation farms are multiple-operator farms with a difference <strong>of</strong> atleast 20 years between the ages <strong>of</strong> the youngest <strong>and</strong> oldest operators. The remaining farms are single-operator farms with only oneoperator (not shown).Source: USDA, National Agricultural Statistics Service <strong>and</strong> Economic Research Service, 2007 Agricultural Resource Management Survey,Phase III.22<strong>Structure</strong> <strong>and</strong> <strong>Finances</strong> <strong>of</strong> U.S. <strong><strong>Farm</strong>s</strong>: <strong>Family</strong> <strong>Farm</strong> <strong>Report</strong>, 2010 Edition / EIB-66Economic Research Service/USDA
farms. Since these farmers produce only 2 percent <strong>of</strong> U.S. output, theirimpact on U.S. agriculture as they leave farming entirely should be minimal.Their 14-percent share <strong>of</strong> assets does not contribute substantially to their ownproduction, although they may rent l<strong>and</strong> to other operators. About 22 percent<strong>of</strong> the l<strong>and</strong> they own is rented out, <strong>and</strong> another 13 percent is enrolled in l<strong>and</strong>retirementprograms.Low- <strong>and</strong> medium-sales farms with an older operator account for another 8percent <strong>of</strong> all U.S. farms, 9 percent <strong>of</strong> assets, but only 3 percent <strong>of</strong> production.Only a small portion <strong>of</strong> these farms are multiple generation, with ayounger operator present to take the place <strong>of</strong> the exiting older operator.Multiple-generation farms in this group account for roughly 1 percent <strong>of</strong> theNation’s farms <strong>and</strong> assets, so the assets to be absorbed as these operators exitamount to 8 percent <strong>of</strong> total U.S. farm assets.Large-Scale <strong>and</strong> Nonfamily <strong><strong>Farm</strong>s</strong>Most <strong>of</strong> the production by older farmers occurs on large-scale farms <strong>and</strong>nonfamily farms. Older operators on these farms account for 12 percent<strong>of</strong> U.S. production but only 2 percent <strong>of</strong> farms <strong>and</strong> 6 percent <strong>of</strong> assets.However, some <strong>of</strong> these farms are multiple-generation operations. The largescale<strong>and</strong> nonfamily farms with no apparent replacement secondary operator—atleast in the ARMS data—account for 4 percent <strong>of</strong> all farm assets,which would have to be absorbed by other operations as the current operatorsexit. These single-generation farms also account for about 7 percent <strong>of</strong> U.Sproduction, nearly double their share <strong>of</strong> assets.Figure 8Older principal operators’ share <strong>of</strong> farms, farm assets, <strong>and</strong> production, 2007Most older farmers operate retirement or residential/lifestyle farmsPercent <strong>of</strong> U.S. farms, farm assets, or production20181614121086420RetirementorresidentialOlder operators’share = 27.6%Low- ormediumsalesLarge-scaleornonfamilyRetirementorresidentialOlder operators’share = 29.6%Low- ormediumsalesLarge-scaleornonfamilyMultiple-generation farmsSingle-generation farmsOlder operators’share = 16.1%RetirementorresidentialLow- ormediumsales<strong><strong>Farm</strong>s</strong> <strong>Farm</strong> assets Value <strong>of</strong> productionLarge-scaleornonfamilyNote: Older operators are at least 65 years old.Source: USDA, National Agricultural Statistics Service <strong>and</strong> Economic Research Service, 2007 Agricultural Resource Management Survey,Phase III.24<strong>Structure</strong> <strong>and</strong> <strong>Finances</strong> <strong>of</strong> U.S. <strong><strong>Farm</strong>s</strong>: <strong>Family</strong> <strong>Farm</strong> <strong>Report</strong>, 2010 Edition / EIB-66Economic Research Service/USDA
Total Assets To AbsorbThe amount <strong>of</strong> productive assets available to be absorbed by the sector tomaintain production as older operators exit is not the 30 percent <strong>of</strong> all U.S.farm assets held by all older farmers. The share to be absorbed is the 12percent used by older operators on commercially oriented farms—low- <strong>and</strong>medium-sales farms, plus large-scale <strong>and</strong> nonfamily farms—that are notmultiple-generation operations. The 12-percent estimate overstates the share<strong>of</strong> assets to be absorbed, however, since 37 percent <strong>of</strong> nonfamily farms havesales less than $10,000 (see table 2) <strong>and</strong> are not commercially oriented.Some <strong>of</strong> these assets can be purchased or rented by farms with youngeroperators currently in business. Other assets could be absorbed by new farmsentering the business. Analysis <strong>of</strong> longitudinal data compiled from Census <strong>of</strong>Agriculture data shows that a substantial number <strong>of</strong> farms exit the sector, orgo out <strong>of</strong> business, between censuses. Entrances <strong>of</strong> new farms, however, arealso fairly high, largely <strong>of</strong>fsetting exits. Like other industries, farming hassubstantial turnover (Hoppe <strong>and</strong> Korb, 2006, pp. 7-10).25<strong>Structure</strong> <strong>and</strong> <strong>Finances</strong> <strong>of</strong> U.S. <strong><strong>Farm</strong>s</strong>: <strong>Family</strong> <strong>Farm</strong> <strong>Report</strong>, 2010 Edition / EIB-66Economic Research Service/USDA
<strong>Farm</strong> Income <strong>and</strong> Financial PerformancePr<strong>of</strong>itability measures are strongly associated with farm size. The averagerates <strong>of</strong> return on assets <strong>and</strong> equity <strong>and</strong> the average operating pr<strong>of</strong>it marginare negative for retirement, residential/lifestyle, <strong>and</strong> low-sales small farms(table 9). These measures turn positive for medium-sales small farms, <strong>and</strong>increase further for large-scale <strong>and</strong> nonfamily farms. The ratios are higherfor very large farms than for large farms, reflecting very large farms’ higherlevel <strong>of</strong> sales. Larger farms <strong>of</strong>ten can use their resources more productivelythan smaller farms, generating more dollars <strong>of</strong> sales per unit <strong>of</strong> labor <strong>and</strong>capital. (See box, “Defining the Financial Measures,” for information on howthe ratios are calculated.)Average pr<strong>of</strong>it measures, however, obscure the wide variation in financialperformance among farms, including small farms. Although 45 to 75 percent<strong>of</strong> the farms in each small-farm type had a negative operating pr<strong>of</strong>it marginin 2007, other small farms among these types were much more pr<strong>of</strong>itable (fig.9). For example, between 17 percent <strong>and</strong> 32 percent <strong>of</strong> each small-farm typehad an operating pr<strong>of</strong>it margin <strong>of</strong> at least 20 percent. Nevertheless, an evengreater share <strong>of</strong> large-scale family farms had pr<strong>of</strong>it margins that high—45percent for large family farms <strong>and</strong> 54 percent for very large family farms. Inaddition, most <strong>of</strong> the farms in both <strong>of</strong> these groups had a positive operatingpr<strong>of</strong>it margin.Net <strong>Farm</strong> IncomeSmall farms appear more pr<strong>of</strong>itable if net farm income is examined ratherthan operating pr<strong>of</strong>it margins. Although most small farms had a negativeoperating pr<strong>of</strong>it margin, a majority <strong>of</strong> each small-farm type generated positivenet farm income (see table 9). The different results are attributed mostlyto differences in the way the two measures treat unpaid labor by the operatorFigure 9<strong><strong>Farm</strong>s</strong> by operating pr<strong>of</strong>it margin <strong>and</strong> farm type, 2007Small family farms are more likely to have a negative operating pr<strong>of</strong>it margin than large-scale family farmsPercent <strong>of</strong> group100755025Operatingpr<strong>of</strong>it margin:20% or more10% to 19.9%0% to 9.9%Less than 0%0RetirementResidential/lifestyleSmall family farms(sales less than $250,000)Low-sales Medium-sales<strong>Farm</strong>ing-occupationLargeLarge-scalefamily farmsVery large Nonfamily All farmsNote: Operating pr<strong>of</strong>it margin = 100% X (net farm income + interest paid – charges for operator <strong>and</strong> unpaid labor – chargefor management) / gross farm income.Source: USDA, National Agricultural Statistics Service <strong>and</strong> Economic Research Service, 2007 Agricultural ResourceManagement Survey, Phase III.26<strong>Structure</strong> <strong>and</strong> <strong>Finances</strong> <strong>of</strong> U.S. <strong><strong>Farm</strong>s</strong>: <strong>Family</strong> <strong>Farm</strong> <strong>Report</strong>, 2010 Edition / EIB-66Economic Research Service/USDA
<strong>and</strong> other persons. Operating pr<strong>of</strong>it—the numerator <strong>of</strong> the operating pr<strong>of</strong>itmargin—is calculated with a deduction for unpaid labor to reflect the opportunitycost <strong>of</strong> labor provided without payment. Net farm income, in contrast,makes no such deduction (Hoppe et al., 2010).Average net farm income varies with sales class <strong>and</strong> is low for small farms,compared with that for large <strong>and</strong> very large family farms. The variation in netincome reflects the wide variation in gross farm income, which ranges fromroughly $25,000 for the average retirement <strong>and</strong> residential/lifestyle farm to$1.3 million for very large family farms, on average.Table 9Selected financial performance measures by farm type, 2007Small family farmsResidential/lifestyle<strong>Farm</strong>ing-occupationLarge-scale farmsNonfamilyfarmsItemRetirementLow-sales Medium-sales Large Very largeAll farmsNumberTotal farms 403,828 989,830 434,599 111,389 93,601 110,152 53,393 2,196,791PercentPr<strong>of</strong>itability measures:Rate <strong>of</strong> return on assets -1.0 -2.3 -2.8 0.9 3.5 9.9 9.3 1.8Rate <strong>of</strong> return on equity -1.2 -2.9 -3.4 0.3 3.0 10.2 9.4 1.2Operating pr<strong>of</strong>it margin -23.1 -47.4 -48.6 5.9 16.3 25.7 24.4 11.0Dollars per farmIncome measures:Gross farm income 25,073 23,217 43,090 204,305 398,975 1,301,408 864,548 137,222Net farm income 7,687 2,206 5,049 54,693 109,725 372,297 230,562 35,126Percent<strong><strong>Farm</strong>s</strong> with positivenet farm income 68.7 54.9 60.6 81.0 82.9 83.8 73.0 63.0Financial efficiency measure:Operating expense ratio 91.7 126.4 105.2 77.1 73.9 70.6 72.0 77.2Thous<strong>and</strong> dollars per farmBalance sheet:Total assets 591 488 740 1,310 1,846 3,380 2,281 845Total liabilities 10 29 35 99 197 528 231 67Net worth 581 459 705 1,211 1,649 2,852 2,050 778PercentSolvency measure:Debt/asset ratio 1.8 5.9 4.7 7.6 10.6 15.6 10.1 8.0Solvency <strong>and</strong> income measure:Financial position:Favorable 68.4 53.2 59.0 76.2 76.1 72.5 69.8 60.6Marginal-income 30.6 40.1 37.5 17.2 14.8 12.2 25.1 33.8Marginal-solvency d 1.8 1.7 4.7 6.8 11.4 3.2 2.4Vulnerable d 5.0 1.9 1.9 2.3 3.9 1.9 3.2Note: See box, “Defining the Financial Measures,” for details on how the financial performance measures are calculated.d = Data suppressed due to insufficient observations.Source: USDA, National Agricultural Statistics Service <strong>and</strong> Economic Research Service, 2007 Agricultural Resource Management Survey,Phase III.27<strong>Structure</strong> <strong>and</strong> <strong>Finances</strong> <strong>of</strong> U.S. <strong><strong>Farm</strong>s</strong>: <strong>Family</strong> <strong>Farm</strong> <strong>Report</strong>, 2010 Edition / EIB-66Economic Research Service/USDA
Defining the Financial MeasuresSome <strong>of</strong> the financial measures used in table 9 are discussed below. The discussion focuses on the moreinvolved financial ratios <strong>and</strong> show how they are calculated in the Agricultural Resource Management Survey(ARMS).Rate <strong>of</strong> return on assets. The ratio <strong>of</strong> net farm income to the assets <strong>of</strong> the farm. This ratio is <strong>of</strong>ten viewed as anindex <strong>of</strong> pr<strong>of</strong>itability, with higher values indicating greater pr<strong>of</strong>itability. It is calculated as:Rate <strong>of</strong> return on assets = 100% × (net farm income + interest paid - charge for operator <strong>and</strong> unpaid labor -charge for management) ÷ total assetsInterest paid is added back into net farm income because it is the cost <strong>of</strong> borrowing capital <strong>and</strong> is part <strong>of</strong> thereturn to assets. In the case <strong>of</strong> unincorporated farms, a charge for operator <strong>and</strong> unpaid labor <strong>and</strong> a charge formanagement are deducted from net farm income to reflect their opportunity cost.Rate <strong>of</strong> return on equity. The ratio <strong>of</strong> net farm income to the net worth <strong>of</strong> the farm. As with the rate <strong>of</strong> returnon assets, it is viewed as an index <strong>of</strong> pr<strong>of</strong>itability, with higher values indicating greater pr<strong>of</strong>itability. It is calculatedas:Return on equity = 100% × (net farm income - charge for operator <strong>and</strong> unpaid labor - charge for management) ÷net worthInterest paid is not added back into net farm income in this case because the returns to the assets that are ownedby the farm are <strong>of</strong> concern, not those financed through borrowing.Operating pr<strong>of</strong>it margin. A measure <strong>of</strong> pr<strong>of</strong>itability: returns per dollar <strong>of</strong> gross farm income (or gross revenue).The operating pr<strong>of</strong>it margin measures the funds available to finance the farm business’s capital, after accountingfor the unpaid labor <strong>and</strong> management contributed by farm operators <strong>and</strong> their families. It is calculated as:Operating pr<strong>of</strong>it margin = 100% × (net farm income + interest paid - charges for operator <strong>and</strong> unpaid labor -charge for management) ÷ gross farm incomeOperating expense ratio. The ratio <strong>of</strong> cash operating expenses to gross cash farm income. If the ratio is greaterthan 100 percent, cash income does not cover cash expenses. It is calculated as:Operating expense ratio = 100% × total cash operating expenses ÷ gross cash farm incomeDebt/Asset ratio. Ratio <strong>of</strong> the farm’s total debt to total assets, showing the share <strong>of</strong> assets owed to creditors. Itis a measure <strong>of</strong> the risk exposure <strong>of</strong> the farm business, with a higher ratio corresponding to greater risk.Debt/asset ratio = 100% × total debt ÷ total assetsFinancial position. Measure <strong>of</strong> the overall financial position <strong>of</strong> farms based on their combined net income <strong>and</strong>solvency status:· Favorable: positive net farm income <strong>and</strong> debt/asset ratio no more than 40 percent.· Marginal-income: negative net farm income <strong>and</strong> debt/asset ratio no more than 40 percent· Marginal-solvency: positive net farm income <strong>and</strong> debt/asset ratio greater than 40 percent.· Vulnerable: negative net farm income <strong>and</strong> debt/asset ratio greater than 40 percent.For more information about farm financial measures, see Financial Guidelines for Agricultural Producers (<strong>Farm</strong>Financial St<strong>and</strong>ards Council, 2008).28<strong>Structure</strong> <strong>and</strong> <strong>Finances</strong> <strong>of</strong> U.S. <strong><strong>Farm</strong>s</strong>: <strong>Family</strong> <strong>Farm</strong> <strong>Report</strong>, 2010 Edition / EIB-66Economic Research Service/USDA
Overall, net farm income averaged $35,100 in 2007, or 46 percent higherthan in 2006. Sixty-three percent <strong>of</strong> all farms earned positive net farmincome in 2007, <strong>and</strong> these pr<strong>of</strong>itable farms accounted for the bulk <strong>of</strong> agriculturalactivity. They generated 81 percent <strong>of</strong> the total value <strong>of</strong> production <strong>and</strong>operated 70 percent <strong>of</strong> the l<strong>and</strong> in farms.Selected Financial RatiosResidential/lifestyle farms had an operating expense ratio <strong>of</strong> 126 percent—on average—in 2007, which means that cash operating expenses exceededgross cash farm income by 26 percent. Cash expenses also exceeded grosscash income for low-sales farms, but the ratio was lower, at 105 percent, nearthe 100-percent breakeven point. Retirement farms covered their expenses,with a ratio <strong>of</strong> 92 percent. The remaining farm types also generated enoughincome to cover expenses, on average, with their operating expense ratiosfalling in a fairly narrow range, from 71 to 77 percent.The low debt/asset ratio for retirement farms—2 percent—reflects low debtlevels rather than high asset levels. At the other extreme, the ratio for verylarge family farms is 16 percent, or double the rate for all U.S. farms. As aresult <strong>of</strong> their high debt/asset ratio, very large farms are most likely to beconsidered marginally solvent (positive net farm income, but with a debt/asset ratio above 40 percent).Most U.S. farms have a favorable financial position, which means theygenerate positive returns <strong>and</strong> have a debt/asset ratio no more than 40 percent.Sixty-one percent <strong>of</strong> U.S. farms <strong>and</strong> at least 53 percent <strong>of</strong> each farm typewere classified as such in 2007. Vulnerable farms—with negative net income<strong>and</strong> a debt/asset ratio above 40 percent—are rare in all farm types, <strong>and</strong>amount to 3 percent <strong>of</strong> all farms. Residential/lifestyle farms make up 71percent <strong>of</strong> the vulnerable group, but their operators are unlikely to depend onthe farm for their livelihood.29<strong>Structure</strong> <strong>and</strong> <strong>Finances</strong> <strong>of</strong> U.S. <strong><strong>Farm</strong>s</strong>: <strong>Family</strong> <strong>Farm</strong> <strong>Report</strong>, 2010 Edition / EIB-66Economic Research Service/USDA
Operator Household Income <strong>and</strong> Net Worth 5Given their negative operating pr<strong>of</strong>it margins <strong>and</strong> low net farm income, onaverage, how do so many small farms continue to exist? Households operatingsmall farms typically receive substantial <strong>of</strong>f-farm income. In 2007,average <strong>of</strong>f-farm income for small-farm households ranged from just under$50,000 for low- <strong>and</strong> medium-sales households to $107,700 for householdsoperating residential/lifestyle farms (table 10). Most <strong>of</strong>f-farm income—76percent for all U.S. farm households—is from earned sources, either awage-<strong>and</strong>-salary job or self-employment. However, households operatingretirement farms receive nearly three-fifths <strong>of</strong> their <strong>of</strong>f-farm income fromunearned sources (such as Social Security, pensions, dividends, interest, <strong>and</strong>rent), reflecting the advanced age <strong>of</strong> operators on those farms.5See “Appendix III: Measuring OperatorHousehold Income <strong>and</strong> Net Worth,”for more information on how operatorhousehold income <strong>and</strong> net worth aremeasured <strong>and</strong> defined.Participation in <strong>of</strong>f-farm work varies by farm type. At one extreme, neitherthe operator nor spouse worked <strong>of</strong>f-farm on 66 percent <strong>of</strong> retirement farms.At the other extreme, both the operator <strong>and</strong> spouse worked <strong>of</strong>f-farm on 57percent <strong>of</strong> residential/lifestyle farms. In the remaining farm types, someone—the operator <strong>and</strong>/or the spouse—worked <strong>of</strong>f-farm in 43 to 59 percent <strong>of</strong> farmhouseholds.Level <strong>of</strong> Operator Household IncomeAverage operator household income for all farm households was $88,900in 2007, about 9 percent higher than in 2006. The 2007 estimate also wasabout 32 percent higher than the average for all U.S households in 2007, asmeasured by the Current Population Survey.Mean income, however, may not be the best income measure to use forsuch comparisons because a few very high-income households can raise themean well above the income received by most households. Median incomefor farm households as a group is similar to that for all U.S. households (fig.10). Median farm-operator household income in 2007 was $54,000, only8 percent higher than the $50,200 median for all U.S. households. <strong>Farm</strong>operator households in general cannot be considered low income. Only twotypes <strong>of</strong> farm households—those operating retirement or low-sales farms—received median household income below the U.S. median.Operator Household Net WorthThe income that farm operator households receive from farming does notreflect the large net worth <strong>of</strong> many farm households. For example, for householdson farms with gross sales <strong>of</strong> at least $100,000, average net worth in2007 ranged from $1.3 million for medium-sales farms to $2.5 million forvery large family farms (table 10).Unlike household income, most <strong>of</strong> which comes from <strong>of</strong>f-farm sources,net worth from the farm makes up most <strong>of</strong> the wealth <strong>of</strong> farm households,regardless <strong>of</strong> farm type. The farm—on average—accounts for 76 percent30<strong>Structure</strong> <strong>and</strong> <strong>Finances</strong> <strong>of</strong> U.S. <strong><strong>Farm</strong>s</strong>: <strong>Family</strong> <strong>Farm</strong> <strong>Report</strong>, 2010 Edition / EIB-66Economic Research Service/USDA
Table 10Income <strong>and</strong> wealth <strong>of</strong> principal operator households by farm type, 2007ItemRetirementSmall family farmsResidential/lifestyle<strong>Farm</strong>ing-occupationLarge-scale farmsLow-sales Medium-sales Large Very largeNumberAll farmhouseholdsTotal households 403,828 989,830 434,599 111,389 93,601 110,152 2,143,398Dollars per householdMean household income 55,228 101,677 44,488 76,191 109,639 268,227 88,912<strong>Farm</strong> earnings 1 -1,990 -5,984 -5,070 29,018 63,027 226,490 11,733Off-farm income 57,219 107,661 49,559 47,173 46,613 41,736 77,179Earned 2 24,367 93,750 30,286 34,015 32,597 28,462 58,680Unearned 2 32,851 13,911 19,273 13,158 14,016 13,275 18,499PercentShare <strong>of</strong> income from <strong>of</strong>f-farm 3 103.6 105.9 111.4 61.9 42.5 15.6 86.8Off-farm work—principal operator <strong>and</strong> spouse: 4Only operator 5 13.4 35.6 8.0 8.4 9.1 6.5 21.9Only spouse 11.1 1.8 23.5 31.3 32.7 35.8 12.5Neither 6 66.3 5.4 56.8 47.6 41.3 47.5 33.0Both 9.3 57.1 11.7 12.7 16.9 10.2 32.6Dollars per householdMean household net worth 755,221 681,151 856,901 1,295,837 1,689,448 2,529,375 901,700<strong>Farm</strong> net worth 553,722 435,143 677,194 1,131,456 1,488,501 2,270,032 683,046Nonfarm net worth 201,498 246,008 179,706 164,380 200,948 259,343 218,654PercentShare <strong>of</strong> net worthfrom the farm 73.3 63.9 79.0 87.3 88.1 89.7 75.8Note: Household income <strong>and</strong> net worth are calculated only for family farms.1<strong>Farm</strong> earnings in this table <strong>and</strong> net farm income in table 9 are not directly comparable. Net farm income includes cash <strong>and</strong> noncash items,is based on accrual accounting, <strong>and</strong> is calculated for the farm business. <strong>Farm</strong> earnings—in contrast—are based on cash items only, with theexception <strong>of</strong> a deduction for depreciation. <strong>Farm</strong> earnings also exclude the share <strong>of</strong> net income generated by the farm paid to other households,such as those <strong>of</strong> partners.2Earned income comes from <strong>of</strong>f-farm self-employment or wage or salary jobs. Unearned income includes interest <strong>and</strong> dividends, benefitsfrom Social Security <strong>and</strong> other public programs, alimony, annuities, net income <strong>of</strong> estates or trusts, private pensions, regular contributions <strong>of</strong>persons not living in the household, net rental income from nonfarm properties, <strong>and</strong> royalties for mineral leases.3Income from <strong>of</strong>f-farm sources can be more than 100 percent <strong>of</strong> total household income if farm earnings are negative.4Data on <strong>of</strong>f-farm work by principal operators <strong>and</strong> their spouses were collected only in version 1 <strong>of</strong> the 2007 ARMS.5Includes households where the operator works <strong>of</strong>f-farm <strong>and</strong> there is no spouse.6Includes households where the operator does not work <strong>of</strong>f-farm <strong>and</strong> there is no spouse.Source: USDA, National Agricultural Statistics Service <strong>and</strong> Economic Research Service, 2007 Agricultural Resource Management Survey,Phase III.31<strong>Structure</strong> <strong>and</strong> <strong>Finances</strong> <strong>of</strong> U.S. <strong><strong>Farm</strong>s</strong>: <strong>Family</strong> <strong>Farm</strong> <strong>Report</strong>, 2010 Edition / EIB-66Economic Research Service/USDA
<strong>of</strong> operator household net worth, reflecting the value <strong>of</strong> the l<strong>and</strong> used infarming. However, much <strong>of</strong> the net worth <strong>of</strong> farm households is illiquid <strong>and</strong>not easily available to spend for consumption because it is largely based onassets necessary to continue farming. Real estate amounted to 79 percent <strong>of</strong>total assets <strong>of</strong> family farms.Figure 10Median income <strong>of</strong> principal-operator households by farm type, 2007In aggregate, operator households income is similar to that <strong>of</strong> all U.S. households$1,000 per household150125100Median income, all U.S.households ($50,200)7550250RetirementResidential/lifestyleLow-sales Medium-sales<strong>Farm</strong>ing occupationLargeVery largeAll operatorhouseholdsSmall family farms(sales less than $250,000)Large-scalefamily farmsNote: Median income falls at the midpoint <strong>of</strong> the distribution <strong>of</strong> households ranked by income. Half <strong>of</strong> the households have incomeabove the median, while the other half have income below that level.Sources: USDA, National Agricultural Statistics Service <strong>and</strong> Economic Research Service, 2007 Agricultural Resource ManagementSurvey, Phase III, for farm households. U.S. Department <strong>of</strong> Commerce, U.S. Census Bureau, Current Population Survey forall U.S. households.32<strong>Structure</strong> <strong>and</strong> <strong>Finances</strong> <strong>of</strong> U.S. <strong><strong>Farm</strong>s</strong>: <strong>Family</strong> <strong>Farm</strong> <strong>Report</strong>, 2010 Edition / EIB-66Economic Research Service/USDA
Government Payments<strong>Farm</strong> program payments can conveniently be sorted into two groups—commodity-related <strong>and</strong> conservation (see box, “Types <strong>of</strong> <strong>Farm</strong> ProgramPayments”). About 39 percent <strong>of</strong> farms received Government payments <strong>of</strong>some sort in 2007, but the relative importance <strong>of</strong> Government programsvaries widely by farm type (fig. 11). Medium-sales, large, <strong>and</strong> very largefarms were more likely to receive Government payments, especiallycommodity-related payments, than smaller farms.Commodity-Related ProgramsCommodity programs target specific commodities, largely feed <strong>and</strong> foodgrains, cotton, <strong>and</strong> oilseeds. Payments are tied to the amount <strong>of</strong> cropl<strong>and</strong>enrolled in programs <strong>and</strong> yield histories. Specialty crops (except dry peas,lentils, <strong>and</strong> chickpeas) <strong>and</strong> livestock (except dairy, wool, mohair, <strong>and</strong> honey)are not supported by traditional commodity programs. Producers <strong>of</strong> nonprogramcommodities—as well as producers <strong>of</strong> program commodities—mayalso receive disaster assistance <strong>and</strong> occasional ad hoc payments. <strong><strong>Farm</strong>s</strong>producing nonprogram commodities may receive substantial payments ifthey also produce program commodities or did so in the past.Types <strong>of</strong> <strong>Farm</strong> Program PaymentsThe 2007 Agricultural Resource Management Survey (ARMS) collected information about the followingfarm program payments:Commodity-related payments. Direct payments, countercyclical payments, loan deficiency payments,marketing loan gains, net value <strong>of</strong> commodity certificates, milk income loss contact payments, agriculturaldisaster payments, <strong>and</strong> any other miscellaneous State, Federal, <strong>and</strong> local payments. Participation in theseprograms generally requires present or past production <strong>of</strong> specific commodities.Goals: Establish price <strong>and</strong> farm income support, stabilize production, <strong>and</strong> provide a safety net for farmers.Conservation payments. There are two types <strong>of</strong> conservation payments:• Payments from l<strong>and</strong>-retirement programs. Includes the Conservation Reserve Program (CRP),the Wetl<strong>and</strong>s Reserve Program (WRP), the <strong>Farm</strong>able Wetl<strong>and</strong>s Reserve Program (FWP), <strong>and</strong> theConservation Reserve Enhancement Program (CREP).Goal: Remove environmentally sensitive farml<strong>and</strong> from production for long periods <strong>of</strong> time—at least10 years, or permanently, in some cases.• Payments from working-l<strong>and</strong> programs. Includes the Environmental Quality Incentives Program(EQIP) <strong>and</strong> the Conservation Security Program (CSP). These programs provide technical <strong>and</strong> financialassistance to farmers who install or maintain conservation practices on l<strong>and</strong> in production.Goal: Address environmental problems—such as pesticide <strong>and</strong> nutrient run<strong>of</strong>f—on l<strong>and</strong> in production.Since ARMS collects information from farm operators only, it excludes farm program payments made to peoplewho do not farm, mainly l<strong>and</strong>lords who are not farmers. In addition, the survey data show different levels <strong>and</strong>composition <strong>of</strong> Government payments than do administrative data, which are based on payment records. Formore information, see “Appendix IV: Government Payments—Survey Versus Administrative Data.”33<strong>Structure</strong> <strong>and</strong> <strong>Finances</strong> <strong>of</strong> U.S. <strong><strong>Farm</strong>s</strong>: <strong>Family</strong> <strong>Farm</strong> <strong>Report</strong>, 2010 Edition / EIB-66Economic Research Service/USDA
About three-fourths <strong>of</strong> medium-sales farms <strong>and</strong> large-scale farms receivecommodity-related payments, summing the share receiving only commodityrelatedpayments <strong>and</strong> the share receiving both commodity-related <strong>and</strong> conservationpayments. These farms collectively received 76 percent <strong>of</strong> commodityprogram benefits paid to farmers in 2007 (fig. 12), roughly proportional totheir production <strong>of</strong> program crops. Very large family farms alone received 45percent <strong>of</strong> commodity-related payments.Commodity-related payments in total are much larger than conservationpayments, accounting for 75 percent <strong>of</strong> all Government payments made t<strong>of</strong>armers in 2007 (fig. 13). Commodity-related payments also make up a largemajority <strong>of</strong> Government payments in each farm type, with the exceptions<strong>of</strong> retirement <strong>and</strong> residential/lifestyle farms. Commodity-related paymentsaccount for slightly less than half <strong>of</strong> total payments on residential/lifestylefarms <strong>and</strong> just over a quarter on retirement farms.Conservation ProgramsThe four USDA l<strong>and</strong>-retirement programs—CRP, CREP, WRP, <strong>and</strong> FWP—together make up 78 percent <strong>of</strong> all conservation payments paid to farms. TheCRP is the largest l<strong>and</strong>-retirement program by far, accounting for 74 percent<strong>of</strong> conservation payments by itself. Another 22 percent <strong>of</strong> conservationpayments come from working-l<strong>and</strong> programs: the Environmental QualityIncentives Program (EQIP) <strong>and</strong> the Conservation Security Program (CSP).EQIP <strong>and</strong> CSP have exp<strong>and</strong>ed in recent years (Claassen <strong>and</strong> Ribaudo, 2006,p. 171), but they still make up only 15 <strong>and</strong> 7 percent, respectively, <strong>of</strong> conservationpayments in the 2007 ARMS.Figure 11<strong><strong>Farm</strong>s</strong> receiving Government payments by type <strong>of</strong> payment <strong>and</strong> farm type, 2007Most medium-sales <strong>and</strong> large-scale farms receive Government paymentsPercent <strong>of</strong> farms in group100Type <strong>of</strong> payment received80Conservation onlyBoth types <strong>of</strong> payments60Commodity-related only40200RetirementResidential/lifestyleSmall family farms(sales less than $250,000)Low-sales Medium-sales<strong>Farm</strong>ing-occupationLargeLarge-scalefamily farmsVery large Nonfamily AllfarmsNote: For definitions <strong>of</strong> conservation program payments <strong>and</strong> commodity-related payments, see box, “Types <strong>of</strong> <strong>Farm</strong> Program Payments,” onpage 33 <strong>of</strong> this report.Source: USDA, National Agricultural Statistics Service <strong>and</strong> Economic Research Service, 2007 Agricultural Resource Management Survey,Phase III.34<strong>Structure</strong> <strong>and</strong> <strong>Finances</strong> <strong>of</strong> U.S. <strong><strong>Farm</strong>s</strong>: <strong>Family</strong> <strong>Farm</strong> <strong>Report</strong>, 2010 Edition / EIB-66Economic Research Service/USDA
The distribution <strong>of</strong> working-l<strong>and</strong> payments between small <strong>and</strong> large-scalefamily farms is similar to that <strong>of</strong> commodity-related payments (fig. 12), withabout three-fifths <strong>of</strong> the payments going to large-scale farms. Both types <strong>of</strong>programs—directly or indirectly—target production:• Production <strong>of</strong> specific commodities, in the case <strong>of</strong> commodity-relatedprograms.• Environment problems on l<strong>and</strong> in production, in the case <strong>of</strong> workingl<strong>and</strong>programs.The target <strong>of</strong> l<strong>and</strong>-retirement programs, however, is environmentally sensitivel<strong>and</strong> to remove from production, so the distribution <strong>of</strong> conservationpayments differs from those <strong>of</strong> commodity-related payments or working-l<strong>and</strong>payments. Retirement, residential/lifestyle, <strong>and</strong> low-sales farms received 73percent <strong>of</strong> l<strong>and</strong>-retirement payments in 2007, reflecting their large numbers(84 percent <strong>of</strong> all farms), their large share <strong>of</strong> farml<strong>and</strong> (51 percent <strong>of</strong> thel<strong>and</strong> owned by farms), <strong>and</strong> their tendency to enroll large shares <strong>of</strong> their l<strong>and</strong>in l<strong>and</strong>-retirement programs when they do participate. Enrollments in l<strong>and</strong>retirementprograms account for 54 percent <strong>of</strong> the l<strong>and</strong> operated on participatingretirement farms, 40 percent on participating residential/lifestylefarms, <strong>and</strong> 27 percent on participating low-sales farms. In contrast, enrollmentranges from 5 percent to 12 percent for participating medium-salesfarms <strong>and</strong> large-scale farms.The main occupation <strong>of</strong> residential/lifestyle operators is <strong>of</strong>f the farm, whichlimits the amount <strong>of</strong> time they can spend farming. Since acreage enrolledin l<strong>and</strong>-retirement programs requires little labor or capital investment <strong>and</strong>provides a guaranteed income stream, residential/lifestyle farmers may findthe programs financially attractive, particularly if their farms are not pr<strong>of</strong>itable.Given their age, many retired farmers <strong>and</strong> older farmers on low-salesoperations have l<strong>and</strong> available to put into conservation uses.36<strong>Structure</strong> <strong>and</strong> <strong>Finances</strong> <strong>of</strong> U.S. <strong><strong>Farm</strong>s</strong>: <strong>Family</strong> <strong>Farm</strong> <strong>Report</strong>, 2010 Edition / EIB-66Economic Research Service/USDA
ContractingContracts can potentially provide benefits to both producers <strong>and</strong> contractors(MacDonald <strong>and</strong> Banker, 2005, pp. 52-53, MacDonald et al., 2004, pp.24-30). <strong>Farm</strong>ers get a guaranteed outlet for their production with knowncompensation, while contractors get an assured supply <strong>of</strong> commodities withspecified characteristics, delivered in a timely manner. ERS defines two types<strong>of</strong> contracts in ARMS—marketing contracts <strong>and</strong> production contracts (seebox, “Types <strong>of</strong> Contracts”).Production Under ContractAlthough contracts account for nearly two-fifths <strong>of</strong> U.S. agricultural production,the share varies by commodity (fig. 14). For example, U.S. farmersproduce 85 percent <strong>of</strong> poultry under contract. Contracting also accounts forat least half <strong>of</strong> the production <strong>of</strong> peanuts, tobacco, sugarbeets, dairy products,<strong>and</strong> hogs. At the other extreme, only small portions <strong>of</strong> wheat, soybeans, orcorn—all traditional field crops—are grown under contract.The aggregate data show slow <strong>and</strong> steady growth in contracting over theyears, but change can be more rapid for some commodities. For example,the share <strong>of</strong> total agricultural production under contract grew by only 5percentage points between 1996-97 <strong>and</strong> 2007, from 32 percent to 37 percent.During the same period, however, the share <strong>of</strong> tobacco production coveredby contracts went from less than 1 percent to 64 percent. Cigarette manufacturersreplaced cash auctions with contract marketing because contractsbetter enabled them to acquire enough <strong>of</strong> the specific types <strong>of</strong> tobacco theyneeded (MacDonald <strong>and</strong> Banker, 2005, pp. 58).The share <strong>of</strong> peanuts grown under contracts also increased rapidly, from34 percent in 1996-97 to 63 percent in 2007. The 2002 <strong>Farm</strong> Act ended theFigure 14Share <strong>of</strong> value <strong>of</strong> production under marketing or production contractsfor selected commodities, 1996-97 <strong>and</strong> 2007Shares <strong>of</strong> peanuts, tobacco, <strong>and</strong> hogs sold or removed under contract increased dramaticallyPercent <strong>of</strong> value <strong>of</strong> production100Average <strong>of</strong> 1996 <strong>and</strong> 199780120076040200All commoditiesAll cropsWheatSoybeansCornVegetables1An average <strong>of</strong> 1996 <strong>and</strong> 1997 was used to provide a more statistically reliable estimate.FruitsCottonPeanutsTobaccoSugarbeetsAll livestockCattleDairyHogsPoultry <strong>and</strong> eggsSource: USDA, National Agricultural Statistics Service <strong>and</strong> Economic Research Service, 1996, 1997, <strong>and</strong> 2007 Agricultural ResourceManagement Survey, Phase III.37<strong>Structure</strong> <strong>and</strong> <strong>Finances</strong> <strong>of</strong> U.S. <strong><strong>Farm</strong>s</strong>: <strong>Family</strong> <strong>Farm</strong> <strong>Report</strong>, 2010 Edition / EIB-66Economic Research Service/USDA
peanut marketing quota established during the Great Depression. Quotaowners received quota buyout payments <strong>and</strong> became eligible for the sametype <strong>of</strong> Government payments received by other farmers. Peanut producersalso managed price risk through marketing contracts with peanut shellers <strong>and</strong>other peanut buyers (Dohlman <strong>and</strong> Livezey, 2005, pp. 4 <strong>and</strong> 11).The increase in the contracting share <strong>of</strong> hogs—from 34 to 65 percent—was<strong>of</strong> the same magnitude as the increase for peanuts. Growth in hog contractingwas driven in part by production differentiation. Processors wanted morecontrol over the characteristics <strong>of</strong> the hogs they acquired, which helped themprovide a consistent quality <strong>of</strong> meat to consumers (MacDonald <strong>and</strong> Banker,2005, pp. 59).Variation by Type <strong>of</strong> <strong>Farm</strong>Use <strong>of</strong> contracts varies by farm type, as shown in table 11. The share <strong>of</strong>retirement <strong>and</strong> residential/lifestyle farms using contracts is relatively low, 2<strong>and</strong> 4 percent, respectively. For the remaining types <strong>of</strong> family farms, the use<strong>of</strong> contracts increases with sales, ranging from 7 percent <strong>of</strong> low-sales farmsto 57 percent <strong>of</strong> very large family farms. The share <strong>of</strong> their production undercontract also increases with sales.Although a relatively small percentage <strong>of</strong> each small-farm type has contracts,small farms make up about half <strong>of</strong> the farms with contracts, reflecting theTable 11<strong><strong>Farm</strong>s</strong> with contracts <strong>and</strong> value <strong>of</strong> production under contract by farm type, 2007Small family farmsResidential/lifestyle<strong>Farm</strong>ing-occupationLarge-scale farmsNonfamilyfarmsItemRetirementLow-sales Medium-sales Large Very largeAll farmsNumberTotal farms 403,828 989,830 434,599 111,389 93,601 110,152 53,393 2,196,791Percent <strong>of</strong> group<strong><strong>Farm</strong>s</strong> with contracts 1 1.6 3.5 6.9 31.0 43.6 57.2 12.8 9.8Value <strong>of</strong> productionunder contract 2 8.0 11.0 9.9 18.4 28.0 45.0 43.2 37.4Percent <strong>of</strong> U.S. total<strong><strong>Farm</strong>s</strong> with contracts 1 3.1 15.9 13.9 16.0 18.9 29.1 3.2 100.0Value <strong>of</strong> production 1.6 4.2 4.0 6.6 12.2 53.7 17.7 100.0Under contract 2 0.3 1.2 1.1 3.2 9.1 64.5 20.5 100.0Not under contract 2.3 6.0 5.7 8.6 14.1 47.2 16.1 100.0Percent <strong>of</strong> group<strong>Farm</strong> acts as contractor 3 d d d d 1.0 3.1 0.6 0.3d = Data suppressed due to insufficient observations.1<strong><strong>Farm</strong>s</strong> reporting production under production contracts, marketing contracts, or both.2Includes commodities under production or marketing contracts.3Another operation grows livestock (includes poultry) for the farm under a contract arrangement.Source: USDA, National Agricultural Statistics Service <strong>and</strong> Economic Research Service, 2007 Agricultural Resource Management Survey,Phase III.38<strong>Structure</strong> <strong>and</strong> <strong>Finances</strong> <strong>of</strong> U.S. <strong><strong>Farm</strong>s</strong>: <strong>Family</strong> <strong>Farm</strong> <strong>Report</strong>, 2010 Edition / EIB-66Economic Research Service/USDA
Types <strong>of</strong> ContractsA contract is a legal agreement between a farm operator (contractee) <strong>and</strong>another person or firm (contractor) to produce a specific type, quantity,<strong>and</strong> quality <strong>of</strong> agricultural commodity. <strong>Farm</strong>ers typically use two types<strong>of</strong> contracts, marketing contracts <strong>and</strong> production contracts.Marketing contract. Ownership <strong>of</strong> the commodity remains withthe farmer during production. The contract sets a price (or a pricingformula), product quantities <strong>and</strong> qualities, <strong>and</strong> a delivery schedule.Contractor involvement in production is minimal, <strong>and</strong> the farmerprovides all the inputs. For crops, the contract is finalized before harvest.For livestock, the contract is finalized before the animals are ready to bemarketed.Production contract. The contractor usually owns the commodityduring production, <strong>and</strong> the farmer is paid a fee for services rendered.The contract specifies farmer <strong>and</strong> contractor responsibilities for inputs<strong>and</strong> practices. The contractor <strong>of</strong>ten provides specific inputs <strong>and</strong> services,production guidelines, <strong>and</strong> technical advice. In livestock contracts, forexample, contractors typically provide feed, veterinary services, transportation,<strong>and</strong> young animals. The contract is finalized before production<strong>of</strong> the commodity.Source: MacDonald <strong>and</strong> Banker (2005) <strong>and</strong> MacDonald <strong>and</strong> Korb(2008).large number <strong>of</strong> small farms. Production under contract, in contrast, isconcentrated among large-scale family farms <strong>and</strong> nonfamily farms, whichtogether account for 94 percent <strong>of</strong> the total. Very large family farms aloneturn out 65 percent <strong>of</strong> the production under contract.Large-scale family farms <strong>and</strong> nonfamily farms also generate a 77-percentshare <strong>of</strong> production not under contract—sold in the cash or spot market—with very large family farms alone accounting for 47 percent. Threecommodities make up three-fourths <strong>of</strong> noncontract production in the UnitedStates: high-value crops (20 percent), cash grain (33 percent), <strong>and</strong> beef (22percent).<strong><strong>Farm</strong>s</strong> as Contractors<strong><strong>Farm</strong>s</strong> can also serve as contractors. The 2007 ARMS questionnaire askedif any other operations produced livestock—including poultry—under acontract arrangement for the farm being interviewed. About 7,300 farms—less than 1 percent <strong>of</strong> all U.S. farms—reported acting as a contractor, butthe percentage was higher (3 percent) for very large family farms. Livestockvalued at about $3.9 billion was placed on farms by contracting farms.Dairy herd replacements, other cattle, <strong>and</strong> hogs accounted for most <strong>of</strong> theplacements.39<strong>Structure</strong> <strong>and</strong> <strong>Finances</strong> <strong>of</strong> U.S. <strong><strong>Farm</strong>s</strong>: <strong>Family</strong> <strong>Farm</strong> <strong>Report</strong>, 2010 Edition / EIB-66Economic Research Service/USDA
Special Feature: Limited-Resource <strong>Farm</strong>ers—Who Are They?USDA has long been interested in identifying (<strong>and</strong> counting) limitedresourcefarms because it is charged with aiding those farms <strong>and</strong> their operators.The 2008 <strong>Farm</strong> Act, for example, requires USDA to:• Exempt limited-resource farmers from the requirement that producershave more than 10 base acres to receive certain commodity-relatedGovernment payments.• Make limited-resource farmers eligible for higher cost-sharing rates inEQIP.• Exempt limited-resource farmers from certain crop insurance fees. 6In addition, USDA agencies with programs targeted at farms—such as the<strong>Farm</strong> Service Agency (FSA), the Risk Management Agency (RMA), <strong>and</strong> theNatural Resources Conservation Service (NRCS)—have outreach efforts toencourage the participation <strong>of</strong> limited-resource farmers.Limited-resource farms are identified under four definitions in this specialfeature (see box, “Defining Limited-Resource <strong><strong>Farm</strong>s</strong>”). Based on the definitionused, the number <strong>of</strong> farms varies under different—but reasonable—constraints on farm sales, operator household income, farm assets, <strong>and</strong>household net worth. Regardless <strong>of</strong> the definition used, however, the number<strong>of</strong> limited-resource farms is relatively low <strong>and</strong> the characteristics <strong>of</strong> the farmsare similar. 7The Original DefinitionPerry <strong>and</strong> Ahearn (1993) first identified limited-resource farmers for ERS,although they used the term “limited-opportunity” rather than “limitedresource.”Their definition <strong>and</strong> analysis were based on 1988 data from the<strong>Farm</strong> Costs <strong>and</strong> Returns Survey (FCRS), a predecessor to ARMS. Theydefined limited-resource farms as those that met three criteria:6Drawn from “2008 <strong>Farm</strong> Bill Side-By-Side: Provisions for Traditionally UnderservedGroups” on the ERS website at:www.ers.usda.gov/farmbill/2008/titles/underserved.htm#titleix7Data from version 1 <strong>of</strong> the 2007 AgriculturalResource Management Survey(ARMS) are used in this section, sincethat was the only version to identifylimited-resource farms under the USDAwidedefinition, one <strong>of</strong> the four definitionsexamined. For more informationabout the various versions <strong>of</strong> ARMS, see“Appendix II: The Agricultural ResourceManagement Survey.”1. Operator household income less than the poverty level. Operatorhouseholds with income at this level had an inadequate income fromfarming <strong>and</strong> other sources.2. <strong>Farm</strong> sales less than $100,000. <strong><strong>Farm</strong>s</strong> with sales above this level weregenerally commercially viable.3. <strong>Farm</strong> assets less than $150,000. The median value <strong>of</strong> assets for farmswith sale less than $100,000 was approximately $150,000. <strong><strong>Farm</strong>s</strong> withassets below this level may have had insufficient assets to operatesuccessfully.Alternate DefinitionsWhen ERS created its farm classification system in 1998, it included limitedresourcefarms as one category, using the original Perry-Ahearn definition,with one modification. <strong>Family</strong> income was required to be below $20,00040<strong>Structure</strong> <strong>and</strong> <strong>Finances</strong> <strong>of</strong> U.S. <strong><strong>Farm</strong>s</strong>: <strong>Family</strong> <strong>Farm</strong> <strong>Report</strong>, 2010 Edition / EIB-66Economic Research Service/USDA
per year rather than below the poverty level. Using a $20,000 income cut<strong>of</strong>frather than the poverty level avoided the necessity <strong>of</strong> knowing householdsize—used to assign the appropriate poverty level to a family—whichwas not collected every year by ARMS or FCRS (Hoppe, 2001, p. 4) untilrecently. This modified original definition was used in the classification untilthe current definition was incorporated in the 2003 ARMS.The current definition <strong>of</strong> limited-resource farms (U.S. National Archives <strong>and</strong>Records Admn., 2003, p. 32350) was developed by an interagency committeeto provide a consistent definition across all USDA agencies. Both the modifiedoriginal definition <strong>and</strong> the current definition use a $100,000 cut<strong>of</strong>f forfarm sales, although the current definition indexes the cut<strong>of</strong>f to reflect pricechanges <strong>and</strong> applies the cut<strong>of</strong>f to both the current <strong>and</strong> previous year. Thecut<strong>of</strong>f for household income is also set low in both definitions, but—as in thecase <strong>of</strong> sales—2 years <strong>of</strong> low income are required under the current definition.An asset limitation was not used in the current definition because theassets held by farmers are difficult to verify on applications to participate inUSDA programs. Instead, the requirement for a second year <strong>of</strong> low income—which is easier to verify than low assets—was added.The third definition is an update <strong>of</strong> the original definition, to reflect currentconditions in agriculture. As in the original definition, the income <strong>of</strong> householdsoperating limited-resource farms must be less than the poverty levelin a given year. Sales, however, must be less than $250,000—the currentcut<strong>of</strong>f for small farms—which better reflects the level <strong>of</strong> sales required for acommercial-scale operation today. <strong>Farm</strong> assets must be less than $366,800,the median value <strong>of</strong> assets for farms with sales less than $250,000 in 2007.Defining Limited-Resource <strong><strong>Farm</strong>s</strong>Criterion(1)Modified originaldefinition(2)Current definition(USDA-wide)(3)Updated originaldefinition(4)Low-income,low-wealthOperator householdincomeLess than $20,000in the current yearLow in both the current <strong>and</strong>previous year; income is lowif it is less than the povertylevel for a family <strong>of</strong> fourwith two children—$21,027in 2007—or if it is lessthan half the county medianhousehold incomeLess than theappropriate povertylevel in the currentyearLess than the medianfor all U.S. householdsin the current year($50,200 in 2007)SalesLess than$100,000, with noindexingLow sales in both thecurrent <strong>and</strong> previous year;low sales is defined as lessthan $100,000 in 2003 <strong>and</strong>indexed thereafterLess than$250,000, with noindexingNo limit<strong>Farm</strong> assets Less than $150,000 No limit Less than $366,800 No limitOperator householdnet worthNo limit No limit No limit Less than the medianfor all U.S. households($120,300 in 2007)41<strong>Structure</strong> <strong>and</strong> <strong>Finances</strong> <strong>of</strong> U.S. <strong><strong>Farm</strong>s</strong>: <strong>Family</strong> <strong>Farm</strong> <strong>Report</strong>, 2010 Edition / EIB-66Economic Research Service/USDA
Under the fourth definition, the income <strong>of</strong> the household operating a limitedresourcefarm must be less than the median for all U.S. households in a givenyear, <strong>and</strong> its net worth must be less than the median for all U.S. households.This “low-income, low-wealth” group is one category <strong>of</strong> the joint income/wealth indictor developed by ERS (Mishra et al., 2002, pp. 39-44). 8Counts <strong>and</strong> ConstraintsThe count <strong>of</strong> limited-resource farms is sensitive to the constraints on farmassets or household net worth. The count is lowest—65,800 <strong>and</strong> 82,500farms, respectively—under the modified original definition <strong>and</strong> the lowincome,low-wealth definitions (table 12). These definitions each classify 3 or4 percent <strong>of</strong> U.S. farms as limited-resource. The modified original definitionhas the most restrictive constraint on farm assets ($150,000), <strong>and</strong> the lowincome,low-wealth definition constrains net worth at $120,300.The updated original definition has a higher farm asset constraint ($366,800)than the modified original definition, which increases the number <strong>of</strong> limitedresourcefarms to 143,000 (7 percent <strong>of</strong> all farms). Finally, 255,000 farms(12 percent <strong>of</strong> all farms) were classified as limited-resource under the currentUSDA-wide definition, which has neither an asset nor a net worth constraint.The variation in the assets or net worth constraints is also reflected in therelatively large range in median farm assets <strong>and</strong> median household net worthamong the four definitions.8The 2007 Census <strong>of</strong> Agriculture alsoestimated the number <strong>of</strong> limited-resourcefarms. It defined limited-resource farmsas those selling less than $100,000 <strong>of</strong>agricultural products run by a primaryoperator household receiving less than$20,000 in total income (USDA, NASS,2009, p. B-9). The census definition isnot examined here because it has noconstraints on assets, net worth, theprevious year’s sales, or the previousyear’s household income. For additionalinformation on limited-resource farmsfrom the 2007 Census <strong>of</strong> Agriculture, see“Appendix I: Comparing the Census <strong>and</strong>ERS <strong>Farm</strong> Classifications.”SimilaritiesSome farm, operator, <strong>and</strong> household characteristics are common amonglimited-resource farms, regardless <strong>of</strong> the definition used. All four definitionshave a household income constraint, which means that median income is lowunder each definition <strong>and</strong> falls within a fairly narrow range—between $9,300<strong>and</strong> $22,000. The majority <strong>of</strong> households operating limited-resource farmshave a positive household income but experience losses from farming. Thisis also true, however, for “other farm households,” those not classified aslimited-resource under any definition.Limited-resource farms are very small. Median acres operated range from26 to 75 acres under the four definitions, compared with 97 acres for otherfarms. Median annual sales are also small, in the $1,300 to $3,600 range,compared with $6,800 for other farms.A few limited-resource farms generate sales <strong>of</strong> $100,000 or more, however,<strong>and</strong> are classified as medium-sales or large-scale farms. This includes 3percent <strong>of</strong> limited-resource farms under the low-income-low wealth definition(which has no sales constraint) as well as 3 percent under the updatedoriginal definition (which constrains sales at less than $250,000). The currentdefinition originally constrained farm sales at $100,000 in 2003, but theconstraint is indexed for price changes <strong>and</strong> crept up to $115,600 by 2007. Asa result, a small share <strong>of</strong> limited-resource farms under the current definition(less than 1 percent) has sales <strong>of</strong> $100,000 or more.Demographically, limited-resource farmers are much like other farmers.Regardless <strong>of</strong> the definition used, limited-resource farmers—like farmers in42<strong>Structure</strong> <strong>and</strong> <strong>Finances</strong> <strong>of</strong> U.S. <strong><strong>Farm</strong>s</strong>: <strong>Family</strong> <strong>Farm</strong> <strong>Report</strong>, 2010 Edition / EIB-66Economic Research Service/USDA
general—are overwhelmingly male. Most limited-resource farmers are alsomarried, with the married share ranging from just under one-half to threefifths,depending on the definition. An even larger share <strong>of</strong> other operators(86 percent), however, reports they are married. This means that limitedresourcehouseholds are less likely than other farm households to have twopotential workers—the operator <strong>and</strong> spouse—to generate farm <strong>and</strong> <strong>of</strong>f-farmincome. 9Compared with other farm operators, limited-resource operators have lowereducational attainment, which may contribute to their low levels <strong>of</strong> income<strong>and</strong> resources. Between 24 <strong>and</strong> 28 percent <strong>of</strong> operators <strong>of</strong> limited-resourcefarms, or three times the 8-percent rate for other operators, did not receive ahigh school diploma. At the other end <strong>of</strong> the educational spectrum, about 30percent <strong>of</strong> the limited-resource operators under each definition attended orgraduated from college, compared with 51 percent <strong>of</strong> other operators.9Due to sample-size issues, no informationcan be presented about the share <strong>of</strong>limited-resource farmers who belong tominority racial or ethnic groups.A Major DifferenceAs pointed out above, limited-resource farms have a number <strong>of</strong> commoncharacteristics, regardless <strong>of</strong> the definition used. Limited-resource farmsidentified by the current definition, however, are different from farms underother definitions in one respect—the age <strong>of</strong> the principal operator. Operators<strong>of</strong> farms under the current definition average 66 years <strong>of</strong> age, higher thanoperators under any other definition. About 58 percent are at least 65 yearsold, substantially higher than the 23- to 32-percent share under the otherdefinitions, <strong>and</strong> double the 25-percent share for operators not classified aslimited-resource.Limited-resource farmers under the current definition appear to be olderoperators who have either retired or are scaling back their farm business.Forty-seven percent operate retirement farms, but another 33 percent aremore actively engaged in farming <strong>and</strong> operate low-sales farms. The highlevel <strong>of</strong> farm assets in 2007 under this definition—a median <strong>of</strong> $366,400—suggests that these operators may have farmed on a larger scale in the past.OverlapConsiderable overlap exists among the farms identified as limited-resourceunder the four definitions (table 13), which helps explain why limitedresourcefarms identified by the different definitions <strong>of</strong>ten have similarcharacteristics. The overlap is most pronounced for the modified originaldefinition. Ninety-eight percent <strong>of</strong> these farms are classified as limitedresourcefarms by two or more definitions (including the modified originaldefinition). At the other extreme, only 36 percent <strong>of</strong> farms under the currentdefinition are limited-resource under two or more definitions. As a result,farm operators classified as limited-resource under that definition had someunique characteristics related to their age.44<strong>Structure</strong> <strong>and</strong> <strong>Finances</strong> <strong>of</strong> U.S. <strong><strong>Farm</strong>s</strong>: <strong>Family</strong> <strong>Farm</strong> <strong>Report</strong>, 2010 Edition / EIB-66Economic Research Service/USDA
ConclusionsThis report has five major findings important to underst<strong>and</strong>ing farms <strong>and</strong>farm households, today <strong>and</strong> in the future:1. Large-scale family farms <strong>and</strong> nonfamily farms now account for aboutfour-fifths <strong>of</strong> U.S. agricultural production. Million-dollar farms aloneaccount for half <strong>of</strong> agricultural production. Yet, small farms makesignificant contributions to the production <strong>of</strong> specific commodities.2. <strong>Farm</strong>ing is generally considered a purely rural pursuit. Nevertheless,two-fifths <strong>of</strong> U.S. farms <strong>and</strong> agricultural production are located inmetro areas. High-value crops account for a large share <strong>of</strong> metroproduction, even outside the Fruitful Rim.3. Large-scale family farms are generally viable economic businesses,with favorable financial ratios. Small family farms are less viable asbusinesses, but the households operating them receive substantial<strong>of</strong>f-farm income <strong>and</strong> do not rely primarily on their farms for theirlivelihoods.4. There are relatively few limited-resource farmers, regardless <strong>of</strong> thedefinition used. The number <strong>of</strong> limited-resource farmers, however, issensitive to any farm asset or household wealth constraints imposedin the definitions.5. Different types <strong>of</strong> farm program payments go to different types <strong>of</strong>farms. Most payments from commodity-related <strong>and</strong> working-l<strong>and</strong>programs go to large-scale family farms because these programstarget production (directly or indirectly). L<strong>and</strong>-retirement programs,in contrast, target environmentally sensitive l<strong>and</strong> <strong>and</strong> go mostly toretirement, residential/lifestyle, <strong>and</strong> low-sales small farms.Large-Scale <strong><strong>Farm</strong>s</strong> Produce the Most OutputLarge-scale family farms reported 66 percent <strong>of</strong> the value <strong>of</strong> U.S. agriculturalproduction in 2007, <strong>and</strong> nonfamily farms contributed another 18 percent <strong>of</strong>production. Million-dollar farms alone, numbering only 47,600, produced53 percent <strong>of</strong> U.S. agricultural output in the same period <strong>and</strong> dominated theproduction <strong>of</strong> high-value crops, hogs, dairy, poultry, <strong>and</strong> beef. The largestmillion-dollar farms—those with sales <strong>of</strong> at least $5 million in a givenyear—accounted for 35 to 45 percent <strong>of</strong> the production <strong>of</strong> high-value crops,beef cattle (largely in feedlots), <strong>and</strong> milk. The large share <strong>of</strong> these productsproduced by $5 million farms suggests economies <strong>of</strong> scale still exist evenwhen sales exceed $5 million.Nevertheless, small farms reported significant shares <strong>of</strong> production <strong>of</strong>specific commodities, including 23 percent <strong>of</strong> the value <strong>of</strong> production forcash grains <strong>and</strong> soybeans, 51 percent for hay, 34 percent for tobacco, <strong>and</strong> 22percent for beef (largely from cow-calf operations). All these shares werelarger than small farms’ overall 16-percent share <strong>of</strong> U.S. production.46<strong>Structure</strong> <strong>and</strong> <strong>Finances</strong> <strong>of</strong> U.S. <strong><strong>Farm</strong>s</strong>: <strong>Family</strong> <strong>Farm</strong> <strong>Report</strong>, 2010 Edition / EIB-66Economic Research Service/USDA
<strong>Farm</strong>ing in Metropolitan Areas<strong>Farm</strong>ing is <strong>of</strong>ten assumed to be a purely rural pursuit. But, two-fifths <strong>of</strong>farms <strong>and</strong> farm production are located in metro areas, defined as a county orgroup <strong>of</strong> counties with an urban population concentration <strong>of</strong> at least 50,000people. The share <strong>of</strong> farms located in metro areas is particularly high in theFruitful Rim, where it reaches 67 percent.Metro areas—considered as a whole—have a different agricultural productionmix than nonmetro areas. High-value crops <strong>and</strong> dairy products make upa larger share <strong>of</strong> output in metro areas, while cash grains <strong>and</strong> beef make up asmaller share. The commodities that are produced in U.S. metro areas reflectthe production mix in the Fruitful Rim, which accounts for 43 percent <strong>of</strong> totalmetro production. California alone accounts for 65 percent <strong>of</strong> metro productionin the Fruitful Rim <strong>and</strong> 28 percent <strong>of</strong> total U.S. metro production.Production in metro areas outside the Fruitful Rim looks more like that innonmetro areas. In nonmetro areas <strong>and</strong> in metro areas excluding the Rim, adiversified livestock sector makes up one-half <strong>of</strong> production, <strong>and</strong> cash grainsmake up another 30 percent. The composition <strong>of</strong> the livestock sector variesbetween non-Rim metro areas <strong>and</strong> nonmetro areas, however.Nevertheless, the share <strong>of</strong> production from high-value crops is more thantwice as high in metro counties outside the Rim as in nonmetro counties, 16<strong>and</strong> 6 percent, respectively. This may reflect shifts by producers in metroareas to commodities that generate returns high enough to compensate forhigher property taxes incurred as l<strong>and</strong> prices increase with local development(Heimlich <strong>and</strong> Anderson, 2001, pp. 38-42). The larger returns per acre forhigh-value crops relative to other commodities also allow operators to focustheir production on fewer acres, which reduces their need to bid for farml<strong>and</strong>against competing uses. In the case <strong>of</strong> California, the climate <strong>and</strong> irrigationmake farming especially competitive where agriculture <strong>and</strong> developmentmeet in the State’s large counties.Financial Status <strong>of</strong> the <strong>Family</strong> <strong>Farm</strong>The year 2007 was above average for farming. Net farm income averaged$35,100 per farm in 2007, 46 percent higher than in 2006. Only 3 percent <strong>of</strong>farms were classified as vulnerable (negative net cash farm income with adebt/asset ratio greater than 40 percent). Seventy-one percent <strong>of</strong> the vulnerablefarms were residential/lifestyle farms, however, whose operators—bydefinition—rely on <strong>of</strong>f-farm work for their livelihood.For the most part, large <strong>and</strong> very large family farms were viable economicbusinesses. Their average pr<strong>of</strong>it margin <strong>and</strong> rates <strong>of</strong> return on assets <strong>and</strong>equity were all positive, <strong>and</strong> the large majority <strong>of</strong> these farms had a positiveoperating pr<strong>of</strong>it margin. Small farms—in contrast—were less viable asbusinesses. For retirement, residential/lifestyle, <strong>and</strong> low-sales farms, averageoperating pr<strong>of</strong>it margin <strong>and</strong> rates <strong>of</strong> return on assets <strong>and</strong> equity were negative.These ratios were positive for medium-sales farms but were substantiallyless than those <strong>of</strong> larger family farms. Nevertheless, some farms in eachsmall-farm group had an operating margin <strong>of</strong> at least 20 percent.47<strong>Structure</strong> <strong>and</strong> <strong>Finances</strong> <strong>of</strong> U.S. <strong><strong>Farm</strong>s</strong>: <strong>Family</strong> <strong>Farm</strong> <strong>Report</strong>, 2010 Edition / EIB-66Economic Research Service/USDA
Small-farm households typically receive substantial <strong>of</strong>f-farm income, largelyfrom wage <strong>and</strong> salary jobs or from self-employment. Because many smallfarmhouseholds receive a large share <strong>of</strong> their income from <strong>of</strong>f-farm work,macroeconomic <strong>and</strong> monetary policies affecting the nonfarm economy areimportant to them. The provisions in the tax codes allowing farmers to writefarm losses <strong>of</strong>f against other income (Durst, 2009, pp. 4-6) are also importantto operators <strong>of</strong> residential/lifestyle farms with substantial <strong>of</strong>f-farm earnedincome. Finally, the status <strong>of</strong> retirement programs is important to operators<strong>of</strong> retirement farms <strong>and</strong> to older operators in other farm types as theyapproach retirement.Limited-Resource <strong><strong>Farm</strong>s</strong>: Few in NumberThe number <strong>of</strong> limited-resource farms is sensitive to the asset or wealthconstraints used in the definitions. Under the three definitions with either <strong>of</strong>these constraints, the count <strong>of</strong> limited-resource farms falls within a relativelynarrow range, from 65,800 to 143,000 farms (between 3 <strong>and</strong> 7 percent <strong>of</strong> allU.S. farms). Under the sole definition without an asset/wealth constraint—theone currently used by USDA—the number <strong>of</strong> limited-resource farms reaches255,000, or 12 percent <strong>of</strong> all farms. In other words, there are relatively fewlimited-resource farms, regardless <strong>of</strong> the definition used.Limited-resource farms have some common characteristics under all thedefinitions. Limited-resource operators are generally male <strong>and</strong> married. Theyhave lower levels <strong>of</strong> education, however, than farmers who are not classifiedas limited-resource. Limited-resource farms are generally small, whethersize is measured in acres or sales, <strong>and</strong> the households operating these farmstypically lose money farming. Overlap among the farms identified as limitedresourceunder the four definitions helps explain these common characteristics.The overlap also implies that many <strong>of</strong> the same farms will be identifiedregardless <strong>of</strong> the definition used.The number <strong>of</strong> limited-resource farmers declined from 200,300 in 1988under the original definition (Perry <strong>and</strong> Ahearn, 1993) to 143,000 in 2007under the updated original definition, the definition most comparable to theoriginal definition. Both definitions have a household income constraintbased on the poverty level, a sales constraint consistent with a commerciallyviable operation, <strong>and</strong> an asset constraint based on median assets for farmsmeeting the sales constraint.Increasing household income helps explain the decline in the number <strong>of</strong>limited-resource farms over time. Average household income grew morerapidly for farm households than for U.S. households in general—particularlyafter 1995—resulting in a growing gap between farm <strong>and</strong> other households,in favor <strong>of</strong> farm households (fig. 15). Most <strong>of</strong> the growth in farmhouseholds’ income came from <strong>of</strong>f-farm sources. <strong>Farm</strong>ing’s contribution t<strong>of</strong>arm household income has never exceeded 17 percent since 1988.48<strong>Structure</strong> <strong>and</strong> <strong>Finances</strong> <strong>of</strong> U.S. <strong><strong>Farm</strong>s</strong>: <strong>Family</strong> <strong>Farm</strong> <strong>Report</strong>, 2010 Edition / EIB-66Economic Research Service/USDA
Figure 15Mean operator household income, share from farming, <strong>and</strong> mean U.S. household income, 1988-2007Mean income has consistently been higher for farm households since 199610080604020Mean operator householdincome ($1,000)Share <strong>of</strong> farm household incomefrom farming (percent)Mean U.S. householdincome ($1,000)01988 90 92 94 96 98 2000 02 04 06Sources: USDA, Economic Research Service <strong>and</strong> National Agricultural Statistics Service, 1988-1995 <strong>Farm</strong> Costs <strong>and</strong> Returns Survey <strong>and</strong>1997-2007 Agricultural Resource Management Survey, Phase III, for farm households. U.S. Department <strong>of</strong> Commerce, U.S. Census Bureau,Current Population Survey for all U.S. households.Different <strong><strong>Farm</strong>s</strong>, Different PoliciesWhich farms receive Government payments varies by type <strong>of</strong> program.Payments from commodity-related programs are roughly proportional tothe harvested acres <strong>of</strong> program commodities. As a result, medium-salessmall farms <strong>and</strong> the two types <strong>of</strong> large-scale farms collectively received 76percent <strong>of</strong> commodity-related Government payments in 2007. Working-l<strong>and</strong>programs do not directly target production. They do, however, target l<strong>and</strong> inproduction. This results in most working-l<strong>and</strong> payments going to large-scalefarms.In contrast, l<strong>and</strong>-retirement programs target environmentally sensitive l<strong>and</strong>rather than commodity production. As a result, retirement, residential/lifestyle, <strong>and</strong> low-sales small farms received 73 percent <strong>of</strong> l<strong>and</strong>-retirementpayments in 2007. This distribution reflects the large numbers <strong>of</strong> farms inthese groups, their large aggregate l<strong>and</strong>holdings, <strong>and</strong> their tendency to enrolllarge shares <strong>of</strong> their l<strong>and</strong> in l<strong>and</strong>-retirement programs. L<strong>and</strong>-retirementprograms have relatively low labor <strong>and</strong> capital requirements, which makesthe programs attractive to residential/lifestyle farmers, who spend most <strong>of</strong>their work time <strong>of</strong>f the farm, <strong>and</strong> to retired or older low-sales farmers, whohave scaled back their operations.A majority <strong>of</strong> farms, 61 percent in 2007, do not receive Governmentpayments. Nevertheless, these farms—<strong>and</strong> the households that operatethem—may be affected indirectly by Government payments. For example,various analyses indicate that Government payments have increased cropproduction between 1 <strong>and</strong> 6 percent over time (USDA, OCE, 2003, p. 8).Thus, livestock producers who do not receive Government payments maybenefit from lower feed prices due to an increased supply <strong>of</strong> grain.49<strong>Structure</strong> <strong>and</strong> <strong>Finances</strong> <strong>of</strong> U.S. <strong><strong>Farm</strong>s</strong>: <strong>Family</strong> <strong>Farm</strong> <strong>Report</strong>, 2010 Edition / EIB-66Economic Research Service/USDA
ReferencesAhearn, Mary C., Janet E. Perry, <strong>and</strong> Hisham S. El-Osta. The EconomicWell-Being <strong>of</strong> <strong>Farm</strong> Operator Households, 1988-90. AER-666. U.S. Dept.Agr., Econ. Res. Serv., January 1993.Allen, Rich. “How to Interpret New Demographic Information in thePreliminary 2002 Census <strong>of</strong> Agriculture Release.” Paper presented at the2004 Agricultural Outlook Forum. Arlington, VA, February 19-20, 2004.(Available at: http://ageconsearch.umn.edu/bitstream/33028/1/fo04al02.pdf.)Cash, A. James, II. “Where’s the Beef? Small <strong><strong>Farm</strong>s</strong> Produce Majority <strong>of</strong>Cattle,” Agricultural Outlook, U.S. Dept. Agr., Econ. Res. Serv., AGO-297,December 2002, pp. 21-24. (Available at: www.ers.usda.gov/publications/agoutlook/dec2002/.)Claassen, Roger, <strong>and</strong> Marc Ribaudo. “Conservation Policy Overview,”in Agricultural Resources <strong>and</strong> Environmental Indicators, 2006 Edition.Keith Wiebe <strong>and</strong> Noel Gollehon, editors. EIB-16. U.S. Dept. Agr., Econ.Res. Serv., July 2006, pp. 168-174. (Available at: www.ers.usda.gov/publications/arei/eib16/chapter5/5.1/.)Cochrane, Willard W. The Development <strong>of</strong> American Agriculture: AHistorical Analysis. Minneapolis, MN: University <strong>of</strong> Minnesota Press, 1993.Dohlman, Erik, <strong>and</strong> Janet Livezey. Peanut Backgrounder. OCS-05i-01. U.S.Dept. Agr., Econ. Res. Serv. October 2005. (Available at: www.ers.usda.gov/publications/ocs/oct05/ocs05i01/.)Durst, Ron. Federal Tax Policies <strong>and</strong> <strong>Farm</strong> Households. EIB-54. U.S.Dept. Agr., Econ. Res. Serv. May 2009. (Available at: www.ers.usda.gov/publications/eib54/.)<strong>Farm</strong> Financial St<strong>and</strong>ards Council. Financial Guidelines for AgriculturalProducers: Recommendations <strong>of</strong> the <strong>Farm</strong> Financial St<strong>and</strong>ards Council,January 2008.Fuglie, Keith O., James M. MacDonald, <strong>and</strong> Eldon Ball. Productivity Growthin U.S. Agriculture. EB-9. U.S. Dept. Agr., Econ. Res. Serv., September2007. (Available at: www.ers.usda.gov/publications/eb9/.)Gale, Fred. “The Graying <strong>Farm</strong> Sector: Legacy <strong>of</strong> Off-<strong>Farm</strong> Migration,”Rural America, U.S. Dept. Agr., Econ. Res. Serv., Vol. 17, Issue 3, Fall2002, pp. 28-31. (Available at: www.ers.usda.gov/publications/ruralamerica/ra173/.)Gale, H. Frederick, <strong>and</strong> David H. Harrington. “U.S. <strong><strong>Farm</strong>s</strong>―Diversity &Change,” Agricultural Outlook, U.S. Dept. Agr., Econ. Res. Serv., AO-198,July 1993, pp. 3-6.Harrington, David H., Robert A. Hoppe, R. Neal Peterson, David Banker, H.Frederick Gale, Jr. “Changes in the <strong>Farm</strong> Sector,” in Financing Agriculture50<strong>Structure</strong> <strong>and</strong> <strong>Finances</strong> <strong>of</strong> U.S. <strong><strong>Farm</strong>s</strong>: <strong>Family</strong> <strong>Farm</strong> <strong>Report</strong>, 2010 Edition / EIB-66Economic Research Service/USDA
into the Twenty-first Century. Marvin Duncan <strong>and</strong> Jerome M. Stam, editors.Boulder, CO: Westview Press, 1998.Harris, J. Michael, Kenneth Erickson, John Dillard, Mitch Morehart, RogerStrickl<strong>and</strong>, Robert Gibbs, Mary Ahearn, Ted Covey, Faqir Bagi, DennisBrown, Chris McGath, Steve Vogel, Bob Williams, <strong>and</strong> Jim Johnson.Agricultural Income <strong>and</strong> Finance Outlook. AIS-86. U.S. Dept. Agr., Econ.Res. Serv., December 2008. (Available at: http://usda.mannlib.cornell.edu/MannUsda/viewDocumentInfo.do?documentID=1254.)Heimlich, Ralph E., <strong>and</strong> William D. Anderson. Development at the UrbanFringe <strong>and</strong> Beyond: Impacts on Agriculture <strong>and</strong> Rural L<strong>and</strong>. AER-803. U.S.Dept. Agr., Econ. Res. Serv., June 2001. (Available at: www.ers.usda.gov/publications/aer803/.)Hoppe, Robert A., editor. Structural <strong>and</strong> Financial Characteristics <strong>of</strong> U.S.<strong><strong>Farm</strong>s</strong>: 2001 <strong>Family</strong> <strong>Farm</strong> <strong>Report</strong>. AIB-768. U.S. Dept. Agr., Econ. Res.Serv., May 2001. (Available at: www.ers.usda.gov/publications/aib768/.)Hoppe, Robert A., <strong>and</strong> David E. Banker. <strong>Structure</strong> <strong>and</strong> <strong>Finances</strong> <strong>of</strong> U.S.<strong><strong>Farm</strong>s</strong>: 2005 <strong>Family</strong> <strong>Farm</strong> <strong>Report</strong>. EIB-12. U.S. Dept. Agr., Econ. Res.Serv., May 2006. (Available at: www.ers.usda.gov/publications/eib12/.)Hoppe, Robert A., <strong>and</strong> Penni Korb. Underst<strong>and</strong>ing U.S. <strong>Farm</strong> Exits. ERR-21.U.S. Dept. Agr., Econ. Res. Serv., June 2006. (Available at: www.ers.usda.gov/publications/err21/.)Hoppe, Robert A., Penni Korb, Erik J. O’Donoghue, <strong>and</strong> David E. Banker.<strong>Structure</strong> <strong>and</strong> <strong>Finances</strong> <strong>of</strong> U.S. <strong><strong>Farm</strong>s</strong>: <strong>Family</strong> <strong>Farm</strong> <strong>Report</strong>, 2007 Edition.EIB-24. U.S. Dept. Agr., Econ. Res. Serv., June 2007. (Available at: www.ers.usda.gov/publications/eib24/.)Hoppe, Robert A., Penni Korb, David E. Banker. Million-Dollar <strong><strong>Farm</strong>s</strong>in the New Century. EIB-42. U.S. Dept. Agr., Econ. Res. Serv., December2008. (Available at: www.ers.usda.gov/publications/eib42/.)Hoppe, Robert A., James M. MacDonald, <strong>and</strong> Penni Korb. Small <strong><strong>Farm</strong>s</strong>in the United States: Persistence Under Pressure. EIB-63. U.S. Dept.Agr., Econ. Res. Serv., February 2010. (Available at: www.ers.usda.gov/publications/eib63/.)MacDonald, James, Janet Perry, Mary Ahearn, David Banker, WilliamChambers, Carolyn Dimitri, Nigel Key, Kenneth Nelson, <strong>and</strong> Lel<strong>and</strong>Southard. Contracts, Markets, <strong>and</strong> Prices: Organizing the Production <strong>and</strong>Use <strong>of</strong> Agricultural Commodities. AER-837. U.S. Dept. Agr., Econ. Res.Serv., November 2004. (Available at: www.ers.usda.gov/publications/aer837/.)MacDonald, James M., <strong>and</strong> David E. Banker. “Agricultural Use <strong>of</strong>Production <strong>and</strong> Marketing Contracts,” in Structural <strong>and</strong> FinancialCharacteristics <strong>of</strong> U.S. <strong><strong>Farm</strong>s</strong>: 2004 <strong>Family</strong> <strong>Farm</strong> <strong>Report</strong>. David E. Banker<strong>and</strong> James M. MacDonald, editors. AIB-797. U.S. Dept. Agr., Econ. Res.Serv., March 2005. (Available at: www.ers.usda.gov/publications/aib797/.)51<strong>Structure</strong> <strong>and</strong> <strong>Finances</strong> <strong>of</strong> U.S. <strong><strong>Farm</strong>s</strong>: <strong>Family</strong> <strong>Farm</strong> <strong>Report</strong>, 2010 Edition / EIB-66Economic Research Service/USDA
MacDonald, James M., William D. McBride, <strong>and</strong> Erik J. O’Donoghue.“Low Costs Drive Production to Large Dairy <strong><strong>Farm</strong>s</strong>,” Amber Waves, U.S.Dept. Agr., Econ. Res. Serv., Vol. 5, Issue 4, September 2007, pp, 30-35.(Available at: www.ers.usda.gov/amberwaves/september07/features/dairyfarms.htm.)MacDonald, James, <strong>and</strong> Penni Korb. Agricultural Contracting Update, 2005.EIB-35. U.S. Dept. Agr., Econ. Res. Serv., April 2008. (Available at: www.ers.usda.gov/publications/eib35/.)McBride, William D., <strong>and</strong> Nigel Key. Economic <strong>and</strong> Structural Relationshipsin U.S. Hog Production. AER-818. U.S. Dept. <strong>of</strong> Agr., Econ. Res. Serv.February 2003. (Available at: www.ers.usda.gov/publications/aer818/.)Mishra, Ashok K., Hisham S. El-Osta, Mitchell J. Morehart, James D.Johnson, <strong>and</strong> Jeffrey W. Hopkins. Income, Wealth, <strong>and</strong> the Economic Well-Being <strong>of</strong> <strong>Farm</strong> Households. AER-812. U.S. Dept. <strong>of</strong> Agr., Econ. Res. Serv.July 2002. (Available at: www.ers.usda.gov/publications/aer812/.)Mishra, Ashok K., Ron L. Durst, <strong>and</strong> Hisham S. El-Osta. “How Do U.S.<strong>Farm</strong>ers Plan for Retirement?” Amber Waves, U.S. Dept. Agr., Econ. Res.Serv., Vol. 3, Issue 2, April 2005, pp. 12-18. (Available at: www.ers.usda.gov/amberwaves/april05/features/farmretirement.htm.)Perry, Janet E., <strong>and</strong> Mary C. Ahearn. Limited Opportunity <strong>Farm</strong> Householdsin 1988. AIB-662. U.S. Dept. Agr., Econ. Res. Serv., February 1993.Sommer, Judith E., Robert A. Hoppe, Robert C. Green, <strong>and</strong> Penelope J.Korb. Structural <strong>and</strong> Financial Characteristics <strong>of</strong> U.S. <strong><strong>Farm</strong>s</strong>, 1995: 20thAnnual <strong>Family</strong> <strong>Farm</strong> <strong>Report</strong> to Congress. AIB-746. U.S. Dept. Agr., Econ.Res. Serv., December 1998. (Available at: www.ers.usda.gov/publications/aib746/.)U.S. Department <strong>of</strong> Agriculture, Economic Research Service. <strong>Farm</strong> ResourceRegions. AIB-760. September 2000. (Available at: www.ers.usda.gov/publications/aib760/U.S. Department <strong>of</strong> Agriculture, National Agricultural Statistics Service(USDA, NASS). 1997 Census <strong>of</strong> Agriculture. Vol. 3, Special Studies; PartIV: Agricultural Economics <strong>and</strong> L<strong>and</strong> Ownership Survey (1999). AC97-SP-4. December 2001.U.S. Department <strong>of</strong> Agriculture, National Agricultural Statistics Service(USDA, NASS). 2007 Agricultural Resource Management Survey (ARMS),Phase III-Cost <strong>and</strong> Returns <strong>Report</strong>, Survey Administration Manual. January2008.U.S. Department <strong>of</strong> Agriculture, National Agricultural Statistics Service(USDA, NASS). 2007 Census <strong>of</strong> Agriculture, Vol. 1: Geographic AreaSeries, Part 51: United States Summary <strong>and</strong> State Data. February 2009.52<strong>Structure</strong> <strong>and</strong> <strong>Finances</strong> <strong>of</strong> U.S. <strong><strong>Farm</strong>s</strong>: <strong>Family</strong> <strong>Farm</strong> <strong>Report</strong>, 2010 Edition / EIB-66Economic Research Service/USDA
U.S. Department <strong>of</strong> Agriculture, National Commission on Small <strong><strong>Farm</strong>s</strong>(USDA, NCSF). A Time to Act: A <strong>Report</strong> <strong>of</strong> the USDA National Commissionon Small <strong><strong>Farm</strong>s</strong>. Miscellaneous Publication 1545 (MP-1545). January 1998.U.S. Department <strong>of</strong> Agriculture, Office <strong>of</strong> the Chief Economist (USDA,OCE). <strong>Report</strong> <strong>of</strong> the Commission on the Application <strong>of</strong> Payment Limitationsfor Agriculture, Submitted in Response to Section 1605, <strong>Farm</strong> Security <strong>and</strong>Rural Investment Act <strong>of</strong> 2002. August 2003.U.S. Department <strong>of</strong> Commerce, U.S. Census Bureau. 1978 Census <strong>of</strong>Agriculture, Vol. 1: Summary <strong>and</strong> State Data, Part 51: United States, AC78-A-51. July 1981.U.S. Department <strong>of</strong> Commerce, U.S. Census Bureau. “Money Income inthe United States: 1998,” Current Population <strong>Report</strong>s. Series P60-206.September 1999. (Available at: www.census.gov/prod/99pubs/p60-206.pdf).U.S. Department <strong>of</strong> Commerce, U.S. Census Bureau. “Source <strong>and</strong> Accuracy<strong>of</strong> Estimates for Income, Poverty, <strong>and</strong> Health Insurance Coverage in theUnited States: 2008.” May 2010a. (Available at: www.census.gov/hhes/www/hlthins/data/incpovhlth/2008/p60_236sa.pdf).U.S. Department <strong>of</strong> Commerce, U.S. Census Bureau. “Comparability <strong>of</strong>Current Population Survey Income Data with Other Data.” June 2010b.(Available at: www.census.gov/hhes/www/income/data/comparability/index.html)U.S. Department <strong>of</strong> Labor, Bureau <strong>of</strong> Labor Statistics (USDOL, BLS).Employment <strong>and</strong> Earnings. Vol. 55, No. 1, January 2008.U.S. National Archives <strong>and</strong> Records Administration, Office <strong>of</strong> the FederalRegister. Federal Register. Vol. 68, No. 104, May 30, 2003.53<strong>Structure</strong> <strong>and</strong> <strong>Finances</strong> <strong>of</strong> U.S. <strong><strong>Farm</strong>s</strong>: <strong>Family</strong> <strong>Farm</strong> <strong>Report</strong>, 2010 Edition / EIB-66Economic Research Service/USDA
Appendix I: Comparing the Census <strong>and</strong> ERS<strong>Farm</strong> ClassificationsThe 2007 Census <strong>of</strong> Agriculture was the first census to prepare a farmtypology, or farm classification (USDA, NASS, 2009, pp. B8-B9). Most <strong>of</strong>the farm types used by census <strong>and</strong> the Economic Research Service (ERS)are similar, with some minor wording differences (app. table 1), because thecensus typology was based on an earlier version <strong>of</strong> the current ERS classification.In both classification schemes, retirement farms through very largefamily farms—as listed in the table—are defined in terms <strong>of</strong> farm sales <strong>and</strong>the occupation <strong>of</strong> the farm operators. 10There are two major differences between the classifications, however: thetreatment <strong>of</strong> limited-resource farms <strong>and</strong> the definition <strong>of</strong> nonfamily farms.Limited-resource farms were dropped from the ERS classification butretained in the census typology. Nonfamily farms are included in both classificationsbut are defined in terms <strong>of</strong> ownership <strong>of</strong> the farm business byERS—using data from the Agricultural Resource Management Survey(ARMS)—<strong>and</strong> in terms <strong>of</strong> farm organization in the census.10For exact definitions <strong>of</strong> the farm typesin the census typology, see Appendix B<strong>of</strong> United States Summary <strong>and</strong> State Data(USDA, NASS, 2009, pp. B-8 to B-9).For definitions <strong>of</strong> the farm types in theERS classification, see the box “<strong>Farm</strong>Types, 2007” on page 1 <strong>of</strong> this reportLimited-Resource <strong><strong>Farm</strong>s</strong>As explained in the body <strong>of</strong> this report, the limited-resource category waseliminated from the ERS classification because it was inconsistent with therest <strong>of</strong> the farm types. Nevertheless, the census retained limited-resourcefarms, identifying them as farms with sales less than $100,000 <strong>and</strong> operatorhousehold income less than $20,000 (app. table 2). This is similar to anearlier ERS definition <strong>of</strong> limited-resource farms, except the ERS definitionalso required farms assets to be less than $150,000 (Hoppe, 2001, p. 4).Unfortunately, an estimate <strong>of</strong> farm assets is beyond the scope <strong>of</strong> the census.Although limited-resource farms are no longer included in the ERS classification,farms meeting the current USDA-wide definition <strong>of</strong> limited-resourcefarms can be identified in version 1 <strong>of</strong> ARMS. The count <strong>of</strong> limited-resourcefarms under this definition is about 18 percent less than the count under thecensus definition (app. table 2), reflecting the requirement for low householdincome <strong>and</strong> low sales for 2 successive years rather than just 1.Nonfamily <strong><strong>Farm</strong>s</strong>ERS currently defines a nonfamily farm as any farm where the operator <strong>and</strong>persons related to the operator do not hold a majority interest in the business.The census, in contrast, defines nonfamily farms as those organized asa nonfamily corporation or those operated by a hired manager, based on thedefinition used in the earlier version <strong>of</strong> the ERS classification (Hoppe, 2001,p. 4-5). The difference is substantial in this case, with ARMS identifying 41percent fewer nonfamily farms (app. table 2).A confounding factor may be uncertainty among census respondents overwhat exactly constitutes a nonfamily corporation. The distinction betweenfamily <strong>and</strong> nonfamily corporations has not been explained in the instructionsfor the census questionnaire since the 1997 census.54<strong>Structure</strong> <strong>and</strong> <strong>Finances</strong> <strong>of</strong> U.S. <strong><strong>Farm</strong>s</strong>: <strong>Family</strong> <strong>Farm</strong> <strong>Report</strong>, 2010 Edition / EIB-66Economic Research Service/USDA
In fact, the number <strong>of</strong> farms in each <strong>of</strong> the other categories in the ERS classificationis higher than the corresponding census count, with the exception<strong>of</strong> retirement farms (see app. table 1). The higher census count <strong>of</strong> retirementfarms may reflect differences in the census <strong>and</strong> ARMS questionnaires.The census questionnaire simply asked if the operator was currently retired,while the ARMS questionnaire asked if the operator was currently retiredfrom farming, planned to retire within the next 5 years, or planned to retirein more than 5 years. The more involved ARMS question apparently resultedin fewer operators responding that they were currently retired. Of course, thelower number <strong>of</strong> farms in the retirement category in ARMS raises the countsin other types <strong>of</strong> family farms relative to the census.The two farm classifications could be made more comparable in the futureby making three changes—two in the next census (the 2012 Census <strong>of</strong>Agriculture) <strong>and</strong> one in the 2012 ARMS:1. Drop the limited-resource category from the census typology. Thismeans that the census could drop the question on the level <strong>of</strong> theoperator household income. It is difficult to accurately identify lowincomehouseholds with the single question devoted to the topic inthe census questionnaire.2. Identify family farms in the census questionnaire by using theARMS question that asks if more than 50 percent <strong>of</strong> the ownershipinterest in the farm is held by the operator <strong>and</strong> relatives <strong>of</strong> the operator.This would allow the census to more accurately distinguishbetween family <strong>and</strong> nonfamily farms.3. Identify retired farmers in ARMS with the census question, whichsimply asks if the operator is retired. There is no reason for ARMSto delve into the operator’s retirement plans in a census year.If these actions are undertaken, the census could still provide a typology,<strong>and</strong> the typology would be more comparable to the ERS farm classification.Neither classification would identify limited-resource farms. Both would usethe same family/nonfamily farm definition <strong>and</strong> identify retired operators withthe same short question.56<strong>Structure</strong> <strong>and</strong> <strong>Finances</strong> <strong>of</strong> U.S. <strong><strong>Farm</strong>s</strong>: <strong>Family</strong> <strong>Farm</strong> <strong>Report</strong>, 2010 Edition / EIB-66Economic Research Service/USDA
Appendix II: The Agricultural ResourceManagement SurveyMost <strong>of</strong> the farm business <strong>and</strong> farm household data in this report come fromPhase III <strong>of</strong> the 2007 Agricultural Resource Management Survey (ARMS).This appendix presents a brief overview <strong>of</strong> Phase III. For more detailedinformation, see the ARMS briefing room on the ERS website at www.ers.usda.gov/briefing/arms/ or the 2007 Survey Administration Manual (UDSA,NASS, 2008).ARMS is designed <strong>and</strong> conducted each year by the Economic ResearchService (ERS) <strong>and</strong> the National Agricultural Statistics Service (NASS), bothagencies <strong>of</strong> the U.S. Department <strong>of</strong> Agriculture. The survey is conducted inthree phases:1. Phase I is a screening survey used to identify farm operations eligiblefor sampling <strong>and</strong> to determine if they produce specific commoditiestargeted for Phase II that year. Phase I is conducted in the summer<strong>of</strong> the reference year. (The reference year for the survey used in thisreport is 2007.)2. Phase II collects information about chemical use, production practices,<strong>and</strong> variable input costs for the production for specific commodities onselected sample farm operations. Data collection for Phase II occurs inthe fall <strong>and</strong> winter <strong>of</strong> the reference year.3. Phase III collects financial data on U.S. farm businesses <strong>and</strong> informationabout farm operators <strong>and</strong> their households. It is conducted in thespring <strong>of</strong> the year following the reference year, when financial data forthe reference year become available. <strong><strong>Farm</strong>s</strong> contacted for Phase II arealso contacted for Phase III, as are additional farms identified in PhaseI that do not produce the target commodities.Phase III SpecificsPhase III has been conducted since 1996, when the predecessor USDAsurveys were merged: the Cropping Practices Survey (CPS) <strong>and</strong> <strong>Farm</strong> Costs<strong>and</strong> Returns Survey (FCRS). Prior to 1996—from 1984 to 1995—farm business<strong>and</strong> farm household data were collected by FCRS.There are multiple versions <strong>of</strong> Phase III, each with its own questionnaire:• Version 1 <strong>of</strong> the Cost <strong>and</strong> Returns <strong>Report</strong> (CRR). Used in all Statesto collect economic data for the whole farm business—not just informationrelated to a particular commodity—as well as operator <strong>and</strong> operatorhousehold characteristics. In addition, version 1 generally asks moredetailed questions about specific topics, such as farm management practicesor types <strong>of</strong> Government payments received.• Commodity-specific CRR versions. <strong><strong>Farm</strong>s</strong> that were contacted forinformation about the production <strong>of</strong> specific commodities in PhaseII are also contacted to fill out a questionnaire for Phase III. Thecommodity-specific versions in 2007 were cotton (version 2) <strong>and</strong> apples57<strong>Structure</strong> <strong>and</strong> <strong>Finances</strong> <strong>of</strong> U.S. <strong><strong>Farm</strong>s</strong>: <strong>Family</strong> <strong>Farm</strong> <strong>Report</strong>, 2010 Edition / EIB-66Economic Research Service/USDA
(version 3). Respondents provide whole-farm information, with somedetail regarding the specific commodity.• CORE (Version 5). 11 This version was developed to increase samplesize, using a simpler questionnaire <strong>and</strong> collecting whole-farm information.Most <strong>of</strong> the CORE questionnaires are mailed out, but the otherversions are enumerated.11There was no version 4 in 2007. TheCRR version that is not commodity specificis always version 1 <strong>and</strong> the COREis always version 5, even when there arefewer than five versions.ARMS, Phase III is an annual survey that collects financial data on farmbusinesses <strong>and</strong> information on the farm operator <strong>and</strong> the operator household.The target population <strong>of</strong> the survey is all farming units in the 48 contiguousStates that sell or normally would sell at least $1,000 <strong>of</strong> agricultural productsduring the calendar year covered by the survey. The survey typically includes20,000-24,000 observations in its sample, covers all types <strong>of</strong> farms, <strong>and</strong> isdesigned to accurately represent farms <strong>and</strong> production in the continentalUnited States (Hoppe et al., 2010, p 1). Differences are generally stressed inthe text <strong>of</strong> this report only when estimates are significantly different at the95-percent confidence level or higher.ARMS excludes Alaska <strong>and</strong> Hawaii, largely to reduce the cost <strong>of</strong> the survey.Because Alaska <strong>and</strong> Hawaii are excluded, the count <strong>of</strong> farms is slightly lowerin the 2007 ARMS (2,197,000) than in the 2007 census (2,245,000).Operators <strong>and</strong> Their HouseholdsARMS collects detailed information about one operator per surveyed farm.In the case <strong>of</strong> farms with more than one operator, detailed information iscollected about the primary operator <strong>and</strong> limited information is collectedabout secondary operators. Similarly, the survey collects detailed informationabout one primary household per farm <strong>and</strong> limited information about households<strong>of</strong> secondary operators.In this report, the terms “household” <strong>and</strong> “family” are used interchangeably,although ARMS actually collects household data. There is a technicaldifference between a family <strong>and</strong> a household. A family is made up <strong>of</strong> two ormore people who are related to each other. A household consists <strong>of</strong> all thepeople (related <strong>and</strong> unrelated) who live together in a housing unit. ARMSalso includes people dependent on the household who live elsewhere, such ascollege students living away from home.Coordination With the Census <strong>of</strong> AgricultureThe Census <strong>of</strong> Agriculture is currently conducted every 5 years. ARMS <strong>and</strong>census data collection are coordinated in census years (such as 2007), withARMS questions integrated into the census questionnaires <strong>of</strong> those farmsselected for the ARMS sample. The ARMS questions in a census year maynot be identical to those on the census questionnaire, but they are similarenough to provide data for the census.58<strong>Structure</strong> <strong>and</strong> <strong>Finances</strong> <strong>of</strong> U.S. <strong><strong>Farm</strong>s</strong>: <strong>Family</strong> <strong>Farm</strong> <strong>Report</strong>, 2010 Edition / EIB-66Economic Research Service/USDA
Appendix III: Measuring Operator HouseholdIncome <strong>and</strong> Net WorthThe Current Population Survey (CPS), conducted by the U.S. Census Bureau,is the source <strong>of</strong> <strong>of</strong>ficial U.S. household income statistics. Thus, producingan estimate <strong>of</strong> farm household income from the Agricultural ResourceManagement Study (ARMS) that is consistent with CPS methodologyallows income comparisons between farm operator households <strong>and</strong> all U.S.households.The CPS definition <strong>of</strong> farm self-employment income is net money incomefrom the operation <strong>of</strong> a farm by a person on his or her own account, as anowner or tenant. CPS self-employment income includes income received ascash but excludes in-kind or nonmoney receipts. No adjustments are made tothe CPS income measure to reflect inventory changes, since inventory changeis a nonmoney item. The CPS definition departs from a strictly cash conceptby deducting depreciation, a noncash business expense, from the income <strong>of</strong>self-employed people.Operator Household Income<strong>Farm</strong> self-employment income from ARMS is the sum <strong>of</strong> farm businessincome (net cash farm income less depreciation) accruing to the principaloperator’s household plus wages paid to the operator. Adding other farmrelatedincome to farm self-employment income equals earnings <strong>of</strong> the operatorhousehold from farming activities. (Other farm-related earnings consist<strong>of</strong> net income from a farm business other than the one being surveyed, wagespaid by the farm business to household members other than the operator, <strong>and</strong>net income from farml<strong>and</strong> rental.)Finally, adding <strong>of</strong>f-farm income to earnings from farming activities equalstotal operator household income. Off-farm income can come from earnedsources, such as wages, salaries, <strong>and</strong> self-employment income, or fromunearned sources, such as interest, dividends, <strong>and</strong> transfer payments,including Social Security.Operator Household Net WorthARMS is also the source <strong>of</strong> data for estimates <strong>of</strong> operator households’ networth. The net worth <strong>of</strong> farm operator households is defined as the differencebetween their assets <strong>and</strong> liabilities. It is calculated as the sum <strong>of</strong> the operatorhousehold’s farm net worth <strong>and</strong> nonfarm net worth. If the net worth <strong>of</strong> thefarm is shared with other households (such as the households <strong>of</strong> shareholdersin a family corporation), only the operator household’s share is included.Additional InformationFor more information on operator household income, see “<strong>Farm</strong> HouseholdEconomics <strong>and</strong> Well Being,” a briefing room on the Economic ResearchService (ERS) website at www.ers.usda.gov/briefing/wellbeing/). Householdincome estimates presented in this report are consistent with those from the59<strong>Structure</strong> <strong>and</strong> <strong>Finances</strong> <strong>of</strong> U.S. <strong><strong>Farm</strong>s</strong>: <strong>Family</strong> <strong>Farm</strong> <strong>Report</strong>, 2010 Edition / EIB-66Economic Research Service/USDA
iefing room. Both sets <strong>of</strong> estimates are derived from ARMS for the principaloperator households using CPS procedures.Household income estimates cannot be derived from the sector estimates <strong>of</strong>net farm income presented in another ERS briefing room, “<strong>Farm</strong> Income <strong>and</strong>Costs” (www.ers.usda.gov/briefing/farmincome/). The farm sector estimatesare estimated from several data sources <strong>and</strong> include all participants in farmproduction, including contractors <strong>and</strong> share l<strong>and</strong>lords who do not farm. Formore information, see Harrington et al. (1998, pp. 45-52).60<strong>Structure</strong> <strong>and</strong> <strong>Finances</strong> <strong>of</strong> U.S. <strong><strong>Farm</strong>s</strong>: <strong>Family</strong> <strong>Farm</strong> <strong>Report</strong>, 2010 Edition / EIB-66Economic Research Service/USDA
Appendix IV: Government Payments—Survey Versus Administrative DataThe Agricultural Resource Management Survey (ARMS) collects information—includinginformation about the receipt <strong>of</strong> farm program payments—directly from farmers. This allows analysts to show which types <strong>of</strong> farmsreceive various payments. For example, the body <strong>of</strong> this report shows thatcommodity-related payments flow largely to family farms with sales <strong>of</strong> atleast $100,000, while l<strong>and</strong>-retirement programs go mostly to smaller familyfarms. Although collecting information directly from farmers does allowlinking Government payments to farm <strong>and</strong> farm operator characteristics,it may also introduce errors. For example, respondents may not be able toprovide complete or accurate information due to incomplete records, difficultiesin interpreting the questionnaire, or other reasons.Another source <strong>of</strong> information on Government payments is administrativedata based on the records maintained by the agencies that make thepayments. Administrative data capture all the payments made (barring errorsin recordkeeping), including payments made to nonoperator l<strong>and</strong>lords whodo not farm but still receive Government payments associated with theirfarml<strong>and</strong>. The Economic Research Service (ERS) uses administrative datafrom other agencies—aggregated to the State level—to estimate Governmentpayments in its data series, “U.S. <strong>and</strong> State <strong>Farm</strong> Income” (also known asthe sector accounts). Nevertheless, despite the completeness <strong>of</strong> the administrativedata used in the sector accounts, Government payments from theaccounts cannot be linked to farm <strong>and</strong> farm operator characteristics.Total Payments From ARMS <strong>and</strong> the Sector AccountsARMS estimates <strong>of</strong> total Government payments are lower than the correspondingestimate from the sector accounts, by about $3.1 billion in 2007(app. table 3). One reason for the difference is that ARMS excludes farmprogram payments made to nonoperator l<strong>and</strong>lords—approximately $1.7billion in 2007—while the sector accounts include them. ARMS contactsfarm operators exclusively (<strong>and</strong> not nonoperator l<strong>and</strong>lords), while the sectoraccounts include all Government payments, even those made to nonoperatorl<strong>and</strong>lords. In addition, all survey data are subject to sampling <strong>and</strong> nonsamplingerrors. These errors may also contribute to a smaller ARMS estimate,although they theoretically could make the estimates smaller or larger.Defining the two types <strong>of</strong> errors is fairly straightforward (U.S. Department<strong>of</strong> Commerce, U.S. Census Bureau, 2010a, pp. 3-4; U.S. Department <strong>of</strong>Commerce, U.S. Census Bureau, 1999, pp. E-2 to E-3). Sampling error is thedifference between an estimate based on a sample survey <strong>and</strong> the estimatethat would occur if the sample included the whole population. Nonsamplingerror is the difference between an estimate based on a sample survey thatincludes the whole population <strong>and</strong> the true population value (approximatedby the sector estimate, in this case). Sources <strong>of</strong> nonsampling error include:• <strong>Farm</strong> operators are unable (or unwilling) to provide the correctresponses.61<strong>Structure</strong> <strong>and</strong> <strong>Finances</strong> <strong>of</strong> U.S. <strong><strong>Farm</strong>s</strong>: <strong>Family</strong> <strong>Farm</strong> <strong>Report</strong>, 2010 Edition / EIB-66Economic Research Service/USDA
• <strong>Farm</strong> operators forget minor or irregular payments.• <strong>Farm</strong> operators (or interviewers) experience difficulties in interpretingthe question.• Errors occur in data processing, such as recording or coding the dataincorrectly or losing questionnaires.• Errors occur in imputing values for missing data.• Some farm operators that should have been in the sample are missed(coverage error).Appendix table 3Government payments by program from ARMS <strong>and</strong> the sector accounts, 2007ItemARMS Sector accounts 1 Capture rate 2Amount Distribution Amount DistributionMil. $ Percent Mil. $ PercentNot adjusted for nonoperator l<strong>and</strong>lordsTotal Government payments 8,751 100.0 11,903 100.0 73.5Commodity-related payments 6,516 74.5 8,831 74.2 73.8Direct <strong>and</strong> counter-cyclical payments 5,242 59.9 6,185 52.0 84.8Direct 4,160 47.5 5,060 42.5 82.2Counter-cyclical 1,082 12.4 1,125 9.5 96.2Marketing loan benefits 3 145 1.7 1,115 9.4 13.0Other commodity-related payments 4 1,129 12.9 1,531 12.9 73.7Conservation payments 2,234 25.5 3,072 25.8 72.7L<strong>and</strong>-retirement 5 1,757 20.1 1,929 16.2 91.1Working-l<strong>and</strong> 6 477 5.5 620 5.2 76.9Programs not listed in ARMS questionnaire 7 — — 523 4.4 —Adjusted for nonoperator l<strong>and</strong>lords 8Total Government payments 8,751 100.0 10,156 85.3 86.21From the U.S. <strong>and</strong> State <strong>Farm</strong> Income Data series—the farm sector accounts—prepared by the Economic Research Service.2The ratio <strong>of</strong> the ARMS estimate to the sector estimate, expressed as a percentage.3Loan deficiency payments, marketing loan gains, <strong>and</strong> net value <strong>of</strong> commodity certificates.4Disaster <strong>and</strong> market loss payments, peanut quota compensation, milk income loss contract payments, other Federal program payments,<strong>and</strong> State <strong>and</strong> local program payments.5Conservation Reserve Program, Conservation Reserve Enhancement Program, Wetl<strong>and</strong>s Reserve Program, <strong>and</strong> <strong>Farm</strong>ableWetl<strong>and</strong>s Reserve Program.6Environmental Quality Incentives Program <strong>and</strong> Conservation Security Program.7Agricultural Conservation Program, Agricultural Management Assistance, Forestry Conservation Reserve, Grassl<strong>and</strong>s ReserveProgram, Soil/Water Conservation Assistance, Agricultural Management Assistance Program, <strong>Farm</strong>l<strong>and</strong> Protection Program,Forestry Incentives Program, Wildlife Habitat Incentive Program, etc.8Government payments to l<strong>and</strong>lords ($1.7 billion) was subtracted from the sector estimate, to be consistent with ARMS.Sources: USDA, National Agricultural Statistics Service <strong>and</strong> Economic Research Service, 2007 Agricultural Resource ManagementSurvey (ARMS), Phase III. USDA, Economic Research Service, U.S. <strong>and</strong> State <strong>Farm</strong> Income Data (the farm sector accounts) atwww.ers.usda.gov/data/farmincome/finfidmu.htm.62<strong>Structure</strong> <strong>and</strong> <strong>Finances</strong> <strong>of</strong> U.S. <strong><strong>Farm</strong>s</strong>: <strong>Family</strong> <strong>Farm</strong> <strong>Report</strong>, 2010 Edition / EIB-66Economic Research Service/USDA
Capture RatesARMS captured 74 percent <strong>of</strong> the sector estimate <strong>of</strong> total Governmentpayments in 2007. The sector estimate, however, is made up <strong>of</strong> two parts—the farm share <strong>of</strong> $10.2 billion <strong>and</strong> the nonoperator l<strong>and</strong>lord share <strong>of</strong> $1.7billion, mentioned earlier. If the ARMS estimate is compared only with thefarm share <strong>of</strong> the sector estimate, the ARMS capture rate increases to 86percent (see the bottom <strong>of</strong> the table).The U.S. Census Bureau calculated a capture rate <strong>of</strong> the same magnitude asthe ARMS rate when comparing income from its Current Population Survey(CPS) with an estimate based on administrative <strong>and</strong> other secondary data(U.S. Department <strong>of</strong> Commerce, U.S. Census Bureau, 2010b). Aggregateincome from the CPS in recent years typically has captured about 89 percent<strong>of</strong> the aggregate personal income estimated by the Bureau <strong>of</strong> EconomicAnalysis. Interestingly, the 2007 Census <strong>of</strong> Agriculture has a 68-percentunadjusted capture rate for Government payments, 6 percentage points lessthan the 2007 ARMS rate in the table. Total Government payments in thecensus are $8 billion, or 9 percent less than the corresponding estimate fromARMS.Program CategoriesNonoperator l<strong>and</strong>lords’ Government payments cannot be allocated to individualprograms in the sector accounts. This means appendix table 3 understatesthe capture rates for different types <strong>of</strong> programs, since the ARMSestimates in the table—which exclude payments to nonoperator l<strong>and</strong>lords—must be divided by sector estimates that do include those l<strong>and</strong>lord payments.Nevertheless, examining the capture rate for each category gives an idea <strong>of</strong>the reliability <strong>of</strong> the ARMS estimate for different types <strong>of</strong> payments. MostARMS estimates are reasonably close to the sector estimates, roughly within70 to 90 percent <strong>of</strong> the corresponding sector estimates.The sole exception is marketing loan benefits: ARMS captures only 13percent <strong>of</strong> the sector estimate. In 2007, nearly all <strong>of</strong> those payments wentto cotton producers, who <strong>of</strong>ten sold their cotton through cooperatives. Thecooperatives collected marketing loan benefits as they sold the cotton <strong>and</strong>then passed the benefits on to their members. It may have been difficult forrespondents to separate marketing loan gains from other receipts from theircooperatives. If this difficulty did indeed lower the estimate <strong>of</strong> marketingloan gains, a nonsampling error occurred.Which Source To Use?Both ARMS <strong>and</strong> the sector accounts provide useful information aboutGovernment payments. The choice <strong>of</strong> the data source to use depends onthe questions under consideration. The sector accounts are preferable foraggregate totals, since ARMS does not survey all recipients while the sectoraccounts tally up all the payments made, program by program, even forsmall programs. Thus, the sector data are useful in underst<strong>and</strong>ing the size<strong>and</strong> composition <strong>of</strong> payments made by the Government to farmers. Thesedata also are useful for following long-term trends in Government payments63<strong>Structure</strong> <strong>and</strong> <strong>Finances</strong> <strong>of</strong> U.S. <strong><strong>Farm</strong>s</strong>: <strong>Family</strong> <strong>Farm</strong> <strong>Report</strong>, 2010 Edition / EIB-66Economic Research Service/USDA
ecause the sector accounts extend back to 1910, long before the inception <strong>of</strong>Government payments in the 1930s.On the other h<strong>and</strong>, ARMS is useful in underst<strong>and</strong>ing who receives payments,since it collects detailed information on farm <strong>and</strong> household characteristics—whichadministrative data lack. Because ARMS is a survey <strong>of</strong> farmers,however, it underestimates payments, with the degree <strong>of</strong> underestimationvarying by program category. This problem can be alleviated by focusing onless detailed categories. For example, this report focuses on total commodityrelatedpayments rather than individual components <strong>of</strong> the category.64<strong>Structure</strong> <strong>and</strong> <strong>Finances</strong> <strong>of</strong> U.S. <strong><strong>Farm</strong>s</strong>: <strong>Family</strong> <strong>Farm</strong> <strong>Report</strong>, 2010 Edition / EIB-66Economic Research Service/USDA