A New Benchmark: Speech Perception in Everyday Life ... - Med-El
A New Benchmark: Speech Perception in Everyday Life ... - Med-El
A New Benchmark: Speech Perception in Everyday Life ... - Med-El

Create successful ePaper yourself
Turn your PDF publications into a flip-book with our unique Google optimized e-Paper software.
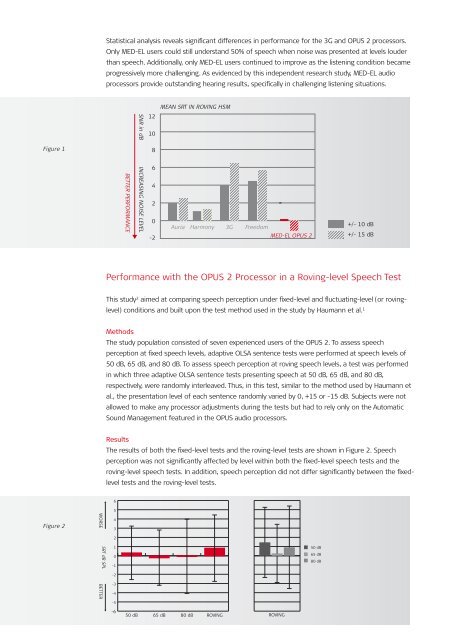
Figure 1<br />
Figure 2<br />
2<br />
WORSE<br />
SRT dB SPL<br />
BETTER<br />
Statistical analysis reveals significant differences <strong>in</strong> performance for the 3G and OPUS 2 processors.<br />
Only MED-EL users could still understand 50% of speech when noise was presented at levels louder<br />
than speech. Additionally, only MED-EL users cont<strong>in</strong>ued to improve as the listen<strong>in</strong>g condition became<br />
progressively more challeng<strong>in</strong>g. As evidenced by this <strong>in</strong>dependent research study, MED-EL audio<br />
processors provide outstand<strong>in</strong>g hear<strong>in</strong>g results, specifically <strong>in</strong> challeng<strong>in</strong>g listen<strong>in</strong>g situations.<br />
BETTER PERFORMANCE<br />
Performance with the OPUS 2 Processor <strong>in</strong> a Rov<strong>in</strong>g-level <strong>Speech</strong> Test<br />
This study 2 aimed at compar<strong>in</strong>g speech perception under fixed-level and fluctuat<strong>in</strong>g-level (or rov<strong>in</strong>g-<br />
level) conditions and built upon the test method used <strong>in</strong> the study by Haumann et al. 1<br />
Methods<br />
The study population consisted of seven experienced users of the OPUS 2. To assess speech<br />
perception at fixed speech levels, adaptive OLSA sentence tests were performed at speech levels of<br />
50 dB, 65 dB, and 80 dB. To assess speech perception at rov<strong>in</strong>g speech levels, a test was performed<br />
<strong>in</strong> which three adaptive OLSA sentence tests present<strong>in</strong>g speech at 50 dB, 65 dB, and 80 dB,<br />
respectively, were randomly <strong>in</strong>terleaved. Thus, <strong>in</strong> this test, similar to the method used by Haumann et<br />
al., the presentation level of each sentence randomly varied by 0, +15 or -15 dB. Subjects were not<br />
allowed to make any processor adjustments dur<strong>in</strong>g the tests but had to rely only on the Automatic<br />
Sound Management featured <strong>in</strong> the OPUS audio processors.<br />
Results<br />
SNR <strong>in</strong> dB<br />
INCREASING NOISE LEVEL<br />
12<br />
10<br />
8<br />
6<br />
4<br />
2<br />
0<br />
-2<br />
MEAN SRT IN ROVING HSM<br />
Auria<br />
Harmony<br />
The results of both the fixed-level tests and the rov<strong>in</strong>g-level tests are shown <strong>in</strong> Figure 2. <strong>Speech</strong><br />
perception was not significantly affected by level with<strong>in</strong> both the fixed-level speech tests and the<br />
rov<strong>in</strong>g-level speech tests. In addition, speech perception did not differ significantly between the fixed-<br />
level tests and the rov<strong>in</strong>g-level tests.<br />
6<br />
5<br />
4<br />
3<br />
2<br />
1<br />
0<br />
-1<br />
-2<br />
-3<br />
-4<br />
-5<br />
-6<br />
3G Freedom<br />
MED-EL OPUS 2<br />
50 dB 65 dB 80 dB ROVING<br />
ROVING<br />
50 dB<br />
65 dB<br />
80 dB<br />
+/- 10 dB<br />
+/- 15 dB