

Theoretical and Experimental Study of the Electronic Structures of ...
Theoretical and Experimental Study of the Electronic Structures of ...
Theoretical and Experimental Study of the Electronic Structures of ...

Create successful ePaper yourself
Turn your PDF publications into a flip-book with our unique Google optimized e-Paper software.
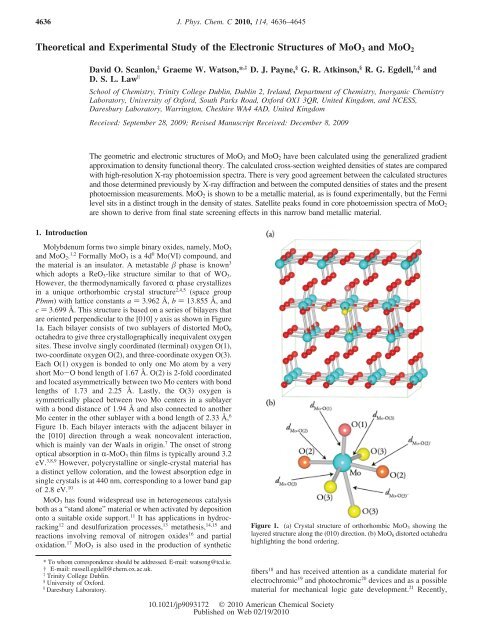
4638 J. Phys. Chem. C, Vol. 114, No. 10, 2010 Scanlon et al.behavior <strong>of</strong> <strong>the</strong>se materials <strong>and</strong> also accounting for <strong>the</strong> drivingforce for distortion in terms <strong>of</strong> stabilization <strong>of</strong> two electronsper metal pair in a metal-metal bond. By contrast, in <strong>the</strong> d 2oxide MoO 2 <strong>the</strong> one extra electron per metal cation partiallypopulates <strong>the</strong> higher t ⊥ b<strong>and</strong>s. MoO 2 <strong>the</strong>refore displays bothmetallic conductivity <strong>and</strong> metal-metal bonding. A refinement<strong>of</strong> <strong>the</strong> Goodenough model takes account <strong>of</strong> <strong>the</strong> possibility <strong>of</strong>π-type overlap between pairs <strong>of</strong> t ⊥ orbitals. 45,46MoO 2 is less important in technological applications thanMoO 3 , but it has been used as a catalyst for alkane isomerization47–51 or oxidation 52 reactions <strong>and</strong> as a gas sensor. 53 It is alsoa promising anode material for Li ion batteries. 54–57There have been several previous studies <strong>of</strong> MoO 2 by X-rayphotoelectron spectroscopy. 2,45,47–49,51,52,58,59 Valence level spectrashow that a b<strong>and</strong> <strong>of</strong> Mo 4d states around 3 eV wide lies abovean O 2p b<strong>and</strong> whose width is about 6 eV. However, <strong>the</strong> energyresolution in this previous work has in general been too poorto properly reveal <strong>the</strong> expected splitting <strong>of</strong> <strong>the</strong> Mo 4d b<strong>and</strong>spredicted by <strong>the</strong> Goodenough model. The splitting has howeverbeen observed in ultraviolet photoemission spectra. 45,52,58 Inaddition, XAS has been used to explore <strong>the</strong> unoccupied O 2pstates <strong>and</strong> has found three distinct peaks 0.4, 3.1, <strong>and</strong> 4.6 eVabove <strong>the</strong> Fermi energy. 46 Optical reflectivity measurementshave been used to infer that <strong>the</strong> lowest unfilled Mo 4d levelsare situated ∼2.5 eV above <strong>the</strong> top <strong>of</strong> <strong>the</strong> O 2p b<strong>and</strong>s. 60–62<strong>Theoretical</strong>ly MoO 2 has received less attention than MoO 3 ,with only a h<strong>and</strong>ful <strong>of</strong> studies in <strong>the</strong> literature. 42,46,63–67 Thesehave included tight binding 42 <strong>and</strong> cluster calculations. 42,63–66Recently, two studies by Eyert <strong>and</strong> co-workers used LDA within<strong>the</strong> augmented spherical wave (ASW) method to study <strong>the</strong>Peierls-like instability in MoO 2 <strong>and</strong> investigated <strong>the</strong> Fermisurface <strong>of</strong> MoO 2 in comparison with angle-resolved photoemissionspectroscopy <strong>and</strong> de Haas-van Alphen measurements. 46,67This work identified three Fermi surface sheets with electroneffective masses <strong>of</strong> 0.85 m 0 , 1.87 m 0 , <strong>and</strong> 2.85 m 0 , where m 0 is<strong>the</strong> electron rest mass.In <strong>the</strong> present study we used GGA density functional <strong>the</strong>orycalculations to study <strong>the</strong> geometry <strong>and</strong> electronic structure <strong>of</strong>MoO 2 <strong>and</strong> MoO 3 . The <strong>the</strong>oretical results are compared withhigh-resolution X-ray photoemission data. We find excellentagreement between experimental X-ray valence b<strong>and</strong> photoemissionspectra <strong>and</strong> <strong>the</strong> calculated cross-section weighteddensity <strong>of</strong> states. At <strong>the</strong> same time it is shown that <strong>the</strong> complexcore level structure noted previously for MoO 2 <strong>and</strong> attributed47–49,51,52to complex <strong>and</strong> ill-defined “surface phases” such as Mo 2 O 5is intrinsic to <strong>the</strong> material <strong>and</strong> arises from final state metallicscreening.2. <strong>Theoretical</strong> MethodsThe periodic DFT code VASP 68,69 was employed for all ourcalculations. This uses a plane wave basis set to describe <strong>the</strong>valence electronic states. The Perdew-Burke-Ernzerh<strong>of</strong> 70(PBE) gradient-corrected functional was used to treat <strong>the</strong>exchange <strong>and</strong> correlation. Interactions between <strong>the</strong> cores (Mo:[Kr] <strong>and</strong> O:[He]) <strong>and</strong> <strong>the</strong> valence electrons were described using<strong>the</strong> projector-augmented wave 71 (PAW) method.Structural optimizations <strong>of</strong> bulk MoO 2 were performed at aseries <strong>of</strong> volumes in order to calculate <strong>the</strong> equilibrium latticeparameters. In each case <strong>the</strong> atomic positions, lattice vectors,<strong>and</strong> cell angles were allowed to relax, while <strong>the</strong> total volumewas held constant. The resulting energy volume curves werefitted to <strong>the</strong> Murnaghan 72 equation <strong>of</strong> state to obtain <strong>the</strong>equilibrium bulk cell volume. This approach avoids <strong>the</strong> problems<strong>of</strong> Pulay stress <strong>and</strong> changes in basis set which can accompanyvolume changes in plane wave calculations. Convergence withrespect to k-point sampling <strong>and</strong> plane wave energy cut <strong>of</strong>f waschecked, with a cut<strong>of</strong>f <strong>of</strong> 500 eV <strong>and</strong> a k-point sampling <strong>of</strong> 4× 6 × 4 found to be sufficient. Structural optimizations weredeemed to be converged when <strong>the</strong> force on every ion was lessthan 0.005 eV Å -1 .As MoO 3 is a layered structure, with <strong>the</strong> interlayer distancedetermined by noncovalent interlayer forces, a simple relaxationas outlined above is not sufficient. DFT methods have long beenknown to be unable to describe van der Waals forcescorrectly, 29,73–78 <strong>and</strong> as expected, attempting to minimize <strong>the</strong>structure using <strong>the</strong> system above resulted in <strong>the</strong> absence <strong>of</strong> aminimum in <strong>the</strong> b vector. Indeed, relaxing <strong>the</strong> stress tensor atan elevated cut<strong>of</strong>f <strong>of</strong> 1000 eV gave a b lattice parameter <strong>of</strong>16.539 Å, which far exceeds <strong>the</strong> experimentally reported value<strong>of</strong> 13.855 Å. Thus, we used <strong>the</strong> method proposed by Coquet<strong>and</strong> Willock, 29 which involved holding <strong>the</strong> b lattice parameterat <strong>the</strong> experimental value <strong>of</strong> 13.855 Å <strong>and</strong> optimizing <strong>the</strong> a<strong>and</strong> c lattice constants by allowing <strong>the</strong> atomic coordinates torelax at a series <strong>of</strong> fixed volumes around <strong>the</strong> experimentallyreported lattice parameters. A cut<strong>of</strong>f <strong>of</strong> 500 eV <strong>and</strong> a k-pointsampling <strong>of</strong> 6 × 2 × 6 were found to be sufficient, <strong>and</strong> structuraloptimizations were deemed to be converged when <strong>the</strong> force onevery ion was less than 0.005 eV Å -1 , consistent with <strong>the</strong> MoO 2calculations above.3. <strong>Experimental</strong> SectionSingle-crystal MoO 3 was prepared by a flux method. 79 Thesample selected for study by photoemission had a plate-likemorphology with dimensions <strong>of</strong> around 8 mm × 4mm× 1mm <strong>and</strong> came from a batch <strong>of</strong> crystals previously used inconductivity measurements. 80 The large flat face had (010)orientation. A second crystal from <strong>the</strong> batch was ground to apowder, <strong>and</strong> it was confirmed that <strong>the</strong> powder X-ray diffractionpattern matched that described in <strong>the</strong> literature <strong>and</strong> wasconsistent with orthorhombic space group Pbnm with a ) 3.962Å, b ) 13.855 Å, <strong>and</strong> c ) 3.696 Å. 4,5,81 MoO 2 was prepared byreduction <strong>of</strong> MoO 3 in a flowing H 2 /H 2 O/Ar mixture as describedelsewhere. 58 The H 2 /H 2 O atmosphere was set with p H2 ) 25.8Torr, p H2O ) 2.4 Torr, <strong>and</strong> with a balance <strong>of</strong> Ar around 730Torr, <strong>and</strong> reduction was carried out at 547 °C over a period <strong>of</strong>4 days. The effective oxygen partial pressure under <strong>the</strong>seconditions is estimated to be about 10 -11 mbar, <strong>and</strong> <strong>the</strong>seconditions render MoO 2 <strong>the</strong> <strong>the</strong>rmodynamically favored product.The O/Mo ratio in <strong>the</strong> product was established to be 2.000 (0.002 by a volumetric procedure involving oxidation byK 3 Fe(CN) 6 . 82 The powder sample was pressed between tungstencarbide dies to give a ceramic disk which was <strong>the</strong>n sintered invacuo in a sealed quartz tube at 900 °C to give mechanicalstrength. The final pelletized sample gave a monoclinic X-raypowder diffraction pattern in agreement with that publishedpreviously <strong>and</strong> consistent with space group P21c with a ) 561pm, b ) 486 pm, c ) 563 pm, <strong>and</strong> β ) 121°. 39,42,81High-resolution X-ray photoemission spectra were measuredin a Scienta ESCA 300 spectrometer. This incorporates a rotatinganode Al KR (hν ) 1486.6 eV) X-ray source, a 7-crystal X-raymonochromator, <strong>and</strong> a 300 mm mean radius spherical sectorelectron energy analyzer with a parallel electron detectionsystem. The X-ray source was run with 200 mA emission current<strong>and</strong> 14 kV anode bias, while <strong>the</strong> analyzer operated at 150 eVpass energy. Gaussian convolution <strong>of</strong> <strong>the</strong> analyzer resolutionwith a line width <strong>of</strong> 260 meV for <strong>the</strong> X-ray source gives aneffective instrument resolution <strong>of</strong> 400 meV. Binding energiesare referenced to <strong>the</strong> Fermi energy <strong>of</strong> a silver sample regularly
<strong>Electronic</strong> <strong>Structures</strong> <strong>of</strong> MoO 3 <strong>and</strong> MoO 2 J. Phys. Chem. C, Vol. 114, No. 10, 2010 4639TABLE 1: Calculated Lattice Parameters <strong>and</strong> M-O BondDistances for Bulk MoO 3 Compared to Previous <strong>Theoretical</strong>Works <strong>and</strong> Experimentthiswork GGA 29 LDA 26 HF 7 experiment 5 experiment 6a 4.023 4.022 3.729 3.910 3.962 3.963b 13.855 13.855 13.036 14.271 13.855 13.855c 3.755 3.752 3.478 3.680 3.699 3.696d M-O1 1.703 1.70 1.67 1.643 1.710 1.670d M-O2 1.761 1.75 1.75 1.687 1.958 1.730d M-O2′ 2.278 2.29 2.24 2.237 2.029 2.250d M-O3 1.975 1.97 1.94 1.937 1.899 1.950d M-O3′ 2.340 2.34 2.32 2.212 2.471 2.250used to calibrate <strong>the</strong> spectrometer. Samples were mounted onmolybdenum stubs, <strong>and</strong> in situ cleaning in <strong>the</strong> spectrometer wasachieved by electron beam heating <strong>of</strong> <strong>the</strong> rear <strong>of</strong> <strong>the</strong> stub in <strong>the</strong>sample preparation chamber. The heater was configured toeliminate direct impact <strong>of</strong> electrons on <strong>the</strong> front <strong>of</strong> <strong>the</strong> sample.This cleaning heating arrangement has been used in manyprevious studies in <strong>the</strong> Scienta XPS system. 83–87 The surface <strong>of</strong>as-presented MoO 2 was contaminated with MoO 3 (see below)formed when <strong>the</strong> reduced sample is exposed to air. Simple<strong>the</strong>rmochemical considerations suggest that it should be possibleto find a temperature regime where MoO 3 will be unstable withrespect to decomposition into MoO 2 without <strong>the</strong> MoO 2 itselfdecomposing to give Mo metal because <strong>the</strong> enthalpy change islower for <strong>the</strong> former process:2ΜoΟ 3 f 2ΜoΟ 2 + Ο 2ΜoΟ 2 f Μo + Ο 2∆Η 0 )+407 kJ/mol∆Η 0 )+556 kJ/molIt was established empirically that heating at around 500 °Cfor 1 h led to removal <strong>of</strong> MoO 3 contamination. This temperatureis somewhat lower than that used in <strong>the</strong> bulk syn<strong>the</strong>sis because<strong>the</strong> oxygen partial pressure in <strong>the</strong> spectrometer UHV system isbelow 10 -12 mbar <strong>and</strong> is <strong>the</strong>refore lower than that establishedby <strong>the</strong> H 2 /H 2 O mixture.The core lines were fitted using a series <strong>of</strong> pseudo-Voigtfunctions with a variable Gaussian to Lorentzian ratio. In <strong>the</strong>initial stages <strong>of</strong> <strong>the</strong> curve fitting <strong>the</strong> data for MoO 2 <strong>the</strong> separationbetween <strong>the</strong> chemically shifted components <strong>of</strong> <strong>the</strong> Mo 3dspin-orbit doublets was constrained at <strong>the</strong> value found forMoO 3 , where a single pair <strong>of</strong> spin-orbit split componentsdominates <strong>the</strong> spectrum. In addition, <strong>the</strong> intensity ratio between3d 5/2 <strong>and</strong> 3d 3/2 components was fixed at 6:4. However, in <strong>the</strong>later stages <strong>of</strong> <strong>the</strong> curve fit this latter constraint was relaxed toallow for <strong>the</strong> possibility that <strong>the</strong> 3d 5/2 <strong>and</strong> 3d 3/2 spin orbitalsmay have different ionization cross sections. In curve fitting<strong>the</strong> data for MoO 2 it was fur<strong>the</strong>r necessary to allow <strong>the</strong> screenedfinal state components (see below) <strong>of</strong> <strong>the</strong> Mo 3d core line toassume <strong>the</strong> asymmetric line shape characteristic <strong>of</strong> metallicmaterials due to electron hole pair excitations around <strong>the</strong> Fermienergy.4. Results <strong>and</strong> DiscussionComputational Results on MoO 3 . The GGA-calculatedlattice parameters for MoO 3 are shown in Table 1. Calculatedlattice constants are in excellent agreement with experiment 5,6<strong>and</strong> with previous GGA calculations. 29 GGA is known tooverestimate lattice vectors, whereas LDA underestimates latticeconstants, a trend which is clear from Table 1. The calculatedFigure 3. <strong>Electronic</strong> density <strong>of</strong> states for MoO 3 : (a) Total EDOS, (b)Mo PEDOS, <strong>and</strong> (c) O PEDOS. The blue lines represent d states, greens states, <strong>and</strong> red p states. The highest occupied state is set to 0 eV.bond lengths are also in agreement with previous GGAcalculations 29 but are on average much closer to <strong>the</strong> experimentalresults <strong>of</strong> Kihlborg 6 than to <strong>the</strong> study <strong>of</strong> Sitepu et al., 5 eventhough <strong>the</strong> starting structure used for <strong>the</strong> minimization was takenfrom <strong>the</strong> latter. Both studies reported that MoO 3 crystallizeswith space group Pbnm. From analysis <strong>of</strong> our geometries, weconclude that <strong>the</strong> structure derived by Kihlborg et al. wouldseem more consistent with our calculated structure than that <strong>of</strong>Sitepu et al.The GGA-calculated total <strong>and</strong> partial (ion decomposed)electronic densities <strong>of</strong> states EDOS/PEDOS for MoO 3 is shownin Figure 3. The valence b<strong>and</strong> is split up into four main regions(labeled I-IV), with <strong>the</strong> conduction b<strong>and</strong> labeled V. Region Iis dominated by O 2p states with some significant mixing withMo 4d states. Region II is mainly composed <strong>of</strong> O 2p states,again with some mixing with <strong>the</strong> Mo 4d states. Region III ismade up <strong>of</strong> mainly O 2p states, with some small contributionsfrom Mo 4d, <strong>and</strong> region IV is completely dominated by O 2pstates, with only a very minor contribution from any Mo states.The conduction b<strong>and</strong> is dominated by Mo d states with somehybridization with O 2p states. Valence b<strong>and</strong>s with O 2p statesdominating at <strong>the</strong> VBM <strong>and</strong> cation d states dominating at <strong>the</strong>CBM are a general feature <strong>of</strong> <strong>the</strong> electronic structure <strong>of</strong> wideb<strong>and</strong> gap binary d 0 oxides. 33,73 Above <strong>the</strong> Fermi level, <strong>the</strong> twooxygen peaks found at ∼1.4, ∼2.2, <strong>and</strong> ∼3.05 eV <strong>and</strong> areconsistent with previous XAS results, which found peaks at 1.4<strong>and</strong> 3.1 eV above <strong>the</strong> Fermi energy. 24The calculated b<strong>and</strong> structure for MoO 3 along <strong>the</strong> highsymmetrypoints is shown in Figure 4. The VBM is found tobe situated at U, with <strong>the</strong> CBM situated at Γ, resulting in anindirect b<strong>and</strong> gap <strong>of</strong> 1.95 eV. The lowest direct gap is found atΓ <strong>and</strong> has a value <strong>of</strong> 2.76 eV. Previous calculations using HF 7<strong>and</strong> LAPW within <strong>the</strong> LDA framework 28 placed <strong>the</strong> VBM atR, which in our study is 0.03 eV below U. The indirect nature<strong>of</strong> <strong>the</strong> lowest gap accounts for <strong>the</strong> discrepancy between <strong>the</strong>positions <strong>of</strong> absorption edges for thin film <strong>and</strong> single-crystalsamples alluded to above. However, as is usual with densityfunctional calculations <strong>the</strong> magnitude <strong>of</strong> <strong>the</strong> lowest gap derivedfrom <strong>the</strong> calculation is smaller than that observed experimentally.Computational Results on MoO 2 . Table 2 displays <strong>the</strong>GGA-calculated structural data for MoO 2 . The calculated lattice
<strong>Electronic</strong> <strong>Structures</strong> <strong>of</strong> MoO 3 <strong>and</strong> MoO 2 J. Phys. Chem. C, Vol. 114, No. 10, 2010 4641TABLE 3: Parameters from Curve Fits to O 1s <strong>and</strong> Mo 3dCore Lines <strong>of</strong> MoO 3 <strong>and</strong> MoO 2material peak a (eV)bindingenergyfwhm (eV)relativeareaMoO 3 O 1s main 530.31 1.17 1.00cleaned O 1s contaminant 531.46 1.37 0.09MoO 2 O 1s main 530.11 1.18 1.00as presented O 1s contaminant 531.27 1.51 0.40MoO 2 O 1s main 530.05 1.01 1.00cleaned O 1s satellite 531.17 1.82 0.63MoO 3 Mo 3d 5/2 4d 0 232.48 0.86 1.00cleaned Mo 3d 3/2 4d 0 235.63 0.92 0.65Mo 3d 5/2 4d n 230.75 0.74 0.03Mo 3d 3/2 4d n 233.90 0.83 0.02MoO 2cleanedMo 3d 5/2 screened 229.27 0.60 (0.26/0.34) b 1.00Mo 3d 3/2 screened 232.47 0.75 (0.33/0.42) b 0.67Mo 3d 5/2 unscreened 231.00 2.14 1.25Mo 3d 3/2 unscreened 234.21 2.21 0.83Mo 3d 5/2 metal 228.29 0.88 0.005Mo 3d 3/2 metal 231.49 0.90 0.003a Entries in italics relate to structure associated with surfacecontamination (MoO 3 <strong>and</strong> as-presented MoO 2 ) or Mo metal (formedin electron beam heating <strong>of</strong> MoO 2 ). b Screened final state peaks forMoO 2 are asymmetric. The numbers in paren<strong>the</strong>ses give <strong>the</strong> widthsat half-maximum height about <strong>the</strong> midline <strong>of</strong> <strong>the</strong> peak.Figure 8. (a) Mo 3d structure <strong>of</strong> MoO 2 after UHV electron beamanneal at 500 °C for 1 h. Structure due to MoO 3 has been removed toreveal an intrinsic spectrum consisting <strong>of</strong> two overlapping spin-orbitdoublets. There is also a very weak doublet associated with Mo metalproduced around <strong>the</strong> edge <strong>of</strong> <strong>the</strong> sample by stray electrons from <strong>the</strong>electron beam heater. However, this structure contributes only around0.2% <strong>of</strong> <strong>the</strong> intensity <strong>of</strong> <strong>the</strong> overall spectrum. (b) Exp<strong>and</strong>ed view <strong>of</strong><strong>the</strong> Mo 3d 5/2 screened final state component after stripping out o<strong>the</strong>rcomponents generated by <strong>the</strong> peak fit above. This reveals <strong>the</strong> asymmetricline shape <strong>of</strong> <strong>the</strong> screened final state component.Figure 7. (a) Mo 3d structure <strong>of</strong> single-crystal MoO 3 after gentle annealin UHV. There is evidence <strong>of</strong> slight surface reduction. (b) Mo 3dstructure <strong>of</strong> as-presented MoO 2 . The spectrum is a superposition <strong>of</strong>intrinsic structure associated with MoO 2 (see Figure 8a) along with acontribution from surface MoO 3 contamination. The MoO 3 contributionis indicated by <strong>the</strong> dashed lines.treatment also led to removal <strong>of</strong> structure in <strong>the</strong> Mo 3d regionassociated with MoO 3 to leave a spectrum dominated by twooverlapping spin-orbit doublets, as shown in Figure 8. Theresolution achieved in <strong>the</strong> current work is much better than inprevious experimental work on MoO 2 . 2,47–49,51,52,58,59 The complexcore line shape is characteristic <strong>of</strong> narrow b<strong>and</strong> metallicoxides where <strong>the</strong> width <strong>of</strong> <strong>the</strong> conduction b<strong>and</strong> is comparablewith <strong>the</strong> potential generated by <strong>the</strong> core hole. 89–954–10 The corehole <strong>the</strong>refore pulls a localized 4d level out <strong>of</strong> <strong>the</strong> conductionb<strong>and</strong>. As discussed in detail elsewhere 89,91–94 <strong>the</strong> componentsat low binding energy (labeled (s) in Figure 8) are due to wellscreenedfinal states in which <strong>the</strong> localized level becomesoccupied by an itinerant conduction electron, while <strong>the</strong> broadercomponents at higher binding energy are associated withunscreened final states, labeled (u) in <strong>the</strong> figure, where <strong>the</strong>localized level remains empty. The high resolution achieved in<strong>the</strong> current work allows us to measure <strong>the</strong> full width at halfmaximumheight (fwhm) <strong>of</strong> <strong>the</strong> 3d 5/2 screened final state peakas 0.60 eV. The peaks associated with screened final statesdisplay a distinctly asymmetric line shape resulting fromelectron-hole pair excitations around <strong>the</strong> Fermi energy inducedby <strong>the</strong> appearance <strong>of</strong> <strong>the</strong> core hole. The higher binding energyunscreened 3d 5/2 peak has a fwhm <strong>of</strong> 2.14 eV, <strong>and</strong> in anunconstrained curve fit using pseudo-Voigt functions <strong>the</strong> peakis found to have 80% Lorentzian character. This is associatedwith lifetime broadening characteristic <strong>of</strong> <strong>the</strong> final state screening
4642 J. Phys. Chem. C, Vol. 114, No. 10, 2010 Scanlon et al.process. The energy separation between screened <strong>and</strong> unscreened3d 5/2 peaks is 1.63 eV, which is almost exactly equal to <strong>the</strong>plasmon energy <strong>of</strong> 1.56 eV for MoO 2 45 measured by electronenergy loss spectroscopy. The unscreened final state peaks may<strong>the</strong>refore be regarded as unusually strong plasmon satellites, asfirst proposed by Wer<strong>the</strong>im. 92 Our interpretation <strong>of</strong> <strong>the</strong> core levelstructure in terms <strong>of</strong> intrinsic final state screening effects is verydifferent to that popular in <strong>the</strong> catalytic literature, which hasmostly ignored <strong>the</strong> narrow b<strong>and</strong> metallic nature <strong>of</strong> MoO 2 <strong>and</strong>attempted to associate what we believe to be intrinsic satelliteswith “Mo 2 O 5 ” surface contamination 47–49,51,52 even though <strong>the</strong>reis no known Mo(V) oxide bulk phase. We note here thatChambers <strong>and</strong> co-workers studied <strong>the</strong> photoelectron diffractionpr<strong>of</strong>iles <strong>of</strong> satellites found in Ru 3d core XPS <strong>of</strong> metallic RuO 2 . 96The satellites were very similar to those observed in <strong>the</strong> currentwork, <strong>and</strong> it was shown that <strong>the</strong> angular variation in <strong>the</strong> satelliteintensity mirrored that <strong>of</strong> <strong>the</strong> main peak. This establishesdefinitively that <strong>the</strong> satellite intensity derives from Ru ionsoccupying identical sites to those responsible for <strong>the</strong> main peak<strong>and</strong> that <strong>the</strong> satellite structure is <strong>the</strong>refore intrinsic to RuO 2 <strong>and</strong>does not arise from ill-defined surface phases with oxidationstates greater than than (IV).Fur<strong>the</strong>r support for our interpretation is provided by <strong>the</strong> factthat <strong>the</strong> O 1s spectrum <strong>of</strong> MoO 2 also contains a very strongsatellite separated from <strong>the</strong> main peak by 1.12 eV, as shown inFigure 9. This is a little lower than <strong>the</strong> satellite energy for <strong>the</strong>Mo 3d core lines, but it is not unreasonable to expect that <strong>the</strong>screening response upon generation <strong>of</strong> an O 1s core hole shouldbe different than that in response to generation <strong>of</strong> a Mo 3d corehole because <strong>the</strong> conduction b<strong>and</strong> is composed mainly <strong>of</strong> Mo4d states. We can rule out <strong>the</strong> possibility that <strong>the</strong> O 1s satellitearises from OH or carbonate surface contamination (which cangive peaks to high binding energy <strong>of</strong> <strong>the</strong> main peak in oxides)on <strong>the</strong> basis that (i) <strong>the</strong> satellite is much more intense than <strong>the</strong>contaminant high binding energy structure found for MoO 3 , eventhough <strong>the</strong> latter has been subject to in situ surface cleaning ata lower temperature than MoO 2 , (ii) <strong>the</strong> satellite intensity forMoO 2 increases after in situ cleaning (this is compatible withremoval <strong>of</strong> a surface layer <strong>of</strong> MoO 3 , which does not have astrong satellite, but difficult to underst<strong>and</strong> if <strong>the</strong> satellite isassociated with surface contamination), (iii) <strong>the</strong> satellite peakhas a dominantly Lorentzian line shape (80% Lorentziancontribution to <strong>the</strong> pseudo-Voigt pr<strong>of</strong>ile in an unconstrained fit)as expected for a plasmon loss peak, (iv) similar O 1s structureis found for o<strong>the</strong>r metallic oxides, such as <strong>the</strong> sodium tungstenbronzes, 92 Sb-doped SnO 2 , 97 <strong>and</strong> defect doped PbO 2-x . 98 Theclosely related nonmetallic oxides WO 3 , undoped SnO 2 , <strong>and</strong>PbO do not display a pronounced O 1s satellite.Valence B<strong>and</strong> Spectra. Valence b<strong>and</strong> X-ray photoemissionspectra <strong>of</strong> MoO 3 <strong>and</strong> MoO 2 are shown in Figure 10. The spectramay be compared with <strong>the</strong> computed density <strong>of</strong> states but with<strong>the</strong> different partial densities <strong>of</strong> states weighted by one-electronionization cross sections. At hν ) 1486.6 eV, <strong>the</strong> relevant oneelectroncross section for ionization <strong>of</strong> O2pstates is 0.06 kB,whereas <strong>the</strong> cross section for Mo 4d states is 0.92 kB. The crosssectionweighted density <strong>of</strong> states is <strong>the</strong>refore very muchdominated by <strong>the</strong> Mo 4d contribution which is weighted by afactor <strong>of</strong> 15 relative to O 2p. 99For MoO 3 <strong>the</strong> biggest Mo 4d contribution to <strong>the</strong> occupieddensity <strong>of</strong> states is found in regions I <strong>and</strong> II toward <strong>the</strong> middle<strong>and</strong> bottom <strong>of</strong> <strong>the</strong> valence b<strong>and</strong> (see Figure 10), with only asmall contribution in region IV where <strong>the</strong> O 2p partial density<strong>of</strong> states is at a maximum. In agreement with <strong>the</strong> calculation<strong>the</strong> structure associated with III <strong>and</strong> IV appears as a shoulderFigure 9. (a) O 1s core level structure <strong>of</strong> MoO 3 after cleaning samplesin UHV at 300 °C. (b) O 1s core line <strong>of</strong> as-presented MoO 2 .(c)O1score line <strong>of</strong> MoO 2 after in situ cleaning. Note that <strong>the</strong> intensity <strong>of</strong> <strong>the</strong>high binding energy satellite peak <strong>of</strong> MoO 2 increases after <strong>the</strong> cleaningprocedure.on <strong>the</strong> low binding energy side <strong>of</strong> II in <strong>the</strong> experimentalspectrum ra<strong>the</strong>r than IV appearing as a maximum, as in <strong>the</strong>unweighted density <strong>of</strong> states. This situation is reversed in lowerenergy ultraviolet photoemission spectra where peak IV dominates<strong>the</strong> valence b<strong>and</strong> photoemission. 23 In agreement with <strong>the</strong>core level data a weak peak associated with occupied Mo 4dstates appears close to <strong>the</strong> Fermi energy. This must be associatedwith O vacancy defects to give MoO 3-x , which is no longer4d 0 . 23 Linear extrapolation <strong>of</strong> <strong>the</strong> valence b<strong>and</strong> edge to zerointensity gives a valence b<strong>and</strong> onset energy <strong>of</strong> 2.8 eV. If it isassumed that <strong>the</strong> defect states pin <strong>the</strong> Fermi energy close to <strong>the</strong>bottom <strong>of</strong> <strong>the</strong> conduction b<strong>and</strong> this onset energy is in agreementwith an indirect gap <strong>of</strong> 2.82 eV as determined by absorptionmeasurements on single crystals. 10 The width <strong>of</strong> <strong>the</strong> valenceb<strong>and</strong> is calculated to be ∼6.3 eV, which is just under <strong>the</strong> value<strong>of</strong> 7 eV measured in <strong>the</strong> present work <strong>and</strong> in ref 23. The small
<strong>Electronic</strong> <strong>Structures</strong> <strong>of</strong> MoO 3 <strong>and</strong> MoO 2 J. Phys. Chem. C, Vol. 114, No. 10, 2010 4643Figure 10. Valence b<strong>and</strong> XPS <strong>of</strong> (a) MoO 3 <strong>and</strong> (b) MoO 2 . The spectrum <strong>of</strong> MoO 3 contains some weak Mo 4d states in <strong>the</strong> bulk b<strong>and</strong> gap which mustbe associated with partial surface reduction. The strong Mo 4d structure for MoO 2 is split into two due to Mo-Mo bonding along <strong>the</strong> c axis <strong>of</strong> <strong>the</strong> distortedrutile structure. (c <strong>and</strong> d) Computed cross-section weighted densities <strong>of</strong> states. (e) Detail <strong>of</strong> <strong>the</strong> Mo 4d conduction b<strong>and</strong> structure for MoO 2 .discrepancy is not surprising as GGA calculations are knownto slightly underestimate <strong>the</strong> width <strong>of</strong> valence b<strong>and</strong>s. 83,100–102The photoemission spectrum <strong>of</strong> MoO 2 also mirrors <strong>the</strong> Mo4d partial density <strong>of</strong> states. Two strong <strong>and</strong> relatively narrowpeaks appear above <strong>the</strong> O 2p valence b<strong>and</strong> as in <strong>the</strong> calculation.These are associated with <strong>the</strong> σ- <strong>and</strong> π-bonding states discussedabove: in agreement with <strong>the</strong> calculation <strong>the</strong> π bonding is notstrong enough to split <strong>the</strong> t ⊥ (π) b<strong>and</strong>s <strong>of</strong>f completely from <strong>the</strong>rest <strong>of</strong> <strong>the</strong> unoccupied Mo 4d b<strong>and</strong>s to give an insulatingmaterial. Thus, MoO 2 is a metallic oxide, as is found in transportmeasurements. However, <strong>the</strong> Fermi level is located in apronounced trough in <strong>the</strong> density <strong>of</strong> states. This is in agreementwith <strong>the</strong> placement <strong>of</strong> <strong>the</strong> Fermi level relative to <strong>the</strong> peakmaximum <strong>of</strong> IV shown in greater detail in <strong>the</strong> lower panel <strong>of</strong>Figure 10. The peaks in <strong>the</strong> Mo 4d b<strong>and</strong>s are found 0.60 <strong>and</strong>1.60 eV below <strong>the</strong> Fermi level, in good agreement with <strong>the</strong>computed values <strong>of</strong> 0.50 <strong>and</strong> 1.35 eV, respectively. The overallwidth <strong>of</strong> <strong>the</strong> occupied b<strong>and</strong> states is just under 10 eV, which isagain slightly greater than <strong>the</strong> calculated value <strong>of</strong> 8 eV.5. ConclusionThe geometry <strong>and</strong> electronic structure <strong>of</strong> MoO 3 <strong>and</strong> MoO 2have been studied using high-resolution X-ray photoemissionspectroscopy <strong>and</strong> ab initio density functional <strong>the</strong>ory calculations.We find good agreement between <strong>the</strong> calculated structural data<strong>and</strong> previous X-ray diffraction data. Cross-section weightedGGA density <strong>of</strong> states <strong>and</strong> <strong>the</strong> XPS spectra are in excellentagreement, with MoO 3 shown to be insulating <strong>and</strong> MoO 2 shownto be metallic, consistent with previous experimental studies.The position <strong>of</strong> <strong>the</strong> Fermi level for MoO 2 is, however, found toreside in a deep trough in <strong>the</strong> density <strong>of</strong> states. It is demonstratedthat satellite peaks found in core photoemission spectra <strong>of</strong> MoO 2derive from final state screening effects, <strong>and</strong> <strong>the</strong> separation
4644 J. Phys. Chem. C, Vol. 114, No. 10, 2010 Scanlon et al.between <strong>the</strong> “main” peaks <strong>and</strong> <strong>the</strong>ir satellites is very close to<strong>the</strong> conduction electron plasmon energy measured in electronenergy loss spectroscopy.Acknowledgment. The <strong>the</strong>oretical work was supported byScience Foundation Irel<strong>and</strong> through <strong>the</strong> research frontiersprogramme (grant nos. 08/RFP/MTR1044 <strong>and</strong> 09/RFP/MTR2274). Calculations were performed on <strong>the</strong> IITAC supercomputeras maintained by TCHPC <strong>and</strong> <strong>the</strong> Stokes supercomputeras maintained by ICHEC. The NCESS facility atDaresbury Laboratory is supported by EPSRC grant EP/E025722/1. D.J.P. is supported by a Junior Research Fellowshipat Christchurch College, Oxford.References <strong>and</strong> Notes(1) Hamnett, A.; Goodenough, J. B.; L<strong>and</strong>olt-Bornstein NumericalData <strong>and</strong> Functional Relationships in Science <strong>and</strong> Technology; Springer-Verlag: Berlin, 1984; Vol. 17g, Part III.(2) Khyzhun, O. Y.; Bekenev, V. L.; Solonin, Y. M. J. Alloys Compd.2008, 459, 22.(3) Carcia, P. F.; McCarron, E. M. Thin Solid Films 1987, 155, 53.(4) Andersson, G.; Magneli, A. Acta Chem. Sc<strong>and</strong>. 1950, 4, 793.(5) Sitepu, H.; O’Connor, B. H.; Li, D. J. Appl. Crystallogr. 2005,38, 158.(6) Kihlborg, L. Ark. Kem. 1964, 21, 443.(7) Cora, F.; Patel, A.; Harrison, N. M.; Roetti, C.; Catlow, C. R. A.J. Mater. Chem. 1997, 7, 959.(8) Sabhapathi, V. K.; Hussain, O. M.; Uthanna, S.; Naidu, B. S.;Reddy, P. J. J. Mater. Sci. Lett. 1995, 14, 411.(9) Sabhapathi, V. K.; Hussain, O. M.; Uthanna, S.; Reddy, P. J.Mater. Lett. 1994, 20, 175.(10) Juryska, R. Phys. Stat. Solidi B: Basic Res. 1975, 72, K161.(11) Kung, H. K. Transition metal oxides: surface chemistry <strong>and</strong>catalysis; Elsevier: Amsterdam, 1989; Vol. 45.(12) Haber, J.; Wojciechowska, M. MgF 2 : Supported transition metaloxide monolayers-A novel type <strong>of</strong> catalysts. 2nd Tokyo Conference onAdvanced Catalytic Science <strong>and</strong> Technology, Tokyo, Japan 1994.(13) Kim, M. C.; Kim, K. L. Korean J. Chem. Eng. 1996, 13, 1.(14) Grunert, W.; Stakheev, A. Y.; Feldhaus, R.; Anders, K.; Shpiro,E. S.; Minachev, K. M. J. Catal. 1992, 135, 287.(15) Grunert, W.; Stakheev, A. Y.; Morke, W.; Feldhaus, R.; Anders,K.; Shpiro, E. S.; Minachev, K. M. J. Catal. 1992, 135, 269.(16) Matralis, H.; Theret, S.; Bastians, P.; Ruwet, M.; Grange, P. Appl.Catal., B 1995, 5, 271.(17) Taylor, S. H.; Hargreaves, J. S. J.; Hutchings, G. J.; Joyner, R. W.Appl. Catal., A 1995, 126, 287.(18) Ozkan, U. S.; Gooding, R. E.; Schilf, B. T. Partial oxidation <strong>of</strong>C-5 hydrocarbons to maleic <strong>and</strong> phthalic anhydrides oVer molybdate-basedcatalysts; Symposium on Catalytic Heterogeneous Hydrocarbon Oxidation,211th National Meeting <strong>of</strong> <strong>the</strong> American Chemical Society, New Orleans,LA, 1996.(19) Li, Y. M.; Kudo, T. Properties <strong>of</strong> mixed-oxide MoO3/V2O5electrochromic films coated from peroxo-polymolybdoVanadate solutions;1st International Meeting on Electrochromism (IME-1), Murano Venice,Italy, 1994.(20) Yao, J. N.; Hashimoto, K.; Fujishima, A. Nature 1992, 355, 624.(21) Sheehan, P. E.; Lieber, C. M. Science 1996, 272, 1158.(22) Lee, S. H.; Kim, Y. H.; Deshp<strong>and</strong>e, R.; Parilla, P. A.; Whitney,E.; Gillaspie, D. T.; Jones, K. M.; Mahan, A. H.; Zhang, S. B.; Dillon,A. C. AdV. Mater. 2008, 20, 3627.(23) Firment, L. E.; Ferretti, A. Surf. Sci. 1983, 129, 155.(24) Learmonth, T.; McGuinness, C.; Glans, P. A.; Kennedy, B.; John,J. S.; Guo, J. H.; Greenblatt, M.; Smith, K. E. Phys. ReV. B2009, 79, 8.(25) Tokarz-Sobieraj, R.; Hermann, K.; Witko, M.; Blume, A.; Mestl,G.; Schlogl, R. Surf. Sci. 2001, 489, 107.(26) Chen, M.; Waghmare, U. V.; Friend, C. M.; Kaxiras, E. J. Chem.Phys. 1998, 109, 6854.(27) Rozzi, C. A.; Manghi, F.; Parmigiani, F. Phys. ReV. B2003, 68,075106.(28) Sayede, A. D.; Amriou, T.; Pernisek, M.; Khelifa, B.; Mathieu,C. Chem. Phys. 2005, 316, 72.(29) Coquet, R.; Willock, D. J. Phys. Chem. Chem. Phys. 2005, 7, 3819.(30) Chen, M.; Friend, C. M.; Kaxiras, E. J. Chem. Phys. 2000, 112,9617.(31) Chen, M.; Friend, C. M.; Kaxiras, E. J. Am. Chem. Soc. 2001,123, 2224.(32) Scanlon, D. O.; Walsh, A.; Morgan, B. J.; Nolan, M.; Fearon, J.;Watson, G. W. J. Phys. Chem. C 2007, 111, 7971.(33) Morgan, B. J.; Watson, G. W. Surf. Sci. 2007, 601, 5034.(34) Nolan, M.; Parker, S. C.; Watson, G. W. Surf. Sci. 2005, 595,223.(35) Nolan, M.; Watson, G. W. J. Chem. Phys. 2006, 125, 144701.(36) Walsh, A.; Yan, Y. F.; Al-Jassim, M. M.; Wei, S. H. J. Phys.Chem. C 2008, 112, 12044.(37) Magneli, A.; Blomberghansson, B.; Kihlborg, L.; Sundkvist, G.Acta Chem. Sc<strong>and</strong>. 1955, 9, 1382.(38) Heinrich, V. E.; Cox, P. A. The Surface Science <strong>of</strong> Metal Oxides;Cambridge University Press: Cambridge, 1994.(39) Magneli, A.; Andersson, G. Acta Chem. Sc<strong>and</strong>. 1955, 9, 1378.(40) Br<strong>and</strong>t, B. G. Acta Chem. Sc<strong>and</strong>. 1967, 21, 661.(41) Camargo, A. C.; Igualada, J. A.; Beltran, A.; Llusar, R.; Longo,E.; Andres, J. Chem. Phys. 1996, 212, 381.(42) Rogers, D. B.; Shannon, R. D.; Sleight, A. W.; Gillson, J. L. Inorg.Chem. 1969, 8, 841.(43) Cheetham, A. K.; Rao, C. N. R. Acta Crystallogr., Sect. B: Struct.Sci. 1976, 32, 1579.(44) Goodenough, J. B. Prog. Solid State Chem. 1971, 5, 145.(45) Gulino, A.; Parker, S.; Jones, F. H.; Egdell, R. G. J. Chem. Soc.,Faraday Trans. 1996, 92, 2137.(46) Eyert, V.; Horny, R.; Hock, K. H.; Horn, S. J. Phys.-Condes.Matter 2000, 12, 4923.(47) Katrib, A.; Leflaive, P.; Hilaire, L.; Maire, G. Catal. Lett. 1996,38, 95.(48) Katrib, A.; Logie, V.; Peter, M.; Wehrer, P.; Hilaire, L.; Maire,G. J. Chim. Phys. Phys.-Chim. Biol. 1997, 94, 1923.(49) Katrib, A.; Logie, V.; Saurel, N.; Wehrer, P.; Hilaire, L.; Maire,G. Surf. Sci. 1997, 377-379, 754.(50) Katrib, A.; Mey, D.; Maire, G. Catal. Today 2001, 179.(51) Katrib, A.; Sobczak, J. W.; Krawczyk, M.; Zommer, L.; Benadda,A.; Jablonski, A.; Maire, G. Surf. Interface Anal. 2002, 34, 225.(52) Marin-Flores, O.; Scudiero, L.; Ha, S. Surf. Sci. 2009, 603, 2327.(53) de Moraes, M. A. B.; Trasferetti, B. C.; Rouxinol, F. P.; L<strong>and</strong>ers,R.; Durrant, S. F.; Scarminio, J.; Urbano, A. Chem. Mater. 2004, 16, 513.(54) Auborn, J. J.; Barberio, Y. L. J. Electrochem. Soc. 1987, 134,638.(55) Liang, Y. G.; Yang, S. J.; Yi, Z. H.; Lei, X. F.; Sun, J. T.; Zhou,Y. H. Mater. Sci. Eng. B: Solid State Mater. AdV. Technol. 2005, 121, 152.(56) Yang, L. C.; Gao, Q. S.; Zhang, Y. H.; Tang, Y.; Wu, Y. P.Electrochem. Commun. 2008, 10, 118.(57) Yang, L. C.; Gao, Q. S.; Tang, Y.; Wu, Y. P.; Holze, R. J. PowerSources 2008, 179, 357.(58) Beatham, N.; Orchard, A. F. J. Electron Spectrosc. Relat. Phenom.1979, 16, 77.(59) Werfel, F.; Minni, E. J. Phys. C: Solid State Phys. 1983, 16, 6091.(60) Chase, L. L. Phys. ReV. B1974, 10, 2226.(61) Chase, L. L. Bull. Am. Phys. Soc. 1974, 19, 271.(62) Dissanayake, M.; Chase, L. L. Phys. ReV. B1978, 18, 6872.(63) Burdett, J. K. Inorg. Chem. 1985, 24, 2244.(64) Sasaki, T. A.; Kiuchi, K. Chem. Phys. Lett. 1981, 84, 356.(65) Sasaki, T. A.; Soga, T.; Adachi, H. Phys. Stat. Solidi B: BasicRes. 1982, 113, 647.(66) Yoshino, H.; Shimokoshi, K.; Miyazaki, E. J. Electron Spectrosc.Relat. Phenom. 1985, 36, 269.(67) Moosburger-Will, J.; Kuendel, J.; Klemm, M.; Horn, S.; H<strong>of</strong>mann,P.; Schwingenschloegl, U.; Eyert, V. arXiv 2009, arXiv:0812.1911.(68) Kresse, G.; Furthmuller, J. Comput. Mater. Sci. 1996, 6, 15.(69) Kresse, G.; Hafner, J. Phys. ReV. B1994, 49, 14251.(70) Perdew, J. P.; Burke, K.; Ernzerh<strong>of</strong>, M. Phys. ReV. Lett. 1997,78, 1396.(71) Blochl, P. E. Phys. ReV. B1994, 50, 17953.(72) Murnaghan, F. D. Proc. Natl. Acad. Sci. U.S.A. 1944, 30, 244.(73) Scanlon, D. O.; Walsh, A.; Morgan, B. J.; Watson, G. W. J. Phys.Chem. C 2008, 112, 9903.(74) Walsh, A.; Watson, G. W. J. Solid State Chem. 2005, 178, 1422.(75) Walsh, A.; Watson, G. W. Phys. ReV. B2004, 70, 235114.(76) Watson, G. W. J. Chem. Phys. 2001, 114, 758.(77) Rydberg, H.; Dion, M.; Jacobson, N.; Schroder, E.; Hyldgaard,P.; Simak, S. I.; Langreth, D. C.; Lundqvist, B. I. Phys. ReV. Lett. 2003,91, 126402.(78) Kerber, T.; Sierka, M.; Sauer, J. J. Comput. Chem. 2008, 29, 2088.(79) Wanklyn, B. M. J. Mater. Sci. 1972, 7, 813.(80) P<strong>and</strong>it, A. K.; Prasad, M.; Ansari, T. H.; Singh, R. A.; Wanklyn,B. M. Solid State Commun. 1991, 80, 125.(81) Magneli, A.; Andersson, G.; Blomberg, B.; Kihlborg, L. Anal.Chem. 1952, 24, 1998.(82) Choain, C.; Marion, F. Bull. Soc. Chim. Fr. 1963, 212.(83) Arnold, T.; Payne, D. J.; Bourlange, A.; Hu, J. P.; Egdell, R. G.;Piper, L. F. J.; Colakerol, L.; De Masi, A.; Glans, P.-A.; Learmonth, T.;Smith, K. E.; Guo, J.; Scanlon, D. O.; Walsh, A.; Morgan, B. J.; Watson,G. W. Phys. ReV. B2009, 79, 075102.(84) Payne, D. J.; Egdell, R. G.; Walsh, A.; Watson, G. W.; Guo, J.;Glans, P. A.; Learmonth, T.; Smith, K. E. Phys. ReV. Lett. 2006, 96, 157403.
<strong>Electronic</strong> <strong>Structures</strong> <strong>of</strong> MoO 3 <strong>and</strong> MoO 2 J. Phys. Chem. C, Vol. 114, No. 10, 2010 4645(85) Lynch, C. C. B.; Egdell, R. G.; Law, D. S. L. Chem. Phys. Lett.2005, 401, 223.(86) Morris, D.; Dou, Y.; Rebane, J.; Mitchell, C. E. J.; Egdell, R. G.;Law, D. S. L.; Vittadini, A.; Casarin, M. Phys. ReV. B2000, 61, 13445.(87) Hu, J. P.; Payne, D. J.; Egdell, R. G.; Glans, P. A.; Learmonth,T.; Smith, K. E.; Guo, J.; Harrison, N. M. Phys. ReV. B2008, 77, 155115.(88) In Practical Surface Analsysis; Briggs, D., Seah, M. P., Eds.; JohnWiley: Chichester, 1994.(89) Beatham, N.; Cox, P. A.; Egdell, R. G.; Orchard, A. F. Chem.Phys. Lett. 1980, 69, 479.(90) Kotani, A.; Toyozawa, Y. J. Phys. Soc. Jpn. 1974, 37, 912.(91) Campagna, M.; Wer<strong>the</strong>im, G. K.; Shanks, H. R.; Zumsteg, F.;Banks, E. Phys. ReV. Lett. 1975, 34, 738.(92) Chazalviel, J. N.; Campagna, M.; Wer<strong>the</strong>im, G. K.; Shanks, H. R.Phys. ReV. B1977, 16, 697.(93) Wer<strong>the</strong>im, G. K. Chem. Phys. Lett. 1979, 65, 377.(94) Wer<strong>the</strong>im, G. K.; Hufner, S. Phys. ReV. Lett. 1975, 35, 53.(95) Egdell, R. G.; Innes, H.; Hill, M. D. Surf. Sci. 1985, 149, 33.(96) Kim, Y. J.; Gao, Y.; Chambers, S. A. Appl. Surf. Sci. 1997, 120,250.(97) Egdell, R. G.; Rebane, J.; Walker, T. J.; Law, D. S. L. Phys. ReV.B 1999, 59, 1792.(98) Payne, D. J.; Egdell, R. G.; Law, D. S. L.; Glans, P. A.; Learmonth,T.; Smith, K. E.; Guo, J. H.; Walsh, A.; Watson, G. W. J. Mater. Chem.2007, 17, 267.(99) Yeh, J. J.; Lindau, I. At. Data Nucl. Data Tables 1985, 32, 1.(100) Glans, P. A.; Learmonth, T.; McGuinness, C.; Smith, K. E.; Guo,J. H.; Walsh, A.; Watson, G. W.; Egdell, R. G. Chem. Phys. Lett. 2004,399, 98.(101) Glans, P. A.; Learmonth, T.; Smith, K. E.; Guo, J.; Walsh, A.;Watson, G. W.; Terzi, F.; Egdell, R. G. Phys. ReV. B2005, 71, 235109.(102) Scanlon, D. O.; Walsh, A.; Morgan, B. J.; Watson, G. W.; Payne,D. J.; Egdell, R. G. Phys. ReV. B2009, 79, 035101.JP9093172