

PDF: 477 KB - Bureau of Infrastructure, Transport and Regional ...
PDF: 477 KB - Bureau of Infrastructure, Transport and Regional ...
PDF: 477 KB - Bureau of Infrastructure, Transport and Regional ...

You also want an ePaper? Increase the reach of your titles
YUMPU automatically turns print PDFs into web optimized ePapers that Google loves.
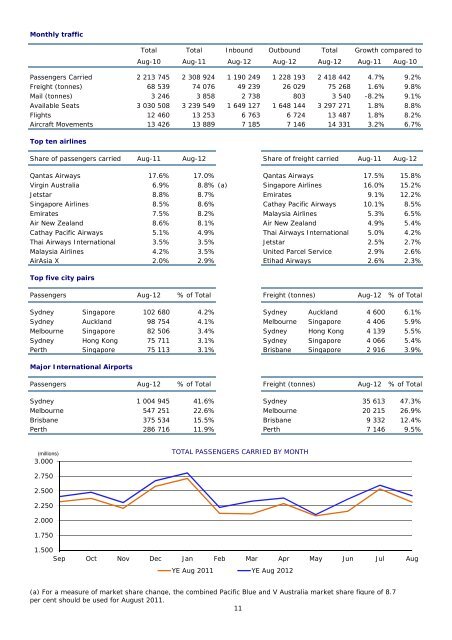
Monthly trafficTotal Total Inbound Outbound Total Growth compared toAug-10 Aug-11 Aug-12 Aug-12 Aug-12 Aug-11 Aug-10Passengers Carried 2 213 745 2 308 924 1 190 249 1 228 193 2 418 442 4.7% 9.2%Freight (tonnes) 68 539 74 076 49 239 26 029 75 268 1.6% 9.8%Mail (tonnes) 3 246 3 858 2 738 803 3 540 -8.2% 9.1%Available Seats 3 030 508 3 239 549 1 649 127 1 648 144 3 297 271 1.8% 8.8%Flights 12 460 13 253 6 763 6 724 13 487 1.8% 8.2%Aircraft Movements 13 426 13 889 7 185 7 146 14 331 3.2% 6.7%Top ten airlinesShare <strong>of</strong> passengers carried Aug-11 Aug-12 Share <strong>of</strong> freight carried Aug-11 Aug-12Qantas Airways 17.6% 17.0% Qantas Airways 17.5% 15.8%Virgin Australia 6.9% 8.8% (a) Singapore Airlines 16.0% 15.2%Jetstar 8.8% 8.7% Emirates 9.1% 12.2%Singapore Airlines 8.5% 8.6% Cathay Pacific Airways 10.1% 8.5%Emirates 7.5% 8.2% Malaysia Airlines 5.3% 6.5%Air New Zeal<strong>and</strong> 8.6% 8.1% Air New Zeal<strong>and</strong> 4.9% 5.4%Cathay Pacific Airways 5.1% 4.9% Thai Airways International 5.0% 4.2%Thai Airways International 3.5% 3.5% Jetstar 2.5% 2.7%Malaysia Airlines 4.2% 3.5% United Parcel Service 2.9% 2.6%AirAsia X 2.0% 2.9% Etihad Airways 2.6% 2.3%Top five city pairsPassengers Aug-12 % <strong>of</strong> Total Freight (tonnes) Aug-12 % <strong>of</strong> TotalSydney Singapore 102 680 4.2% Sydney Auckl<strong>and</strong> 4 600 6.1%Sydney Auckl<strong>and</strong> 98 754 4.1% Melbourne Singapore 4 406 5.9%Melbourne Singapore 82 506 3.4% Sydney Hong Kong 4 139 5.5%Sydney Hong Kong 75 711 3.1% Sydney Singapore 4 066 5.4%Perth Singapore 75 113 3.1% Brisbane Singapore 2 916 3.9%Major International AirportsPassengers Aug-12 % <strong>of</strong> Total Freight (tonnes) Aug-12 % <strong>of</strong> TotalSydney 1 004 945 41.6% Sydney 35 613 47.3%Melbourne 547 251 22.6% Melbourne 20 215 26.9%Brisbane 375 534 15.5% Brisbane 9 332 12.4%Perth 286 716 11.9% Perth 7 146 9.5%(millions)3.000TOTAL PASSENGERS CARRIED BY MONTH2.7502.5002.2502.0001.7501.500Sep Oct Nov Dec Jan Feb Mar Apr May Jun Jul AugYE Aug 2011 YE Aug 2012(a) For a measure <strong>of</strong> market share change, the combined Pacific Blue <strong>and</strong> V Australia market share figure <strong>of</strong> 8.7per cent should be used for August 2011.11


