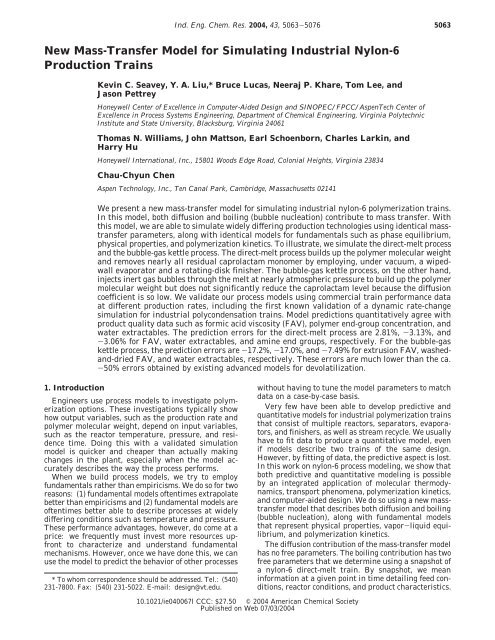
New Mass-Transfer Model for Simulating Industrial Nylon-6 ...
New Mass-Transfer Model for Simulating Industrial Nylon-6 ...
New Mass-Transfer Model for Simulating Industrial Nylon-6 ...

Create successful ePaper yourself
Turn your PDF publications into a flip-book with our unique Google optimized e-Paper software.
Ind. Eng. Chem. Res., Vol. 43, No. 17, 2004 5065complicated reactor internals to generate the interfacialsurface area.3. <strong>Model</strong> DevelopmentWe now discuss how we model both the direct-meltprocess and the bubble-gas kettle process. We includethree key, fundamental aspects, which are (1) reactionkinetics, (2) phase equilibrium and physical properties,and (3) mass-transfer-limited devolatilization.We have previously reported on a segment-basedapproach <strong>for</strong> expressing nylon-6 polymerizations withacetic acid. 5 In that same work, 5 we also detail thePOLYNRTL activity-coefficient model. Other researchers,including Laubriet et al. 6 and Woo et al., 7-9 havepresented work on modeling diffusion in rotating-diskreactors and <strong>for</strong>ced-gas kettles. There<strong>for</strong>e, we onlypresent the pertinent equations and point the readerto references detailing their development. We devote aseparate section <strong>for</strong> our new development, which is theapplication of bubble-nucleation theory to further refineour model of devolatilization in nylon-6 reactors.3.1. Reaction Kinetics, Phase Equilibrium, andDiffusion. We consider small molecules and polymer.The small molecules are water (W), caprolactam (CL),cyclic dimer (CD), aminocaproic acid (ACA), acetic acid(AA), and cyclohexylamine (CHA). AA and CHA aremonofunctional terminators. Please refer to Seavey etal. 5 <strong>for</strong> a description of the segment methodology 10 thatwe employ. Note that we do not use the momentapproach that is detailed in textbooks such as work byGupta and Kumar 11 because these equations are cumbersometo derive <strong>for</strong> multiple terminators. Table 1shows the reactions in segment notation, along withcorresponding rate expressions. It also summarizes thespecies balance equations due to reaction terms only.To compute the rate constants k 1 -k 5 , we use parameterssimilar to those of Arai et al. 12 These parameters, alongwith the equations, accurately represent all literaturedata and 250% more additional in-house polymerizationdata covering the temperature and composition rangesencountered in our industrial processes.We compute the number-average degree of polymerizationDP n using the following <strong>for</strong>mula:DP n ) [B-ACA] + [T-COOH] + [T-NH 2 ][T-NH 2 ] + [T-AA]The key product output variables are <strong>for</strong>mic acid viscosity(FAV), water extractables, and end-group concentrations.The FAV is the ratio between the viscosities of anylon-6 solution in <strong>for</strong>mic acid and pure <strong>for</strong>mic acid. 13There are two types of FAV that we consider. The firstis the washed-and-dried FAV (W&D FAV), which is theFAV measured on a leached and dried polymer sample.The second is an extrusion FAV, which is the FAVmeasured on an unleached sample. We predict the W&DFAV using an in-house correlation with the numberaveragemolecular weight. An example of a similarcorrelation appears in the report of Akkapeddi et al.: 4FAV ) 9.38 × 10 -9 MW w2.15(1)(2)This correlation uses MW w , the weight-average molecularweight. We predict the extrusion FAV usinganother in-house correlation with the W&D FAV andthe level of water extractables.We compute the water extractables (mass %) by firstconsidering the concentrations of the small molecules(water, caprolactam, cyclic dimer, aminocaproic acid,acetic acid, and cyclohexylamine). We then use an inhousecorrelation to account <strong>for</strong> the presence of oligomersof length three through seven. These oligomers,plus the caprolactam and cyclic dimer, approximate theconcentration of water extractables.Since we track all segment concentrations, the amineand carboxylic acid end-group concentrations (mmol/kg)are simply equal to the concentrations of T-NH 2 andT-COOH, respectively.We do not compute the weight-average or higheraverages of the molecular-weight distribution. We donot need the higher molecular weight averages toestimate the key product output variables.We use the property method of Seavey et al. 5 todescribe phase equilibrium and physical properties.Table 1 gives the parameters and equations necessaryto compute vapor pressure, molar volume and density,and binary interaction parameters.We use penetration theory 11,17 to describe diffusionon a macroscopic scale (Laubriet et al. 6 ). Other notableresearchers who have modeled diffusion on a macroscopicscale are Ravindranath and Mashelkar, 18 Guptaet al., 19,20 and Wajge et al. 21 Ault and Mellichamp, 22Gupta et al., 23 Amon and Denson, 24 and Ahn 25 previouslymodeled diffusion on a microscopic scale. Weestimate the mass-transfer parameter <strong>for</strong> wiped-walland rotating-disk reactors using geometric expressionsfrom Ravetkar and Kale. 26 For <strong>for</strong>ced-gas kettles, weuse the equations developed by Woo et al. 7-9 to describebubble dynamics, namely, the size and residence timeof injected gas bubbles.We estimate the diffusion coefficients of caprolactamand water using data. Nagasubramanian and Reimschuessel27 report the diffusion coefficient of caprolactamat 265 °C and a ∼10/90% (w/w) caprolactam/nylon-6solution containing a small amount of water. Bonifaciand Ravanetti 28 also present the diffusion coefficient ofcaprolactam within a temperature range of 250-280 °Cand at ∼100% nylon-6. We use the Bonifaci and Ravanettidata 28 to obtain the activation energy <strong>for</strong> diffusionand the Nagasubramanian and Reimschuessel data 27to obtain the preexponential factor. Our final expressionisD CL ) 1.41 × 10 -8 (m 2 /s) exp(-33457 (J/mol)RT) (3)Nagasubramanian and Reimschuessel 27 also measurethe diffusion coefficient of water at 265 °C; however, toour knowledge, there are no other data <strong>for</strong> the diffusionof water under polymerization conditions. We there<strong>for</strong>eapproximate the activation energy of diffusion <strong>for</strong> waterusing its self-diffusion coefficient. This is the bestavailable estimate of the activation energy. 29To estimate the self-diffusion coefficient, we use theDullien equation 30 and the physical property parameters<strong>for</strong> water in work by Daubert and Danner: 15D i,self ) D 0,i exp(- E a,iRT)) (0.124 × 10⁻¹⁶ mol 2/3 )Ṽ 2/3 c,i RT(4)µ i Vˆ 0 i M i
5066 Ind. Eng. Chem. Res., Vol. 43, No. 17, 2004Table 1. Reaction Kinetics, Phase Equilibrium, Physical Property, and Diffusion <strong>Model</strong>s Employed in This Studyk 1CL + W y\z ACAk1′)k1/K1equilibrium reactionReactionsreaction ratek 1 ′Ring Opening of Caprolactam (W + CL y\z ACA)k1R 1 ) k 1[CL][W] - k 1′[ACA]k 2 ′Polycondensation (P n + P m y\z Pk2 n+m + W)k 2ACA + ACA y\z T-COOH/T-NHk2′)k2/K22 + W R 2 ) k 2 [ACA] 2 [T-COOH]- k 2 ′[W][T-NH 2 ]([T-COOH] + [B-ACA] + [T-CHA])k 2[B-ACA]ACA + T-COOH y\z T-COOH/B-ACA + W R 3 ) k 2 [ACA][T-COOH] - k 2 k2′)k2/K2′[W][T-COOH]([B-ACA] + [T-NH 2 ] + [T-AA])k 2[B-ACA]T-NH 2 + ACA y\z T-NHk2′)k2/K2 2 /B-ACA + W R 4 ) k 2 [T-NH 2 ][ACA] - k 2 ′[W][T-NH 2 ]([B-ACA] + [T-COOH] + [T-CHA])k 2[B-ACA]T-NH 2 + T-COOH y\z B-ACA/B-ACA + W R 5 ) k 2 [T-NH 2 ][T-COOH] - k 2 k2′)k2/K2′[W][B-ACA]([B-ACA] + [T-NH 2 ] + [T-AA])k 3Polyaddition of Caprolactam (CL + P n y\z Pk3′ n+1 )k 3[T-COOH]ACA + CL y\z T-NHk3′)k3/K3 2 /T-COOH R 6 ) k 3 [ACA][CL] - k 3 ′[T-NH 2 ]([T-COOH] + [B-ACA] + [T-CHA])k 3T-NH 2 + CL y\z T-NHk3′)k3/K3 2 /B-ACA R 7 ) k 3 [T-NH 2 ][CL] - k 3 ′[T-NH 2 ]([B-ACA][B-ACA] + [T-COOH] + [T-CHA])k 4Ring Opening of a Cyclic Dimer (W + CD y\z Pk4′ 2 )k 4[T-COOH]CD + W y\z T-COOH/T-NHk4′)k4/K42R 8 ) k 4 [CD][W] - k 4 ′[T-NH 2 ]([T-COOH] + [B-ACA] + [T-CHA])k 5Polyaddition of a Cyclic Dimer (CD + P n y\z Pk5′ n+2 )k 5[B-ACA]ACA + CD y\z T-NHk5′)k5/K5 2 /B-ACA/T-COOH R 9 ) k 5 [ACA][CD] - k 5 ′[T-NH 2 ]([B-ACA] + [T-COOH] + [T-CHA]) ×[T-COOH]([B-ACA] + [T-COOH] + [T-CHA])k 5[B-ACA]2T-NH 2 + CD y\z B-ACA/B-ACA/T-NHk5′)k5/K52R 10 ) k 5 [T-NH 2 ][CD] - k 5 ′[T-NH 2 ]([B-ACA] + [T-COOH] + [T-CHA])k 2Polycondensation of Acetic Acid (P n + AA y\z Pk2′ n,T-AA + W)k 2[T-COOH]ACA + AA y\z T-AA/T-COOH + W R 11 ) k 2 [AA][ACA] - k 2 k2′)k2/K2′[W][T-AA]([T-COOH] + [B-ACA])k 2[B-ACA]T-NH 2 + AA y\z B-ACA/T-AA + W Rk2′)k2/K212 ) k 2 [AA][T-NH 2 ] - k 2 ′[W][T-AA]([T-COOH] + [B-ACA])k 3Polyaddition of Caprolactam by Cyclohexylamine (CL + CHA y\z Pk3′ 1,T-CHA )k 3[T-NHCHA + CL y\z T-NHk3′)k3/K3 2 /T-CHAR 13 ) k 3 [CHA][CL] - k 3 ′[T-CHA](2 ][T-NH 2 ] + [B-ACA])k 2Polycondensation of Cyclohexylamine (P n + CHA y\z Pk2′ n,T-CHA + W)k 2[T-NHCHA + ACA y\z T-NHk2′)k2/K2 2 /T-CHA + W R 14 ) k 2 [CHA][ACA] - k 2 ′[W][T-CHA](2 ][T-NH 2 ] + [B-ACA])k 2CHA + T-COOH y\z B-ACA/T-CHA + Wk2′)k2/K2[B-ACA]R 15 ) k 2 [CHA][T-COOH] - k 2 ′[W][T-CHA]([T-NH 2 ] + [B-ACA])
Table 1 (Continued)Rate of Generation Due to ReactionW R 2 + R 3 + R 4 + R 5 + R 11 + R 12 + R 14 + R 15 - (R 1 + R 8)CL -(R 1 + R 6 + R 7 + R 13)CD -(R 8 + R 9 + R 10)AA -(R 11 + R 12)CHA -(R 13 + R 14 + R 15)ACA R 1 - (2R 2 + R 3 + R 4 + R 6 + R 9 + R 11 + R 14)B-ACA R 3 + R 4 + 2R 5 + R 7 + R 9 + 2R 10 + R 12 + R 15T-NH 2 R 2 + R 6 + R 8 + R 9 + R 13 + R 14 - (R 5 + R 12)T-COOH R 2 + R 6 + R 8 + R 9 + R 11 - (R 5 + R 15)T-AA R 11 + R 12T-CHA R 13 + R 14 + R 15POLYNRTL binary interaction parametersvapor pressuremolar volumepolymer densityEquilibrium and Physical Properties 14-16τ ij ) a ij + b ijT + c ij ln TP i sat ) exp(A i + B iT + C i ln T + D i TE i)1)v iA iB i1+(1-T/Ci) Div i ) v i (T,0)[ ( 1 - 0.0894 ln P, Pa1 +, 220 °C < T < 300 °CB i (T))](τ ij ) binary interaction parameter, T ) temperature, P sat i ) v i(T,0), m 3 /kg ) 9.4650 × 10 -4 + (1.2273 × 10 -9 )(T, °C) 2vapor pressure, ν i ) molar volume or density, P ) pressure) B i(T), Pa ) (3.3232 × 10 8 ) exp[(-1)(3.8193× 10 -3 )(T, °C)]Equilibrium Parameters 5i ) water and j ) caprolactam i ) water and j ) nylon-6 segment i ) caprolactam and j ) nylon-6 segmenta ij -0.313 0 0a ji 0.628 0 0b ij -15.4 297 265b ji -13.7 -601 207c ij 0.0495 0 0c ji -0.0898 0 0Physical Property Parameters 15constant water caprolactamvapor pressure (Pa)A i 7.3649 × 10 1 7.4172 × 10 1B i (K) -7.2582 × 10 3 -1.0469 × 10 4C i -7.3037 -6.8944D i 4.1653 × 10 -6 1.2113 × 10 -18E i (K -E ) 2.0000 6.0000Liquid molar volume (m 3 /kmol)A i (kmol/m 3 ) 5.4590 7.1180 × 10 -1B i 3.0542 × 10 -1 2.5400 × 10 -1C i (K) 6.4713 × 10 2 8.0600 × 10 2D i 8.1000 × 10 -2 2.8570 × 10 -1mass-transfer equationmass-transfer coefficientDiffusional <strong>Mass</strong> <strong>Transfer</strong> 6,11,17(E i,D ) evaporation rate, k L,i ) mass-transfer coefficient,A int ) interfacial surface area, C i ) bulk liquid concentration,C i* ) interfacial concentration, D i ) diffusion coefficient,θ ) contact time)E i,D ) k L,iA int(C i - C i*)k L,i ) 2 D iπθWiped-Film Evaporators and Rotating-Disk Reactors 26interfacial area (wiped-film evaporator)A int ) 2πRLcontact time (wiped-film evaporator)θ ) 1/WS(A int ) interfacial surface area, R ) radius of evaporator,L ) length of evaporator, θ ) contact time, W ) numberof wipers, S ) rotation rate)interfacial surface area (rotating-disk reactor)A int ) 2πR [ 2 (2π - angle)2πcontact time (rotating-disk reactor)(A int ) interfacial surface area, R ) radius of disk, angle )angle made by drawing lines from the axis of the reactorto the point where the liquid level touches boththe reactor wall and vapor phase, θ ) contact time,ω ) rotation rate)Ind. Eng. Chem. Res., Vol. 43, No. 17, 2004 50672π - angleθ )2πω+ sin(angle) - 1 + cos(angle)2π2 ]
5068 Ind. Eng. Chem. Res., Vol. 43, No. 17, 2004Table 1 (Continued)Forced-Gas Kettles 7-9bubble diameterd b ) 2.313( µQ GFg) 0.252dbubble rise velocity u b )[b g16µ/Fu b d b + 1( 1 + Q G d bu b V G *)]fractional holdup ɛ G ) 0.239(u b × 10 -2 )D R-0.5number of bubbles in the liquidinterfacial surface areaN b ) Q G θV G *A int ) 4π( d b2) 2 N bcontact time θ ) V L (1 + ɛ G )u b S R(d b ) bubble diameter,µ ) viscosity, Q G ) volumetric flow rate of the gas, F)fluid density, g ) gravitational acceleration constant, u b )bubble rise velocity, V G* ) bubble volume, ɛ G ) fractionalgas holdup, D R ) reactor diameter, A int ) interfacialsurface area, θ ) contact time, V L ) liquid volume,S R ) reactor cross-sectional area)(ethylene terephthalate) (PET)] only consider diffusionwhen modeling devolatilization. 11 In particular, all pastdevolatilization models use either fundamental diffusionequations or mass-transfer equations from penetrationtheory. We believe that boiling is important because wehave visually observed boiling in batch reactors, vacuumfinishers, bubble-gas kettles, etc. While we have knownthat boiling is a contributing mechanism to devolatilizationin polyolefin systems, 31-34 no one has consideredboiling itself as a mode of devolatilization in step-growthpolymerization systems. When we say “no one”, wemean although others have treated devolatilizationindirectly using empirical mass-transfer coefficients, noone has treated boiling explicitly and fundamentally,i.e., using bubble-nucleation equations.In 1975, Katz and co-workers published studies quantifyingthe rate at which bubbles nucleate in pure-componentand multicomponent liquids. 35,36 For a mixture,they compute the rate at which bubbles nucleate J:Figure 2. Prediction of the self-diffusion coefficient of water bythe Dullien equation, eq 29. The exponential fit describes theproportionality between the self-diffusion coefficient and exp[-3010 (J/mol)/RT].Ṽ c,i is the critical molar volume of the solvent (m 3 /mol),and M i is the molecular weight of the solvent. Vˆ i0 is thespecific volume of the pure solvent (m 3 /kg), and the selfdiffusioncoefficient D i,self has units of m 2 /s. D 0,i is thepreexponential factor <strong>for</strong> the self-diffusion coefficient(m 2 /s), and µ i is the viscosity (Pa s). Figure 2 shows theself-diffusion coefficient predictions.The activation energy <strong>for</strong> diffusion is 3010 J/mol.Using this activation energy and the one data point <strong>for</strong>the water diffusion coefficient at 265 °C to characterizethe preexponential factor, we arrive at the followingexpression <strong>for</strong> the diffusion coefficient of water in moltennylon-6:D W ) 2.21 × 10 -8 (m 2 /s) exp(-3010 (J/mol)RT) (5)3.2. Bubble Nucleation. All previous reactor models<strong>for</strong> step-growth polymerizations [e.g., nylon-6 and poly-∑ iA(y iJ )i)B2]exp[-(6)M T(P V - P L )J is the nucleation rate of bubbles (# s), M i is themolecular weight of the vaporizing molecule i, y i is thevapor mole fraction of species i, T is the systemtemperature (K), and P is pressure (Pa) inside thebubble (subscript V) and in the liquid phase (subscriptL). The summation is over all volatile species.To compute the rate of loss of each volatile species,we useE i,B ) Jn bubble y i (7)The rate at which species i vaporizes, E i,B (kmol/s), isequal to the product of the rate at which bubblesnucleate, the total number of moles per bubble n bubble ,and the vapor mole fraction of species i. We assume thatthe total number of moles per bubble is constant.Last, we assume that all bubbles that <strong>for</strong>m eventuallyescape to the vapor phase. This seems likely whenagitation is applied to a nylon-6 solution, which has arelatively low viscosity compared to PET.
Table 2. Direct-Melt Train Predictions vs Plant Data <strong>for</strong> FAV, Water Extractables, and Amine End Groups (DiffusionOnly and No <strong>Mass</strong>-<strong>Transfer</strong> Limitations) at a Scaled Production Rate of 0.824 apolymer propertyplantdata4. <strong>Model</strong> ValidationWe use Aspen Plus, Aspen Dynamics, and PolymersPlus to simulate the nylon-6 process. Polymers Pluscaptures polymer science and engineering fundamentals.It describes polymerization chemistries, accounts<strong>for</strong> polymer thermodynamics, and tracks polymer molecularstructure using the segment-based approach. 10Realistic simulation models of polymer manufacturingprocesses built using Polymers Plus and Aspen Dynamicshave already begun to appear in the literature. 37-39We implement the mass-transfer model of section 3using the customization features available in AspenDynamics. We are not using the standard preprogrammedmodels.4.1. Direct-Melt Process. We use a stepwise approachto predict how an industrial nylon-6 direct-melttrain per<strong>for</strong>ms. We first consider the two limits of masstransfer: diffusion only and phase equilibrium. We thenconsider two alternatives to improve model predictions.One, we manually fit the interfacial surface areas <strong>for</strong>the diffusion-only model, and two, we add the boilingcontribution from eq 6.To simulate this process, we specify and solve theequations that describe each unit operation in Figure1. We model each reactor as a series of continuousstirred-tank reactors (CSTRs), each with an equationset containing the following parts: (1) CSTR mass balance,(2) a phase-equilibrium model <strong>for</strong> front-end reactorsand monomer-recovery units and a devolatilizationmodel <strong>for</strong> back-end reactors, (3) a physical propertymodel to compute vapor pressure and liquid density, and(4) a kinetics model <strong>for</strong> reactions in the liquid phase.We predict key process output variables of the nylon-6that the train produces. The three characteristics areextrusion FAV, water extractables (mass %), and polymeramine end-group concentration (mmol/kg).Table 2 shows how well the model predicts the plantdata at the two limits of devolatilization. These limitsare (1) diffusion only with a surface area computedgeometrically (lower limit) and (2) devolatilization withno mass-transfer limitations, i.e., phase equilibriumonly (upper limit). When we say “surface area computedgeometrically”, we mean the apparent interfacial surfacearea generated by the reactor internals.The model predicts poorly in both cases. When themodel predicts that too little water and caprolactamvolatizes, it underpredicts the FAV (-25.9% error) andoverpredicts the water extractables (273% error). On theother hand, when the model overpredicts the rate atwhich caprolactam volatilizes, it underpredicts thewater extractables (-34.9%). Interestingly, the phaseequilibriummodel correctly predicts the FAV. Thisshows that water experiences virtually no mass-transferlimitation in this particular direct-melt train.diffusion devolatilization model(surface area estimated geometrically)Ind. Eng. Chem. Res., Vol. 43, No. 17, 2004 5069no mass-transfer limitationsdevolatilization modelFAV 1.00 0.741 1.03water extractables 1.00 3.73 0.651amine end groups 1.00 1.07 0.983ErrorFAV error (%) -25.9 2.65water extractable error (%) 273 -34.9amine end-group error (%) 7.02 -1.66a The predictions and data have been scaled by the data themselves. Neither model has free parameters because the diffusion coefficient,interfacial surface area, and activity coefficients are all computed a priori.Figure 3. Vapor-liquid interfacial surface area contributions:macroscopic interfacial surface area generated by the reactorinternals and microscopic interfacial surface area generated bybubbles (rotating-disk reactor shown).One explanation as to why the diffusion-only modelunderpredicts the diffusion rate is that volatiles alsodiffuse into microscopic bubbles. 40 We do not account<strong>for</strong> this additional interfacial surface area when weestimate it geometrically. Figure 3 distinguishes betweenthe macroscopic interfacial surface area generatedby reactor internals and the microscopic interfacialsurface area generated by bubbles.The usual procedure <strong>for</strong> correcting <strong>for</strong> the presenceof bubbles is to empirically increase the interfacialsurface area until the model best agrees with the data. 40By doing so, we implicitly assume that the bubblecomposition is equal to the reactor vapor-phase composition.We multiply the interfacial surface areas of theevaporator and finisher by 247 and 6, respectively, andpredict polymer properties throughout a range of productionrates. Figure 4 shows how well the modelpredicts the plant data <strong>for</strong> a scaled production raterange of 0.800-1.00.We fit the evaporator surface area by using thecaprolactam content in the exit polymer stream and thefinisher surface area by using the hot water extractablesin the extrusion stream. The justification <strong>for</strong> this is thehypothesis 40 that bubbles contribute additional surfacearea <strong>for</strong> diffusion. Figure 5 shows the prediction errors<strong>for</strong> the fitted diffusion model.The fit is quite good, with average prediction errorsof 2.78%, -5.59%, and -2.79% <strong>for</strong> FAV, water extractables,and amine end groups, respectively. This showsthat we may not rule out the possibility that volatilesdiffuse into bubbles.
5070 Ind. Eng. Chem. Res., Vol. 43, No. 17, 2004Figure 4. Direct-melt train predictions vs plant data <strong>for</strong> FAV,water extractables, and amine end groups as a function of thescaled production rate (diffusion only, with geometrically computedsurface areas multiplied by 247 and 6 <strong>for</strong> the evaporator andfinisher, respectively).Figure 6. Direct-melt train predictions vs plant data <strong>for</strong> FAV,water extractables, and amine end groups as a function of thescaled production rate (diffusion and bubble nucleation; bubblenucleationparameters fit to extractable data).Figure 5. Direct-melt train prediction errors <strong>for</strong> FAV, waterextractables, and amine end groups as a function of the scaledproduction rate (diffusion only, with geometrically computedsurface areas multiplied by 247 and 6 <strong>for</strong> the evaporator andfinisher, respectively).However, we believe that this explanation, diffusioninto bubbles with adjustments made to geometricallycomputed surface areas, is open to question on bothconceptual and practical grounds. Traditional analysisof bubble nucleation assumes that the vapor inside ofbubbles is in equilibrium with the surrounding liquid. 35There<strong>for</strong>e, there is no concentration driving <strong>for</strong>ce <strong>for</strong>mass transfer. This means that the bubbles do notcontribute additional surface area <strong>for</strong> diffusional masstransfer, but rather they contribute to devolatilizationsimply by <strong>for</strong>ming and escaping the melt phase.The practical difficulty concerns what to do if weassume that bubbles are not in equilibrium with theliquid. Even if we could fundamentally predict theamount and size of bubbles in reactors, we would notbe able to estimate the initial composition of theFigure 7. Direct-melt train prediction errors <strong>for</strong> FAV, waterextractables, and amine end groups as a function of the scaledproduction rate (diffusion and bubble nucleation; bubble-nucleationparameters fit to extractable data).bubbles. Consequently, our ef<strong>for</strong>ts to model polycondensationreactors degrade into mere fitting exercises thatnever produce a truly predictive model. This consequencealone drives us to look <strong>for</strong> alternative mechanisms<strong>for</strong> devolatilization.We now reject the pure-diffusion hypothesis becauseof the above-mentioned conceptual and practical difficultiesand because we have visually observed boilingin nylon-6 polymerization mixtures under vacuum. Weinstead assume that bubbles enhance devolatilizationsimply by <strong>for</strong>ming and escaping the melt. We assumethat this rate is described by eq 6 and fit the parametersA and B in the same way that we fit the interfacialsurface area multiplication factors: by using the caprolactamcontent in the exit polymer stream and the hotwater extractables in the extrusion stream. Figure 6shows how well the model predicts the plant data <strong>for</strong> a
5072 Ind. Eng. Chem. Res., Vol. 43, No. 17, 2004Figure 10. Bubble-gas kettle train predictions vs plant data <strong>for</strong> extrusion FAV, W&D FAV, and water extractables as a function of thescaled production rate (equilibrium; no parameter adjustments made).Figure 11. Bubble-gas kettle train prediction errors <strong>for</strong> extrusion FAV, W&D FAV, and water extractables as a function of the scaledproduction rate (equilibrium; no parameter adjustments made).4.2. Bubble-Gas Kettle Process. Section 3 showsus how to predict, a priori, mass-transfer coefficients<strong>for</strong> <strong>for</strong>ced bubbles in reactors. After our analysis insection 4.1, we can now also predict, a priori, the boilingrate as a function of the temperature, pressure, andcomposition. We there<strong>for</strong>e analyze the bubble-gas kettleprocess in a truly predictive fashion (i.e., no parameteradjustments are made) and compare how the modelper<strong>for</strong>ms when we assume three different devolatilizationcases: (1) diffusion only, (2) phase equilibrium only,and (3) diffusion and bubble nucleation.As in the direct-melt process, we specify and solve theequations that describe the kettles in Figure 1. Wemodel each kettle as a CSTR, with equations consistingof a mass balance, phase equilibrium in monomerrecoveryunits, a devolatilization model, a reactionkinetics model, and a liquid molar volume model. Wepredict both extrusion and W&D FAV and water extractables.Amine end groups are not measured becausethey can be computed from the W&D FAV as thepolymer is unterminated.Figure 8 shows how well the model predicts the plantdata, assuming that melts devolatilize through diffusiononly. Figure 9 shows the prediction errors.The diffusion-only model seriously underpredicts therate at which water volatilizes, as evidenced by the poorFAV predictions (-54.3% and -56.2% <strong>for</strong> extrusion FAVand W&D FAV, respectively). The diffusion model does,however, reasonably describe the rate at which caprolactamvolatilizes, as evidenced by an underpredictionof water extractables by only 14.3%. From this, weconclude that Woo et al.’s model <strong>for</strong> bubble diffusion 7-9alone is inadequate <strong>for</strong> simulating molecular-weightgrowth in industrial nylon-6 bubble-gas kettle processes.Figure 10 shows how well the model predicts plantdata, assuming no mass-transfer limitations, i.e., phaseequilibrium only. Figure 11 shows the correspondingprediction errors.
Ind. Eng. Chem. Res., Vol. 43, No. 17, 2004 5073Figure 12. Bubble-gas kettle train predictions vs plant data <strong>for</strong> extrusion FAV, W&D FAV, and water extractables as a function of thescaled production rate (diffusion and bubble nucleation; no parameter adjustments made).The prediction errors are somewhat improved over thepure-diffusion model. As in the direct-melt train, waterdoes not appear to suffer from significant mass-transferlimitations. The equilibrium model predicts both theextrusion and W&D FAV well, with average errors of1.70% and -7.70%, respectively. However, the equilibriummodel grossly overpredicts the extent to whichcaprolactam volatilizes; the prediction error <strong>for</strong> waterextractables is -37.3%.An interesting aspect of the prediction error is thatthe phase-equilibrium model predicts well the W&DFAV at lower production rates while predicting poorlyat higher production rates. We attribute this to highersweep/<strong>for</strong>ced steam flow rates. When we assume thatmass-transfer limitations exist and steam is in thereactor, we would expect water to have difficulty bothexiting and entering the polymer phase. When weassume phase equilibrium only, we are in danger ofoverpredicting the amount of water exiting and enteringthe polymer. We believe this to be the case here: in thehigher production rates, we feed more steam to thekettles. By assuming equilibrium, the model predictsthat too much water enters the polymer phase andhence too little molecular-weight growth results.Last, Figure 12 shows how well the model predictsthe plant data, assuming that both diffusion and bubblenucleation contribute to devolatilization. We believe thatnot including bubble nucleation, especially in consideringearlier kettles where the viscosity is not high andthe caprolactam content is high, is the reason <strong>for</strong> thelarge discrepancies seen in the diffusion-only results.Figure 13 shows the corresponding prediction errors.The prediction errors are -17.2%, -17.0%, and-7.49% <strong>for</strong> extrusion FAV, W&D FAV, and waterFigure 13. Bubble-gas kettle train prediction errors <strong>for</strong> extrusionFAV, W&D FAV, and water extractables as a function of the scaledproduction rate (diffusion and bubble nucleation; no parameteradjustments made).extractables, respectively. The model underpredicts therate at which water volatilizes yet slightly overpredictsthe rate at which caprolactam volatilizes.To summarize, we have discussed three models <strong>for</strong>devolatilization applied to the bubble-gas kettle process:(1) diffusion using Woo et al.’s bubble dynamicsmodel, 7-9 (2) phase equilibrium only and no masstransferlimitations, and (3) combined diffusion andbubble nucleation using bubble-nucleation parametersTable 4. <strong>Model</strong> Prediction Errors <strong>for</strong> the Bubble-Gas Kettle Process akey process outputvariable errordiffusion(bubble dynamics modelof Woo et al. 7-9 )equilibriumdiffusion/bubble nucleation(bubble-nucleation parametersfrom a direct-melt study)extrusion FAV error (%) -54.3 1.70 -17.2W&D FAV error (%) -56.2 -7.70 -17.0water extractable error (%) -14.3 -37.3 -7.49a No parameters were fitted in obtaining these predictions.
5074 Ind. Eng. Chem. Res., Vol. 43, No. 17, 2004Figure 14. Simplified control scheme <strong>for</strong> the nylon-6 direct-melt process: Feed controllers control additive concentrations; Level controllerscontrol the liquid level by manipulating the outgoing liquid flow rate; Temperature controllers control the temperature by manipulatingthe heat duty; Pressure controllers control the pressure by manipulating the vapor flow rate.from the direct-melt study. Table 4 shows how well themodel predicts the data in each of these three cases.The diffusion and equilibrium models predict thateither too little or too much volatiles diffuse. Too littledevolatilization leads to low FAV predictions (ca. -50%error), and too much devolatilization leads to low waterextractable predictions (-37.3% error). In contrast, thediffusion/bubble-nucleation model reasonably predictsboth the FAV and water extractables, with ca. 17% and-7% error, respectively.5. <strong>Model</strong> ApplicationThis section illustrates an application of our masstransfermodel in which we simulate a dynamic ratechange in the direct-melt process. We also validate themodel results by comparing model predictions withplant data. We begin by taking our steady-state modelin section 4.1 and adding a control scheme. Figure 14shows a hypothetical control scheme.The level controllers manipulate outgoing liquid flowrates in all vessels. We control the temperature bymanipulating the heat duty and control pressure inthe back end by adjusting the exiting vapor flow rate.Last, additive concentrations, such as terminators andcatalyst, are varied as a function of the caprolactam flowrate.We use our dynamic model to simulate a direct-melttrain, changing the relative production rate from ca.0.98 to 0.86. Such a change is associated with decreaseddemand downstream of the process, e.g., shutting downfiber-spinning blocks. Figure 15 shows the profile of therelative production rate over relative time. Figure 16shows the impact on key product qualities, as well asthe pressure in the finisher.Figure 15. Production rate change in the direct-melt process.During the initial stage of decreasing the feed rate,the viscosity in the finisher decreases. To compensate<strong>for</strong> this, the pressure controller begins to lower thepressure. The new steady-state pressure is slightlyhigher than the previous pressure; this is due to theincreased residence time from a decrease in the rate.The product characteristics, such as water extractables,end-group concentrations, and FAV, hold relativelyconstant; this illustrates the robustness of the processand the associated control scheme.6. ConclusionsIn this study, we contribute a new mass-transfermodel <strong>for</strong> simulating industrial nylon-6 polymerizationtrains. It explicitly accounts <strong>for</strong> mass transfer of vola-
Ind. Eng. Chem. Res., Vol. 43, No. 17, 2004 5075Figure 16. Product key product output variables and finisher pressure as functions of time during a rate change. All points have beennormalized.tiles through two pathways: diffusion across the liquidvaporinterface and bubble nucleation. The newness ofthe model comes from explicitly treating bubble nucleation,eq 6. Although it accurately approximates keyfeatures of very complicated reactors, the model istractable and can be implemented using commercialsoftware tools. We use this new model, with identicalparameters, to accurately model two very differentnylon-6 processes: the direct-melt process and thebubble-gas kettle process.In particular, we have advanced the field of nylon-6process modeling by showing that (i) modeling devolatilizationusing diffusion alone is insufficient to generateaccurate predictions, (ii) to get accurate predictionsusing diffusion alone requires an empirical approach,with parameter adjustments being necessary <strong>for</strong> everydifferent vessel, and (iii) including bubble nucleationallows <strong>for</strong> predictive modeling <strong>for</strong> very different processesand is the most accurate devolatilization modelcompared to other predictive models.We hope to spur researchers in step-growth polymerizationto more carefully consider devolatilization andconsider the lessons learned in polyolefin process modeling.In particular, other researchers should study bubblenucleation rather than relying on diffusion alone todescribe devolatilization.AcknowledgmentWe thank Alliant Techsystems (particularly AnthonyMiano, Vice President), Aspen Technology (particularlyDustin MacNeil, Director of Worldwide UniversityPrograms, and Larry Evans, Board Chairman),China Petroleum and Chemical Corp. (particularlyXianghong Cao, Senior Vice President), Formosa PetrochemicalCorp. (particularly Wilfred Wang, President),and Honeywell Specialty Materials and HoneywellInternational Foundation <strong>for</strong> supporting oureducational programs in computer-aided design andprocess systems engineering at Virginia Tech. We areparticularly grateful to David Tremblay, EngineeringProducts Business Unit, Aspen Technology, <strong>for</strong> hishelpful input in this work.Nomenclature) preexponential factor <strong>for</strong> an uncatalyzed <strong>for</strong>wardreaction i, kg/mol‚sA c i ) preexponential factor <strong>for</strong> a catalyzed <strong>for</strong>ward reactioni, kg 2 /mol 2 ‚sA int ) interfacial area, m 2C i ) concentration of species i in the bulk liquid phase,mol/m 3C i* ) concentration of species i at the liquid-side interface,mol/m 3d b ) bubble diameter, mD i ) diffusion coefficient of species i, m 2 /sD i,self ) self-diffusion coefficient of species i, m 2 /sD 0,i ) self-diffusion coefficient preexponential factor <strong>for</strong>species i, m 2 /sD R ) diameter of the reactor, mDP n ) number-average molecular weight, kg/molE i ) evaporation rate <strong>for</strong> species i, mol/sE 0 i ) activation energy <strong>for</strong> an uncatalyzed <strong>for</strong>ward reactioni, J/molE c i ) activation energy <strong>for</strong> a catalyzed <strong>for</strong>ward reaction i,J/molE i,B ) rate of species i through bubble nucleation, mol/sE i,D ) evaporation rate of species i through diffusion, mol/sFAV ) <strong>for</strong>mic acid viscosityg ) gravitational acceleration constant, m/s 2∆H i ) enthalpy of reaction <strong>for</strong> reaction i, J/molJ ) nucleation rate of bubbles, #/m 3 ‚sk ) Boltzmann’s constant, J/KK i ) equilibrium constant <strong>for</strong> reaction ik i ) <strong>for</strong>ward rate constant <strong>for</strong> reaction i, kg/mol‚sk i ′ ) reverse rate constant <strong>for</strong> reaction i, kg/mol‚sk L,i ) mass-transfer coefficient <strong>for</strong> species i, m/sM i ) molecular weight of species iMW w ) weight-average molecular weightn ) number of moles contained in a bubble, molN b ) number of bubblesP ) pressure, PaP e ) equilibrium vapor pressure, PaP sat i ) vapor pressure of species i, PaP L ) liquid pressure, PaP V ) pressure of gas inside a bubble, PaQ ) volumetric flow rate, m 3 /sR ) disk radius, gas-law constant, m, J/mol‚KA i 0
5076 Ind. Eng. Chem. Res., Vol. 43, No. 17, 2004R i ) rate equation <strong>for</strong> reaction i, mol/kg‚sS R ) cross-sectional area of the reactor, m 2∆S i ) entropy of reaction <strong>for</strong> reaction i, J/mol‚KT ) temperature, Ku b ) bubble velocity, m/sV G* ) volume per bubble, m 3Ṽ c,i ) critical molar volume of species i, m 3 /molVˆ 0 i ) specific volume of the pure solvent, m 3 /kgV L ) reactor liquid volume, m 3x i ) liquid-phase mole fraction of species iy i ) vapor-phase mole fraction of species iγ i ) activity coefficient <strong>for</strong> species iɛ G ) fractional gas holdupθ ) average contact time, sµ ) viscosity, Pa sv i ) liquid molar volume of species i, m 3 /molv L ) mixture liquid molar volume, m 3 /molτ ij ) POLYNRTL binary interaction parameter <strong>for</strong> thebinary i-jω ) disk rotation speed, rpmLiterature Cited(1) Yates, S. L.; Cole, C. J.; Wiesner, A. H.; Wagner, J. W. Two-Stage Hydrolysis Process <strong>for</strong> the Preparation of <strong>Nylon</strong>-6. U.S.Patent 4,310,659, 1982.(2) Victor, L.; Saunders, J.; Rochell, D. Polymer Finisher. U.S.Patent 3,686,826, 1972.(3) Russell, W. N.; Wiesner, A. H.; Snider, O. E. ContinuousPolymerization of ɛ-Caprolactam. U.S. Patent 3,294,756, 1966.(4) Akkapeddi, M. K.; Brown, C.; Vanbuskirk, B. Chain Extensionof PA-6 and PA-6/66 Copolymer Via Reactive Extrusion withTriscaprolactamyl Phosphite (TCP). Honeywell Report, http://www.honeywell-plastics.com/literature/techpapers/0475.pdf, 3, accessed4/2003.(5) Seavey, K. C.; Khare, N. P.; Liu, Y. A.; Williams, T. N.;Chen, C. C. A <strong>New</strong> Phase Equilibrium <strong>Model</strong> <strong>for</strong> <strong>Simulating</strong><strong>Industrial</strong> <strong>Nylon</strong>-6 Production Trains. Ind. Eng. Chem. Res. 2003,42, 3900-3913.(6) Laubriet, C.; LeCorre, B.; Choi, K. Y. Two-Phase <strong>Model</strong> <strong>for</strong>Continuous Final Stage Melt Polycondensation of Poly(ethyleneterephthalate). 1. Steady-State Analysis. Ind. Eng. Chem. Res.1991, 30, 2-12.(7) Woo, B. G.; Choi, K. Y.; Goranov, K. The Forced GasSweeping Process <strong>for</strong> Semibatch Melt Polycondensation of Poly-(ethylene terephthalate). J. Appl. Polym. Sci. 2001, 81, 1388-1400.(8) Woo, B. G.; Choi, K. Y.; Song, K. H. Melt Polycondensationof Bisphenol A Polycarbonate by a Forced Gas Sweeping Process.Ind. Eng. Chem. Res. 2001, 40, 1312-1319.(9) Woo, B. G.; Choi, K. Y.; Song, K. H. Melt Polycondensationof Bisphenol A Polycarbonate by a Forced Gas Sweeping Process.II. Continuous Rotating-Disk Reactor. Ind. Eng. Chem. Res. 2001,40, 3459-3466.(10) Barrera, M.; Ko, G.; Osias, M.; Ramanathan, S.; Tremblay,D. A.; Chen, C. C. Polymer Component Characterization Methodand Process Simulation Apparatus. U.S. Patent 5,687,090, 1997.(11) Gupta, S. K.; Kumar, A. Reaction Engineering of StepGrowth Polymerization; Plenum Press: <strong>New</strong> York, 1987.(12) Arai, Y.; Tai, K.; Teranishi, H.; Tagawa, T. Kinetics ofHydrolytic Polymerization of ɛ-Caprolactam: 3. Formation ofCyclic Dimer. Polymer 1981, 22, 273-277.(13) ASTM Subcommittee D20.15. Standard Test Methods <strong>for</strong>Determination of Relative Viscosity and Moisture Content ofPolyamide. ASTM Standard Method D 789-98, 1998.(14) Chen, C. C. A Segment-based Local Composition <strong>Model</strong> <strong>for</strong>the Gibbs Energy of Polymer Solutions. Fluid Phase Equilib. 1993,83, 301-312.(15) Daubert, T. E.; Danner, R. P. Physical and ThermodynamicProperties of Pure Chemicals. Data Compilation, Volume 3;Hemisphere Publishing Corp.: <strong>New</strong> York, 1989.(16) Zoller, P.; Walsh, D. J. Standard Pressure-Volume-Temperature Data <strong>for</strong> Polymers; Technomic: Lancaster, PA, 1995;p 278.(17) Higbie, R. The Rate of Absorption of a Pure Gas Into aLiquid Still During Short Periods of Exposure. Trans. AIChE 1935,31, 365-389.(18) Ravindranath, K.; Mashelkar, R. A. <strong>Model</strong>ing of Poly(EthyleneTerephthalate) Reactors: 6. A Continuous Process <strong>for</strong> FinalStages of Polycondensation. Polym. Eng. Sci. 1982, 22, 628-636.(19) Gupta, A.; Gupta, S. K.; Gandhi, K. S.; Mehta, M. H.; Padh,M. R.; Soni, A. V.; Ankleswaria, B. V. <strong>Model</strong>ing of HydrolyticPolymerization in a Semibatch <strong>Nylon</strong>-6 Reactor. Chem. Eng.Commun. 1992, 113, 63-89.(20) Gupta, S. K.; Kumar, A.; Agrawal, K. K. Simulation ofThree-Stage <strong>Nylon</strong>-6 Reactors with Intermediate <strong>Mass</strong> <strong>Transfer</strong>at Finite Rates. J. Appl. Polym. Sci. 1982, 27, 3089-3101.(21) Wajge, R. M.; Rao, S.; Gupta, S. K. Simulation of an <strong>Industrial</strong>Semibatch <strong>Nylon</strong>-6 Reactor. Polymer 1994, 35, 3722-3734.(22) Ault, J. W.; Mellichamp, D. A. A Diffusion and Reaction<strong>Model</strong> <strong>for</strong> Simple Polycondensation. Chem. Eng. Sci. 1972, 27,1441-1448.(23) Gupta, S. K.; Ghosh, A. K.; Gupta, S. K.; Kumar, A.Analysis of Wiped Film Reactors Using the Orthogonal CollocationTechnique. J. Appl. Polym. Sci. 1984, 29, 3217-3230.(24) Amon, M.; Denson, C. D. Simplified Analysis of thePer<strong>for</strong>mance of Wiped-Film Polycondensation Reactors. Ind. Eng.Chem. Fundam. 1980, 19, 415-420.(25) Ahn, Y. C. Effects of Diffusional Water Removal and Heat<strong>Transfer</strong> in <strong>Nylon</strong>-6 Reactors. Polym. Eng. Sci. 1997, 37, 484-493.(26) Ravetkar, D. D.; Kale, D. D. Gas Absorption into Non-<strong>New</strong>tonian Fluids in Rotating Disk Contactors. Chem. Eng. Sci.1981, 36, 399-403.(27) Nagasubramanian, K.; Reimschuessel, H. K. Diffusion ofWater and Caprolactam in <strong>Nylon</strong>-6 Melts. J. Appl. Polym. Sci.1973, 17, 1663-1677.(28) Bonifaci, L.; Ravanetti, G. P. Measurement of InfiniteDilution Diffusion Coefficients of ɛ-Caprolactam in <strong>Nylon</strong>-6 atElevated Temperatures by Inverse Gas Chromatography. J.Chromatogr. 1992, 607, 145-149.(29) Zielinski, J. M.; Duda, J. L. Predictive Capabilities of aFree-Volume Theory <strong>for</strong> Polymer-Solvent Diffusion Coefficients.Polym. Prepr. (Am. Chem. Soc., Div. Polym. Chem.) 1991, 32, 394-395.(30) Dullien, F. A. L. Predictive Equations <strong>for</strong> Self-Diffusionin Liquids: a Different Approach. AIChE J. 1972, 18, 62-70.(31) Albalak, R. J.; Tadmor, Z.; Talmon, Y. Polymer MeltDevolatilization Mechanisms. AIChE J. 1990, 36, 1313-1320.(32) Tukachinsky, A.; Talmon, Y.; Tadmor, Z. Foam-EnhancedDevolatilization of Polystyrene Melt in a Vented Extruder. AIChEJ. 1994, 40, 670-675.(33) Yarin, A. L.; Lastochkin, D.; Talmon, Y.; Tadmor, Z. BubbleNucleation During Devolatilization of Polymer Melts. AIChE J.1999, 45, 2590-2605.(34) Gogos, C. G.; Tadmor, Z.; Kalyon, D. M.; Hold, P.; Biesenberger,J. A. Polymer Processing: An Overview. Chem. Eng. Prog.1987, 83, 33-58.(35) Holden, B. S.; Katz, J. L. The Homogeneous Nucleation ofBubbles in Superheated Binary Liquid Mixtures. AIChE J. 1978,24, 260-266.(36) Blander, M.; Katz, J. L. Bubble Nucleation in Liquids.AIChE J. 1975, 21, 833-846.(37) Khare, N. P.; Seavey, K. C.; Liu, Y. A.; Ramanathan, S.;Lingard, S.; Chen, C. C. Steady-State and Dynamic <strong>Model</strong>ing ofCommercial Slurry High-Density Polyethylene (HDPE) Processes.Ind. Eng. Chem. Res. 2002, 41, 5601-5618.(38) Bokis, C. P.; Ramanathan, S.; Franjione, J.; Buchelli, A.;Call, M. L.; Brown, A. L. Physical Properties, Reactor <strong>Model</strong>ing,and Polymerization Kinetics in the Low-Density PolyethyleneTubular Reactor Process. Ind. Eng. Chem. Res. 2002, 41, 1017-1030.(39) Khare, N. P.; Lucas, B.; Seavey, K. C.; Liu, Y. A.; Sirohi,A.; Ramanathan, S.; Lingard, S.; Song, Y.; Chen, C. C. Steady-State and Dynamic <strong>Model</strong>ing of Gas-Phase Polypropylene ProcessesUsing Stirred-Bed Reactors. Ind. Eng. Chem. Res. 2004,43, 884-900.(40) Cheong, S. I.; Choi, K. Y. Melt Polycondensation of Poly-(ethylene terephthalate) in a Rotating Disk Reactor. J. Appl.Polym. Sci. 1995, 58, 1473-1483.Received <strong>for</strong> review February 23, 2004Revised manuscript received May 21, 2004Accepted May 25, 2004IE040067L