to view Short Range Transit Plan FY 2007/2008 - Tri Delta Transit
to view Short Range Transit Plan FY 2007/2008 - Tri Delta Transit
to view Short Range Transit Plan FY 2007/2008 - Tri Delta Transit

Create successful ePaper yourself
Turn your PDF publications into a flip-book with our unique Google optimized e-Paper software.
<strong>Short</strong> <strong>Range</strong> <strong>Transit</strong> <strong>Plan</strong><strong>FY</strong> <strong>2007</strong>/08 – 2017/18
The Eastern Contra Costa <strong>Transit</strong> Authority (ECCTA)<strong>Tri</strong> <strong>Delta</strong> <strong>Transit</strong><strong>Short</strong> <strong>Range</strong> <strong>Transit</strong> <strong>Plan</strong><strong>FY</strong> <strong>2007</strong>/08 – 2017/18January 30, <strong>2008</strong>Adopted on February 27, <strong>2008</strong> by the ECCTA Board of Direc<strong>to</strong>rs.The Eastern Contra Costa <strong>Transit</strong> Authoritydba <strong>Tri</strong> <strong>Delta</strong> <strong>Transit</strong>801 Wilbur AvenueAntioch, CA. 94509(925) 754-6622www.trideltatransit.comFederal transportation statutes require that the Metropolitan Transportation Commission(MTC), in partnership with state and local agencies, develop and periodically update along-range Regional Transportation <strong>Plan</strong> (RTP), and a Transportation ImprovementProgram (TIP), which implements the RTP by programming federal funds <strong>to</strong>transportation projects contained in the RTP. In order <strong>to</strong> effectively execute theseplanning and programming responsibilities, MTC requires that each transit opera<strong>to</strong>r in itsregion which receives federal funds through the TIP, prepare, adopt, and submit <strong>to</strong> MTCa <strong>Short</strong> <strong>Range</strong> <strong>Transit</strong> <strong>Plan</strong> (SRTP).The preparation of this SRTP has been funded in part by a grant from the United StatesDepartment of Transportation (USDOT), through Section 5303 of the Federal <strong>Transit</strong>Act. The contents of this SRTP reflect the <strong>view</strong>s of the Eastern Contra Costa <strong>Transit</strong>Authority and are not necessarily those of USDOT, the Federal <strong>Transit</strong> Administration(FTA), or the Metropolitan Transportation Commission. The Eastern Contra Costa<strong>Transit</strong> Authority is solely responsible for the accuracy of information presented in thisSRTP.Civil Rights Compliance. In compliance with Title VI regulations of the Civil RightsAct of 1964, no person in the United States of America shall, on grounds of race, color,or national origin, be excluded from participating in, or denied the benefits of, or besubject <strong>to</strong> discrimination under any program or activity receiving federal financialassistance. <strong>Tri</strong> <strong>Delta</strong> <strong>Transit</strong> must ensure that federally supported transit service andrelated benefits are distributed in an equitable manner. <strong>Tri</strong> <strong>Delta</strong> <strong>Transit</strong> has certified thatit is in compliance with Title VI regulations.i
List of TablesTable 1.1 ECCTA Service Area Population Trends and Projections 3Table 1.2 ECCTA Service Area – Year 2000 Daytime Population 7Table 1.3 ECCTA Community <strong>to</strong> Community/Area Commuters 8Table 1.4 <strong>Transit</strong> Share of Work <strong>Tri</strong>ps 9Table 1.5 <strong>Tri</strong> <strong>Delta</strong> <strong>Transit</strong> Fixed Routes 16Table 1.6 <strong>Tri</strong> <strong>Delta</strong> <strong>Transit</strong> Fare Structure – Effective July <strong>2007</strong> 20Table 1.7 Roster of Active Revenue Vehicles – June <strong>2007</strong> 21Table 2.1 ECCTA Mission Statement 24Table 2.2 Summary of ECCTA Objectives, Measures,and Standards 25Table 3.1 Fixed Route Operating Trends 27Table 3.2 Patronage and Service Levels, <strong>FY</strong> 2003-04 and<strong>FY</strong> 2006-07 29Table 3.3 Fixed Route Average Occupancy, <strong>FY</strong> 1995-<strong>FY</strong><strong>2007</strong> 30Table 3.4 Passengers by Type Fare Paid, <strong>FY</strong> 2003-04 vs.<strong>FY</strong> 2006-07 32Table 3.5 Route Performance & Productivity, <strong>FY</strong> 2003-04 34Table 3.6 Route Performance & Productivity, <strong>FY</strong> 2006-07 35Table 3.7 Fixed Route Operating Statistics & PerformanceIndica<strong>to</strong>rs 37Table 3.8 DAR Operating Trends, <strong>FY</strong> 1995-<strong>2007</strong> 38Table 3.9 DAR Patronage/Service Level by Service, <strong>FY</strong> 2003-04 41Table 3.10 DAR Patronage/Service Level by Service<strong>FY</strong> 2006-07 42Table 3.11 DAR Expense, Revenue & Farebox Recovery<strong>FY</strong> 2003-04 42Table 3.12 DAR Expense, Revenue & Farebox Recovery<strong>FY</strong> 2006-07 42Table 3.13 DAR Operating Statistics & Performance Indica<strong>to</strong>rs 43Table 3.14 Part 1: <strong>Tri</strong> <strong>Delta</strong> <strong>Transit</strong> & MTC Survey Results 57Table 3.14 Part 2: <strong>Tri</strong> <strong>Delta</strong> <strong>Transit</strong> & MTC Survey Results 58vii
List of Tables (continued)Table 4.1 Estimated Weekday <strong>Transit</strong> <strong>Tri</strong>p Origins & Destinations 78Table 5.1 Projected <strong>Tri</strong> <strong>Delta</strong> <strong>Transit</strong> Fixed Route Service Levels 90Table 5.2 Projected <strong>Tri</strong> <strong>Delta</strong> <strong>Transit</strong> Dial-A-Ride Service Levels 95Table 5.3 Projected FIXED ROUTE Operating Budgets,<strong>FY</strong> <strong>2008</strong>-<strong>FY</strong> 2018 97Table 5.4 Projected DIAL-A-RIDE Operating Budgets,<strong>FY</strong> <strong>2008</strong>-<strong>FY</strong> 2018 98Table 5.5 Projected SYSTEM Operating Budgets,<strong>FY</strong> <strong>2008</strong>-<strong>FY</strong> 2018 99Table 5.6 Projected Operating Characteristics & BudgetSummary 100Table 6.1 <strong>Tri</strong> <strong>Delta</strong> <strong>Transit</strong> <strong>Plan</strong>ned Capital ExpenditureSummary 102Table 6.2 <strong>Tri</strong> <strong>Delta</strong> <strong>Transit</strong> <strong>Plan</strong>ned Fleet Capital ExpenditureSummary 103viii
Executive SummaryChapter One of this <strong>Short</strong> <strong>Range</strong> <strong>Transit</strong> <strong>Plan</strong> (SRTP) summarizes thepurpose of the SRTP, describes characteristics of the <strong>Tri</strong> <strong>Delta</strong> <strong>Transit</strong>service area including population and development trends, commuteand other travel patterns, and summarizes transit’s share of commutetrips for the service area. The his<strong>to</strong>ry of <strong>Tri</strong> <strong>Delta</strong> <strong>Transit</strong> is brieflysummarized, governance arrangements outlined, and the servicesprovided by both the fixed route and paratransit systems are describedin detail. The <strong>Tri</strong> <strong>Delta</strong> <strong>Transit</strong> fare structure, revenue vehicle fleet andfacilities are also summarized in Chapter One.Chapter Two summarizes <strong>Tri</strong> <strong>Delta</strong> <strong>Transit</strong>’s goals, objectives andstandards. The Mission Statement is also described, as are the detailsof supporting objectives, measures and standards.ECCTA Mission Statement:No. Statement1. To provide safe, reliable, friendly, high quality and economical transportation service <strong>to</strong> the EasternContra Costa community;2. To provide an organizational environment that encourages cooperation, rewards excellence, anddevelops a team of highly motivated staff;3. To empower employees <strong>to</strong> function as owners of the Eastern Contra Costa <strong>Transit</strong> Authorityorganization;4. To develop Eastern Contra Costa <strong>Transit</strong> Authority services and facilities <strong>to</strong> better serve the transitdependent community and capture a greater share of the commute market;5. To secure and manage funds <strong>to</strong> maintain and expand transit service and <strong>to</strong> operate Eastern ContraCosta <strong>Transit</strong> Authority according <strong>to</strong> fiscally sound business practices;6. To take a leadership role in developing a coherent transportation policy <strong>to</strong> deal with problems oftraffic congestion, air quality, and growth management;7. And <strong>to</strong> build constituencies at all levels of government that support the Eastern Contra Costa <strong>Transit</strong>Authority and its programs.ECCTA’s goals that support the adopted Mission Statement aresummarized below:I. Provide safe, reliable and high quality public transportation <strong>to</strong>ECCTA service area residents.II. Provide efficient public transportation <strong>to</strong> the residents of theECCTA service area.III. Provide an accessible public transportation system <strong>to</strong> theresidents of the ECCTA service area.ix
Chapter Three is a comprehensive System & Service Evaluation of the<strong>Tri</strong> <strong>Delta</strong> <strong>Transit</strong> system. Overall system level fixed route and dial-aridetrends and performance indica<strong>to</strong>rs are summarized and evaluated,comparing <strong>FY</strong>s 2003-04 and 2006-07 and evaluated against a numberof adopted standards/measures.Individual route performance is re<strong>view</strong>ed for the fixed route network.For the dial-a-ride (DAR) system, compliance with Americans withDisabilities Act (ADA) regulations is discussed.Chapter Three includes an analysis of Capital Program trends, focusingon the vehicle fleet, transit centers and park & ride lots, and acoordinated local bus, BRT and eBART/BART strategy. On-board surveyresults are included in Chapter Three, summarizing the <strong>Tri</strong> <strong>Delta</strong><strong>Transit</strong>/eBART survey conducted in Fall 2006, and the MetropolitanTransportation Commission (MTC)-sponsored survey completed inFebruary <strong>2007</strong>.<strong>Tri</strong> <strong>Delta</strong> <strong>Transit</strong>’s response and activities related <strong>to</strong> its most recentProductivity Improvement Program (PIP) is summarized, as are theresponse <strong>to</strong> the <strong>FY</strong> 2003-05 <strong>Tri</strong>ennial Performance Audit, the FederalTitle VI Program, and response <strong>to</strong> the <strong>FY</strong> <strong>2007</strong> Federal <strong>Tri</strong>ennialRe<strong>view</strong>.Chapter Four is a discussion of potential Bus Rapid <strong>Transit</strong> (BRT)options designed <strong>to</strong> effectively supplement the existing local busservices. Examples and descriptions of potentially relevant BRTsystems from Eugene-Springfield, Oregon, Las Vegas, Nevada, Miami,Florida, and Pittsburgh, Pennsylvania are presented. Potential optionsfor BRT in East Contra Costa County are discussed, based on existing<strong>Tri</strong> <strong>Delta</strong> <strong>Transit</strong> patronage patterns and unmet transit needs in theservice area.Chapter Five summarizes the proposed Operations <strong>Plan</strong> and Budgetfor the <strong>FY</strong> <strong>2007</strong>-08 through <strong>FY</strong> 2017-18 period. The strengths andweaknesses found in the service evaluation (Chapter Three) aresummarized and complimented with a discussion of the challenges andopportunities facing the transit system. The proposed Fixed RouteOperations <strong>Plan</strong> is presented, followed by the recommended Dial-A-Ride Operating <strong>Plan</strong>. Operating Statistics and Budget Projections aresummarized for Fixed Route, Dial-A-Ride, and System Total (Tables5.3, 5.4, and 5.5, respectively). A summary table of ProjectedOperating Characteristics and Budget is also presented (Table 5.6).Chapter Six presents the recommended Capital <strong>Plan</strong>. The <strong>Plan</strong>nedCapital Expenditure Summary is summarized in Table 6.1. Table 6.2outlines the <strong>Plan</strong>ned Fleet Capital Expenditures over the life of thisSRTP. Capital project detail narrative is included.x
Introduction & Over<strong>view</strong>CHAPTER1Purpose of the <strong>Short</strong> <strong>Range</strong> <strong>Transit</strong> <strong>Plan</strong>Federal transportation statutes require that the MetropolitanTransportation Commission (MTC), in partnership with state and localagencies, develop and periodically update a long-range RegionalTransportation <strong>Plan</strong> (RTP), and a Transportation Improvement Program(TIP), which implements the RTP by programming federal funds <strong>to</strong>transportation projects contained in the RTP. In order <strong>to</strong> effectivelyexecute these planning and programming responsibilities, MTC requiresthat each transit opera<strong>to</strong>r in its region which receives federal fundsthrough the TIP, prepare, adopt, and submit <strong>to</strong> MTC a <strong>Short</strong> <strong>Range</strong><strong>Transit</strong> <strong>Plan</strong> (SRTP).In keeping with MTC’s SRTP guidelines, this document focuses on thefollowing:• Compliance with MTC and FTA planning program requirements• Providing a comprehensive evaluation of existing services andrecommendations for system improvements• Outlining goals, objectives, performance measures andstandards as applicable <strong>to</strong> ongoing system operations• Establishing transit and paratransit service levels in a balancedbudget scenario• Offering direction for additional expansion if funding conditionsimprove during the planning period;• Serving as a public information resource.In addition <strong>to</strong> meeting the requirements of funding agencies at theregional, state and federal levels, the <strong>Short</strong> <strong>Range</strong> <strong>Transit</strong> <strong>Plan</strong> willprovide a blueprint for transit service during the next decade, and isan implementation guide for the <strong>Plan</strong>’s prioritized serviceimprovements. The analysis must provide justification for therecommended course of action, and must also examine the “realworld” feasibility of meeting various new, currently unmet transitneeds, such as serving growing areas.This report contains six chapters. The remainder of Chapter Onedescribes ECCTA’s his<strong>to</strong>ry, the system’s governance, organizationalstructure and funding, and outlines the transportation servicesprovided. ECCTA provides both fixed route bus service andcomplementary paratransit <strong>to</strong> meet the requirements of the Americanswith Disabilities Act (ADA). Additional information includes farestructure, revenue vehicle fleet and facilities, and service areacharacteristics.1
Chapter Two, Goals, Objectives and Standards, describes the processfor re<strong>view</strong>ing and updating goals, objectives, performance indica<strong>to</strong>rsand standards, and recommends changes based on identifiedstrengths, weaknesses, constraints and opportunities for the transitsystem.Chapter Three, Service and System Evaluation, updates and evaluates<strong>Tri</strong> <strong>Delta</strong> <strong>Transit</strong> performance since the previous SRTP, focusing onperformance and financial trends during the past ten years. ChapterThree also summarizes ECCTA efforts regarding the productivityimprovement program, triennial performance audit, community-basedtransportation planning, and Title VI compliance.Chapter Four examines Express Bus and Bus Rapid <strong>Transit</strong> (BRT)opportunities for supplementing the proposed eBART line and the localbus system, and recommends promising options for future study.Chapter Five, Operations <strong>Plan</strong> and Budget, outlines a recommendeddirection of service during the ten-year planning horizon of the SRTP,including incremental service improvements and a constrainedoperating budget that supports the recommended program.Chapter Six, Capital <strong>Plan</strong>, describes the supporting ten-year capitalplan including fleet plan, facilities/equipment plan and other capitalinvestments supporting the operating plan.Characteristics of the Service AreaThe ECCTA service area covers 225 square miles of Contra CostaCounty, generally bounded by the Sacramen<strong>to</strong> and San Joaquin Rivers<strong>to</strong> the north, San Joaquin County <strong>to</strong> the east, Alameda County <strong>to</strong> thesouth and the Willow Pass grade <strong>to</strong> the west. Pittsburg and Antiochwere once home <strong>to</strong> heavy industries including steel, paper and electricpower generation. His<strong>to</strong>rically, agriculture dominated the economies ofBrentwood and Oakley. Figure 1.1 shows the location of ECCTA servicearea within Contra Costa County.Population TrendsHeavy industry declined in the ECCTA service area long before theAuthority was formed. Rapid, residential growth followed whichtransformed Eastern Contra Costa County in<strong>to</strong> low density commutesuburbs of the greater Bay Area. Bay Point and Pittsburg saw rapidgrowth in the 1970’s and 1980’s, while during the 1990’s populationgrowth was concentrated in Antioch and Oakley. After 2000,Brentwood grew the most rapidly, more than doubling its population inless than seven years. Table 1.1 illustrates population growth trendsfor each community since the 2000 U.S. Census, and includesestimates for 2010, 2015, and 2020. Smaller rural communities suchas Byron and Bethel Island are included in unincorporated <strong>to</strong>tals.2
Table 1.1 ECCTA Service Area Population Trends and ProjectionsDate: 4/1/00 1/2/01 1/2/02 1/2/03 1/2/04 1/2/05 1/2/06 1/2/07 1/2/10 1/2/15 1/2/20Antioch 90,532 93,222 96,770 99,244 100,892 100,714 100,163 100,150 106,253 111,793 117,130Brentwood 23,302 26,202 30,010 34,125 38,442 42,108 45,974 48,907 49,182 56,425 71,710Oakley 25,619 26,032 27,030 27,733 28,455 29,068 29,485 31,906 31,597 34,126 36,277Pittsburg 56,769 58,014 59,932 61,036 61,665 62,398 62,492 63,004 66,516 70,822 75,002Incorporated 196,222 203,470 213,742 222,138 229,454 234,288 238,114 243,967 253,549 273,165 300,120Discovery Bay 8,981 9,092 9,203 9,314 9,425 9,538 9,708 9,878 10,387 10,873 11,197Bay Point 21,534 21,801 22,068 22,335 22,602 22,869 23,276 23,683 24,904 26,071 26,848Unincorporated 30,515 30,893 31,271 31,649 32,027 32,407 32,984 33,561 35,291 36,944 38,046TOTAL 226,737 234,363 245,013 253,787 261,481 266,695 271,098 277,528 288,840 310,109 338,165Source: Association of Bay Area Governments (ABAG) Draft Projections <strong>2007</strong> (data in italics extrapolated from ABAG household projections).Population growth in the ECCTA service area is projected <strong>to</strong> continueits growth at a significantly higher rate than Contra Costa County as awhole, despite the impact of the current (<strong>2007</strong>) housing recession.Projected growth rates reflect lower housing prices below the ContraCosta average and a relatively large supply of undeveloped land. A<strong>to</strong>tal of about 278,000 residents are currently estimated <strong>to</strong> live in theECCTA service area, an increase of about 51,000 persons and 22.5%since the 2000 U.S. Census. The area’s growth rate between <strong>2007</strong> and2010 is projected <strong>to</strong> slow down <strong>to</strong> a net increase of about 11,000persons, up about 4% or 1.3% per year, down from the nearly 3%annual growth rate experienced between 2000 and <strong>2007</strong>.By 2020, the population of Brentwood is likely <strong>to</strong> be a close third afterEast County’s second largest city, Pittsburg. Though Table 1.1 reflectstrend projections for Discovery Bay and Bay Point, both unincorporatedcommunities, unincorporated growth rates may increase dramaticallydue <strong>to</strong> approved projects and ongoing construction of thousands ofadditional housing units in Discovery Bay and Bethel Island.Development TrendsLand development in East County is increasingly shaped by an UrbanLimit Line (ULL), which represents a consensus among theincorporated cities and Contra Costa County <strong>to</strong> constrain growth <strong>to</strong>defined areas and thereby limit urban sprawl. The current ULLoriginally expired in 2010; however, revisions were approved by thevoters in June 2006 and now will remain in effect through 2034. Areasoutside of the ULL are precluded from intensive residential orcommercial development. Therefore, these areas are unlikely <strong>to</strong>require <strong>Tri</strong>-<strong>Delta</strong> <strong>Transit</strong> service within the ten-year planning period.It should be noted that residential growth in East County peaked in2005 and 2006; as of this writing (Fall <strong>2007</strong>), housing starts havedropped dramatically as a result of the mortgage credit crunch, sogrowth trends discussed in this section may require several more years<strong>to</strong> resume the trajec<strong>to</strong>ries noted in the 2006 SRTP.3
Figure 1.1 ECCTA Service Area4
For purposes of discussions relative <strong>to</strong> <strong>Tri</strong> <strong>Delta</strong> <strong>Transit</strong> service, EastCounty is distinguished in<strong>to</strong> four sub areas:North of Highway 4. The northwestern portion of the service areaincludes the mature neighborhoods of Pittsburg, Antioch and Bay Pointeast <strong>to</strong> Hillcrest Avenue. This area contains the oldest urbanizeddistricts in Contra Costa County, including down<strong>to</strong>wn Pittsburg,down<strong>to</strong>wn Antioch, and Shore Acres in Bay Point. Most higher densityresidential neighborhoods in East County are located along theHighway 4 corridor. Current and planned future development focuseson in-fill residential housing, commercial revitalization, and reuse ofobsolete industrial properties. These functions will moderately increaseDensity of population and jobs in the area and are projected <strong>to</strong>increase moderately during the next decade, helping improveproductivity of existing fixed route service.South of Highway 4. Beginning in the 1970’s low and medium densityneighborhoods began <strong>to</strong> form south of Highway 4 in Antioch andPittsburg. Most of this development is generally north of James DonlonDrive and Buchanan Road. Somersville Towne Center (formerly CountyEast Mall) is the major regional shopping center in East County, and islocated south of Highway 4 at the Somersville Road interchange. EastLeland Road between Somersville and Loveridge Road functions as afocus for transit routes due <strong>to</strong> the large number of activity centers,including Los Medanos College, County Social Services, PittsburgHealth Center and Somersville Towne Center.Single-family houses dominate the housing s<strong>to</strong>ck in Antioch andPittsburg, but there are also a significant number of multifamilyhousing complexes on major streets including Sycamore Drive inAntioch and East and West Leland Roads in Pittsburg. <strong>Tri</strong> <strong>Delta</strong> <strong>Transit</strong>fixed routes cover this area better than most areas dominated by acurvilinear street system, due <strong>to</strong> the presence of suitable collec<strong>to</strong>rstreets. <strong>Transit</strong> coverage is more limited in these areas thanneighborhoods with grid street networks due <strong>to</strong> the lack ofthroughways.Moderate levels of population and employment growth are forecast inthe area bounded by Railroad, Buchanan and Loveridge Roads andHighway 4 in Pittsburg, as well as in the commercial area surroundingthe Somersville Road interchange at Highway 4 in Antioch.Brentwood/Oakley. Rapid suburban growth has overtaken thispreviously rural area of East Contra Costa County since the 1980’s,replacing a large percentage of the area’s agricultural land. Residentialand institutional growth west of Highway 4 is gradually merging withthe rapid growth in southeast Antioch, except for areas designated asopen space. The area between Brentwood and Antioch is projected <strong>to</strong>experience very rapid population growth during the next few decades,along with more modest employment growth. Community expectationsare that <strong>Tri</strong> <strong>Delta</strong> <strong>Transit</strong> should serve this area in the short-rangefuture, although the effectiveness of conventional fixed route service isuncertain due <strong>to</strong> the low density and demographics of the area.5
Major streets in Brentwood are trending <strong>to</strong>wards four-lane arterialswith medians and turn pockets as construction of planneddevelopments and subdivisions continue at a rapid pace. BrentwoodBoulevard (Highway 4) is the primary north-south corridor throughBrentwood and Oakley; Empire Avenue, Fair<strong>view</strong> Avenue, O’Hara Roadand Walnut Boulevard also move significant north-south traffic. Abypass of existing Highway 4 has been under construction and thesection between Lone Tree Way and Balfour Road was opened in 2006.The bypass follows a diagonal route parallel <strong>to</strong> existing railwayalignments. Intersections are planned at Lone Tree Way, Sand CreekRoad, Balfour Road, Marsh Creek Road and Walnut Boulevard. Thenorth segment from Lone Tree Way <strong>to</strong> the existing State Routes 4/160interchange opened in early <strong>2008</strong>. The final segment from BalfourRoad <strong>to</strong> Vasco Road is slated <strong>to</strong> open in the fall of <strong>2008</strong>.Major east-west travel corridors in Oakley include Main Street(Highway 4), Cypress and Laurel Roads, and Lone Tree Way. InBrentwood, major east-west corridors include Lone Tree Way west ofFair<strong>view</strong> Avenue, Sand Creek Road and Balfour Road. <strong>Plan</strong>ned newcollec<strong>to</strong>r and local streets are a combination of grid and subdivisionstreets which can be difficult <strong>to</strong> serve with transit routes and buses.Bethel Island/Byron/ Discovery Bay. Located northeast of Oakley,Bethel Island is a rural delta island accessed via Cypress Road, BethelIsland Road and the Bethel Island Bridge. Bethel Island is dominatedby single family housing at rural densities, plus a few small businesses.Current development projects will double Bethel Island’s populationduring the next decade, depending on the pace of new housing starts.Residential development with thousands of new units proposed isoccurring along East Cypress Road, mainly east of Bethel Island Road,including retail uses and schools. Oakley’s 2020 General <strong>Plan</strong>designates the area east of Bethel Island Road with higher densityresidential and commercial development. The plan also provides forconstruction of a connection between Cypress Road and Laurel Road,east of Main Street, allowing direct travel between the Cypress Roadcorridor and the Highway 4 bypass. This corridor has been expanded <strong>to</strong>a 50 M.P.H., four lane arterial with no turn-around sufficient for buses,thus limiting potential transit service <strong>to</strong> the area.Byron and Discovery Bay are located south and southeast ofBrentwood and accessible via Highway 4. Byron is a small ruralcommunity with about 1,000 residents and with predominantly ruralinfrastructure. The rapid pace of development in Brentwood andMountain House in nearby San Joaquin County are fostering economicpressure for similar activity in Byron. Several proposals currently areunder consideration by Contra Costa County.Discovery Bay has grown <strong>to</strong> about 10,000 residents fromapproximately 9,000 in the 2000 Census, with additional subdivisionsunder construction and in the planning stage. Most original DiscoveryBay housing was upscale, generating limited demand for transit.Current and future residential growth is projected <strong>to</strong> consist mainly ofsmaller homes on smaller lots that at some point will justify additionalfrequency on the currently limited transit service.6
Commute & Other Travel PatternsAs previously mentioned, the ECCTA service area has evolved fromprimarily industrial and agricultural communities in<strong>to</strong> a spread out,low-density commuter-oriented suburban area on the periphery of theBay Area. As shown in Table 1.2, the U.S. Census estimated that theweekday “daytime population” of East County declined by 55,539people compared <strong>to</strong> the resident (“overnight”) population. This figure isthe <strong>to</strong>tal of resident population, plus people commuting in, less thenumber of workers commuting out. As might be expected, the moreheavily residential an area, the more the “daytime population”declined. While Pittsburg and Antioch contained the largest number oflocal jobs (74%), each community also experienced large drops indaytime population. Of the 98,600 employed residents living in thearea at the 2000 U.S. Census, about 19% worked in the samecommunity as they lived, and only about one-third worked withinECCTA service area communities.The first priority of <strong>Tri</strong> <strong>Delta</strong> <strong>Transit</strong> is <strong>to</strong> serve the 80% of existingpatrons who travel within the service area. The second priority is <strong>to</strong>provide transit connections <strong>to</strong> adjacent areas where such connectionswould not otherwise exist, such as <strong>to</strong> Martinez and the <strong>Tri</strong> Valley Area.The third priority is <strong>to</strong> provide connections <strong>to</strong> BART, which providesexcellent access <strong>to</strong> Central Contra Costa County and the Central BayArea including Oakland, Berkeley and San Francisco. Through otherregional transit connections with BART, East County residents also canconnect <strong>to</strong> employment opportunities in San Mateo, Marin and SantaClara Counties.Table 1.2 ECCTA Service Area – Year 2000 Daytime PopulationDaytime populationchange due <strong>to</strong>commutingWorkers wholived and workedin the same placeTotalresidentTotalworkersworking inTotalworkersliving inEstimateddaytime% LocalJobholders/ LocalCOMMUNITY population the place the place populationNumber Percent Number PercentJobsDiscovery Bay CDP 8,981 973 4,503 5,451 (3,530) -64.8% 560 12.4% 22.0%Brentwood 23,302 6,073 9,229 20,146 (3,156) -15.7% 2,267 24.6% 66.0%Oakley 25,619 2,957 11,729 16,847 (8,772) -52.1% 1,330 11.3% 25.0%Antioch 90,532 17,862 40,712 67,682 (22,850) -33.8% 9,728 23.9% 44.0%Pittsburg 56,769 13,637 23,942 46,464 (10,305) -22.2% 4,541 19.0% 57.0%Bay Point CDP 21,534 1,588 8,514 14,608 (6,926) -47.4% 596 7.0% 19.0%TOTAL 226,737 43,090 98,629 171,198 (55,539) -24.5% 19,022 19.3% 43.7%Jobs Held by Area Residents (Table 1.3) 31,640 32.1% 73.4%Martinez 35,866 16,472 18,820 33,518 (2,348) -6.5% 3,665 22.2% 87.5%Concord 121,780 54,245 58,700 117,325 (4,455) -3.7% 16,719 30.8% 92.4%Walnut Creek 64,296 49,581 29,901 83,976 19,680 30.6% 8,507 17.2% 165.8%Source: Census 2000 PHC-T-40. Estimated Daytime Population and Employment-Residence Ratios: 2000As summarized in Table 1.3, about 30% of East County employedresidents commuted <strong>to</strong> Central Contra Costa County (Martinez,Concord, Walnut Creek, and elsewhere). About 7% commuted <strong>to</strong> the7
Berkeley, Oakland, Alameda, Albany and Emeryville area of the CentralEast Bay; 8.5% <strong>to</strong> San Francisco and San Mateo Counties; 4% <strong>to</strong>Dublin, Pleasan<strong>to</strong>n, and Livermore; 3% <strong>to</strong> the North Bay (Marin, Napa,Solano and Sonoma Counties); 2.5% <strong>to</strong> Santa Clara County, 2.5% <strong>to</strong>West Contra Costa County (Richmond, Pinole, El Sobrante, El Cerri<strong>to</strong>,Hercules and Rodeo); and about 10% <strong>to</strong> other locations (out of the BayArea, rural communities not identified, etc.)As mentioned in the Development Trends section above, most jobs inAntioch are concentrated around the Highway 4/Somersville Roadshopping area, with smaller concentrations in down<strong>to</strong>wn Antioch, thenortheast industrial area between down<strong>to</strong>wn and Highway 4, and theremainder scattered throughout the community.In Pittsburg, most jobs are located in the Loveridge Road and LelandRoad area in the vicinity of Los Medanos College, primarily south of theHighway 4 freeway.Brentwood has the third largest concentration of jobs, primarily locatedin the central areas of the community.Table 1.3 ECCTA Community <strong>to</strong> Community/ Area CommutersMartinez 40 90 280 1,110 830 340 2,690Concord 125 440 1,405 4,545 3,470 1,485 11,470Walnut Creek 145 300 715 3,025 2,050 740 6,975Other Central Contra Costa 259 454 735 3,625 2,460 1,115 8,648TO/FROMDiscoveryBayBrentwoodOakley Antioch PittsburgBayPoint TOTALDiscovery Bay 560 50 60 30 15 0 715Brentwood 375 2,260 705 685 135 60 4,220Oakley 170 205 1,310 440 105 485 2,715Antioch 85 575 1,445 9,720 1,345 330 13,500Pittsburg 70 240 600 3,400 4,550 555 9,415Bay Point 0 15 35 220 210 595 1,075West CC County 45 124 300 965 790 234 2,458Oakland-Berkeley-Alameda-Albany-Emeryville225 480 570 2,845 1,724 730 6,574Dublin-Pleasan<strong>to</strong>n-Livermore 615 1,055 690 699 560 265 3,884San Francisco 65 310 310 2,645 2,040 840 6,210San Mateo Co. 114 159 143 1,340 329 118 2,203Solano-Napa 34 120 250 1,384 469 154 2,411Sonoma-Marin 0 61 10 149 164 35 419Santa Clara Co. 444 480 433 735 303 55 2,450Other 1,095 1,540 1,692 2,942 2,305 353 9,927TOTAL 4,466 8,958 11,688 40,504 23,854 8,489 97,959Source: 2000 U.S. Census Journey <strong>to</strong> Work data<strong>Transit</strong> Share of Commute <strong>Tri</strong>psAccording <strong>to</strong> the 2000 U.S. Census, transit’s share of <strong>to</strong>tal commutertrips in each East Contra Costa County community gradually declinesas access distance increases <strong>to</strong> the Pittsburg/Bay Point BART station.8
This data is presented in Table 1.4. <strong>Transit</strong> share of <strong>to</strong>tal commutertrips exceeds 8% in Bay Point and Pittsburg within 0-4 miles of theBART station. <strong>Transit</strong> share is about 4% in Antioch, which is locatedbetween 7 and 13 miles away from BART. <strong>Transit</strong> share declinesfurther <strong>to</strong> only about 2% in both Oakley and Brentwood, between 15and 21 miles from BART. Discovery Bay’s transit mode share is only1.4%, at a distance of 28 <strong>to</strong> 31 miles from Pittsburg/Bay Point BART.This direct relationship between mode share and distance from BARTsuggests that high quality transit service, whether rail such as theproposed eBART line, or “bus rapid transit” (BRT) could potentiallyincrease overall transit usage. The potential for BRT <strong>to</strong> supplementexisting BART service and the proposed eBART route is examined inChapter Four.Table 1.4 <strong>Transit</strong> Share of Work <strong>Tri</strong>psTypical Mileage <strong>to</strong> <strong>Transit</strong> CommuteCommunityBay Point BARTShareDiscovery Bay 28-31 miles 1.4%Brentwood 20-21 miles 2.3%Oakley 15-16 miles 2.1%Antioch 7-13 miles 4.4%Pittsburg 3-4 miles 8.3%Bay Point
ECCTA terminated the AC <strong>Transit</strong> contract in 1984, consolidating bothfixed route and paratransit operations under its agreement with CTS.The CTS operating and maintenance facility was located at a formerU.S. Steel facility in Pittsburg, while ECCTA administrative offices werelocated on Sycamore Drive in Antioch. In 1986, ECCTA replaced CTSwith Laidlaw <strong>Transit</strong> Services, Inc. as its service contrac<strong>to</strong>r. Laidlaw or,it’s successor organization continues in this capacity <strong>to</strong>day (Laidlawwas purchased by First <strong>Transit</strong> in late <strong>2007</strong>). The current serviceagreement was renewed effective July 2006 for a three year term withthree, one-year optional extensions.The existing ECCTA facility at 801 Wilbur Avenue in Antioch wasconstructed and occupied in 1987, consolidating operations,maintenance and administrative functions of ECCTA and its servicecontrac<strong>to</strong>r at a single location. This facility was expanded in February2004 and additional bus parking was occupied across Minaker Drivefrom the facility in July 2004.Beginning in the mid 1980’s and continuing through the 1990’s, ECCTAexpanded local fixed route service, adding neighborhoods in Pittsburgand southeast Antioch, and improved service coverage in Brentwood,Oakley and rural East County. When BART rail service was extendedfrom North Concord <strong>to</strong> the Bay Point station in December 1996, ECCTArevised a number of routes <strong>to</strong> provide BART feeder service andimproved express service along the Highway 4 corridor. The City ofOakley incorporated in 1999 and joined the JPA.In 2001, ECCTA began operation of <strong>Delta</strong> Express commuter expressservice <strong>to</strong> the Lawrence Livermore/Sandia Labora<strong>to</strong>ry, and the DublinBART station area. A <strong>Delta</strong> Express service <strong>to</strong> down<strong>to</strong>wn Martinez wasadded in March of 2004. In August <strong>2007</strong>, local transit service wasextended from Bay Point over Willow Pass <strong>to</strong> Concord. This new Route201 provides direct, no transfer service for the hundreds of Bay Pointstudents who attend high school in Concord, and links with otherneeded services such as health care in northeast Concord.GovernanceECCTA is governed by an eleven-member board of direc<strong>to</strong>rs composedof two appointed representatives from each of the JPA memberjurisdictions and a single, member at large selected by the other tenboard members on a biennial basis. The appointed representatives areselected by the mayor and/or city council of each of the four cities withtwo more appointed by the county Board of Supervisors. There iscurrently no term of expiration for the ten, city/county appointedboard members. The Board meets once a month at ECCTA’sadministrative office. In addition, two formal subcommittees areconvened as needed:• Administration and Budget Committee - oversees financialactivities of the organization, including purchasing, contracts,bookkeeping and accounting, grant applications, and farepolicy.10
• Marketing and Operations Committee - oversees serviceplanning, public information, cus<strong>to</strong>mer service, and advertisingpolicies.The Board may also convene special ad-hoc committees <strong>to</strong> considerpersonnel matters, handle contract negotiations and conduct otherbusiness as required on an “as necessary” basis.ECCTA directly employs more than 30 personnel for administrative,maintenance, finance, marketing, cus<strong>to</strong>mer service, contract managementand transit planning. ECCTA contracts with First <strong>Transit</strong>, a private forprofitcompany, for the services of more than 150 bus opera<strong>to</strong>rs,supervisors and operations management. First <strong>Transit</strong> is responsible forscreening, hiring, testing and supervision of all operations staff and thebooking, scheduling and dispatching of all paratransit trips. The Board ofDirec<strong>to</strong>rs appoints a Chief Executive Officer (CEO), who in turn issupported by the Chief Operating Officer, Chief Financial Officer,Direc<strong>to</strong>r of Administrative Services, Direc<strong>to</strong>r of Marketing, otheradministrative staff, as well as a Project Manager employed by theoperations contrac<strong>to</strong>r.Figure 1.211
Fixed Route SystemThe <strong>Tri</strong> <strong>Delta</strong> <strong>Transit</strong> fixed route network consists of 11 local weekdayroutes, five express routes, two weekday community routes, and threelocal weekend routes providing coverage between Bay Point andBrentwood through Pittsburg, Antioch and Oakley. Selected routesoperate beyond the boundaries of the ECCTA service area in<strong>to</strong> Martinezand the <strong>Tri</strong>-Valley cities of Dublin, Livermore and Pleasan<strong>to</strong>n as well asthe new, successful Route 201 between Bay Point and Central Concord.The County Connection Route 930, operated by the neighboringCentral Contra Costa <strong>Transit</strong> Authority (CCCTA), also operates aweekday express route between the Hillcrest Park & Ride lot and theWalnut Creek BART station. <strong>Tri</strong> <strong>Delta</strong> <strong>Transit</strong> bus routes are illustratedin Figures 1.2a and 1.2b.Local service includes long-established routes covering the maturecommunities of Antioch, Pittsburg and unincorporated Bay Point, andmore recent extensions in<strong>to</strong> rapidly developing southeast Antioch,Oakley and Brentwood. Most of existing Route 380 and segments nowcovered by Routes 387, 388 and 389 have been operating since thelate 1970’s.Service coverage, frequency and span improvements wereimplemented incrementally in Antioch and Pittsburg during the mid-1980s and 1990s. Brentwood Dimes-a-Ride service began as acircula<strong>to</strong>r route subsidized by the City of Brentwood in 1987 andexpanded somewhat in 1995. The local network was partiallyrestructured in 1994, and again in 1996 following the opening of thePittsburg/ Bay Point BART station. The Route 70 community service inPittsburg was added in 1999, and Route 383 serving Oakley was addedin April 2001. Routes 384, 385 and 386 serving Brentwood and Byronwere added in August of 2005. Route 201 between Bay Point andConcord began operations in August <strong>2007</strong>.<strong>Tri</strong> <strong>Delta</strong> <strong>Transit</strong> first introduced express bus service in 1996 uponopening of the Pittsburg/Bay Point BART station. In 1997, <strong>Tri</strong> <strong>Delta</strong><strong>Transit</strong> assumed responsibility for BART Express bus service betweenPittsburg/Bay Point BART and Brentwood via the Highway 4 corridor.Express service between county medical facilities in Martinez andPittsburg was added in 1998 through a contract between ECCTA andContra Costa County and continues <strong>to</strong>day without the contract. <strong>Delta</strong>Express routes <strong>to</strong> the <strong>Tri</strong> Valley area were initiated in 2000 and 2001.Presently there are five express routes in the network:Three <strong>Delta</strong> Express (DX) routes provide a <strong>to</strong>tal of five one-way tripsper peak period, or a <strong>to</strong>tal of ten one-way trips per weekday.Schedules include two trips per peak <strong>to</strong> Dublin and Hacienda BusinessPark, two <strong>to</strong> Lawrence Livermore Labs, and one <strong>to</strong> down<strong>to</strong>wn Martinez.The Livermore route was implemented in 2000, and Dublin was addedin 2001. Dublin service was discontinued due <strong>to</strong> low patronage in <strong>FY</strong>2003, but reinstated one year later. Over-the-road coaches areassigned <strong>to</strong> DX operations.12
Figure 1.2a. <strong>Tri</strong> <strong>Delta</strong> <strong>Transit</strong> Route Map, Western Portion13
Figure 1.2b <strong>Tri</strong> <strong>Delta</strong> <strong>Transit</strong> Route Map, Eastern Portion14
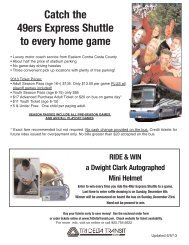
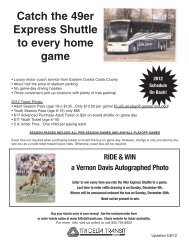
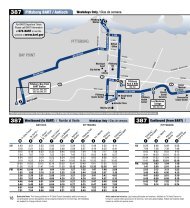
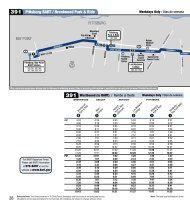
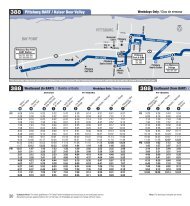
Route 200 -Martinez/Pittsburg links the Contra Costa County MedicalClinic on East Leland Road in Pittsburg with medical facilities inMartinez, including Veterans Hospital, the Contra Costa RegionalMedical Center and the Summit Building. Route 200 also servesdown<strong>to</strong>wn Martinez, inter-connecting with County Connection, Westcat,and Amtrak Capi<strong>to</strong>l Corridor trains. This service has operated since1998 and was partially supported by a funding agreement with ContraCosta County until December of 2006. The weekday-only scheduleconsists of 11 round trips per day running at frequencies ranging from60 <strong>to</strong> 75 minutes.Route 300 - East County Express provides limited s<strong>to</strong>p service betweenthe BART station and existing park-and-ride lots in Antioch andBrentwood via Highway 4. This service originated in 1996. Currently,buses operate on weekdays at 20-minute frequencies during peakperiods, and 30 minute headways during midday and night hours.<strong>Tri</strong> <strong>Delta</strong> <strong>Transit</strong> also provides express bus service <strong>to</strong> all San Francisco49er’s home football games. Buses leave from the park-ride lots inBrentwood, Antioch (Hillcrest), and Pittsburg (Bliss), and arrive at thegame up an hour before kick off time. They leave 30 minutes after thegame is over.Most <strong>Tri</strong> <strong>Delta</strong> <strong>Transit</strong> routes operate between 4:30 a.m. and 9:30p.m., with selected routes beginning service at 3:14 a.m. and endingat 1:14 a.m. Route 390 and the three DX routes operate peak-onlyschedules. Routes 392 and 393 operate on Saturday between 5:30a.m. and 1:30 a.m., and between 6:15 a.m. and 1:30 a.m. onSundays and holidays. Route 394 operates between 7:00 a.m. and8:30 p.m. on weekends and holidays.BART and the Central Contra Costa <strong>Transit</strong> Authority (CCCTA) alsoserve East Contra Costa County. On weekdays, BART trains leave thePittsburg/Bay Point station at least every 15 minutes from 04:00 A.M.The last departing BART train is at midnight all week. Eastbound trainsarrive on 15 minute headways from 5:17 A.M. weekdays, 7:30 A.M.Saturdays, 9:00 A.M. on Sundays until 1:20 A.M. all days.Approximately 15% <strong>to</strong> 20% of BART patrons boarding or arriving atthe Pittsburg/Bay Point BART station transfer <strong>to</strong>/from <strong>Tri</strong> <strong>Delta</strong> <strong>Transit</strong>.CCCTA operates County Connection Route 930 between the Hillcrestpark-and-ride and the down<strong>to</strong>wn Walnut Creek BART station. Fourmorning westbound and six afternoon eastbound trips are offered on30-60 minute frequencies. This route serves employment centers inEast Concord, along Ygnacio Valley Road and down<strong>to</strong>wn Walnut Creek.Table 1.5 summarizes the areas served and average frequencies bytime period for all <strong>Tri</strong> <strong>Delta</strong> <strong>Transit</strong> fixed routes.15
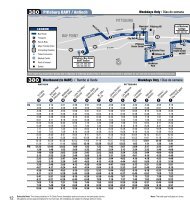
Table 1.5 <strong>Tri</strong> <strong>Delta</strong> <strong>Transit</strong> Fixed RoutesRouteDestinationsExpress Routes (all routes operate weekdays only)PeakFrequencyDX Pittsburg-Antioch <strong>to</strong> Martinez 1 tripeach peakMiddayFrequencyEveningFrequencySpan ofServicen.a. n.a. Mon-Fripeak periodsDXDX<strong>Delta</strong> Express Antioch-Oakley-Brentwood <strong>to</strong> LawrenceLivermore /Sandia Lab<strong>Delta</strong> Express Antioch-Oakley-Brentwood <strong>to</strong> Pleasan<strong>to</strong>n-Dublin BART & Hacienda Business Park200 Pittsburg-Bay Point – Martinez (Hospitals, Medical clinicsand Offices, down<strong>to</strong>wn Martinez)2 trips eachpeak2 trips eachpeakn.a. n.a. Mon-Fripeak periodsn.a. n.a. Mon-Fripeak periods60-75 min 60 min n.a. 6:23 a.m.-7:36 p.m.300 Brentwood-Oakley-Antioch (Hillcrest P&R)- BART 20 min. 30 min. 30 min. 4:15 a.m.-10:06 p.m.Local Routes, Weekday70 Pittsburg – Marina <strong>to</strong> Buchanan Loop 60 min. 60 min. 68 min. 6:23 a.m.-7:36 p.m.201 Bay Point BART <strong>to</strong> Concord BART via Bay Point anddown<strong>to</strong>wn Concord30 min. 60 min. 30 min. 6:10 a.m.-7:30 p.m.BDR Brentwood Dimes-A-Ride (Brentwood circula<strong>to</strong>r route) 60 min. 60 min. n.a. 7:00 a.m.-4:59 p.m.380 Bay Point BART-Antioch via Bay Point, Pittsburg, centralAntioch, Lone Tree Way, Hillcrest P&R, <strong>Tri</strong> <strong>Delta</strong> <strong>Transit</strong>383 Antioch (Hillcrest) Park & Ride-Oakley via East 18 th , MainSt (Oakley), O’Hara, Lone Tree Way, and Deer Valley Rd.384 Antioch-Brentwood via Deer Valley, Balfour Rd, SandCreek, Central, Dainty <strong>to</strong> down<strong>to</strong>wn via Brentwood P&R385 Antioch-Brentwood via Hillcrest, Lone Tree, Fair<strong>view</strong>,Balfour <strong>to</strong> Brentwood Park & Ride Lot386 Brentwood Park & Ride Lot-Discovery Bay via Highway 4,Balfour, and Sellers Avenue.387 Pittsburg/Bay Point BART-Antioch via Willow Pass,down<strong>to</strong>wn Pittsburg via Harbor, Leland, <strong>Delta</strong> Fair,Somersville, L St, down<strong>to</strong>wn Antioch, A Street, Wilbur <strong>to</strong>ECCTA388 Bay Point BART-Antioch Kaiser Clinic via Leland, Harbor,14 th , Century, down<strong>to</strong>wn Antioch, Hillcrest P&R, LongTree, Dallas Ranch, Prewett Ranch <strong>to</strong> Kaiser Clinic28-33 min. 28-33 min. 28-33 min. 3:14 a.m.-11:19 p.m.55-60 min. 55-60 min. n.a. 5:24 a.m.-6:58 p.m.60 min. 60-75 min. 57-63 min. 6:40 a.m.-7:56 p.m.60-63 min. 60-85 min. n.a. 6:45 a.m.-6:57 p.m.1 tripeach peak3 trips every3.5 hoursn.a.6:27 a.m.-6:16 p.m.50-75 min. 60-100 min. 2 trips 4:48 a.m.-9:12 p.m.20-37 min. 24-87 min. 30-71 min. 5:06 a.m.-11:27 p.m.389 Bay Point – Bay Point Local Loop 60-69 min. 60 min. 60 min. 4:55 a.m.-10:09 p.m.390 Antioch (Hillcrest) Park & Ride-Pittsburg/Bay Point BART,via south Antioch, Buchanan, Leland (Pittsburg)391 Brentwood Park & Ride – Bay Point BART via Oakley,Antioch (Hillcrest P&R), Pittsburg via Leland.Local Routes, Saturdays & Sundays392 Antioch (Hillcrest) Park & Ride – Pittsburg/Bay Point BARTvia South Antioch, Somersville shopping area, down<strong>to</strong>wnPittsburg.30 min. 30 min. 30 min. 4:00 a.m.-7:56 a.m.,4:13 p.m.-8:24 p.m.27-42 min. 52-60 min. 34-60 min. 4:06 a.m.-1:14 a.m.60 min. 60 min. 60 min. 5:23 a.m. Sat6:23 a.m. Sun– 1:12 a.m.393 Brentwood-Bay Point BART via Oakley, Antioch, Pittsburg, 60 min. 60 min. 60 min.Pittsburg/Bay Point BART, and Bay Point local service.394 Antioch (Hillcrest) Park & Ride-Pittsburg/Bay Point BARTvia central Antioch, James Donlon/Contra Loma,Somersville and Century shopping areas, Leland, WillowPass <strong>to</strong> BART60 min. 60 min. n.a.5:22 a.m. Sat6:18 a.m. Sun1:35 a.m.7:05 a.m.-8:23p.m.16
ECCTA Dial-a-RideDial-a-Ride is the name of ECCTA’s ADA complementary paratransitservice. It provides a door-<strong>to</strong>-door, demand response servicethroughout the ECCTA service area during fixed route coverage hours.A two-tier service is provided, one serving persons eligible for ADAservice and the second serving non-ADA passengers. Regular Dial-a-Ride service covers the majority of local trip requests. Express Dial-a-Ride service is provided under a contract with BART on Sundays andoutside of regular, ECCTA service coverage hours. ECCTA also providesDial-a-Ride service for non-emergency trips <strong>to</strong> medical appointments.The Antioch Senior Bus Service is operated by the Antioch SeniorCitizens Club on weekdays from 8:00 A.M. <strong>to</strong> 5:00 P.M. ECCTA reportstheir operational activities, claims Transportation Development Act(TDA) and Contra Costa County Measure C transportation sales taxfunds for the service, and has purchased vehicles for the programusing County Measure C funds.• Regular Dial-a-Ride serves provides 275 weekday trips and 45passenger trips on Saturdays.• “Express Dial-a-Ride” serves about 40 daily trips on Saturdaysand 50 passenger trips on Sundays.• The Med Van service carries more than 10 round trippassengers per day all week.• The Antioch Senior Bus carries about 50 round trip passengersper weekday.Dial-a-Ride is a door-<strong>to</strong>-door transportation service for eligible seniorsand disabled individuals traveling in Eastern Contra Costa County.There are two eligibility categories; ADA-eligible and non-ADA-eligible.Individuals with disabilities who, because of their disability, cannot useregular fixed route bus service are eligible <strong>to</strong> use the ADA service.Non-ADA eligible disabled persons and seniors 65 years and older whohave completed <strong>Tri</strong> <strong>Delta</strong> <strong>Transit</strong>’s Travel Training Program are eligible<strong>to</strong> use the Non-ADA service.There are distinct service areas for ADA Dial-a-Ride and Non-ADA Diala-Ride.ADA Dial-a-Ride is provided within ¾ mile of scheduled fixedroutes, while non-ADA Dial-a-Ride service covers the entire ECCTAservice area beyond the ¾ mile distance from fixed routes. Theeligibility status of each patron determines what service can be usedand available service times. ADA service is available throughout theECCTA service area during all hours that the fixed route system is inoperation, on weekdays between 3:00 a.m. and 1:00 a.m.; Saturdaysbetween 6:00 a.m. and 1:00 a.m., and Sundays between 7:00 a.m.and 1:00 a.m. General Dial-A-Ride service operates between 6:30 a.m.and 5:30 p.m. Monday through Friday, 10:00 a.m. <strong>to</strong> 6:00 p.m. onSaturdays, with no service on Sundays. A higher fare is also chargedfor service <strong>to</strong> and from locations in the Non-ADA Dial-a-Ride area.17
Eligibility ProcessThe ADA-eligible certification process incorporates an explanation ofhow the applicants’ disability limits their ability <strong>to</strong> use regular busservice completed by a medical professional, and if necessary, afunctional assessment conducted by <strong>Tri</strong> <strong>Delta</strong> <strong>Transit</strong>’s AccessibleServices Manager. The functional assessment was introduced <strong>to</strong> helpmanage demand. An applicant may still qualify for Non-ADA eligibility,and be able <strong>to</strong> use the more limited Non-ADA Dial-a-Ride service ifdenied ADA service for any reason.Approximately 2,000 persons are registered <strong>to</strong> use the Dial-a-Ridesystem, including 1,700 ADA-eligible registrants and 300 non-ADAEligible registrants (mostly seniors). Five hundred registrants use awheelchair or scooter (25% of the <strong>to</strong>tal registrants). The registrationdatabase is updated regularly. All registrants must re-apply everythree years. <strong>Tri</strong> <strong>Delta</strong> <strong>Transit</strong> utilizes an “Integrated Voice Response”(IVR) telephone system that au<strong>to</strong>matically dials and notifies cus<strong>to</strong>mersone month prior <strong>to</strong> expiration of their eligibility.Dial-A-Ride OperationsDriver duties include assisting Dial-a-Ride passengers on and off thebus, securing wheelchairs, escorting passengers <strong>to</strong>-and-from the frontdoor at the point of trip origin or destination, and assisting riders withreasonably-sized parcels and no more than three trips between the busand a patron’s door. A maximum of 16 buses are used for Dial-A-Rideservice at any one time.Dial-a-Ride allows for a 30-minute “window” for each pickup and dropoff,e.g., a bus can arrive up <strong>to</strong> 15 minutes before or 15 minutes afterthe confirmed pick up time.The IVR system au<strong>to</strong>matically notifies cus<strong>to</strong>mers via telephone 15minutes prior <strong>to</strong> the projected actual bus arrival time based on “realtime” operations processes. Mobile Data Terminals (MDTs) andAu<strong>to</strong>matic Vehicle Location (AVL) equipment have been installed oneach Dial-A-Ride vehicle. Maximum onboard travel times are scheduled<strong>to</strong> be less than one hour.Passengers must meet the Dial-a-Ride driver within three minutes ofarrival during the 30-minute window, or risk becoming a “no show.” Ifa passenger must cancel an already-scheduled trip, ECCTA requeststhat they do so at least one day in advance. <strong>Tri</strong>ps cancelled less thanan hour before a scheduled pickup time is recorded as a “no show.”Service may be suspended for one month if a rider is a “no show” morethan 3 times in 6 months.Approximately 50% of Dial-A-Ride trips are scheduled through asubscription request. These trips are initially booked as a recurringseries and only revised as needed. The ADA allows the assignment oftrips within a two hour window – up <strong>to</strong> 60 minutes before or after theoriginally requested pick up or drop off time. With the exception ofsubscription or standing orders, trips can be booked from one <strong>to</strong> threedays in advance. Same day bookings are accepted on a space availablebasis.18
Fare StructureThe ECCTA Board of Direc<strong>to</strong>rs establishes and periodically adjuststransit fares as necessary <strong>to</strong> maintain the financial viability of thesystem. The present fare structure was enacted in January <strong>2007</strong>.Current rates are summarized in Table 1.6. In addition <strong>to</strong> cash fares, anumber of prepaid fare instruments are offered, including 20-ridepunch passes, coupon books and monthly passes for local, bus-railfeeder and express services. In January <strong>2007</strong>, <strong>Tri</strong> <strong>Delta</strong> <strong>Transit</strong>successfully introduced day passes <strong>to</strong> replace system transfers.<strong>Tri</strong> <strong>Delta</strong> <strong>Transit</strong> also participates in the BART Plus Ticket program incooperation with BART and eight other Bay Area transit systems. TheBART Plus Ticket allows transit cus<strong>to</strong>mers <strong>to</strong> use BART and connectinglocal buses at participating agencies without paying bus fares directlyor using a transfer. The BART Plus Ticket is not accepted on <strong>Tri</strong> <strong>Delta</strong><strong>Transit</strong>’s DX routes or the 49ers service.The current Dial-a-Ride cash fare is $2.00 per one-way passenger tripbetween locations within the ADA service area. Service <strong>to</strong> and fromlocations in the Non-ADA service area are $4.00 per one-waypassenger trip. Personal care attendants (PCA) can ride free andcompanions are charged the full fare. There are no discounted Dial-aRide fares. Ten ticket booklets priced at $20.00 each are available forpassenger convenience.Revenue Vehicle FleetECCTA owns a <strong>to</strong>tal of 91 revenue vehicles and has procured twosuitable vans for the Antioch Senior Bus program. Most of the fixedroute fleet is comprised of 45 Gillig Phan<strong>to</strong>m standard high-floor, 40’heavy-duty transit buses manufactured between 1995 and 2001. Theremaining fixed route vehicles include 2 Gillig 30’ low-floor buses; 10MCI over-the-road coaches, 9 ABI small buses acquired from theColumbus Ohio <strong>Transit</strong> Authority in 2004, and 3 vintage rubber-tiredimitation “trolleys.” As of June 30, <strong>2007</strong> average fleet age is 7.0 years.Most fixed route vehicles have a 12-year useful life, except the MCIswhich are assigned a 16-year life and the low-floors and the trolleyswhich are assigned a 10-year useful life according <strong>to</strong> FTA standards.The paratransit fleet consists of 18 small, light-duty body-on-chassisbuses, 4 specialized med-vans and two 2 cutaway vans owned by theCity of Antioch and operated by the Antioch Senior Center. Twenty ofthe ECCTA paratransit fleet, including two supervisor vans, werereplaced in <strong>2007</strong> and have an average age of only one year.Table 1.7 summarizes the current ECCTA fleet roster.19
Table 1.6 <strong>Tri</strong> <strong>Delta</strong> <strong>Transit</strong> Fare Structure—Effective July <strong>2007</strong>Local Route FaresSingle ride, no transfers (general public age 6 years <strong>to</strong> 64) $1.25Single ride, no transfers (Seniors 65+/Passengers with disabilities) $0.50Day Pass - Unlimited rides and transfers all day (general public age 6-64) $2.25Day Pass - Unlimited rides and transfers all day (Seniors*/Passengers withdisabilities)$1.00Children 5 and under (with paying cus<strong>to</strong>mer) $0.00Bart Transfer (general public age 6-64) $0.75Bart Transfer (Seniors 65+/Passengers with disabilities) $0.25*<strong>to</strong> receive a reduced fare, a passenger is required <strong>to</strong> show one of the following: drivers license,Regional <strong>Transit</strong> Discount Card, or Medicare cardDiscount PassesMonthly Pass - Unlimited rides on all <strong>Tri</strong> <strong>Delta</strong> <strong>Transit</strong> fixed route buses for an$40.00entire month (general public age 6-64):Fixed Route Punch Pass (general public age 6-64) - 20 single rides $22.00Fixed Route Punch Pass Senior Citizens and Passengers with Disabilities - 20$10.00ride passFixed Route Commuter Punch Pass - 20 single rides, ten at full fare ($1.25)$18.00and ten BART transfersBrentwood Dimes-a-RidePunch Pass All passengers - 20 ride punch pass $4.0049ers Express Shuttle FaresGeneral Public (age 16+) advanced purchase $10.00General Public (age 16+) if purchased on bus on game day $12.00Youth 6-15 $5.00Kids 5 and under** $0.00Season Pass (general public age 16+) $80.00Season Pass (youth age 6-15) $50.00*when accompanied by fare paying adult. One free kid fare per paying adult.<strong>Delta</strong> Express FaresMartinez <strong>Delta</strong> Express One way ticket $1.50Martinez <strong>Delta</strong> Express Monthly Pass $55.00Dublin/Pleasan<strong>to</strong>n BART <strong>Delta</strong> Express & LLNL/Sandia Lab <strong>Delta</strong> Express Oneway ticket$5.00Dublin/Pleasan<strong>to</strong>n BART <strong>Delta</strong> Express 20 ride Punch Pass $65.00Dublin/Pleasan<strong>to</strong>n BART <strong>Delta</strong> Express Monthly Pass $110.00LLNL/Sandia Lab <strong>Delta</strong> Express 20 ride Punch Pass $65.00LLNL/Sandia Lab <strong>Delta</strong> Express Monthly Pass $110.00Dial-a-Ride Fares and PassesOne-way trip starting and ending in <strong>Tri</strong> <strong>Delta</strong> <strong>Transit</strong>’s ADA service area $2.00One-way trip starting and/or ending outside <strong>Tri</strong> <strong>Delta</strong> <strong>Transit</strong>’s ADA servicearea (e.g., Central Contra Costa County)$4.00Dial-a-Ride Coupon Book Ten $2.00 coupons $20.0020
ModelYearNumberFixed RouteTable 1.7 Roster of Active Revenue Vehicles—June <strong>2007</strong>Make/ModelSeats(WCs)UsefulLifeReplacementFunding Year1995 6 Gillig Phan<strong>to</strong>m 40-foot 44 (2) 12 <strong>2007</strong>1997 12 Gillig Phan<strong>to</strong>m 40-foot 44 (2) 12 20091998 7 Gillig Phan<strong>to</strong>m 40-foot 44 (2) 12 20101999 2 Gillig Low-Floor 30-foot 27 (2) 12 20112000 6 MCI Series E 45-foot 56 (2) 16 20162001 20 Gillig Phan<strong>to</strong>m 40-foot 44 (2) 12 20132001 3 Classic Cable Car Vintage Trolley 29 (2) 10 20132001 9 ABI Model TSV 30-foot 23 (2) 10 20112002 4 MCI Series D 45-foot 56 (2) 16 201869 Sub<strong>to</strong>talParatransit2006 18 Ford Aerotech 16 (5) 5 20122002 2 Chevrolet Venture 3 (1) 4 2006<strong>2007</strong> 2 Chevrolet Uplander 3 (1) 4 201222 Sub<strong>to</strong>tal – ECCTA-operated1999 1 Goshen GC2 16 (4) 5 20042004 1 Ford 16 (4) 5 20092 Sub<strong>to</strong>tal – Antioch Senior Center owned & operated93 GRAND TOTALFacilitiesECCTA opened a consolidated facility <strong>to</strong> house administrative,maintenance and contract operations functions in 1987. Located at 801Wilbur Avenue in northeast Antioch, the facility includes a dispatchcenter, “gilley” (driver) room and locker area, a fully equippedmaintenance shop, outdoor service lanes, a fenced vehicle s<strong>to</strong>ragearea, and administrative offices housing both ECCTA and contrac<strong>to</strong>rpersonnel. This facility was expanded in February 2004 and additionalbus parking was occupied across Minaker Drive from the facility in July2004.<strong>Tri</strong> <strong>Delta</strong> <strong>Transit</strong> owns more than 30 and maintains a maximum of 75standard passenger shelters located at the busiest bus s<strong>to</strong>psthroughout the service area.ECCTA currently does not own nor maintain off-street passengerfacilities. However, <strong>Tri</strong> <strong>Delta</strong> <strong>Transit</strong> buses utilize a large bus transfercenter at the Pittsburg/Bay Point BART station and three park-ride lots.The first park & ride lot is located in Pittsburg on the north side of BlissAvenue between Railroad Avenue and Harbor Street south of Highway4. The facility contains approximately 100 parking spaces and an offstreetbus s<strong>to</strong>p equipped with standard shelters and benches.21
The second BART owned lot is located in Antioch near the site of aproposed eBART station, on the east side of Hillcrest Avenue betweenSunset Drive and Highway 4. This facility contains approximately 200parking spaces in a fenced lot. Bus s<strong>to</strong>ps with passenger shelters arelocated in the eastbound curb lane of Sunset Drive adjacent <strong>to</strong> theparking lot. The Hillcrest lot is the second most active origin anddestination point in the <strong>Tri</strong> <strong>Delta</strong> <strong>Transit</strong> system and needs majorenhancements <strong>to</strong> match the current level of service.The 80-space Brentwood park and ride lot is located on the east side ofWalnut Boulevard opposite Dainty Avenue on the west side ofdown<strong>to</strong>wn. The facility includes an off-street bus s<strong>to</strong>p equipped withstandard passenger shelters and bench seating.As previously mentioned, the main hub of <strong>Tri</strong> <strong>Delta</strong> <strong>Transit</strong> operationsis the large multi-space bus transfer facility at the Pittsburg-Bay PointBART station. <strong>Tri</strong> <strong>Delta</strong> provides nearly 200 bus arrivals and departuresdaily at this location, serving 15 <strong>to</strong> 20 percent of the <strong>to</strong>talPittsburg/Bay Point BART station entries and exits.22
Goals, Objectives & StandardsBackgroundRealistic goals and practical objectives and service standards are keyelements of an SRTP, serving as a foundation for development ofservice strategies and delivery of transit service. <strong>Transit</strong> is a means <strong>to</strong>an end. <strong>Transit</strong> serves the travel needs of persons withoutau<strong>to</strong>mobiles, helps control congestion, and addresses many othercommunity goals such as equity, improving the environment, economicdevelopment, and improved land use. Objectives and policy statementssupporting goals should be achievable and supported by realisticservice standards providing measurable benchmarks of transit systemperformance.According <strong>to</strong> the 2000 U.S. Census, more than 90% of households inthe <strong>Tri</strong> <strong>Delta</strong> <strong>Transit</strong>/ECCTA service area have access <strong>to</strong> a mo<strong>to</strong>rvehicle, and only about five percent of commuters used transit.Attracting choice transit users in a dispersed, suburban and partiallyrural low-density environment such as East Contra Costa County is avery difficult task. Public transit generally is most successful where tripdestinations and travel patterns are concentrated, and transit can offerfrequent services and travel times competitive with driving.Even with the Bay Area’s severe congestion problem, it is very difficultboth operationally and economically <strong>to</strong> provide a transit alternativethat meets these criteria, particularly in widely dispersed communitiessuch as East Contra Costa County. As a result, <strong>Tri</strong> <strong>Delta</strong> <strong>Transit</strong>’sprimary existing patronage is comprised of “transit dependent”persons. That is, the system primarily serves those who don’t ownmo<strong>to</strong>r vehicles or live in a household with a vehicle, but lack reliableregular access. These markets include seniors, persons withdisabilities, youth, and low-income persons.ECCTA has made effective use of performance indica<strong>to</strong>rs andstandards, both in its internal evaluation process and incorporatingmeaningful measures in its operating contracts. Accordingly, thischapter emphasizes improving adopted performance measures, basedon actual operational and financial performance, as well asincorporating the perceptions and expectations of bus riders and thegeneral public. Measuring transit system performance has fourelements:• Goals are broad statements of purpose that are grounded in thebasic values and aims of the community as reflected by theECCTA Board of Direc<strong>to</strong>rs through an organizational missionstatement. Goals are usually achieved over several years. Oftengoals are not quantifiable, but are needed <strong>to</strong> validate that thetransit program is meeting the need for which it was originallyintended.23CHAPTER2
• Objectives are specific statements that describe the desiredresults of pursuing stated goals, and are the means by whichgoal attainment is measured. Objectives should be measurableover time, and subject <strong>to</strong> periodic adjustment in response <strong>to</strong>actual results.• Measures are the quantifiable criteria through which attainmen<strong>to</strong>f objectives is determined. Selected performance measures areusually calculated and moni<strong>to</strong>red on a monthly basis.• Standards are thresholds that measure how an objective isbeing met. Standards are usually quantitative (e.g., 20passengers per revenue hour) or sometimes qualitative (e.g.,minimizing chargeable accidents).Mission Statement and GoalsECCTA is guided by the mission statement adopted by the ECCTABoard of Direc<strong>to</strong>rs in previous years. The mission statement is restatedin Table 2.1 below.Table 2.1 ECCTA Mission StatementNo. Statement1. To provide safe, reliable, friendly, high quality and economical transportationservice <strong>to</strong> the Eastern Contra Costa community;2. To provide an organizational environment that encourage cooperation, rewardsexcellence, and develops a team of highly motivated staff;3. To empower employees <strong>to</strong> function as owners of the Eastern Contra Costa<strong>Transit</strong> Authority organization;4. To develop Eastern Contra Costa <strong>Transit</strong> Authority services and facilities <strong>to</strong>better serve the transit dependent community and capture a greater share ofthe commute market;5. To secure and manage funds <strong>to</strong> maintain and expand transit service and <strong>to</strong>operate Eastern Contra Costa <strong>Transit</strong> Authority according <strong>to</strong> fiscally soundbusiness practices;6. To take a leadership role in developing a coherent transportation policy <strong>to</strong> dealwith problems of traffic congestion, air quality, and growth management;7. And <strong>to</strong> build constituencies at all levels of government that support the EasternContra Costa <strong>Transit</strong> Authority and its programs.ECCTA’s goals that support the adopted Mission Statement aresummarized below:I. Provide safe, reliable and high quality public transportation <strong>to</strong>ECCTA service area residents.II. Provide efficient public transportation <strong>to</strong> the residents of theECCTA service area.III. Provide an accessible public transportation system <strong>to</strong> theresidents of the ECCTA service area.Adopted objectives, performance indica<strong>to</strong>rs and standards aresummarized in Table 2.2. These measures serve as the framework ofChapter Three’s evaluation of operational and financial performance.24
Table 2.2 Summary of ECCTA Objectives, Measures, and StandardsObjective Measure StandardI.A. Safe <strong>Transit</strong> Miles between preventable accidents Average 50,000-70,000 milesCHP Safety Compliance ReportRVM* between road callsPreventative Main. Inspections (PMI)Contrac<strong>to</strong>r accident & loss reportingSatisfac<strong>to</strong>ry rating annuallyAverage 4,000-7,000 milesPMIs within 500 miles of scheduledNext day verbal report by 9:00 a.m.Written report within 5 working daysI.B. Reliable <strong>Transit</strong> Fixed route schedule adherence–late 90%+ within 5 minutes of schedule1.C.High-Quality<strong>Transit</strong>Fixed route schedule adherence-earlyFixed route-missed tripsDial-A-Ride – pick-up time deviationsDial-A-Ride – earlyDial-A-Ride – denialsClean BusesUniformed Opera<strong>to</strong>rsRoad SupervisorsAir-Conditioned BusesCus<strong>to</strong>mer ComplaintsTelephone response timeAverage abandoned call timeTelephone reliability – lost callsNo trip ahead of published scheduleLess than 1% of scheduled trips90% of pickups within 15 minutes ofthe time promised <strong>to</strong> ridersNo pickups more than 30 minutes ofthe time promised <strong>to</strong> ridersLess than 4% of non-ADA trips.No denials of trips for ADA passengersDaily-every bus washed and cleanedWeekly-every bus detailedMonthly-every bus “super cleaned”100% compliance contract dress codeAt least one road supervisor <strong>to</strong> be onduty at all times.100% of revenue vehicles in servicewith functioning air conditioning whentemperature is above 80 degrees.
This page is intentionally blank.26
CHAPTER3System & Service EvaluationThis chapter summarizes recent <strong>Tri</strong> <strong>Delta</strong> <strong>Transit</strong> operating andfinancial trends, presents the results of onboard surveys completed in2006 and <strong>2007</strong>, and evaluates these results in terms of systemstrengths and weaknesses, opportunities and constraints in reference<strong>to</strong> <strong>Tri</strong> <strong>Delta</strong> <strong>Transit</strong>’s key objectives and the primary transit marketsthat the system serves.Fixed Route TrendsTable 3.1 summarizes overall <strong>Tri</strong> <strong>Delta</strong> <strong>Transit</strong> fixed route operatingtrends from <strong>FY</strong> 1994-95 through <strong>FY</strong> 2006-07.<strong>Tri</strong> <strong>Delta</strong> <strong>Transit</strong> ridership has steadily increased during the pastdecade, growing rapidly after the opening of the Pittsburg/Bay PointBART station at the end of 1996. Within three years (<strong>FY</strong> 2000-01), <strong>Tri</strong><strong>Delta</strong> <strong>Transit</strong> patronage more than doubled <strong>to</strong> almost 2.1 millionpassengers in part due <strong>to</strong> the assumption of service for the BARTExpress program by ECCTA. Patronage growth leveled off as the BayArea economy slowed and overall employment stagnated after 2001.<strong>Tri</strong> <strong>Delta</strong> <strong>Transit</strong> service levels have ranged from 148,000 <strong>to</strong> 161,000annual service hours between <strong>FY</strong> 2002 and <strong>FY</strong> <strong>2007</strong>. Ridership hasleveled off at 2.2 <strong>to</strong> 2.3 million riders annually through <strong>FY</strong> 2005, withslight increases <strong>to</strong> 2.4 million in <strong>FY</strong> 2006 and <strong>to</strong> 2.5 million during <strong>FY</strong><strong>2007</strong>. Modest declines in local route ridership were generally offset byincreases in express route patronage. <strong>Delta</strong> Express commute service<strong>to</strong> Livermore began during <strong>FY</strong> 2001, and <strong>to</strong> Dublin in <strong>FY</strong> 2002.Table 3.1 Fixed Route Operating Trends3,000,0002,500,0002,000,0001,500,0001,000,000500,00001994-951995-961996-971997-981998-991999-002000-012001-022002-032003-042004-052005-062006-07Total Boardings27
Figure 3.1 Total Boardings, <strong>FY</strong> 1994-95 <strong>to</strong> <strong>FY</strong> 2006-07FiscalYearTotalBoardingsRevenueVehicleHours(RVH)OperatingExpenseOperatingRevenuesNet SubsidyBoardingsPer RVHFareboxCostPercentOperatingExpensePer RVHRate ofOperating SubsidyCost PerIncrease Pass.1995 778,437 40,775 $2,445,944 $416,060 ($2,029,884) 19.1 17.0% $59.99 -- ($2.61)ChangePercent1996 913,576 58,082 $2,970,354 $503,553 ($2,466,801) 15.7 17.0% $51.14 -14.7% ($2.70) 3.5%1997 1,095,163 65,786 $3,661,652 $593,605 ($3,068,047) 16.6 16.2% $55.66 8.8% ($2.80) 3.8%1998 1,768,883 108,427 $5,396,058 $959,117 ($4,436,941) 16.3 17.8% $49.77 -10.6% ($2.51) -10.5%1999 1,940,345 113,559 $5,769,434 $1,113,283 ($4,656,151) 17.1 19.3% $50.81 2.1% ($2.40) -4.3%2000 2,063,708 122,970 $6,409,709 $1,278,921 ($5,130,788) 16.8 20.0% $52.12 2.6% ($2.49) 3.6%2001 2,231,073 129,000 $7,449,000 $1,401,000 ($6,048,000) 17.3 18.8% $57.74 10.8% ($2.71) 9.0%2002 2,258,400 153,649 $8,985,000 $1,429,000 ($7,556,000) 14.7 15.9% $58.48 1.3% ($3.35) 23.4%2003 2,224,859 148,333 $9,790,028 $1,724,000 ($8,066,028) 15.0 17.6% $66.00 12.9% ($3.63) 8.4%2004 2,258,331 157,371 $10,272,051 $1,886,175 ($8,385,876) 14.4 18.4% $65.27 -1.1% ($3.71) 2.4%2005 2,319,606 159,125 $11,585,902 $1,884,848 ($9,701,054) 14.6 16.3% $72.81 11.5% ($4.18) 12.6%2006 2,441,212 160,776 $12,297,424 $1,930,543 ($10,366,881) 15.2 15.7% $76.49 5.1% ($4.25) 1.5%<strong>2007</strong> 2,500,930 160,909 $14,255,957 $2,250,068 ($12,005,820) 15.5 15.8% $88.60 13.1% ($4.68) 10.2%Total <strong>Tri</strong> <strong>Delta</strong> <strong>Transit</strong> fixed route patronage increased by 11%between <strong>FY</strong> 2004 and <strong>2007</strong>, as summarized in Table 3.2. Patronage onexpress routes grew 29% during this three-year period, followedclosely by 27% growth on weekend routes. In contrast, local <strong>Tri</strong> <strong>Delta</strong><strong>Transit</strong> patronage grew 6.3% while overall service remained about thesame.Patronage grew most dramatically on express Route 300, increasingfrom 206,487 boardings in <strong>FY</strong> 2003-04 <strong>to</strong> 269,851 during <strong>FY</strong> 2006-07,in response <strong>to</strong> peak period headways increasing from every 20 <strong>to</strong>every 15 minutes at selected times. During the same time, patronageon the <strong>Delta</strong> Express route <strong>to</strong> Dublin BART nearly tripled. During thistime, <strong>to</strong>tal express service levels only increased 2% from 31,209revenue vehicle hours (RVH) during <strong>FY</strong> 2003-04 <strong>to</strong> 31,930 RVH in <strong>FY</strong>2006-07. Service provision by Route 300 actually declined slightly,while service on the two <strong>Delta</strong> Express routes increased a <strong>to</strong>tal of 475RVH or 17%. Due <strong>to</strong> budget constraints, <strong>Tri</strong> <strong>Delta</strong> <strong>Transit</strong> has anunofficial policy of reducing non-productive service and shiftingresources <strong>to</strong> more promising routes while maintaining the same <strong>to</strong>talservice level.Local patronage increased the most in Southeast Antioch, Brentwood,Discovery Bay and Oakley through the introduction of local circula<strong>to</strong>rRoutes 384, 385, and 386. Collectively these routes carried about82,000 boardings, accounting for the majority of local patronagegrowth between <strong>FY</strong> 2003-04 and <strong>FY</strong> 2006-07. Ridership on local routeswas static in other parts of the service area, e.g., Bay Point, Pittsburgand older portions of Antioch.28
DestinationsTotalBoardingsTotalRVHExpress Routes (all routes operate weekdays only)Table 3.2 Patronage and Service Levels, <strong>FY</strong> 2003-04 and <strong>FY</strong> 2006-07<strong>FY</strong> 2003-04 <strong>FY</strong> 2006-07AveragePass/ DailyRVH Days RidersTotalBoardingsTotalRVHAveragePass/ DailyRVH Days RidersDX Pittsburg-Antioch <strong>to</strong> Martinez 0 0 0.0 254 0 0 0 0.0 253 0DX-1 <strong>Delta</strong> Express Livermore /Sandia Lab 17,616 1,460 12.1 254 69 14,978 1,558 9.6 253 59DX-2 <strong>Delta</strong> Express Dublin BART 4,003 1,367 2.9 254 16 11,544 1,744 6.6 253 46200 Martinez/Antioch 40,714 6,411 6.4 254 160 47,976 6,613 7.3 253 190300 BART - Brentwood Park & Ride 206,487 21,098 9.8 254 813 269,851 20,765 13.0 253 1,067Shuttles (49ers, Special Functions) 16,862 873 19.3 8 2,108 19,085 1,250 15.3 8 2,917Sub<strong>to</strong>tal 285,682 31,209 9.2 254 1,125 363,434 31,930 11.4 253 1,436Local Routes, Weekday70 Pittsburg – Marina <strong>to</strong> Buchanan Loop 23,283 2,513 9.3 254 92 14,916 1,929 7.7 253 59201 Pittsburg BART - Concord BART 0 0 0.0 254 0 0 0 0.0 253 0BDR Brentwood Dimes-A-Ride 67,448 6,597 10.2 254 266 34,843 2,766 12.6 253 138380 BART – Antioch 594,127 32,404 18.3 254 2,339 622,027 33,456 18.6 253 2,459383 Antioch (Hillcrest) Park & Ride - Oakley 44,894 4,684 9.6 254 177 53,015 4,083 13.0 253 210384 Antioch-Brentwood (via Deer Valley) 0 0 0.0 254 0 46,981 7,614 6.2 253 186385 Antioch-Brentwood (via Hillcrest) 0 0 0.0 254 0 29,225 3,107 9.4 253 116386 Brentwood - Discovery Bay – Byron 0 0 0.0 254 0 5,721 1,201 4.8 253 23387 BART – Antioch 221,217 12,010 18.4 254 871 229,406 10,062 22.8 253 907388 BART - Antioch Park & Ride (Hillcrest) 316,422 23,625 13.4 254 1,246 306,691 20,007 15.3 253 1,212389 BART – Bay Point 144,010 7,716 18.7 254 567 144,385 6,068 23.8 253 571390 BART - Antioch P & R (Hillcrest) PEAK 64,796 4,917 13.2 254 255 63,767 4,713 13.5 253 252391 BART - Brentwood Park & Ride 305,474 19,359 15.8 254 1,203 344,289 19,200 17.9 253 1,361Sub<strong>to</strong>tal 1,781,671 113,825 15.7 254 7,014 1,895,266 114,206 16.6 253 7,491Sub<strong>to</strong>tal, M-F Express & Local 2,067,353 145,034 14.3 254 8,139 2,258,700 146,136 16.1 253 8,927SaturdaysBDR Brentwood Dimes-A-Ride 1,360 362 3.8 52 26 0 0 0.0 53 0392 BART - Antioch Park & Ride (Hillcrest) 72,361 4,216 17.2 52 1,392 58,408 3,361 17.4 53 1,102393 Bay Point - Brentwood Park & Ride 40,839 1,565 26.1 52 785 61,379 3,229 19.0 53 1,158394 BART - Antioch Park & Ride (Hillcrest) 0 0 0.0 52 0 9,831 598 16.4 53 185Sub<strong>to</strong>tal 114,560 6,143 18.6 52 2,203 129,618 7,188 18.0 53 2,446Sundays/Major Holidays392 BART - Antioch Park & Ride (Hillcrest) 53,938 4,431 12.2 59 914 53,768 3,368 16.0 59 911393 Bay Point - Brentwood Park & Ride 22,167 1,666 13.3 59 376 51,342 3,528 14.6 59 870394 BART - Antioch Park & Ride (Hillcrest) 0 0 0.0 59 0 7,502 689 10.9 59 127Sub<strong>to</strong>tal 76,105 6,097 12.5 59 1,290 112,612 7,585 14.8 59 1,909GRAND TOTAL, Fixed Routes 2,258,018 157,274 14.4 365 2,500,930 160,909 15.5 365Overall productivity following the opening of the Pittsburg/Bay PointBART station peaked in <strong>FY</strong> 2000-01 at 17.3 passengers/RVH. Since2002, <strong>Tri</strong> <strong>Delta</strong> <strong>Transit</strong> productivity has ranged between 14.5 and 15.5passengers/RVH, with a modest trend <strong>to</strong>wards express routes as alarger proportion of overall patronage. While this gradual shift hasreduced overall productivity due <strong>to</strong> increased mileage and revenuehours incurred by express routes, in the past three years, overallaverage trip length has been increasing back <strong>to</strong> the levels of <strong>FY</strong>’s 2000<strong>to</strong> 2002 after declining <strong>to</strong> about 6.0 passenger miles per RVH, assummarized in Table 3.3.29
FiscalYearTable 3.3 Fixed Route Average Occupancy, <strong>FY</strong> 1995-<strong>FY</strong> <strong>2007</strong>PassengerMilesRevenueVehicle MilesAverageLoadTotalBoardingsAverage<strong>Tri</strong>p, mi.1997 5,131,696 624,387 8.2 1,095,163 4.71998 7,344,973 1,464,360 5.0 1,768,883 4.21999 11,806,561 1,506,282 7.8 1,940,345 6.12000 12,448,217 1,704,245 7.3 2,063,708 6.02001 13,550,839 1,765,722 7.7 2,231,073 6.12002 13,618,152 2,041,989 6.7 2,258,400 6.02003 13,415,900 2,082,169 6.4 2,224,859 6.02004 13,617,736 2,252,311 6.0 2,258,331 6.02005 15,657,361 2,251,495 7.4 2,319,606 6.82006 16,478,181 2,391,900 6.9 2,441,212 6.8<strong>2007</strong> 17,006,324 2,460,562 6.9 2,500,930 6.8Average trip length for the system has been in the range of 6.0 <strong>to</strong> 6.8miles per passenger, also summarized in Table 3.2.Operating revenues and expenses followed trajec<strong>to</strong>ries similar <strong>to</strong>patronage and overall service levels, expanding dramatically in yearsimmediately following <strong>Tri</strong> <strong>Delta</strong> <strong>Transit</strong>’s assumption of BART expressbus services, and leveling off after the turn of the century. From <strong>FY</strong>2001-02 <strong>to</strong> <strong>FY</strong> 2006-07, operating expenses increased about 55% inabsolute dollars while service levels increased 4.7%, resulting in a uni<strong>to</strong>perating cost increase of 48%. This reflects the many kinds of costincreases generally out of the control of transit opera<strong>to</strong>rs including fueland other energy prices, as well as employee benefits (especiallyhealth care), increasing materials and supply prices.Figure 3.2 Operating Expense and Revenue Trends$16,000,000$14,000,000$12,000,000$10,000,000$8,000,000$6,000,000$4,000,000$2,000,000$01994-951995-961996-971997-981998-991999-002000-012001-022002-032003-042004-052005-062006-07RevenuesExpenses30
In <strong>FY</strong> 2002-03, increases in unit operating expenses reflected fuel priceand health care inflation at that time, then moderating the followingyear. In contrast, fuel, health care, and other material expensesresumed their strong upward trend in <strong>FY</strong>’s 2004-05, 2005-06, and2006-07.Operating revenues have consistently grown faster than patronagesince the turn of the century. Average fare per passenger was $0.62 in<strong>FY</strong> 1999-2000 and $0.89 during <strong>FY</strong> 2006-07. This included purchase oftransit passes by the County of Contra Costs for Route 200 and otheruser-side subsidies. Fares were also increased during <strong>FY</strong> 2006-07,which contributed <strong>to</strong> revenue growth. Overall fare revenue growthlagged the operating expense rate of increase, with <strong>Tri</strong> <strong>Delta</strong> <strong>Transit</strong>’sfarebox recovery ratio declining from 20% during <strong>FY</strong> 1999-2000 <strong>to</strong> alow of 15.7% in <strong>FY</strong> 2005-06, and stabilizing at 16.0% during <strong>FY</strong> 2006-07.Overall subsidy per passenger was $2.49 during <strong>FY</strong> 1999-2000,increasing <strong>to</strong> $4.68 in <strong>FY</strong> 2006-07, up 88% in eight years. During thistime as previously mentioned, the cost fac<strong>to</strong>rs contributing <strong>to</strong> transi<strong>to</strong>perating expenses increased 48%, while the official inflation ratereflected in the government’s Consumer Price Index (CPI) increased byabout 16%-17%. If inflation had been calculated by the methods usedbefore 1993, the CPI would have increased close <strong>to</strong> the rate actuallyexperienced by <strong>Tri</strong> <strong>Delta</strong> <strong>Transit</strong> (see http://www.shadowstats.com forone private sec<strong>to</strong>r analyst’s discussion of this issue).Figure 3.3 Farebox/Operating Revenue Cost Recovery Trends25.0%20.0%15.0%10.0%5.0%0.0%1994-951995-961996-971997-981998-991999-002000-012001-022002-032003-042004-052005-062006-07Cost Recovery Ratio31
Figure 3.4 Subsidy Per Passenger Trends$5.00$4.50$4.00$3.50$3.00$2.50$2.00$1.50$1.00$0.50$0.001994-951995-961996-971997-981998-991999-002000-012001-022002-032003-042004-052005-062006-07Subsidy Per Passenger<strong>Tri</strong> <strong>Delta</strong> <strong>Transit</strong> introduced an all-day pass fare instrument effectiveJanuary <strong>2007</strong>, replacing the previous system of bus-<strong>to</strong>-bus transferswhile retaining the BART <strong>to</strong> bus transfer. See Table 3.4 whichsummarizes <strong>to</strong>tal usage of each fare instrument (not revenues). Thisresulted in a 20.6% reduction in the use of adult cash fares, and a26.0% decline in senior/disabled cash fare instrument use. FromJanuary <strong>to</strong> June <strong>2007</strong>, almost 300,000 riders used the day pass, anddramatic jumps in usage of prepaid punch passes which increased from118% <strong>to</strong> 157%. Use of BART <strong>to</strong> bus transfers increased 56% whilebus-<strong>to</strong>-bus transfer usage declined 30%. Transfers from BART accountfor 8.5% of <strong>to</strong>tal boardings; this implies <strong>to</strong>tal bus ridership <strong>to</strong> and fromBART is approximately 20% of daily <strong>Tri</strong> <strong>Delta</strong> <strong>Transit</strong> patronage.Table 3.4 Passengers by Type Fare Paid, <strong>FY</strong> 2003-04 vs. <strong>FY</strong> 2006-07<strong>FY</strong> 2003-04 <strong>FY</strong> 2006-07PaymentType Fare TypeTotalPassengers PercentTotalPassengers PercentChange inProportionCash Adult 1,190,032 52.7% 1,045,740 41.8% -20.6%Full Fare Day Pass 0 0.0% 141,659 5.7% n/aSenior/Disabled 167,957 7.4% 137,627 5.5% -26.0%S/D Day pass 0 0.0% 27,731 1.1% n/aBART Transfer 123,479 5.5% 213,366 8.5% 56.0%Special 271,169 12.0% 23,335 0.9% -92.2%Sub<strong>to</strong>tal 1,752,637 77.6% 1,589,458 63.6% -18.1%Prepaid Adult Punch 192,330 8.5% 465,140 18.6% 118.4%S/D Punch 26,323 1.2% 75,037 3.0% 157.4%Sub<strong>to</strong>tal 218,653 9.7% 540,177 21.6% 123.1%Zero Fare 72,012 3.2% 205,148 8.2% 157.2%Bus Transfer 215,029 9.5% 166,147 6.6% -30.2%Sub<strong>to</strong>tal 287,041 12.7% 371,295 14.8% 16.8%TOTAL 2,258,331 100.0% 2,500,930 100.0% 0.0%32
Individual Fixed Route PerformancePerformance by individual fixed route for <strong>FY</strong> 2003-04 is summarized inTable 3.5; <strong>FY</strong> 2006-07 is summarized in Table 3.6.Figure 3.5 below compares the average productivity in boardings(passengers) per revenue vehicle hour (RVH for <strong>Tri</strong> <strong>Delta</strong> <strong>Transit</strong>routes for both <strong>FY</strong> 2003-04 and 2006-07. In <strong>FY</strong> 2003-04, systemproductivity averaged 14.4 boardings/RVH and 15.5 boardings/RVH in<strong>FY</strong> 2006-07. Route 300 was the best performing express route witharound 13 boardings/RVH in <strong>FY</strong> 2006-07; Route 200 <strong>to</strong> Martinezaveraged about 7.3 boardings/RVH, a slight improvement from <strong>FY</strong>2003-04. DX-1 and DX-2 averaged 9.6 and 6.6 boardings/RVH,respectively. Special shuttles and 49er shuttles also had relatively goodperformance. No service was provided on the new <strong>Delta</strong> Express route<strong>to</strong> Martinez and Route 201, the latter which began August 26, <strong>2007</strong>during <strong>FY</strong> <strong>2007</strong>-08.All local routes except Route 70 and Saturday Route 393 improvedtheir performance in <strong>FY</strong> 2006-07 compared <strong>to</strong> <strong>FY</strong> 2003-04. As a result,service on Route 70 was reduced somewhat, and Saturday service onthe Brentwood Dimes-A-Ride was discontinued completely due <strong>to</strong> lowproductivity.Since <strong>FY</strong> 2003-04, <strong>Tri</strong> <strong>Delta</strong> <strong>Transit</strong> began operation of four newroutes, 384, 385, and 386 on weekdays, and new route 394 onSaturdays and Sundays. Routes 384 and 385 are community shuttleroutes covering Southeast Antioch and Brentwood; Route 386 is a“lifeline” route connecting Discovery Bay and Brentwood. Given thesprawling low density, affluent suburban nature of this area and manyvacant parcels of land still <strong>to</strong> be developed, the relatively lowproductivity of Routes 384 and 385 (6.2 and 9.4 boardings/RVH,respectively) is <strong>to</strong> be expected. Patronage on both routes is expected<strong>to</strong> mature over the next few years as the area continues <strong>to</strong> developFigure 3.5 Route Productivity, <strong>FY</strong> 2003-04 and <strong>FY</strong> 2006-073025Boardings Per RVH20151050DXDX-1DX-2200300Shuttles7020133BDR380383384<strong>FY</strong> 2003-04 <strong>FY</strong> 2006-07385386387388389390391Sat-BDRSat-392Sat-393Sat-394Sun-392Sun-393Sun-394
and the many vacant parcels continue <strong>to</strong> be developed. The expectedopening of the Highway 4 bypass directly serving this area will alsoallow introduction of direct express bus service, a fac<strong>to</strong>r that mayincrease connecting patronage on these local routes if a reliable localtransfer point can be established.In contrast, Route 386 is a lifeline connec<strong>to</strong>r route between DiscoveryBay, an affluent exurban development, and Brentwood, a rapidlygrowing suburban city. Route productivity is low compared <strong>to</strong> the <strong>Tri</strong><strong>Delta</strong> <strong>Transit</strong> system average, but is comparable <strong>to</strong> many rural transitsystems and is significantly higher than the dial-a-ride system.Productivity is likely <strong>to</strong> increase as more planned development occursin the Discovery Bay area.Figure 3.6 summarizes the average cost recovery ratio from operatingrevenues (fares and other related revenues) for each <strong>Tri</strong> <strong>Delta</strong> <strong>Transit</strong>route in 2003-04 and <strong>FY</strong> 2006-07. The system average was 18.4%during <strong>FY</strong> 2003-04 and 15.8% in <strong>FY</strong> 2006-07. The 49’er football gamespecials covered more than all their expenses, while all other shuttleswere free. Neither productivity nor fares/other operating revenuesrecovery ratio is necessarily useful as a performance indica<strong>to</strong>r by itself.In contrast <strong>to</strong> their productivity performance, in <strong>FY</strong> 2006-07, RoutesDX-1 and DX-2 had the highest fare box cost recovery ratios of anyregular <strong>Tri</strong> <strong>Delta</strong> <strong>Transit</strong> routes, at 36.1% and 24.9%, respectively.Route 300 was the most productive express route, but had a fare boxcost recovery ratio (12.1%) below the system average. Route 300passengers pay the estimated average fare, but travel much fartherthan the overall <strong>Tri</strong> <strong>Delta</strong> <strong>Transit</strong> average trip length. Route 200 hadboth low productivity, as measured by boardings/RVH (7.3) and farebox cost recovery ratio (6.9%).Figure 3.6 Operating Revenue Cost Recovery Ratios <strong>FY</strong> 2006-0760.0%50.0%40.0%30.0%20.0%10.0%0.0%DXDX-1DX-2200300Shuttles70201BDR380383384385386387388389390391Sat-BDRSat-392Sat-393Sat-394Sun-392Sun-393Sun-394<strong>FY</strong> 2003-04 <strong>FY</strong> 2006-0736
The best performing local routes during in terms of operating revenues<strong>to</strong> cost ratio were: Route 389 (23.5%), Route 387 (22.5%), Route 380(18.4%), Route 391 (17.7%), and the Brentwood Dimes-A-Ride(14.6% including City of Brentwood fare subsidies of $0.80 per ride)and Route 388 (14.2%). Except for the Dimes-A-Ride route, theseoverall best performers are located in the older, more denselydeveloped portions of the <strong>Tri</strong> <strong>Delta</strong> <strong>Transit</strong> service area, e.g., BayPoint, Pittsburg and Antioch generally north of the Highway 4 freeway.These areas also have the highest density of transit dependence asshown by data from the Contra Costa County Low IncomeTransportation <strong>Plan</strong>.The next best performers were Route 390 (13.4%) and Route 383(12.8%). All other routes (70, 384, 385, 386) had operating revenuecost recovery ratios of less than 10%, matching their relatively lowproductivity in terms of boardings/RVH. As previously noted, Route 70provides a community shuttle within Pittsburg. Routes 384 <strong>to</strong> 386serve the newest, most affluent and least densely developed portion ofthe service area. Productivity and fare box cost recovery on theselatter routes should increase over time as vacant areas are developedand more people are served.Other Fixed Route Statistics & Performance Indica<strong>to</strong>rsTable 3.7 summarizes other operating statistics and performanceindica<strong>to</strong>rs for fixed route service.Most of these standards were met. In one case, Average Miles BetweenRoad calls, <strong>Tri</strong> <strong>Delta</strong> <strong>Transit</strong> greatly exceeded the standard adopted inthe previous <strong>Short</strong> <strong>Range</strong> <strong>Transit</strong> <strong>Plan</strong>.Table 3.7 Fixed Route Operating Statistics & Performance Indica<strong>to</strong>rsStatistic/ or MeasureValueMeetStandard?CommentNumber of Late Buses 2,028 -- Used <strong>to</strong> calculate performance measureNumber of Lift Passengers 25,334 -- Less expensive <strong>to</strong> carry on FR buses than DARNumber of Bicycles Carried 16,685 -- Bicycles carried on fixed route buses only.Preventable Accidents 41 -- Used <strong>to</strong> calculate performance measureCus<strong>to</strong>mer Complaint Calls Received 458 -- Used <strong>to</strong> calculate performance measureNumber of Mechanical Failures 71 -- Used <strong>to</strong> calculate performance measureNumber of Road Calls 46 -- Used <strong>to</strong> calculate performance measureFTA Road Calls – Other 31 -- Used <strong>to</strong> calculate performance measureTotal Road Calls 148 -- Used <strong>to</strong> calculate performance measureOn-Time Performance – Fixed Route 90.07% Yes Standard is 90%Miles Between Preventable Accidents 68,239 Yes Nearly meets high end of standard (70,000 miles)Percentage of Riders Complaining 0.018% Yes Measure changed from 2005 SRTPAverage Miles Between Road calls(based on RVM)16,625 Yes Previous SRTP standard exceeded by a widemargin; recommend increasing the standard.37
Dial-A-Ride (DAR)/Paratransit TrendsTable 3.8 summarizes overall <strong>Tri</strong> <strong>Delta</strong> <strong>Transit</strong> dial-a-ride(DAR)/paratransit operating trends from <strong>FY</strong> 1994-95 through <strong>FY</strong> 2005-07, including key operating statistics, e.g., <strong>to</strong>tal boardings (Figure3.7), revenue vehicle hours (RVH), operating expenses and revenues(Figure 3.8), and net subsidies. Key performance measures are alsosummarized, including boardings/RVH, operating expense per RVH,cost inflation from year <strong>to</strong> year, farebox cost recovery ratio (Figure3.9) subsidy per passenger (Figure 3.10), and year-<strong>to</strong>-year change insubsidy per passenger.Between <strong>FY</strong> 1995 and <strong>FY</strong> <strong>2007</strong>, <strong>to</strong>tal <strong>Tri</strong> <strong>Delta</strong> <strong>Transit</strong> paratransitboardings increased 75%, while <strong>to</strong>tal service provided (RVH) increased210%, and operating expenses increased 250% in unadjusted dollars.In contrast, fare revenues increased 401%, resulting in only modestnet growth in subsidy per passenger from $19.10 in <strong>FY</strong> 1994-95 <strong>to</strong>$22.86 during <strong>FY</strong> 2006-07. Fare box cost recovery grew from 6.2%during <strong>FY</strong> 1994-05 <strong>to</strong> 10.2% in <strong>FY</strong> 2006-07. This includes no allowancefor non-fare, operating revenues from contractual services provided.The Transportation Development Act (TDA) requires that a minimum of10% of paratransit operating expenses be recovered from fares, or acombination of fares and “local support.” Although <strong>Tri</strong> <strong>Delta</strong> <strong>Transit</strong>met this minimum if <strong>FY</strong>07, the difference between actual farescollected and the 10% requirement are waived due <strong>to</strong> an existing halfcentsales tax for transportation levied in Contra Costa County.FiscalYearTotalBoardingsTable 3.8 DAR Operating Trends, <strong>FY</strong> 1995-<strong>2007</strong>RevenueVehicleHours(RVH)OperatingExpenseOperatingRevenuesNet SubsidyBoardingsPerRVHFareboxCostRatioOperatingExpensePer RVHRate ofOperatingCostIncreaseSubsidyPerPassenger1995 60,996 19,583 $1,212,944 $48,149 ($1,164,795) 3.1 4.0% $61.94 -- ($19.10) --ChangePercent1996 83,994 25,550 $1,301,412 $59,958 ($1,241,454) 3.3 4.6% $50.94 -17.8% ($14.78) 22.6%1997 92,685 28,677 $1,300,437 $63,341 ($1,237,096) 3.2 4.9% $45.35 -11.0% ($13.35) -9.7%1998 110,105 27,676 $1,300,922 $72,375 ($1,228,547) 4.0 5.6% $47.01 3.7% ($11.16) -16.4%1999 93,928 31,565 $1,314,000 $64,000 ($1,250,000) 3.0 4.9% $41.63 -11.4% ($13.31) 19.3%2000 98,442 35,776 $1,382,000 $62,000 ($1,320,000) 2.8 4.5% $38.63 -7.2% ($13.41) 0.8%2001 105,000 36,946 $1,642,000 $83,000 ($1,559,000) 2.8 5.1% $44.44 15.1% ($14.85) 10.7%2002 84,294 30,433 $1,443,000 $74,000 ($1,369,000) 2.8 5.1% $47.42 6.7% ($16.24) 9.4%2003 80,185 33,109 $2,076,938 $123,289 ($1,953,649) 2.4 5.9% $62.73 32.3% ($24.36) 50.0%2004 99,909 36,829 $2,070,230 $128,576 ($1,941,654) 2.7 6.2% $56.21 -10.4% ($19.43) 20.2%2005 104,090 41,457 $2,403,331 $183,775 ($2,219,556) 2.5 7.6% $57.97 3.1% ($21.32) 9.7%2006 102,678 43,928 $2,518,750 $215,701 ($2,303,049) 2.3 8.6% $57.34 -1.1% ($22.43) 6.3%<strong>2007</strong> 106,850 41,749 $2,720,946 $278,102 ($2,442,844) 2.6 10.2% $65.17 13.7% ($22.86) 0.8%38
Figure 3.7 DAR Total Boardings, <strong>FY</strong> 1994-95 <strong>to</strong> <strong>FY</strong> 2006-07120,000100,00080,00060,00040,00020,00001994-951995-961996-971997-981998-991999-002000-012001-022002-032003-042004-052005-062006-07Figure 3.8 DAR Operating Expense and Revenue Trends$3,000,000$2,500,000$2,000,000$1,500,000$1,000,000$500,000$01994-951995-961996-971997-981998-991999-002000-012001-022002-032003-042004-052005-062006-07Operating RevenueOperating ExpenseBetween <strong>FY</strong> 2002 and <strong>FY</strong> <strong>2007</strong>, <strong>to</strong>tal dial-a-ride/paratransit boardingsincreased 26.7%, <strong>to</strong>tal RVH by 37%, and operating expenses by212%. Operating expenses/RVH increased 54%. This reflects many ofthe same cost increases as encountered for fixed route service that aregenerally out of the control of transit opera<strong>to</strong>rs. As with fixed routeservice, <strong>FY</strong>03 cost increases in unit operating expenses reflected fuelprice and health care benefits costs then moderated the following year.In contrast, fuel, health care, and other material expenses resumedtheir strong upward trend in <strong>FY</strong>’s 2004-05, 2005-06, and 2006-07.39
Figure 3.9 DAR Farebox Cost Recovery Trends12.0%10.0%8.0%6.0%4.0%2.0%0.0%1994-951995-961996-971997-981998-991999-002000-012001-022002-032003-042004-052005-062006-07Figure 3.10 DAR Subsidy Per Passenger Trends$30.00$25.00$20.00$15.00$10.00$5.00$0.001994-951995-961996-971997-981998-991999-002000-012001-022002-032003-042004-052005-062006-07Operating revenues have consistently grown much faster thanpatronage since the mid-1990’s. Average fare per passenger was$0.79 in <strong>FY</strong> 1994-95 and $2.60 during <strong>FY</strong> 2006-07. DAR fares wereincreased during <strong>FY</strong> 2004-05 in line with the fixed route/paratransitfare differentials allowed under the Americans With Disabilities Act,contributing <strong>to</strong> revenue growth.Dial-A-Ride subsidy per passenger was $19.10 during <strong>FY</strong> 1994-95,increasing <strong>to</strong> $22.86 in <strong>FY</strong> 2006-07, up by 20% in 13 years, well belowinflation. Fare box cost recovery grew from 4.0% <strong>to</strong> 10.2% over thesame time frame. This trend reflects below-inflation increases inoperating subsidy per passenger, and regular fare increases.40
Dial-A-Ride/Paratransit Trends by Type of ServicePerformance by individual dial-a-ride service for <strong>FY</strong> 2003-04 issummarized in Table 3.9, and for <strong>FY</strong> 2006-07 in Table 3.10. During <strong>FY</strong>2006-07 the most productive dial-a-ride/paratransit service was theAntioch Senior Bus with 6.3 boardings/RVH. The Antioch Senior Bushas relatively high productivity because it picks up regular passengersalmost on a fixed schedule. Antioch Senior Bus is more a “subscription”service than a pure demand responsive transit system.The second most productive service during <strong>FY</strong> 2006-07 was “RegularDial-A-Ride”, serving the broadest category of ridership withproductivity averaging 2.4 boardings/RVH. This service carried bothADA and non-ADA passengers on both weekdays and Saturdays. <strong>Tri</strong>plength averaged 6.0 miles per trip. “Express” Dial-A-Ride averaged 1.7boardings/RVH. This service has a reimbursable cost portion undercontract with BART and operates on Sundays, serving ADA passengersonly.<strong>Tri</strong> <strong>Delta</strong> <strong>Transit</strong>’s Medical Van service had the lowest productivity of1.2 boardings (passengers)/RVH. This is due <strong>to</strong> the single passenger,governmental requirements for this service and is offset by the muchhigher per passenger reimbursement rate that this service engenderscompared <strong>to</strong> the other paratransit services.Table 3.9 DAR Patronage/Service Level by Service, <strong>FY</strong> 2003-04TotalTotal RevenueBoardings HoursPass/RVHWeekday Days ofBoardings ServiceAverageDailyRidersRegular DAR 74,104 29,737 2.5 71,372 253 282Express DAR 3,141 1,962 1.6 84 253 0Medical Vans 1,243 1,163 1.1 1,013 253 4Antioch Senior Bus 21,421 3,967 5.4 21,421 253 85TOTAL, Demand Responsive 99,909 40,414 2.5 93,890 253 371SaturdayBoardingsDays ofServiceAverageDailyRidersSunday Days ofBoardings ServiceAverageDailyRidersRegular DAR 2,732 53 52 0 0 0Express DAR 1,080 53 20 1,977 59 34Medical Vans 222 53 4 8 59 0Antioch Senior Bus 0 0 0 0 0 0TOTAL, Demand Responsive 4,034 53 75 1,985 59 3441
Table 3.10 DAR Patronage/Service Level by Service, <strong>FY</strong> 2006-07TotalBoardingsTotalRevenueHoursPass/RVHWeekdayBoardingsDays ofServiceAverageDailyRidersRegular DAR 72,751 30,157 2.4 69,902 253 276Express DAR 4,562 2,705 1.7 3 253 0Medical Vans 6,280 5,201 1.2 5,149 253 20Antioch Senior Bus 23,257 3,685 6.3 23,257 253 92TOTAL, Demand Responsive 106,850 41,749 2.6 98,311 253 389SaturdayBoardingsDays ofServiceAverageDailyRidersSundayBoardingsDays ofServiceAverageDailyRidersRegular DAR 2,849 53 54 0 0 0Express DAR 1,723 53 33 2,836 59 48Medical Vans 1,060 53 20 71 59 1Antioch Senior Bus 0 0 0 0 0 0TOTAL, Demand Responsive 5,632 53 106 2,907 59 49Table 3.11 DAR Expense, Revenue & Farebox Recovery <strong>FY</strong> 2003-04TotalTotal Revenue Expense/Boardings Hours RVHTotal RouteExpenseExpense/PassengerAverageRevenue/Pass.AllocatedOperatingRevenuesECCTASubsidyPer Pass.FareboxPercentRegular DAR 74,104 29,737 $56.21 $1,671,517 $22.56 $1.26 $93,357 ($21.30) 5.6%Express DAR 3,141 1,962 $56.21 $110,284 $35.11 $1.26 $3,957 ($33.85) 3.6%Medical Vans 1,243 1,163 $56.21 $65,372 $52.59 $17.35 $31,261 ($35.24) 47.8%Antioch Senior Bus 21,421 3,967 $49.52 $196,461 $9.17 $0.00 $0 ( $9.17) 0.0%TOTAL, DAR 99,909 32,829 $56.21 $2,070,230 $20.72 $1.29 $128,576 ($19.43) 6.2%Table 3.12 DAR Expense, Revenue & Farebox Recovery <strong>FY</strong> 2006-07TotalTotal Revenue Expense/Boardings Hours RVHTotal RouteExpenseExpense/PassengerAverageRevenue/Pass.AllocatedOperatingRevenuesECCTASubsidyPer Pass.FareboxPercentRegular DAR 72,751 30,157 $65.17 $1,965,450 $27.02 $1.55 $113,070 ($25.46) 5.8%Express DAR 4,562 2,706 $65.17 $176,361 $38.66 $1.55 $7,090 ($37.10) 4.0%Medical Vans 6,280 5,201 $65.17 $338,949 $53.97 $17.35 $157,942 ($36.62) 46.6%Antioch Senior Bus 23,257 3,685 $70.42 $259,500 $11.16 $0.00 $0 ($11.16) 0.0%TOTAL, DAR 106,850 41,749 $65.17 $2,720,946 $25.47 $2.60 $278,102 ($22.86) 10.2%Operating expenses, operating revenues and the farebox cost recoveryratio for DAR during <strong>FY</strong> 2003-04 and <strong>FY</strong> 2006-07 are summarized inTables 3.12 and 3.13, respectively. During <strong>FY</strong> 2006-07 Antioch SeniorBus had the best overall financial performance, reflecting its relativelyhigh productivity. It should be noted that the cost for this service asshown reflects only the <strong>Tri</strong> <strong>Delta</strong> <strong>Transit</strong> subsidy portion of the cost andnot the entire cost of operating the service which is provided by the42
City of Antioch. The farebox cost recovery ratio is 0% becausedonations are requested and retained by the opera<strong>to</strong>r and not remitted<strong>to</strong> ECCTA.DR service met most of its objectives, but missed meeting the 90%standard for on-time performance. See Table 3.13. DAR on-timeperformance was 75% in <strong>FY</strong> 2003 and 78% in <strong>FY</strong> 2004, less than theadopted <strong>Tri</strong> <strong>Delta</strong> <strong>Transit</strong> measure of 90%. That performanceincreased <strong>to</strong> 87% for <strong>FY</strong>07 due in part <strong>to</strong> the implementation of anMDT/IVR (Mobile Data Terminal/Integrated Voice Response) systemand updated, scheduling software as part of a major, IntelligentTransportation System (ITS) project undertaken several years ago.Table 3.13 DAR Operating Statistics & Performance Indica<strong>to</strong>rsStatistic/ or MeasureValueMeetStandard?CommentNumber of Late Buses 84 -- Used <strong>to</strong> calculate performance measureNumber of Lift Passengers 27,386 -- Less expensive <strong>to</strong> carry on FR buses than DARPreventable Accidents 4 -- Used <strong>to</strong> calculate performance measureCus<strong>to</strong>mer Complaint Calls Received 137 -- Used <strong>to</strong> calculate performance measureNumber of Mechanical Failures 4 -- Used <strong>to</strong> calculate performance measureNumber of Road Calls 8 -- Used <strong>to</strong> calculate performance measureFTA Road Calls - Other 1 -- Used <strong>to</strong> calculate performance measureTotal Road Calls 9 -- Used <strong>to</strong> calculate performance measureOn-Time Performance – Fixed Route 87.2% No Standard us 90% and was nearly metMiles Between Preventable Accidents 144,282 Yes Nearly meets high end of standard (70,000 miles)Percentage of Riders Complaining 0.164% Yes Measure changed from 2005 SRTPAverage Miles Between Road calls(based on RVM)64,125 Yes Previous SRTP standard exceeded by a widemargin; recommend increasing the standard.Characteristics of Dial-A-Ride <strong>Tri</strong>ps & ServiceA detailed analysis of the characteristics of Dial-A-Ride trips can besummarized as follows:• Of <strong>to</strong>tal DAR reservations requested, 84% were completed, and16% cancelled. Riders cancelled 12% of the time, and 3% were“no shows.” At the time of the previous SRTP, the cancellationrate was relatively high for a system restricting advancebookings <strong>to</strong> three days in advance.• Less than 1% of trip requests were denied, including requestsfor alternative trip times, same day trip denials, and denials ofnon-ADA service requests. No advance bookings by ADA-eligibleregistrants were denied, though same-day requests can bedenied under ADA regulations if space is not available.• Almost 13% of DAR passengers were classified as “personalcare attendants,” (PCAs) a relatively high rate. 2% of thepassengers were fare-paying companions traveling with aregistered passenger; the high rate of PCAs may indicate thatsome are actually companions avoiding paying the fare.43
• 34% of DAR trips were subscription trips, i.e., pre-scheduledtrips that tend <strong>to</strong> repeat at the same times on the same days.All other trips were “on demand,” including advance and samedaybookings. About 30 same-day bookings were requested, ofwhich about 70% were accommodated.• 30% of DAR passengers use a wheelchair or scooter. Most DARpassengers do not require a wheelchair-accessible vehicle,although many are mobility limited and cannot walk far.• As summarized in Table 3.8, daily DAR ridership averaged 389boardings on weekdays, 106 on Saturdays and 49 on Sundays.• Peak travel times are between 8:30 a.m. and 10:00 a.m. andfrom 2:30 p.m. <strong>to</strong> 4:00 p.m. Individual drivers indicated peaktimes between 7:00 a.m. and Noon, and from 3:00 p.m. <strong>to</strong>5:00 p.m. DAR peaks start later and end earlier than traditionaltransit peak periods.• Most DAR trips were within the same communities, with triporigins and destinations scattered throughout each communityand the service area. No destinations dominated, but importantlocations served included Los Medanos Community College,Kaiser Medical Clinic (Antioch), the Antioch Dialysis Clinic,Pittsburg Health Center, Somersville Towne Center, ContraCosta County Social Services, Commercial Support, and BART.DAR Compliance with ADA RegulationsThe Americans With Disabilities Act (ADA) of 1990 requires transitagencies that provide fixed route service <strong>to</strong> operate complementarydemand responsive service <strong>to</strong> potential transit users who are unable <strong>to</strong>use fixed route transit due <strong>to</strong> a disability. This service must be“equivalent” <strong>to</strong> the FR service as much as possible. ADA regulationsdefine the minimum level of service required only apply <strong>to</strong> demandresponsive services when delivered <strong>to</strong> ADA-eligible persons, and haveno effect on demand-responsive services when also provided <strong>to</strong> non-ADA eligible patrons. Many paratransit systems including <strong>Tri</strong> <strong>Delta</strong><strong>Transit</strong> provide a level of service exceeding minimum ADArequirements. However, in cases where agencies provide serviceexceeding these requirements, it is important <strong>to</strong> closely re<strong>view</strong>compliance with ADA regulations in order <strong>to</strong> avoid liability under thoserules. In most cases, close adherence <strong>to</strong> ADA requirements can oftenreduce operating expenses and more effectively manage paratransitdemand.<strong>Tri</strong> <strong>Delta</strong> <strong>Transit</strong> met applicable ADA requirements, and exceeded themin a number of cases, including (1) a service area exceeding the ¾mile radius from fixed routes in a number of areas; (2) providingservice <strong>to</strong> non-ADA clients; (3) accommodating same day bookings;(4) providing “door <strong>to</strong> door” service rather than just “curb <strong>to</strong> curb”,e.g., drivers are allowed <strong>to</strong> assist passengers <strong>to</strong>/from the door of theirorigins and destinations, and <strong>to</strong> assist with a limited number ofpackages.44
DAR Evaluation Summary<strong>Tri</strong> <strong>Delta</strong> <strong>Transit</strong> DAR service productivity peaked in <strong>FY</strong> 1997-98 at 4.0boardings/RVH and declined by about 1/3 <strong>to</strong> 2.6 overall boardings/RVHduring <strong>FY</strong> 2006-07. The system has managed demand by tighteningrestrictions on trips made by non-ADA eligible persons, and by periodicfare increases <strong>to</strong> bring DAR fares in<strong>to</strong> line with what is allowed underADA requirements.Compared <strong>to</strong> the fixed route system, DAR subsidy per passenger hasbeen relatively stable and actually declined relative <strong>to</strong> inflation since <strong>FY</strong>1995. Dispatcher performance has been improved even though not allthe features of the au<strong>to</strong>mated “Trapeze” software paratransitdispatching system have been utilized. Further opportunities may existthrough improved utilization of software dispatching capabilities.Capital Program Trends & AnalysisECCTA’s key capital assets include its operations and administrativecomplex located at 801 Wilbur Avenue, 69 fixed route and 22paratransit (<strong>to</strong>tal 91) active revenue vehicles, support vehicles, andpassenger amenities installed at selected bus s<strong>to</strong>ps. The three parkand-ridelots currently used by <strong>Tri</strong> <strong>Delta</strong> <strong>Transit</strong> are owned by BART.The existing facility houses transit operations, maintenance and ECCTAadministration at a single location. As originally completed in 1987, themaintenance shop contained three bays and capacity for 40 buses.Expansion plans <strong>to</strong> a design capacity of 110 vehicles were developedwhen ECCTA assumed responsibility for BART express bus routes in1997. Work began in 2003 <strong>to</strong> increase the shop <strong>to</strong> six bays, enclosethe bus wash area, improve the bus parking lot and reconfigure theemployee/visi<strong>to</strong>r lot. Over $6.9 million was programmed between <strong>FY</strong>2001-022 and <strong>FY</strong> 2004-05. The facility expansion project wascompleted during <strong>FY</strong> 2004-05. These improvements are expected <strong>to</strong>meet <strong>Tri</strong> <strong>Delta</strong> <strong>Transit</strong>’s needs through <strong>FY</strong> 2015.74 <strong>Tri</strong> <strong>Delta</strong> <strong>Transit</strong> bus s<strong>to</strong>ps are equipped with passenger sheltersand bench seating. 50 of these are standard metal frame shelterspurchased and installed in <strong>FY</strong> 2003. The remaining units include anumber of shelters installed independently by an advertising salescompany, many constructed or placed by developers as part of localcommercial and residential projects, and two older wooden sheltersbuilt by local organizations for the public good. ECCTA maintains allshelters, except for major repairs and repainting of those owned byother entities.<strong>Transit</strong> VehiclesThe fixed route revenue vehicle fleet is in generally good condition witheffective maintenance and replacement programs in place. The 69-vehicle fixed route fleet has an average age of 7.5 years as of June 30,<strong>2007</strong>, and a combined fleet average useful life of about 13 years.45
These buses are diesel powered heavy-duty vehicles that ultimatelymust be replaced by a combination of low emission and zero-emissionvehicles under rules promulgated by the California Air Resources Board(CARB) in 2000. These rules require retrofitting existing Diesel enginesinstalled before 2004 must be retrofitted <strong>to</strong> yield lower nitrogen oxide(NOx) and particulate (PM) emissions during remaining vehicle life. Tocomply, ECCTA programmed more than $1.6 million in federal andlocal funds <strong>to</strong> purchase and install bus catalyst devices on the existingfixed route fleet. Nineteen buses were retrofitted in <strong>FY</strong>07.CARB rules mandate transit systems <strong>to</strong> replace current dieseltechnology with vehicles propelled by natural gas, hybrid-electric,battery-electric, or fuel cells. Six 1995 Gillig Phan<strong>to</strong>ms were scheduledfor replacement during <strong>FY</strong> 2006-07 and the replacements will bediesel-electric hybrids from Gillig. This purchase of hybrid-electricbuses manufactured by Gillig was delayed resulting in thereplacements being <strong>2007</strong> model year coaches. This created a technicaldifficulty where these buses met CARB requirements for 2006, but maynot for the <strong>2007</strong> model year. The “medium duty” engines used are notcertified by CARB for <strong>2007</strong>, though larger “heavy duty” engines are.This is problematic since use of heavier duty engines negates the fueland maintenance savings inherent in hybrid bus designs. Gillig hascommitted <strong>to</strong> resolving this issue.Twelve additional 1997 Gillig buses will be eligible for replacement in<strong>FY</strong> 2009, and will comply with CARB rules as they exist that year.In 2006, the 20-vehicle paratransit fleet (including 2 supervisor vans)had an average age of 6.8 years, despite an average useful life ofabout 5 years for such vehicles. These buses were replaced in <strong>FY</strong>2006-07.<strong>Transit</strong> Centers and Park & Ride LotsThree park & ride lots owned by BART are currently in use by <strong>Tri</strong> <strong>Delta</strong><strong>Transit</strong>: (1) at the Hillcrest Avenue /Highway 4 interchange in Antioch;(2) the Brentwood Park and Ride Lot near down<strong>to</strong>wn Brentwood, and(3) on Bliss Avenue between Railroad Avenue and Harbor Street incentral Pittsburg. Each of these lots is deficient in some aspectresulting in less than optimum bus operations, passenger security, etc.The most immediate concern is with the Hillcrest facility. Busesexperience significant delays accessing the bus s<strong>to</strong>ps situated on thesouth side of Sunset Drive east of Hillcrest Drive. Departing busesmust continue eastbound <strong>to</strong> turn around in a cul de sac at the end ofSunset <strong>to</strong> return westbound <strong>to</strong> the Hillcrest intersection. Theintersection is signalized, but also prone <strong>to</strong> congestion caused by trafficqueuing on Hillcrest <strong>to</strong> cross over or merge on<strong>to</strong>, Highway 4. Theintersection design further reduces transit speeds, particularly for theMCI coaches running DX and peak period Route 300 trips. The parkridelot is almost full on weekdays. Parking aisles are narrow and notwell marked and may pose safety issues.46
The Brentwood park-ride lot is physically adequate <strong>to</strong> meet currentcapacity requirements and aesthetic standards. However, while thelocation may be suitable for a future eBART/BART station, travel times<strong>to</strong> the Pittsburg/Bay Point BART station are very long due <strong>to</strong> indirectbus routings and traffic congestion, resulting in relatively low use.Current one-way travel time from the Brentwood facility <strong>to</strong> thePittsburg/Bay Point BART station is 64 minutes, which is 9 minuteslonger than BART trains between Pittsburg/Bay Point BART andMontgomery Street in down<strong>to</strong>wn San Francisco.The Bliss Avenue park and ride lot in Pittsburg was constructed in anindustrial area with poor security and less than optimum transit access<strong>to</strong> and from Highway 4. The lot is also less than 4 miles from BART,giving a weak incentive for its use compared <strong>to</strong> driving directly <strong>to</strong> theexisting BART station. Once considered as a possible eBART station,local officials would prefer the station <strong>to</strong> be closer at Railroad Avenue,in the freeway median with better access and egress <strong>to</strong> Highway 4.Up until 2005, <strong>Tri</strong> <strong>Delta</strong> <strong>Transit</strong> had plans <strong>to</strong> construct a bus transfercenter and park-ride lot at a site on the south side of East Leland Roadadjacent <strong>to</strong> Los Medanos Community College. However, the City ofAntioch owns the property, and did not want a park and ride lot at thislocation. An alternative location has been identified in Oakley andECCTA has gotten two, FTA Section 5309 earmarks <strong>to</strong>taling$1,083,000 appropriated <strong>to</strong> acquire the property along with additional,local funds. The funding applications and the acquisition process are inprocess at this time.Two major transportation capacity expansion projects not directlycontrolled by <strong>Tri</strong> <strong>Delta</strong> <strong>Transit</strong> will have a significant impact on thefuture location and construction of transfer facilities and park and ridelots. Original plans for eBART were based on purchase of a portion ofthe existing Union Pacific railroad right-of-way between Bay Point,Pittsburg, Antioch and Brentwood, with proposed eBART stationslocated at Railroad Avenue in Pittsburg, Somersville Road and HillcrestAvenue in Antioch, and down<strong>to</strong>wn Brentwood. However, Union Pacificdeclined <strong>to</strong> sell its right-of-way on the terms offered. As a result BARThas revised eBART planning <strong>to</strong> place the proposed rail line in themedian of Highway 4 between the Pittsburg/Bay Point BART stationand Hillcrest Avenue.This re-conceptualization of eBART plans has delayed the programmedand funded expansion of Highway 4 between Pittsburg <strong>to</strong> east ofHillcrest Avenue for 18-24 months, in order <strong>to</strong> accommodate eBARTtracks in the freeway median. Due <strong>to</strong> continuing cost overruns, currenteBART plans call for only two new eBART stations, in Pittsburg atHighway 4/Railroad Avenue, and in Antioch at Highway 4/HillcrestAvenue. An eBART station at Highway 4 and Somersville Road wouldbe deferred, as would the extension <strong>to</strong> Brentwood and additionalstations at the Highway 4 extension/Lone Tree Way, and in down<strong>to</strong>wnBrentwood.47
A Coordinated Local Bus, BRT and eBART/BART StrategyGiven the delays in eBART, the need for improved transfer facilitiesand additional park & ride space in Eastern Contra Costa County, aninterim approach may be called for. Low cost forms of Bus Rapid<strong>Transit</strong> (BRT) need <strong>to</strong> be considered, both as a means of buildingfuture patronage for eBART and/or BART, but also <strong>to</strong> serve the manyportions of the <strong>Tri</strong> <strong>Delta</strong> <strong>Transit</strong> service area that will never be directlyserved by rail transit. Unlike rail, building a BRT network can beginalmost immediately, even with existing rolling s<strong>to</strong>ck.The extension of Highway 4 between Antioch and Brentwood (segment1 of the SR4 Bypass) opened recently, reducing travel times by 15-20minutes in each direction for both au<strong>to</strong>mobiles and buses. Given thisnew roadway, Route 300 could be restructured <strong>to</strong> provide much fasterservice on a new branch between Brentwood and Pittsburg/Bay PointBART during peak periods on 30-minute headways, and every 30minutes <strong>to</strong> Oakley. Midday and weekend service could operate every60 minutes <strong>to</strong> Oakley and Brentwood, respectively. The Brentwoodbranch should also s<strong>to</strong>p in the vicinity of Highway 4 and Lone TreeWay, a large retail center and central <strong>to</strong> many residential areas insoutheastern Antioch, western Brentwood, and southern Oakley.An East Contra Costa BRT strategy should also connect BART, eBARTand local <strong>Tri</strong> <strong>Delta</strong> <strong>Transit</strong> routes at the existing BART station but alsofuture eBART/BART stations. Permanent transit centers and sufficientpark and ride capacity should be constructed at proposed and potentialeBART station locations. While eBART will not s<strong>to</strong>p at SomersvilleRoad, Lone Tree Way and down<strong>to</strong>wn Brentwood in the near future,these sites are extremely well located <strong>to</strong> serve as major transit hubs,and have areas available with the potential for transit-orienteddevelopment (TOD). This approach and its potential benefits arediscussed in Chapter 4, Bus Rapid <strong>Transit</strong> Options.On Board Survey ResultsTwo onboard surveys of <strong>Tri</strong> <strong>Delta</strong> <strong>Transit</strong> fixed route passengers wereconducted, the first in Oc<strong>to</strong>ber-November 2006 and the second inFebruary <strong>2007</strong>. The 2006 survey was specifically developed for theeBART study and <strong>Tri</strong> <strong>Delta</strong> <strong>Transit</strong> use. The February <strong>2007</strong> survey wassponsored by the Metropolitan Transportation Commission (MTC) andincluded 22 Bay Area transit systems. The MTC survey was intended <strong>to</strong>assist in developing <strong>Short</strong> <strong>Range</strong> <strong>Transit</strong> <strong>Plan</strong>s by each Bay Area transi<strong>to</strong>pera<strong>to</strong>r.<strong>Tri</strong> <strong>Delta</strong> <strong>Transit</strong>/eBART SurveyA <strong>to</strong>tal of 1,522 on-board surveys were filled out and collected on <strong>Tri</strong><strong>Delta</strong> <strong>Transit</strong> vehicles between Oc<strong>to</strong>ber 16, 2006 and the third week ofNovember 2006. The purpose of the survey was <strong>to</strong> collect base dataneeded <strong>to</strong> restructuring <strong>Tri</strong> <strong>Delta</strong> <strong>Transit</strong> fixed routes <strong>to</strong> coordinateservice with the proposed eBART line. Survey results also containuseful information for marketing purposes and profiles typical users of<strong>Tri</strong> <strong>Delta</strong> <strong>Transit</strong>.48
Each completed survey provides information regarding one distinct“linked” trip. A “linked trip” represents a complete journey that mayhave involved use of several distinct modes of travel between aperson’s origin and final destination. For example, someone may drivefrom home <strong>to</strong> a park & ride lot, transfer <strong>to</strong> a bus <strong>to</strong> BART, and thentake BART <strong>to</strong> their final destination. Each trip segment is a distinct“unlinked” trip, but the entire journey is one linked trip.Respondents were also asked if the trip they were being surveyedabout was one direction of a round trip, but details regarding the“second” (return) part of the trip were not collected. All <strong>Tri</strong> <strong>Delta</strong><strong>Transit</strong> routes were sampled approximately in proportion <strong>to</strong> their shareof <strong>to</strong>tal system patronage. Not all respondents answered all questions,so responses <strong>to</strong> a particular question may not add up <strong>to</strong> the <strong>to</strong>talnumber of surveys collected.The results of the survey provided empirical confirmation ofassumptions that ECCTA staff has been using for some time based ontheir daily observations and work on the <strong>Tri</strong> <strong>Delta</strong> <strong>Transit</strong> system.None of the data was significantly different from the concepts that staffhad already developed through observation. There was one surprisingdicho<strong>to</strong>my in the responses: While less than 20% of respondents wereusing <strong>Tri</strong> <strong>Delta</strong> <strong>Transit</strong> buses <strong>to</strong> get <strong>to</strong> or come from the existing BARTstation (I), 81% of patrons responded that that they would use eBARTif and when that service materializes.A composite profile of a <strong>Tri</strong> <strong>Delta</strong> <strong>Transit</strong> rider can be summarized fromthese survey results. The “average” rider would be:• Between twelve and thirty years old.• Is transit dependent with limited access <strong>to</strong> an au<strong>to</strong>mobile.• Lives in a low <strong>to</strong> very low income household.• Generally pays cash when riding the bus.• Regards their ethnicity as non-white.The survey also shows that most <strong>Tri</strong> <strong>Delta</strong> <strong>Transit</strong> patrons:• Begin and end their trips by bus within East County.• Make their trips without transferring between bus routes.• Use <strong>Tri</strong> <strong>Delta</strong> <strong>Transit</strong> buses for round trips.• Walk <strong>to</strong> and from the bus.The number of surveys collected on each route was proportional <strong>to</strong>each route’s share of <strong>to</strong>tal ridership, (Figures 3.11 and 3.12).49
Figure 3.11Survey Ridershipby Route3903899%3914%11%14%300DX Dub 1%DX LLNL 1%DimesARide 1%70 2%200 2%12%388387386
Those aged 12 <strong>to</strong> 30 constitute 60% of <strong>to</strong>tal <strong>Tri</strong> <strong>Delta</strong> <strong>Transit</strong>patronage, but are only 25% of the East County population, as shownin Figures 3.13 and 3.14. Females are more likely <strong>to</strong> use the bus thanmales, constituting 56% of <strong>to</strong>tal bus ridership, but only 50% of thearea population.Figure 3.13Age Distributionfor ECCTA60 <strong>to</strong> 64 65+ 11 or under3%2% 2%12 <strong>to</strong> 1730 <strong>to</strong> 5931%33%29%18 <strong>to</strong> 30Figure 3.14Age Distributionof Service Area(Census 2000)60-6465+3% 8%22%11 or under10%12-1730-5943%15%18-30The majority of <strong>Tri</strong> <strong>Delta</strong> ridership comes from low <strong>to</strong> very low-incomehouseholds while most East County residents do not belong <strong>to</strong> thisgrouping. See Figure 3.15.51
Figure 3.1540%Comparison of Responses on Household Income<strong>to</strong> Household Income of Service Area35%30%25%20%15%SurveyResponsesService Area(Census 2000)10%5%0%$15$15 - $25$25 - $35$35 - $70$50 - $75$75+Seventy five percent of bus users are “transit dependent;” that is,lacking access <strong>to</strong> a mo<strong>to</strong>r vehicle for making the trip on the busFigure 3.16Access of Respondant <strong>to</strong> a CarYes19%81%No52
Most transit users (77%) ride the bus four days or more per week.Figure 3.17Frequency of Bus Use Reported by Survey Respondent1/Month1-3x/Month1-3 Days aWeek17%4% 2%24%4 Days a Week53%5 Days a WeekSeniors and persons with disabilities constitute about 12% of <strong>Tri</strong> <strong>Delta</strong><strong>Transit</strong> patronage. Most <strong>Tri</strong> <strong>Delta</strong> <strong>Transit</strong> riders use the bus for localtrips. Only 20% of <strong>Tri</strong> <strong>Delta</strong> <strong>Transit</strong> patrons are using the WestPittsburg/Bay Point BART station. Please refer <strong>to</strong> Figures 3.18, 3.19and 3.20 illustrating the origins and destinations of bus riders.Figure 3.18Relative Population Within Service Area by CityBrentw oodBay PointOakley12%11%13%29%Pittsburg46%Antioch53
Figure 3.19Survey <strong>Tri</strong>p OriginationsOtherBrentw oodOakleyBay Point BART8% 2%4% 21%8%Bay PointAntioch37%20%PittsburgFigure 3.20Survey <strong>Tri</strong>p DestinationsBrentw oodOakley5%Other8% 2%17%Baypoint BART8%Bay PointAntioch38%22%PittsburgAbout 40% of survey respondents used the bus <strong>to</strong> make a one-waytrip, while 60% used the bus in both directions. About 60% of ridersused only one bus, 35% used two buses, and 5% used three or morebuses. Most passengers are able <strong>to</strong> make their trips with a single bus.Those who transfer generally make only one transfer.54
Figure 3.21 shows in another way that most transit users are able <strong>to</strong>reach their destination on a single bus, without needing <strong>to</strong> transfer.Figure 3.21<strong>Tri</strong>p ConnectionTo BARTTo Other 1%To Another <strong>Tri</strong><strong>Delta</strong> <strong>Transit</strong>Bus9%21%69%No TransferAs expected, walking was the most frequent means of access <strong>to</strong> thebus, followed by transferring from another transit vehicle Please refer<strong>to</strong> Figure 3.22.Figure 3.22How Did They Get <strong>to</strong> the Bus?Bike Other 1%BART Transfer3%9%<strong>Tri</strong> <strong>Delta</strong>Transfer12%Car9%66%Walked55
Non-whites make up a disproportionate number of <strong>Tri</strong> <strong>Delta</strong> <strong>Transit</strong>patrons when compared <strong>to</strong> East County demographics. See Figures3.22 and 3.23.Figure 3.23Ethnic Background Indicated By Survey RespondentMultiple OtherResponsesAsian6% 5% 7%White/Caucasian19%37%African-AmericanAmerican Indian 1%Hispanic/Latino25%Figure 3.24Ethnic Background Within Service Area (Census 2000)Two or OtherMore Races7% 2%Asian7% African-American10%White/Caucasian53%21%Hispanic/LatinoAmerican Indian/Alaskan Native
MTC Sponsored Survey, February <strong>2007</strong>The MTC-sponsored survey was conducted from January 23, <strong>2007</strong> <strong>to</strong>February 2, <strong>2007</strong>, covering the busiest fixed routes. A <strong>to</strong>tal of 612inter<strong>view</strong>s were completed on Routes 380, 391, 388, 300, 387, and389. The MTC survey used in-person inter<strong>view</strong>s of each transit usersurveyed rather than written surveys. For the <strong>Tri</strong> <strong>Delta</strong> <strong>Transit</strong> surveywork, each routes’ share of inter<strong>view</strong>s was determined by its share ofsystem ridership, as was the distribution on weekend days.The detailed responses for <strong>Tri</strong> <strong>Delta</strong> <strong>Transit</strong> by the MTC survey aresummarized in Chapter 4.14 of the document MTC 2006 <strong>Transit</strong>Passenger Demographic Survey, which is not duplicated here for thesake of brevity, but is available on the MTC website.Table 3.14 Parts 1 and 2 compares the findings of the earlier onboardsurvey conducted by <strong>Tri</strong> <strong>Delta</strong> <strong>Transit</strong> with the results of the MTCeffort, and highlights major differences.Table 3.14 Part 1 <strong>Tri</strong> <strong>Delta</strong> <strong>Transit</strong> & MTC Survey ResultsSignificantDifferenceResponseseBARTSurveyMTC SurveyECCTAMTC SurveyRegion(±5%)What is your fare categoryAdult 84.6% 74.0% 79.5% XSenior or Disabled 12.4% 7.5% 7.5%Youth or student n/a 18.5% 12.8%DN/NA 3.0% 0.0% 0.2%Car AvailabilityYes 17.9% 51.3% 34.1% XNo 76.8% 47.7% 64.6% XDK 5.3% 1.0% 1.3%Race or ethnic identificationWhite 17.7% 24.7% 39.0% XHispanic/ Latino 24.2% 33.8% 20.5% XBlack/ African-American 35.1% 33.8% 19.2%Asian 6.6% 9.8% 18.2%American Indian or Alaskan Native 1.0% 1.5% 1.4%Other 10.8% 5.2% 5.7% XDK/ NA 4.5% 1.7% 1.3%Annual Income$15,000 or less 37.0% 18.3% 14.0% X$15,000 <strong>to</strong> $24,000 9.3% 13.7% 12.7%$25,000 <strong>to</strong> $49,999 12.9% 27.0% 22.3% X$50,000 <strong>to</strong> $75,000 6.3% 20.3% 17.7% X$75,000 or more 5.1% 9.3% 21.6%DK/NA/Refused 29.4% 11.4% 11.7%57
Table 3.14 Part 2 <strong>Tri</strong> <strong>Delta</strong> <strong>Transit</strong> & MTC Survey ResultsGenderResponseseBARTSurveyMTC SurveyECCTAMTC SurveyRegionMale 43.0% 46.9% 51.3%Female 53.9% 52.9% 48.0%Not Known 3.0% 0.2% 0.7%Inter<strong>view</strong> LanguageEnglish 92.3% 93.0% 93.5%Spanish 7.7% 6.5% 4.5%Other n/a 0.5% 2.0%Point of OriginationSignificantDifferenceHome 36.5% 51.8% 47.3% XWork 22.1% 17.3% 21.2%School 22.7% 17.5% 10.0% XShopping 5.8% 7.8% 10.7%Social or Recreation 2.8% 3.4% 7.1%Medical or Dental 2.3% 1.5% 1.5%Other 6.4% 0.6% 2.2% XDK/NA 1.7% 0.0% 0.0%Point of DestinationHome 63.5% 35.1% 33.6% XWork 13.5% 24.7% 28.7% XSchool 12.5% 17.6% 8.8% XShopping 3.1% 12.1% 14.2% XSocial or Recreation 3.1% 7.3% 10.2% XMedical or Dental 1.0% 2.1% 1.5%Other 2.4% 1.0% 2.9%DK/NA 0.8% 0.0% 0.0%(±5%)ECCTA staff believes that the significant differences in results from thetwo surveys were the result of differences in methodology. They alsofind the results of the eBART study <strong>to</strong> be more in line with their ownobservations and thus a more accurate profile of <strong>Tri</strong> <strong>Delta</strong> <strong>Transit</strong>ridership.Productivity Improvement Program (PIP)ECCTA has a formal productivity improvement plan (PIP) <strong>to</strong> guideongoing efforts <strong>to</strong> operate transit services that meet or exceedminimum performance standards. Current productivity standardsinclude 15 passengers (boardings) per revenue vehicle hour (RVH) forthe fixed route network and three passengers (boardings) per RVH forDial-A-Ride. During <strong>FY</strong> 2006-07, the fixed route system as a wholeaveraged 16 boardings/RVH, while the Dial-A-Ride system averaged2.6 boardings/RVH. Routes DX-1 and DX-2 operated significantly below58
the adopted productivity standard, but each route had a farebox costrecovery ratio well above the <strong>Tri</strong> <strong>Delta</strong> <strong>Transit</strong> fixed route average due<strong>to</strong> the higher fares for these subscription services.Several options may be considered <strong>to</strong> res<strong>to</strong>re service productivity <strong>to</strong>defined standards. On the fixed route side where current productivity iswithin 10% of standard, the approach suggested is <strong>to</strong> trim back onunproductive service hours or discontinue marginal routes.Four <strong>Tri</strong> <strong>Delta</strong> <strong>Transit</strong> routes currently operate with less than 10passengers/RVH, the suggested “cu<strong>to</strong>ff” where a route should beconsidered deficient in productivity, excluding DX-1 and DX-2 aspreviously noted:• 70 Pittsburg Loop – 23% below suggested minimum• 200 Martinez/Antioch – 34% below suggested minimum• 384, 385, 386 – Antioch-Brentwood-Oakley 6% <strong>to</strong> 52% belowsuggested minimumThere currently is no plan <strong>to</strong> address the relatively low productivity ofRoutes 70 and 200. Until recently, Route 200 was partly subsidized byContra Costa County <strong>to</strong> ensure access <strong>to</strong> health care facilities inMartinez for low-income residents. Route 200 is a “lifeline”transportation service and is unlikely <strong>to</strong> be eliminated or curtailedsignificantly, and remains considerably more cost-effective thanalternative Dial-A-Ride service. And, lifeline funding in the amount of$92,000 per year has been obtained for Route 200 for the next threeyears.Route 70 service has been reduced about 25%, as recommended inthe previous SRTP document. This route is currently at a minimumlevel of service and also functions as a lifeline service, serving areasnot covered by busier local routes, and remains considerably morecost-effective than Dial-A-Ride service.Routes 384, 385, and 386 are relatively new routes in operation forless than two years, and have not yet achieved optimum ridershiplevels. Route 386 is a rural connecting route serving Byron andDiscovery Bay, and perhaps should be evaluated on that basis. Withthe opening of the Highway 4 bypass <strong>to</strong> Southeast Antioch andBrentwood, Route 300 could be restructured in<strong>to</strong> a more efficientconfiguration by increasing the potential for patronage on these routes.The PIP for <strong>FY</strong> 2006-07 included improving the on-time performance ofthe Dial-A-Ride system, which was 80% in <strong>FY</strong> 2003-04. The objectiveindicated in Chapter 2 was 90%, which was almost met with 89.7%during <strong>FY</strong> 2006-07.59
Response <strong>to</strong> <strong>FY</strong> 2003-05 Performance AuditIn California, a performance audit must be conducted every threeyears of any transit opera<strong>to</strong>r receiving Transportation Development Act(TDA) Article 4 funds, <strong>to</strong> determine whether the opera<strong>to</strong>r is incompliance with certain statu<strong>to</strong>ry and regula<strong>to</strong>ry requirements, and <strong>to</strong>assess the efficiency and effectiveness of the opera<strong>to</strong>r’s services.In June 2006, the triennial performance audit of <strong>Tri</strong> <strong>Delta</strong> <strong>Transit</strong>covering <strong>FY</strong> 2002-03, <strong>FY</strong> 2003-04, and <strong>FY</strong> 2004-05 was completed. <strong>Tri</strong><strong>Delta</strong> <strong>Transit</strong> was found <strong>to</strong> be in compliance with applicable statu<strong>to</strong>ryand regula<strong>to</strong>ry requirements. The document also found that <strong>Tri</strong> <strong>Delta</strong><strong>Transit</strong> had implemented one of four recommendations from theprevious audit, and partially implemented the other three. The systemhad taken steps <strong>to</strong> reduce preventable accidents by incorporatingadditional safety incentives in the purchase of service contract, andstrengthened oversight and training requirements in its new contracteffective July 2006.The second, partially implemented recommendation was <strong>to</strong> compareperformance standards on an annual basis. Changes were made <strong>to</strong> theperformance measurement system <strong>to</strong> comply.The third partially implemented recommendation was <strong>to</strong> improve theon-time performance of the Dial-A-Ride system. This The objectiveindicated in Chapter 2 was 90%, which was almost met with 89.7%during <strong>FY</strong> 2006-07. <strong>Tri</strong> <strong>Delta</strong> <strong>Transit</strong> made major progress <strong>to</strong> meetingthis performance audit recommendation. The fourth, partlyimplemented recommendation was <strong>to</strong> improve Dial-A-Ride productivity<strong>to</strong> the adopted standard of 3.0 boardings/RVH. This measure has notbeen met, with 2.6 boardings/RVH in <strong>FY</strong> 2006-07. Furtherimprovements are being addressed.The <strong>FY</strong> 2003-05 <strong>Tri</strong>ennial Performance Audit’s recommendations buil<strong>to</strong>n the previous document:1. Continue the process for redefining performance standards <strong>to</strong>meet goals and objectives.2. Continue efforts <strong>to</strong> compare performance with adoptedstandards on an annual basis.The goals, objectives, policies and standards discussed in Chapter 2were re<strong>view</strong>ed in response <strong>to</strong> these recommendations, and areincluded in recommendations for revisions in that Chapter. Norecommendations were made in other areas. <strong>Tri</strong> <strong>Delta</strong> <strong>Transit</strong> hasresponded <strong>to</strong> these recommendations by developing an extremelydetailed monthly operations report that tracks detailed operatingstatistics and performance indica<strong>to</strong>rs, and compares with adoptedgoals and objectives on a monthly and annual basis.60
Federal Title VI ProgramECCTA has established an ongoing internal management practice <strong>to</strong>assure that all <strong>Tri</strong> <strong>Delta</strong> <strong>Transit</strong> services and federally-funded assetsare deployed in a manner consistent with the U.S. Civil Right Act. Themost recent FTA <strong>Tri</strong>ennial Re<strong>view</strong> found that the most recently updatedTitle VI program had not been submitted <strong>to</strong> FTA on a timely basis. Thisdeficiency was corrected within the 90 day period indicated by the<strong>Tri</strong>ennial Re<strong>view</strong>. ECCTA has no active or closed lawsuits or complaintsalleging discrimination, and is not involved in construction or otherprojects that pose environmental justice concerns.As noted earlier, Route 200 is a positive example of cooperation withthe County of Contra Costa <strong>to</strong> address the specific needs of low-incomepersons as intended by Title VI. New Route 201 between WestPittsburg/Bay Point and Concord also addresses these concerns,eliminating the required payment of fares on both buses and BART forthe many persons traveling <strong>to</strong> school and other activities in CentralConcord. Route 201 was established in late August <strong>2007</strong>, but is alreadyexceeding 11 boardings/RVH and serving a very high percentage ofpassengers who transfer <strong>to</strong>/from the various County Connection routesavailable at the Concord BART station.61
Response <strong>to</strong> <strong>FY</strong> <strong>2007</strong> Federal <strong>Tri</strong>ennial Re<strong>view</strong>Chapter 53 of Title 49, United States Code, requires the Federal <strong>Transit</strong>Administration (FTA) <strong>to</strong> re<strong>view</strong> and evaluate how FTA grant recipientshave used Urbanized Area Formula Grants (FTA Section 5307 funds)and complied with relevant statu<strong>to</strong>ry and administrative requirementsat least every three years. This requirement is enumerated in 49U.S.C. 5307(i), as follows:(2) At least every three years, the Secretary [of Transportation]shall re<strong>view</strong> and evaluate completely the performance of arecipient in carrying out the recipient’s program, specificallyreferring <strong>to</strong> compliance with statu<strong>to</strong>ry and administrativerequirements and the extent <strong>to</strong> which actual program activitiesare consistent with the activities proposed under subsection(d) of this section and the planning process required undersection 5303-5306 of this title.(3) The Secretary may take appropriate action consistent with there<strong>view</strong>, audit and evaluation under this subsection, includingmaking an appropriate adjustment in the amount of a grant orwithdrawing the grant.The <strong>Tri</strong>ennial Re<strong>view</strong> analyzes and evaluates grantee performance andcompliance in 23 distinct areas, which are not listed here for brevity.The latest re<strong>view</strong> of the <strong>Tri</strong> <strong>Delta</strong> <strong>Transit</strong> system, conducted in August2006, included the following findings and corrective actions, whichmainly consist of updating documentation and complying with recentchanges in emphasis in administrative requirements by FTA. <strong>Tri</strong> <strong>Delta</strong><strong>Transit</strong> staff <strong>to</strong>ok corrective action in Fall 2006 <strong>to</strong> comply with thefollowing findings:1. Accurately report un-liquidated obligations for Grant CA 90Y30800 and provide assurances <strong>to</strong> FTA that ECCTAunderstands the correct method for reporting on un-obligatedfunds (within 60 days).2. Complete development of service standards and policies, andsubmit Title VI program <strong>to</strong> FTA (within 90 days).62
CHAPTER4Bus Rapid <strong>Transit</strong> (BRT) OptionsThe term “bus rapid transit” (BRT) refers <strong>to</strong> bus systems that providehigher quality service compared <strong>to</strong> standard local bus service. PotentialBRT strategies include a wide variety of options: upgraded vehicles andstations, improved scheduling with faster more frequent service usuallyat least every 10-15 minutes all day, and infrastructure improvementsgiving buses their own right-of-way (ROW) separate from congestion.Strategies for insulating buses from traffic include dedicated, off-streetand/or grade-separated bus lanes, traffic engineering improvementssuch as traffic signal preemption, “queue jumpers,” etc. The objectivebehind BRT is <strong>to</strong> provide transit users with as close <strong>to</strong> the high speedservice of rail transit as possible, while keeping capital costssignificantly lower with greater operational flexibility.BRT may be a worthwhile investment in East Contra Costa Countysince eBART/BART rail extensions will take many years <strong>to</strong> construct,and even with completion of these extensions, the vast majority ofEast County residents will be outside easy walking distance <strong>to</strong> stations.By considering BRT, <strong>Tri</strong> <strong>Delta</strong> <strong>Transit</strong> may be able <strong>to</strong> provide highquality transit <strong>to</strong> within walking distance of a significant portion ofresidents compared <strong>to</strong> eBART/BART. Even with proposed transi<strong>to</strong>rienteddevelopment (TOD) densities, about 90% of residents wouldstill live more than a half mile from an eBART station. In turn, this maystimulate bus transit ridership <strong>to</strong> levels substantially higher thanpossible with the current local bus system and rail transit alone.BRT ExamplesBus Rapid <strong>Transit</strong> capital costs can range from several hundredthousand dollars per mile in the case of surface BRT service on existingarterial (non-freeway) streets mainly through improved s<strong>to</strong>ps andtraffic signal priorities, <strong>to</strong> tens of millions per mile with full gradeseparation comparable <strong>to</strong> rail rapid transits. There are numerousexamples of BRT systems in the United States that have taken low,medium and high cost approaches.The least expensive BRT systems tend <strong>to</strong> operate on existing streetswith little or no dedicated ROW or lanes for buses, with mostinvestment in improved vehicles, upgraded bus s<strong>to</strong>ps and traffic signalpreemption. Such “rapid bus” examples on mixed flow arterialroadways in Northern California include AC <strong>Transit</strong>’s Route 72R on SanPablo Avenue between down<strong>to</strong>wn Oakland, Emeryville, West Berkeley,Albany, El Cerri<strong>to</strong>, and Richmond; and Valley <strong>Transit</strong> Authority’s Route22 along El Camino Real between down<strong>to</strong>wn San Jose, Santa Clara,Sunnyvale, and Palo Al<strong>to</strong>. Sacramen<strong>to</strong> Regional <strong>Transit</strong>’ Route 50operates along S<strong>to</strong>ck<strong>to</strong>n Blvd. between down<strong>to</strong>wn Sacramen<strong>to</strong> andFlorin Mall; the San Joaquin Regional <strong>Transit</strong> District’s operates a newBRT route between north-central and down<strong>to</strong>wn S<strong>to</strong>ck<strong>to</strong>n. The Los63
Angeles Metropolitan Transportation Authority also operates anextensive network of surface “Metro Rapid” BRT routes throughout theLos Angeles Basin. Most of these systems have experienced patronageincreases of 20%-30% compared <strong>to</strong> previous local bus service. TheLivermore-Amador Valley <strong>Transit</strong> Authority (LAVTA) is in the process ofdeploying a $15 million surface BRT route that operates in mixed trafficconnecting Dublin, the Dublin-Pleasan<strong>to</strong>n BART station and Livermore.Eugene-Springfield EmXThis 4.5 mile, $23 million BRT line is operated by the Lane <strong>Transit</strong>District (LTD), between Springfield and Eugene, via the University ofOregon. About two-thirds of the EmX route has exclusive bus lanes, orabout $10 million per mile excluding mixed-traffic portions of thecorridor. Prior <strong>to</strong> the start of EmX service, the former LTD route in thiscorridor operated every 15 minutes, serving approximately 2,800 dailyboardings. Since EmX startup in December 2006, patronage has grown<strong>to</strong> more than 4,500 daily boardings. EmX buses operate every 10minutes on weekdays, and every 20 minutes evenings and weekends.S<strong>to</strong>ps are located on average 0.5 miles apart. EmX buses require 16-18 minutes each way, averaging 14-17 m.p.h.Figure 4.1 Eugene-Springfield EmX Bus Rapid <strong>Transit</strong>EmX has a number of unique features not used by other BRT projects.The most distinctive is that the six cus<strong>to</strong>m-built, $950,000 EmX buseshave wide boarding doors on both the right (“curb”) side and left side.Figure 4.2 Lane <strong>Transit</strong> District’s EmX BRT Vehicle64
While left-hand doors reduce EmX vehicle seating, the design allowsmuch greater station design flexibility, particularly in areas with limitedspace. Combined with some sections of exclusive, single bus lanes thatare used in both directions, a number of EmX stations were built withonly one boarding platform but are served both eastbound andwestbound. See Figure 4.3; note “Bus Only” pavement markings inboth directions (that <strong>to</strong> right is oriented westbound). One disadvantageof the two-way single lanes is that EmX service restricted <strong>to</strong> 10-minutefrequencies; installing an additional exclusive lane would be costly.Figure 4.3 EmX Single Platform Station Looking EastboundFigure 4.4 EmX Approaching the Center-Island Agate Station65
A few EmX stations were also built in the median of Franklin Boulevardwith a “center island” design common <strong>to</strong> most rail systems. ThePittsburg/Bay Point BART station has a center island between thetracks. This design saves considerable space compared <strong>to</strong> conventional“right hand only” s<strong>to</strong>ps, and also reduced capital expenses somewhat.Figure 4.4 shows a center island EmX station, along with the uniqueconcrete guide way design that tends <strong>to</strong> discourage au<strong>to</strong>mobiles fromdriving on the bus way. The station platform is on the left side of thiseastbound vehicle, and it is also on the left side of westbound vehicles,on the right of the pho<strong>to</strong>.Currently, EmX operations over the “single lane” segments arecontrolled by a cus<strong>to</strong>m-designed signal system, similar <strong>to</strong> that used byrail systems on single-track stretches. Currently, no fares are chargedon EmX, partly as an introduc<strong>to</strong>ry marketing incentive but also due <strong>to</strong>the small size of the operation, with a maximum four EmX vehicles inservice during weekdays and two evenings and weekends.Figure 4.5 illustrates the low floor, level boarding used by EmX and anumber of other BRT projects.Figure 4.5 EmX Vehicle Low Floor Level BoardingLas Vegas Metropolitan Express (MAX)This 7.5 mile, $20.3 million BRT route began operation in June 2004along North Las Vegas Boulevard North between the Down<strong>to</strong>wnTransportation Center in down<strong>to</strong>wn Las Vegas, North Las Vegas andNellis Air Force Base. Of the 7.5-mile route length, 4.5 miles are insurface lanes dedicated <strong>to</strong> MAX buses. There are 22 stations, 11 ineach direction.66
According <strong>to</strong> the FTA report “Las Vegas Metropolitan Area Express(MAX) BRT Demonstration Project Evaluation (August 2005)”:MAX is an advanced rubber-tire rapid transit system that integratessome design and operational characteristics typically associated withLight Rail <strong>Transit</strong> (LRT) in<strong>to</strong> a flexible mass transit vehicle. MAXsystem features include:• A dedicated transit only lane• Optical guidance system (OGS)• 100% low floor vehicles• In-vehicle bicycle racks• Enhanced passenger stations, with elevated platforms for levelboarding• Multiple entry boardings• Traffic signal priority (TSP)• Au<strong>to</strong>mated Passenger Counters (APCs)• Off-board fare collection• CAD/AVL systemFigure 4.6 Las Vegas MAX Route67
MAX is part of the Citizens Area <strong>Transit</strong> (CAT) system, with 48 busroutes serving the Las Vegas Valley and Clark County. In 2004, CAToperated over 1.2 million vehicle service hours and carried 52 millionpassenger trips. RTC Southern Nevada contracts out all fixed routetransit services under CAT <strong>to</strong> ATC/Vancom, one of the nation’s largesttransit service providers. As part of the CAT system, ATC Vancom alsooperates and maintains MAX.The MAX vehicle is similar <strong>to</strong> those operated on the Eugene-SpringfieldEmX route (Figure 4.7), but lacks left-hand doors and also operateswith an optical guidance system. CAT purchased a <strong>to</strong>tal of 10 FrenchdesignedIrisbus vehicles at a cost of $1 million each. A <strong>to</strong>tal of eightMAX buses are in service during weekdays, providing 12-minutefrequencies between 5:00 a.m. and 7:00 P.M., and every 15 minutesuntil the end of service around 10:00 P.M. The end-<strong>to</strong>-end operatingtimes are approximately 28 minutes northbound and 31 minutesouthbound. The optical guidance system is currently not in use due <strong>to</strong>its complexity and the inability <strong>to</strong> keep the bus lanes clean so theoptical system can read the pavement markings.Figure 4.7 Las Vegas MAX BRT VehicleUnlike EmX, the Las Vegas MAX system has implemented off-vehiclefare collection. See Figure 4.8 for an example of a MAX fare machine.As pointed out by the FTA report:All 22 MAX stations have Ticket VendingMachines (TVMs)…that enable passengers <strong>to</strong>purchase a valid fare prior <strong>to</strong> boarding MAX.Figure 4.8Ticket vending machines accept both cash andcredit/debit cards and dispense a variety of faremedia. The base adult fare is $1.25. CAT offers avariety of multi-day fare pass media. Day passescan be purchased for $5.00 at the farebox orTVMs located at stations and the Down<strong>to</strong>wnTransportation Center. CAT also offers a 30-dayCAT pass for $30.00. Transfers between CATroutes are free. The same fare structure isapplied <strong>to</strong> MAX as the CAT system as a whole.68
Figure 4.9 Typical MAX StationEach station cost approximately $265,000 each <strong>to</strong> construct. A typicalstation platform is shown in Figure 4.9. Unlike EmX stations in Eugene-Springfield, each MAX station has a large station canopy <strong>to</strong> protectpatrons from the intense sun experienced in desert conditions.Introduction of MAX service in July 2004 increased <strong>to</strong>tal transitridership in the Las Vegas Boulevard North corridor by 25% during thefirst six months <strong>to</strong> more than 10,000 boardings daily for both Route113 and MAX, as shown in Figure 4.10.According <strong>to</strong> the FTA report:Prior <strong>to</strong> MAX, the 7.5 mile segment of Las Vegas Boulevard North wasserved by CAT Route 113, one of RTC’s most heavily patronized routes.In the twelve months prior <strong>to</strong> MAX’s opening in July 2004, Route 113averaged approximately 7,300 passengers per day. In the monthsafter MAX’s opening, there was steady and gradually increasingridership defection from Route 113 <strong>to</strong> MAX, as the transit cus<strong>to</strong>merbase gained more familiarity with the MAX system.Figure 4.10 Las Vegas MAX Ridership Trends69
Off-Street Bus ways with Level CrossingsThe Eugene-Springfield EmX and Las Vegas MAX BRT projects operatein a combination of mixed flow traffic and separate bus lanes within anexisting arterial street. This section discusses two BRT systems thattake a different approach, with ground-level bus ways on off-streetrights-of-way with level grade crossings similar <strong>to</strong> most light rail transit(LRT) systems.San Fernando Valley Orange Line Bus wayThe 14-mile, $300 million+ Orange Line bus way in Los Angeles’s SanFernando Valley opened on Oc<strong>to</strong>ber 90, 2005. The Orange Line isoperated by the Los Angeles Metropolitan Transportation Authority(MTA), operating every 3-5 minutes during peak periods, and every10-15 minutes at other times.This route reached its projected Year 2030 patronage of approximately24,000 daily boardings by April <strong>2007</strong>, and now operates at itsmaximum feasible capacity. Bus way capacity is essentially limited bythe large number of signalized level crossings with major north-southarterials severely limits the bus way’s capacity; the maximumfrequency that ensures reliable service without bus “bunching” hasproven <strong>to</strong> be every 3 minutes, i.e., twice the typical traffic signal cycleat each intersection. While more frequent service is technically possibleon the Orange Line Bus way, buses operating less than every 3minutes on any given route tend <strong>to</strong> experience delays at signals. Busheadways are no longer evenly spaced and buses often “bunch,”leading <strong>to</strong> increasingly uneven frequencies that degrade servicequality.The many mixed traffic Metro Rapid routes operated by the LosAngeles Metropolitan <strong>Transit</strong> Authority (MTA) in the Los Angeles Basinhave also experienced this frequency limitation phenomenon. The largenumber of bus way crossings also limits the bus way’s operatingspeeds. Original plans projected 28-minutes travel time over thelength of the bus way, but in practice running times are usually 40-45minutes. After a spate of accidents, crossing speeds were reduced <strong>to</strong>10 m.p.h. See Figure 4.13 for a typical Orange Line crossing of a majorarterial.Figure 4.11 Orange Line Bus way Route70
Figure 4.12 Orange Line BRT VehicleFigure 4.13 Orange Line Level Crossing71
A proposed 6-mile, $135 million extension north from Warner Center<strong>to</strong> the Chatsworth Metrolink (commuter rail) station was approved bythe LAMTA board on September 28, 2006. A local transit advocacygroup, The <strong>Transit</strong> Coalition, has also proposed a 3.5 mile northernextension of the bus way from the east end of the Orange Line at theNorth Hollywood Metrorail (heavy rail) station.South Miami-Dade County Bus wayThe first phase of the South Miami-Dade County Bus way opened in1997 over a $60 million, 8.5-mile route operating southwest from theDadeland South Metrorail station <strong>to</strong> Florida City. A 5-mile extensionopened in 2005, and an additional 6.5-mile extension is likely <strong>to</strong> openin <strong>2008</strong>.Figure 4.14 South Miami-Dade Bus way Route72
The Bus way has suffered from many accidents, which has forcedbuses <strong>to</strong> slow down <strong>to</strong> 15 MPH. Operating speeds are comparable <strong>to</strong>the Orange Line Bus way in Los Angeles. Unlike the Orange Line,several routes use the Bus way, averaging 8,000 daily boardings (2002).Grade Separated Bus waysFully grade-separated bus ways have been built in a handful of NorthAmerican cities including the El Monte Bus way in Los Angeles, threebus ways in Pittsburgh and the well-known Ottawa <strong>Transit</strong>way inCanada. According <strong>to</strong> Wikipedia, the El Monte Bus way:Opened in 1974 <strong>to</strong> buses only, then became open <strong>to</strong> carpools in 1976.The eastern terminus of the bus way was near El Monte Bus Station inEl Monte at Baldwin Avenue, until it was extended 2 miles in 2005 <strong>to</strong> I-605. The western terminus of the bus way is at Alameda St. nearUnion Station. The resulting carpool roadway is one of the fewindisputably successful mass transit projects undertaken in SouthernCalifornia. Bus ridership is approximately 18,000 [boardings per day],and in addition <strong>to</strong> the 100 buses an hour along the bus way duringpeak periods, the roadway carries 1,600 carpools and vanpools duringpeak hours.Bus service is provided with a mix of Foothill <strong>Transit</strong> and Metro Expressbuses. There are two classes of bus service on the bus way: MetroExpress and Foothill <strong>Transit</strong>'s Silver Streak and Line 481 service makeall bus way s<strong>to</strong>ps and allow boarding and alighting at all s<strong>to</strong>ps alongthe route, while Foothill <strong>Transit</strong>'s Commuter Express service only dropsoff passengers heading westbound during the morning rush hour andonly boards passengers heading eastbound during the afternoon rushhour; Commuter Express buses do not s<strong>to</strong>p at El Monte Bus Station,continuing along the HOV lanes of I-10.Bus service operates from various points in the San Gabriel Valley andPomona Valley, as well as the San Bernardino County cities of Chinoand Montclair, for those going <strong>to</strong> and from Down<strong>to</strong>wn Los Angeles;Foothill <strong>Transit</strong> Line 481 continues <strong>to</strong> Korea <strong>to</strong>wn <strong>to</strong> the Wilshire/Western Red Line Station. The El Monte Bus Station is believed <strong>to</strong> bethe busiest bus terminal west of the Mississippi River, although the SanFrancisco Transbay Terminal may be busier.Figure 4.15 El Monte Bus way Map73
The first bus way constructed in Pittsburgh, Pennsylvania was the $115million, $6.8 mile Martin Luther King, Jr. East Bus way that opened inFebruary 1983 between Wilkinsburg and down<strong>to</strong>wn Pittsburgh. Thisfacility was constructed parallel <strong>to</strong> a major railroad right-of-way, andcarries about 28,000 daily passengers. Ridership projections made inthe 1970’s predicted up <strong>to</strong> 80,000 daily passengers on the bus way,but the Pittsburgh area continued <strong>to</strong> decline in population and therequired level of bus service has never been provided. Prior <strong>to</strong> the busway transit trips required 45 minutes from Wilkinsburg <strong>to</strong> down<strong>to</strong>wn,compared <strong>to</strong> 15 minutes after the bus way opened. In 2003 a $68.8million, 2.3 mile, 3-station bus way extension opened <strong>to</strong> Swissdale.Figure 4.16 Pittsburgh Martin Luther King, Jr. East Bus wayThe $27 million South Bus way was the first bus way <strong>to</strong> open inPittsburgh in 1977. This 4-mile, 9 s<strong>to</strong>p facility carries about 11,000daily passengers on 552 daily bus trips operated on 16 express busroutes between South Hills suburbs and down<strong>to</strong>wn, and shares atunnel with Pittsburgh’s light rail system. Original ridership estimatespredicted around 30,000 daily passengers, but Pittsburgh’s ongoingpopulation and employment declines have ensured that the originalridership estimates will probably never be met.74
Figure 4.17 Pittsburgh South Bus wayThe 5-mile, $326.8 million West Bus way in Pittsburgh opened inSeptember 2000, and currently carries more than 9,500 dailypassengers on 413 weekday bus trips operated on 11 routes. Thisfacility has six on-line stations with 560 park and ride spaces, and sixremote sites with a <strong>to</strong>tal of 1,000 parking spaces.The original patronage projections for the West Bus way estimatedabout 50,000 daily passengers on a longer and more elaborate facility.Major elements in the overall program, including a full bus waytreatment in<strong>to</strong> down<strong>to</strong>wn Pittsburg, were deferred due <strong>to</strong> costescalation. The West Bus way has the distinction of being one of themost expensive bus ways ever built in the U.S. of $65 million per mile,mainly due <strong>to</strong> the cost of grade-separated construction in the very hillyareas of Western Pennsylvania and <strong>to</strong>tal rehabilitation of an oldrailroad tunnel.75
Figure 4.18 Pittsburgh West Bus way, as BuiltFor a detailed analysis/evaluation of the Ottawa, Canada bus way, seewww.publictransit.us/ptlibrary/specialreports/sr8.OttawaTransi t.pdf.BRT Congestion-Avoiding StrategiesThe least expensive BRT projects operate in mixed traffic with signaland other traffic engineering priorities. Examples previously discussedinclude AC <strong>Transit</strong> Route 72R along San Pablo Avenue, a number ofMetro Rapid routes in the Los Angeles Basin, Route 22 along El CaminoReal in Santa Clara County, Route 50 along S<strong>to</strong>ck<strong>to</strong>n Boulevard inSacramen<strong>to</strong>, and Route 40 in S<strong>to</strong>ck<strong>to</strong>n. Other examples include threeB-Line BRT routes in Vancouver, British Columbia and proposals <strong>to</strong>extend mixed traffic BRT routes in Los Angeles, Oakland, San Diegoand other West Coast cities.76
Mixed traffic BRT routes with transit priorities and longer s<strong>to</strong>p spacingcompared <strong>to</strong> local service s<strong>to</strong>ps speeds up service, but are still oftensubject <strong>to</strong> congestion delays though such BRT routes are more reliablethan local bus routes. In some cities, transit priorities include “queuejumpers” and other traffic engineering treatments designed <strong>to</strong> favorbuses, and in selected areas with exclusive lanes designated bypavement markings such as along several major bus routes in<strong>to</strong>down<strong>to</strong>wn San Francisco. However, pavement markings by themselvesare no<strong>to</strong>riously hard <strong>to</strong> enforce against double-parking and otherau<strong>to</strong>mobile encroachment.A handful of cities have resorted <strong>to</strong> considerably more costly separatebus guide ways in boulevard medians, or exclusive lanes indicated byspecial pavement markings and textures on surface streets incongested areas, with mixed flow operations elsewhere. The Eugene-Springfield EmX BRT project has developed a guide way design that ismore likely <strong>to</strong> discourage illegal usage by au<strong>to</strong>mobile drivers than theLas Vegas MAX BRT, which mainly relies on exclusive bus lanesindicated by road striping, as opposed <strong>to</strong> distinct EmX lanes designatedby separate, concrete lanes and curbed lanes distinct from the mixedflow traffic lanes (Refer <strong>to</strong> Figure 4.4). As previously mentioned, abouttwo-thirds of the 4.5 mile of EmX route is separated from mixed flowtraffic. The Las Vegas MAX route has a similar mix of designated buslanes and mixed flow operation. The Vancouver B-Line <strong>to</strong> theRichmond suburb of Richmond also includes long portions of boulevardmedian bus lanes, but unlike Eugene and Portland, operatesconventional vehicles.A number of grade-level boulevard median bus ways are operated byvery high volume BRT systems in Curitiba, Brazil, Lima, Peru, Bogota,Columbia and other South American cities. However, these examplesaren’t directly applicable <strong>to</strong> the U.S. for several reasons: (1) the U.S.has much higher labor and capital costs so the comparison with railtransit is at considerably different price points (2) compared <strong>to</strong> SouthAmerica, it is probably not politically possible <strong>to</strong> obtain nearly as muchspace for buses as was possible in Bogota, where an authoritariangovernment was able <strong>to</strong> construct many stretches four exclusive buslanes wide, e.g., exclusive bus expressways! Existing and potential BRTvolumes in South America are one <strong>to</strong> two orders of magnitude greaterthan the U.S. due <strong>to</strong> very high urban densities, and (3) and U.S.residents, given the widely available choice of driving, will not <strong>to</strong>leratethe level of transit crowding that transit dependents in less affluentcountries such as Brazil, Peru and Columbia must endure.The next, generally more expensive step up in separating BRT vehiclesfrom mixed flow congestion is constructing bus ways along off-streetalignments that have at-grade crossings with cross streets. The mostprominent examples include the Orange Line Bus way in Los Angelesand the South Miami-Dade Bus way in South Florida. An earlierexample is Philadelphia’s Ardmore Bus way in the western suburbs,which was converted from a former trolley line in 1967.Generally, the most expensive but also most effective strategy forseparating BRT operations from traffic congestion is constructing fully77
grade-separated bus ways. This kind of bus way tends <strong>to</strong> have thegreatest ridership, as demonstrated by the bus ways in Pittsburgh, theOttawa <strong>Transit</strong>way, and the El Monte Bus way in Los Angeles. Avariation on grade-separation is operation of extensive express busservices over high occupancy vehicle (HOV) lanes along freeways.Numerous examples exist in the Bay area including <strong>Tri</strong> <strong>Delta</strong> <strong>Transit</strong>Route 300; the Vallejo Baylink express buses along I-80 serving the ElCerri<strong>to</strong> Del Norte BART station and supplementing the Baylink ferries;the Golden Gate <strong>Transit</strong> commuter bus network serving Sonoma andMarin County commuters <strong>to</strong> down<strong>to</strong>wn San Francisco; AC <strong>Transit</strong>transbay buses; Samtrans express buses operating along U.S. 101;and a number of other operations. Numerous examples also exist inother U.S. cities, the most prominent in New York City and New Jersey(e.g., the Lincoln Tunnel bus lanes in<strong>to</strong> the Port Authority BusTerminal); the Shirley Highway from Virginia in<strong>to</strong> Washing<strong>to</strong>n, D.C.;the Hous<strong>to</strong>n <strong>Transit</strong> ways serving buses <strong>to</strong> down<strong>to</strong>wn Hous<strong>to</strong>n andvery large volumes of carpools and vanpools; HOV lanes/bus ways inDenver; and other U.S. cities.One drawback of HOV lanes along freeways for transit service is thatmidday transit volumes will be relatively low, mainly because freewaysare not located optimally for transit-oriented, walk able development,and such “all day” destinations favorable <strong>to</strong> transit are often wellbeyond walking distance from freeway alignments even in cases wheretransit stations are provided.BRT Options for Eastern Contra Costa CountyDetermining what BRT options may be feasible in the <strong>Tri</strong> <strong>Delta</strong> <strong>Transit</strong>service area first requires understanding the context of local transittravel patterns. According <strong>to</strong> the analysis in Table 4.1 developed fromon-board survey origin and destination data for “linked” transit trips,about 30% of <strong>Tri</strong> <strong>Delta</strong> <strong>Transit</strong> patrons stay within their immediatecommunity of origin, about 30% begin and end their trips at BART ortransfer between routes at BART, and the remaining 40% travelbetween communities within East County. These patterns, includingtrips <strong>to</strong> and from the Pittsburg/Bay Point BART station are showngraphically in Figure 4.19.Table 4.1 Estimated Weekday <strong>Transit</strong> <strong>Tri</strong>p Origins & DestinationsFROM / TO Brentwood Oakley Antioch Pittsburg Bay Point BART Other TOTALBrentwood 263 56 78 78 11 56 17 559Oakley 70 112 48 34 0 31 0 295Antioch 95 48 1,190 405 119 309 214 2,380Pittsburg 133 40 226 479 133 293 67 1,371Bay Point 35 0 70 210 140 280 35 770BART 120 40 519 333 253 0 67 1,332Other 0 0 168 84 38 0 0 290TOTAL 716 296 2,299 1,623 694 969 400 6,99778
Figure 4.19 <strong>Tri</strong> <strong>Delta</strong> <strong>Transit</strong> Fixed Route <strong>Tri</strong>p PatternsAs expected <strong>Tri</strong> <strong>Delta</strong> <strong>Transit</strong> trip patterns between communitiesmostly occur along Highway 4. The vast majority of transit tripsbetween communities and <strong>to</strong>/from Pittsburg/Bay Point BART occuralong this corridor, primarily on surface streets that parallel Highway 4.Patronage estimates of 10,000 <strong>to</strong>tal boardings, and 5,000-6,000 netnew transit boardings, for the proposed 9-mile eBART/BART railextension along Highway 4 <strong>to</strong> Hillcrest Avenue in Antioch also appear<strong>to</strong> be plausible, considering current bus volumes.However, <strong>to</strong>tal bus patronage volumes between Antioch andBrentwood are only one-eighth of the transit traffic between BART andAntioch, and between Antioch and Brentwood, only one-quarter theBART-Antioch travel volume. Based on this, the most productiveapplication of BRT concepts appears <strong>to</strong> be generally east of Antioch,particularly in <strong>2008</strong> after Highway 4 bypass opens.A first step <strong>to</strong>wards BRT-type service would be <strong>to</strong> restructure Route300 <strong>to</strong> provide faster service between Brentwood, Hillcrest Park andRide, and Pittsburg/Bay Point BART once the Highway extension opens.Operation of Route 300 service via this new roadway is likely <strong>to</strong> reduceinbound travel times by 12-15 minutes, and 15-20 minutes outbound,particularly in the congested afternoon peak period. It appears possible<strong>to</strong> provide 30-minute peak period frequencies between Brentwood andBay Point BART, with operating times of 40-45 minutes, and a similarlevel of service <strong>to</strong> Oakle y. Another possib ility would be for t he BARTBRT-type feeder routes serving Oakley an d Brentwood <strong>to</strong> skip(“leapf rog”) the Hillcrest Park & Ride Lot al<strong>to</strong>get her, serving thatlocation with a new route o r a peak period extension <strong>to</strong> BART of anexisting local route.Midday, evening and weeke nd service <strong>to</strong> both communiti es couldoperate on 60-minute headways, an d /or in a two way loop via theHighway 4 freeway, Main Street in Oakley, Brentwood Boulevard,Balfour Road returning <strong>to</strong> the Hillcrest Park and Ride lot via SR4.79
Multiple Transfers & Overall <strong>Transit</strong> Patronage PotentialWhile construction costs for the proposed eBART line between thePittsburg/Bay Point BART station are estimated <strong>to</strong> be about half ($400million) that of an extension using conventional BART technology($800-$900 million), a conventional BART extension would haveadvantage of a direct, one-seat ride between proposed stations atRailroad Avenue in Pittsburg, a future Somersville Road station, and atHillcrest Avenue. For those using <strong>Tri</strong> <strong>Delta</strong> <strong>Transit</strong> buses <strong>to</strong> accessregional rail service originating in communities east of Pittsburg, theeBART proposal would require a minimum of two transfers in eachtravel direction.While many heavily patronized transit systems such as the SanFrancisco Municipal Railway or Toron<strong>to</strong> <strong>Transit</strong> Commission (TTC) inCanada have very large volumes of passengers who transfer twice oreven more often, it is counterproductive <strong>to</strong> force passengers <strong>to</strong>transfer if unnecessary. Given this potential drawback of eBART <strong>to</strong>existing and future <strong>Tri</strong> <strong>Delta</strong> <strong>Transit</strong> riders originating east of Pittsburg,it is reasonable <strong>to</strong> expect that, initially, most eBART users will eitherpark & ride or would be dropped off rather than take the bus.In the short-term, a few riders would also be “walk-ins” coming fromwithin a 0.5 mile radius of the eBART stations; in the longer run, thenumber of walk-in eBART passengers would grow dramatically astransit-oriented development occurred around the stations. However,only a moderate share of eBART ridership is likely <strong>to</strong> transfer frombuses due <strong>to</strong> the requirement <strong>to</strong> transfer again at Pittsburg/Bay PointBART. A majority of those transferring at eBART stations are likely <strong>to</strong>be between local routes.BRT Implementation StrategyThere are a number of BRT/express bus strategies that warrant muchmore detailed study beyond the scope of an SRTP. However, thisdocument suggests a number of these strategies that may haveparticular utility for <strong>Tri</strong> <strong>Delta</strong> <strong>Transit</strong>. These recommendations arebriefly discussed in the remainder of this chapter.First, soon after the late <strong>2007</strong> opening of the Highway 4 extension <strong>to</strong>East Antioch and Brentwood, Route 300 should be restructured in<strong>to</strong> aline with two branches: one serving Brentwood more directly withdramatically reduced running times, and the second branch continuing<strong>to</strong> serve Oakley. It should be possible <strong>to</strong> run more peak period servicewith the same number of vehicles currently assigned <strong>to</strong> <strong>Tri</strong> <strong>Delta</strong><strong>Transit</strong> Route 300, e.g., every 30 minutes on both the Brentwood andOakley branch, with a combined headway of every 15 minutes betweenHillcrest Avenue and the Pittsburg/Bay Point BART station. To minimizetravel times, a preferred option would be <strong>to</strong> “leapfrog” e.g., skip, theHillcrest Park & Ride Lot during peak hours.Second, transit centers and park and ride lots should be constructedrelatively soon at potential eBART station sites, even at future stationlocations that may not receive eBART service for decades. In addition80
<strong>to</strong> the proposed Railroad Avenue and Hillcrest Avenue eBART stations,transit centers should be constructed at Somersville Road, at theHighway 4 extension and Lone Tree Way in southeast Antioch, andexpand the existing Brentwood Park & Ride in<strong>to</strong> a full transit centerwith a sufficient park & ride spaces <strong>to</strong> meet likely demand. It isimportant <strong>to</strong> purchase land, determine each facility’s location andminimize capital costs at an early date. Each proposed transit centershould also include easy bus access <strong>to</strong>/from local arterial roadways,but also easy access on/off Highway 4, for the reasons enumeratedabove. <strong>Tri</strong> <strong>Delta</strong> <strong>Transit</strong> should work with BART and the Contra CostaTransportation Authority (CCTA) <strong>to</strong> ensure that these four proposedtransit centers are constructed in a timely manner. Such transfercenters along with reduced travel times may also make express buses<strong>to</strong> Discovery Bay and Byron feasible.Third, <strong>Tri</strong> <strong>Delta</strong> <strong>Transit</strong> should work with the Contra CostaTransportation Authority (CCTA) additional funding should be obtained<strong>to</strong> extend the Highway 4 bypass HOV lanes another six miles <strong>to</strong> BalfourRoad in Brentwood. This $60- $80 million project would not onlyenhance BRT service in the long run, but carpoolers and vanpoolerswould also benefit. This facility would allow BRT vehicles <strong>to</strong> travel non-BART station in 25-30 minutes, less than half current travel times.s<strong>to</strong>p between the Brentwood transit center and the Pittsburg/Bay PointComparable time-savings are also possible from the area around LoneTree Way.Fourth, the possibilities for bus rapid transit on arterial roadways <strong>to</strong>speed up local the most heavily used <strong>Tri</strong> <strong>Delta</strong> <strong>Transit</strong> routes shouldnot be neglected, e.g., following the Eugene/Springfield and Las Vegasmodels in addition <strong>to</strong> the freeway-oriented BRT discussed above. WhileEast County traffic is likely <strong>to</strong> be less congested once Highway 4expansion of Highway 4 from Pittsburg through Antioch is completed,arterial-based BRT routes are still likely <strong>to</strong> require separated bus right-backups at traffic signals, separate lanes similar <strong>to</strong> Eugene-Springfieldand Las Vegas in congested areas and/or <strong>to</strong> bypass the mos<strong>to</strong>f-way over 10% <strong>to</strong> 20% of potential BRT routes, in addition <strong>to</strong>standard signal priorities and BRT s<strong>to</strong>p upgrades. This most likelywould be in the form of “queue jumpers” at locations with significantcongested segments of major streets, dedicated bus entries <strong>to</strong> transitcenters and key traffic genera<strong>to</strong>rs, freeway access, etc.A cursory examination reveals a number of corridors that may besuitable for arterial street BRT:• Pittsburg/Bay Point BART <strong>to</strong> Antioch via Leland, SomersvilleRoad, down<strong>to</strong>wn Antioch, A Street, East 18 th Street, <strong>to</strong> HillcrestAvenue eBART station/transit center.• Pittsburg/Bay Point BART <strong>to</strong> Antioch via Willow Pass Road,down<strong>to</strong>wn Pittsburg, East 14 th Street, a new BRT connec<strong>to</strong>r <strong>to</strong>Century Boulevard, then <strong>to</strong> future Somersville Road eBARTstation and transit center.81
• From Somersville Road future eBART and transit center <strong>to</strong>Southeast Antioch and perhaps Brentwood via Highway 4, LoneTree Way, Lone Tree Way/Highway 4 transit center, Fair<strong>view</strong>Avenue, and Balfour Road <strong>to</strong> Brentwood transit center.• From Somersville Road transit center <strong>to</strong> Hillcrest transit centervia Highway 4, new BRT connection <strong>to</strong> Oakley Road, down<strong>to</strong>wnOakley, then Brentwood Boulevard <strong>to</strong> Brentwood transit center.Fifth, improved vehicle designs such as the EmX design with left-sidedoors may maximize BRT design flexibility as it has in Eugene-Springfield. While detailed BRT design issues will be site-specific, theability <strong>to</strong> use platforms on either side of a bus may allow installation ofstations in locations otherwise precluded due <strong>to</strong> narrow rights of way,otherwise awkward traffic circulation, etc. Potential BRT patronagecould also warrant purchase of articulated vehicles (there is no designlimitations on 40-foot vehicles with left-sided doors, such as used bystandard electric trolley coaches in a Bos<strong>to</strong>n tunnel). See Figure 4.20.Figure 4.20 EmX Vehicle with Left-Side DoorsFinally, use of BRT vehicles with doors on both sides of the vehicleincreases the feasibility and cost-effectiveness of an elevated BRTstation over the current BART tail tracks at the Bay Point station, withdirect escala<strong>to</strong>r access <strong>to</strong> the BART station platform. With only rightsidedoors, a BRT station would have <strong>to</strong> be at least 60 feet wide; thecurrent BART right-of-way is only 50-feet wide. By staggering the BRTarrival and departure areas, with left-hand alighting and boarding froman island platform, a structure less than 40 feet wide is possible.Together with 2 bus bays for alighting and 2 boarding bays–with a BRTbridge <strong>to</strong> the existing bus transfer area <strong>to</strong> allow a second s<strong>to</strong>p forconnections <strong>to</strong> local routes and sufficient space for BRT vehiclelayovers—this concept would be much less massive than a facilityconstructed <strong>to</strong> conventional roadway standards. While such a conceptwould require about 0.6 miles of two-way elevated bus way connecting<strong>to</strong> the existing HOV lanes, it may be worth the $100 million cost+ due<strong>to</strong> a capacity of over 100 bus arrivals and 100 departures per hour,and significantly shorter access times <strong>to</strong> the BART station platform,compared <strong>to</strong> walking times from the existing bus transfer facility.Please refer <strong>to</strong> Figure 4.21 for a drawing of this concept.82
Figure 4.21 Elevated BRT Station Concept at Pittsburg/Bay Point BART83
This page is intentionally blank84
CHAPTER5Operations <strong>Plan</strong> and BudgetThis chapter presented the recommended 10-year transit operationsplan for <strong>Tri</strong> <strong>Delta</strong> <strong>Transit</strong>. Based on geography and demographicsalone, significant fixed route service expansion seems warranted <strong>to</strong>address growing commute travel congestion on Highway 4, rapiddevelopment in southeast Antioch and communities east and south <strong>to</strong>the Alameda County line, and in-fill residential and commercialactivities occurring in the mature communities of Antioch, Pittsburgand unincorporated Bay Point. Eastern Contra Costa County leads theBay Area in the pace of residential growth projected through 2020despite the current slump in the housing market. The once-ruralcommunities of Brentwood, Byron, Discovery Bay and Oakley areexperiencing dramatic suburban expansion more or lesssimultaneously, while densities in Bay Point and other developedcommunities are also increasing.Recommended service changes and improvements are based on thefindings described in Chapter 3 and the potential of bus rapid transit(BRT) described in Chapter 4, and take in<strong>to</strong> account the variousconstraints on the transit system as well as available opportunities.This chapter also provides the basis for the recommended Capital <strong>Plan</strong>discussed in Chapter 6. Service recommendations have also beendeveloped consistent with Federal <strong>Transit</strong> Administration (FTA) andMetropolitan Transportation Commission (MTC) guidelines requiring a<strong>Short</strong> <strong>Range</strong> <strong>Transit</strong> <strong>Plan</strong> <strong>to</strong> be “financially constrained,” e.g., with abalanced budget every year.The proposed operating budget and projections is discussed at the endof this Chapter. The major assumption is that the <strong>to</strong>tal level of busservice, as measured by revenue vehicle hours (RVH), will remain atcurrent levels over the 10-year period.<strong>Tri</strong> <strong>Delta</strong> <strong>Transit</strong> Strengths & WeaknessesBased on the findings outlined in Chapter 3, the major strengths of <strong>Tri</strong><strong>Delta</strong> <strong>Transit</strong> include:• <strong>Tri</strong> <strong>Delta</strong> <strong>Transit</strong> fixed route operating performance iscomparable <strong>to</strong> other transit systems operating in dispersed,low-density suburban environments. Overall occupancy rateswere typical of such areas, given the nature of the service area.• <strong>Tri</strong> <strong>Delta</strong> <strong>Transit</strong> has reasonable operating expenses. in the midrangeof peer suburban transit systems in the Bay Area.Average utilization rates are comparable <strong>to</strong> other suburban bussystems, but are generally lower than “mainline” transitsystems catering <strong>to</strong> longer trips such as BART.85
• <strong>Tri</strong> <strong>Delta</strong> <strong>Transit</strong> fixed route patronage is increasing, ridershipincreased 10% between <strong>FY</strong> 2003-04 and <strong>FY</strong> 2006-07, despitethe fact that overall service levels remained the same.Patronage reacted positively <strong>to</strong> the various reallocation ofoperating resources between 2004 and <strong>2007</strong>.• <strong>Tri</strong> <strong>Delta</strong> <strong>Transit</strong> is increasingly productive. Overall fixed routeproductivity increased by about 10% increasing from 14.4boardings/revenue vehicle hour (RVH) in <strong>FY</strong> 2003-04 <strong>to</strong> 16.0boardings/RVH during <strong>FY</strong> 2006-07.• <strong>Tri</strong> <strong>Delta</strong> <strong>Transit</strong> is reliable and safe. During <strong>FY</strong> 2006-07, therewere 16,625 miles between road calls, compared <strong>to</strong> a muchlower adopted standard, and one preventable accident every68,239 revenue vehicle miles, near the high end of the adoptedrange, e.g., between 40,000 and 70,000 RVH.• Paratransit productivity remains consistent. Paratransitproductivity declined only slightly from 2.7 <strong>to</strong> 2.6passengers/RVH between <strong>FY</strong> 2003-04 and <strong>FY</strong> 2006-07,respectively despite the fact that regional growth is creatinglonger, average trip lengths.• <strong>Tri</strong> <strong>Delta</strong> <strong>Transit</strong> is succeeding at one of its main missions <strong>to</strong>serve the transit dependent. A composite profile of a <strong>Tri</strong> <strong>Delta</strong><strong>Transit</strong> rider can be summarized from on-board survey results.The “average” rider would be between twelve and thirty yearsold, is transit dependent with limited access <strong>to</strong> a vehicle, lives ina low <strong>to</strong> very low income household, mainly pays cash whenriding the bus, and regards their ethnicity as non-white.• Most <strong>Tri</strong> <strong>Delta</strong> <strong>Transit</strong> patrons are making local trips. Most <strong>Tri</strong><strong>Delta</strong> <strong>Transit</strong> patrons begin and end their bus trips within EastCounty, make their trips without transferring, also use <strong>Tri</strong> <strong>Delta</strong><strong>Transit</strong> buses for round trips, and walked <strong>to</strong> and from the bus.• <strong>Tri</strong> <strong>Delta</strong> <strong>Transit</strong>’s recent introduction of a day pass <strong>to</strong> replacemost bus-<strong>to</strong>-bus transfers has been successful. A largeproportion of fixed route passengers adopted this new fareinstrument very quickly.The major weaknesses of and constraints on <strong>Tri</strong> <strong>Delta</strong> <strong>Transit</strong> include:• Existing <strong>Tri</strong> <strong>Delta</strong> <strong>Transit</strong> Routes 70 and 200, and new routes384, 385, 386, all had productivity well below the fixed routemean, but productivity is still well above that of paratransit.• Highway 4 traffic congestion between Pittsburg and Antiochwhere eight freeway lanes converge down <strong>to</strong> four continues <strong>to</strong>severely constrain <strong>Tri</strong> <strong>Delta</strong> <strong>Transit</strong> express bus operations,particularly the fixed route system on weekdays after 2:00 p.m.• Individual trips with low productivity are still a problem. Forexample, Route 70 has gradually been cut back in order <strong>to</strong>improve productivity. Many local routes are productive duringpeak commute and school travel times, but have are far lessproductive during the midday, particularly routes that have alarge proportion of student ridership.86
<strong>Transit</strong> Challenges<strong>Tri</strong> <strong>Delta</strong> <strong>Transit</strong> faces a number of challenges <strong>to</strong> continued transitsystem growth and increasing overall efficiency. But the system alsocan take advantage of several potential opportunities <strong>to</strong> improveservice and increase patronage.Like most transit systems, available financial resources for <strong>Tri</strong> <strong>Delta</strong><strong>Transit</strong> are increasingly limited while the cost of basic inputs, such asfuel, maintenance parts, insurance, and other necessary supportingservices are generally increasing faster than inflation. The prices paidfor bus diesel fuel are very close <strong>to</strong> $3.00 per gallon, nearly doublingover the past few years. Costs for various kinds of insurance have alsoincreased, particularly for health and California workman’scompensation. The general rise in fuel prices has also increased costsfor a myriad of other materials and services, ranging from engine parts<strong>to</strong> tires <strong>to</strong> utilities.In contrast, transit’s various sources of tax revenues have notincreased nearly as quickly as expenses during the past few years.Contra Costa County retail sales have increased and overall Countypopulation has continued <strong>to</strong> increase steadily. However, the majorsource of operating subsidies, Transportation Development Act (TDA)sales taxes has been growing more slowly than operating expenses.Other revenue sources, such as Federal <strong>Transit</strong> Administration (FTA)Section 5307 formula funds for the Bay Point-Pittsburg-Antiochurbaniz ed area have been growing about 3.5% annually, a rate belowthe increases in operating expenses. And, MTC’s <strong>Transit</strong> CapitalPriorities Program forces <strong>Tri</strong> <strong>Delta</strong> <strong>Transit</strong> <strong>to</strong> compete with 27 otherlocal opera<strong>to</strong>rs for capital funds in the region based on a projectscaling criterion that is not favorable <strong>to</strong> suburban opera<strong>to</strong>rs.<strong>Tri</strong> <strong>Delta</strong> <strong>Transit</strong> is also constrained due <strong>to</strong> the nature of thecommunity it serves, a relatively affluent, dispersed, low-densitysuburb an community. Less than 5% of East County households do no<strong>to</strong>wn an au<strong>to</strong>mobile; in other words, 95% of households do own at leas<strong>to</strong>ne mo <strong>to</strong>r vehicle. This very high vehicle ownership rate is typical forU.S. suburban areas, and it is considerably higher than more denselyurban areas with greater transit usage rates such as San Francisco,Oakla nd, or Richmond.Ridership and productivity on new <strong>Tri</strong> <strong>Delta</strong> <strong>Transit</strong> service such asRoutes 383, 384, 385 and 386 has been relatively low during the firstfew years of operation, but is still substantially more productive thanexperie nced on demand responsive systems. Routes 383, 384 and 385serve still developing dispersed low-density, highly au<strong>to</strong>-orientedsuburban areas, while Route 386 function as a rural route servingDiscovery Bay. Each of these routes may ultimately average between10- 15 boardings/RVH depending on how quickly additionaldevelopment occurs.87
<strong>Transit</strong> OpportunitiesWhile the <strong>Tri</strong> <strong>Delta</strong> <strong>Transit</strong> operating environment imposes manyconstraints that limit long-term transit potential, nonetheless there area number of focused opportunities <strong>to</strong> significantly increase patronageand improve system efficiency and productivity.The first opportunity is <strong>to</strong> streamline operations of express Route 300between Brentwood and the Pittsburg/Bay Point BART station after thelate <strong>2007</strong> opening of the Highway 4 extension. This extension willreduce transit travel times by at least 15 minutes in each direction,perhaps more if Route 300 “leapfrogs” (bypasses) the Hillcrest Park &Ride Lot during peak hours. This reduced travel time, in turn, mayallow increasing peak period frequencies on Route 300 <strong>to</strong> every 15minutes, with two route segments running every 30 minutes betweenOakley and BART and every 30 minutes between Brentwood and BART.This route revision could also be the first step <strong>to</strong>wards development ofa bus rapid transit (BRT) network serving East Contra Costa County,particularly serving portions of the ECCTA service area not be serveddirectly by the proposed eBART extension <strong>to</strong> Hillcrest Avenue.In the short term, other opportunities for improving express busservice are limited, mainly due <strong>to</strong> the excessive use of limitedoperating resources caused by the consistently severe congestionexperienced on Highway 4 between Pittsburg and Antioch. Once theprogrammed widening of Highway 4 from two <strong>to</strong> four lanes in eachdirection is completed in the next few years, additional opportunitiesfor improving express service may be available, including possibledevelopment of BRT strategies. The pending widening of Highway 4may also open opportunities for improving local routes as congestion inthe corridor would be relieved on parallel roadways as well as on thewidened freeway.<strong>Tri</strong> <strong>Delta</strong> <strong>Transit</strong> maintains overall fixed route service levels in therange of 160,000-162,000 revenue vehicle hours (RVH) per year,consistent with the increasingly limited financial resources available <strong>to</strong>transit in East Contra Costa County. Over the past few years, poorlyperforming services have been reduced, and the freed transitresources reallocated <strong>to</strong> more productive services. Recent examplesinclude previous service adjustments that allowed introduction ofRoutes 383, 384, 385, and 386 in 2005.<strong>Tri</strong> <strong>Delta</strong> <strong>Transit</strong> also began operation of Route 201 betweenPittsburg/Bay Point BART, Bay Point and central Concord <strong>to</strong> meet aneed for direct service <strong>to</strong> a large high school attended by many BayPoint students, and health care, shopping, and other opportunities“over the hill” not available in Bay Point. Though Route 201 has beenoperating for less than two months at this writing (late Oc<strong>to</strong>ber <strong>2007</strong>),productivity already exceeds 12 boardings/RVH, indicating that it islikely <strong>to</strong> be among <strong>Tri</strong> <strong>Delta</strong> <strong>Transit</strong>’s most productive routes oncepatronage levels mature in 18-24 months. Given the immediatesuccess of Route 201, there are probably a number of otheropportunities <strong>to</strong> reallocate <strong>Tri</strong> <strong>Delta</strong> <strong>Transit</strong>’s limited resources fromunderperforming services <strong>to</strong> more productive routes.88
Another potential opportunity for improved service is based on <strong>Tri</strong><strong>Delta</strong> <strong>Transit</strong>’s willingness <strong>to</strong> consider information technologyimprovements <strong>to</strong> increase cus<strong>to</strong>mer service, productivity, improvedmanagement information, and other aspects of transit operations canbe improved. Recently, <strong>Tri</strong> <strong>Delta</strong> <strong>Transit</strong> has successfully implementednew Computer Aided Dispatching/Au<strong>to</strong>matic Vehicle Location(CAD/AVL) technology. Computer software compatible with CAD/AVLsystems, designed specifically for flexible fixed route services–asdistinct from paratransit-specific software such as Trapeze orRoutematch–has been demonstrated in daily service by the Po<strong>to</strong>macand Rappahannock Transportation Commission (PRTC) in suburbanVirginia outside Washing<strong>to</strong>n, D.C. While PRTC is currently the onlytransit system in the U.S. known <strong>to</strong> use this specific type of flex-routesoftware (though the City of Santa Clarita in Southern California hasspecified the capability <strong>to</strong> add this capability <strong>to</strong> their pending CAD/AVLsystem), such software is routinely used by a number of Europeantransit systems for flex routes in areas where regular fixed routeoperations are not justified by patronage. Given the low density ofmuch of the <strong>Tri</strong> <strong>Delta</strong> <strong>Transit</strong> service area, flex routes using this sort ofstate-of-the-art software may help improve productivity and could alsohelp reduce ADA paratransit expenses.Fixed Route Operations <strong>Plan</strong>Table 5.1 summarizes projected fixed route service levels during the <strong>FY</strong><strong>2007</strong>-08 through <strong>FY</strong> 2017-18 period. Annual service levels areexpected <strong>to</strong> increase by about 15% in <strong>FY</strong> <strong>2007</strong>-08 at about 190,000annual revenue vehicle hours (RVH) with little variation, due <strong>to</strong> addedservice on new Route 201, improvements <strong>to</strong> the Route 300 schedule,the addition of DX commute service <strong>to</strong> Martinez, and expansion ofmidday service <strong>to</strong> every 30 minutes on selected routes. The <strong>to</strong>talnumber of peak period buses remain at 57 vehicles. These estimatesassume continuing availability of all existing revenues including BARTfeeder bus funds. Service recommendations focus on incremental,revenue-neutral opportunities <strong>to</strong> reduce or eliminate poorly performingservices, and shifting resources <strong>to</strong> more productive areas in order <strong>to</strong>improve overall system performance.The previous SRTP document based many of its service proposals onthe assumption that BART would implement “eBART” diesel commuterrail service over a 23-mile route between the BART Bay Point station <strong>to</strong>Byron via the Highway 4 freeway median and the Union PacificRailroad’s “Mococo” right-of-way through Pittsburg, Antioch, Oakleyand Brentwood. That proposal included seven potential stationsincluding Pittsburg (Railroad Avenue), two in Antioch (LStreet/Fairgrounds and east of the existing Hillcrest park-ride lot, one89
Table 5.1 Projected <strong>Tri</strong> <strong>Delta</strong> <strong>Transit</strong> Fixed Route Service LevelsFiscal YearFixed RouteRevenue Vehicle HoursFixed RouteRevenue Vehicle Miles2006-07 160,909 2,460,563<strong>2007</strong>-08 190,000 2,850,000<strong>2008</strong>-09 190,000 2,850,0002009-10 190,000 2,850,0002010-11 190,000 2,850,0002011-12 190,000 2,850,0002012-13 190,000 2,850,0002013-14 190,000 2,850,0002014-15 190,000 2,850,0002015-16 190,000 2,850,0002016-17 190,000 2,850,0002017-18 190,000 2,850,000in Oakley (Empire Avenue & Neroly Road), and one in down<strong>to</strong>wnBrentwood near the existing park-ride lot. Figure 5.1 shows thisoriginal proposal with recent project down scoping shown in yellow.eBART plans have been substantially revised since the previous SRTPdue <strong>to</strong> rapidly rising capital cost estimates and a change in theproposed project alignment. The original proposal has been cut back <strong>to</strong>a $400 million 9-mile line in the Highway 4 freeway median betweenthe Pittsburg/Bay Point BART station and Hillcrest Avenue.Figure 5.1 Revised eBART Proposal90
The orig inal eBART proposal would have operated in the median ofHighway 4 through Pittsburg, and then transitioned <strong>to</strong> an alignmentalong the Union Pacific Railroad though Antioch, Oakley and Brentwoodas shown in Fi gure 5.1. However, the UnionPacific Railroad did notagree <strong>to</strong> the terms offered by BART for the proposed right-of-waypurchase, so the eBART proposal was revised <strong>to</strong> operate in the medianof High way 4. In turn, this necessitated design changes for theproposed Highway 4 widening from 4 <strong>to</strong> 8 lanes, delayingthe start ofwidening construction and construc tion of eBART for several years.Since 2004, costs for construction materials such as concrete and steelhave also incr eased nearly 50%, necessitating reduction of eBARTstations from three <strong>to</strong> two, with stations remaining at Railroad Avenuein Pittsburg an d at Hillcrest Avenue in Antioch. At some future date, athird station w ould be built at Somersville Road or the AntiochFairgrounds.As discussed in detail in Chapter 3, <strong>Tri</strong> <strong>Delta</strong> <strong>Transit</strong> fixed routescarried about 2.5 million passengers during <strong>FY</strong> 2006-07, and ridershipis expected <strong>to</strong> grow during <strong>FY</strong> <strong>2007</strong>-08 due <strong>to</strong> the addition of Route201, streamlining of Route 300 <strong>to</strong> better serve Brentwood, and otherservice additions. While <strong>to</strong>tal fixed route ridership has grown 25%since 2000, the share of <strong>to</strong>tal trips within the ECCTA service area hasconsistently been around 80% of all riders. This is the primary reasonthat <strong>Tri</strong> <strong>Delta</strong> <strong>Transit</strong>’s highest priority is <strong>to</strong> serve local passengers.Half of these are either senior citizens or students that are more highlydependent on public transit than the general population.<strong>Tri</strong> <strong>Delta</strong> <strong>Transit</strong> passengers travel in a complex pattern of origins anddestinations, not all of which would be better served by eBART feederservice. The remaining 20% of <strong>Tri</strong> <strong>Delta</strong> <strong>Transit</strong> riders travel <strong>to</strong>destinations outside ECCTA service area boundaries. Most connect withBART at the Pittsburg/Bay Point station, with smaller volumes traveling<strong>to</strong> Martinez, the Lawrence Livermore/Sandia Labora<strong>to</strong>ries andDublin/Pleasan<strong>to</strong>n BART, and via The County Connection Route 930serving Ygnacio Valley Road.Given the dominance of local passengers on the <strong>Tri</strong> <strong>Delta</strong> <strong>Transit</strong>system, the following principles should be incorporated in<strong>to</strong> therevisions of the <strong>Tri</strong> <strong>Delta</strong> <strong>Transit</strong> fixed route network <strong>to</strong> interface withthe planned startup of the revised eBART project.Principles for <strong>Tri</strong> <strong>Delta</strong> <strong>Transit</strong> RestructuringFirst, <strong>Tri</strong> <strong>Delta</strong> <strong>Transit</strong> currently owns 69 fixed route buses, whichsupport a maximum peak vehicle requirement of 57 buses with currentspare ratio policies. MTC Resolution 3688 (<strong>Transit</strong> Capital PrioritiesProcess and Criteria) effectively precludes ECCTA from increasing the<strong>to</strong>tal fixed route fleet size for the foreseeable future. Future serviceplans should be based on a maximum 57-bus peak requirement. IfBART feeder bus funding is not continued, ECCTA would need <strong>to</strong>downsize the fixed route system <strong>to</strong> a maximum 49-bus peak.91
Second, given recent down scoping of the eBART project, thosechoosing the bus <strong>to</strong> access BART from areas that would not be directlyserved by eBART should not be forced <strong>to</strong> transfer twice, e.g., first atthe Hillcrest eBART station, then from eBART <strong>to</strong> BART. Requiring twotransfers when not strictly necessary reduces patronage and increasestravel times. Streamlining of Route 300 <strong>to</strong> speed up service betweenOakley, Brentwood and Pittsburg/Bay Point BART by using the newHighway 4 bypass and “leapfrogging” the Hillcrest station would reducetravel times for most patrons while not directly competing with eBART.Third, <strong>Tri</strong> <strong>Delta</strong> <strong>Transit</strong> services that parallel Highway 4 and theproposed eBART route, but carry very large numbers of localpassengers should be revised as required <strong>to</strong> speed up service, but alsoprovide connections <strong>to</strong> eBART stations where feasible. Some of thecurrent route alignments could form the basis of arterial-based busrapid transit ( BRT) similar <strong>to</strong> that operated in Los Angeles, Eugene andLas Vegas.Fourth, service changes that negatively impact the large majority of<strong>Tri</strong> <strong>Delta</strong> <strong>Transit</strong> passengers that travel locally should be avoided.Potential impacts should be measured using specific criteria, such ascomparative transit travel time, system span and coverage, and fares.New routes and schedules should maintain or improve service qualityfor current <strong>Tri</strong> <strong>Delta</strong> <strong>Transit</strong> cus<strong>to</strong>mers as well as future users. A fullload check of the <strong>Tri</strong> <strong>Delta</strong> <strong>Transit</strong> fixed route network will be requiredat some point, <strong>to</strong> determine exactly where ridership is occurring and <strong>to</strong>help avoid major disruptions <strong>to</strong> the 80% of bus users who don’t useBART or travel outside East County.Fifth, land for future eBART station locations should be purchased atan early date, and bus transfer facilities and park and ride facilitiesconstructed, though the recently down scoped eBART proposal doesn’tinclude stations near Somersville Road or the Antioch Fairgrounds, norat earlier proposed locations in Oakley, Brentwood and DiscoveryBay/Byron. Such facilities would facilitate operations of BRT servicesconnecting <strong>to</strong> eBART and Pittsburg/Bay Point BART, provideconnections between local and regional bus routes, and help build thepatronage base for future eBART services when an extension can befinanced.A bus rapid transit (BRT) systems study should be conducted,examining ways of complementing the recently down scoped eBARTproject, but also <strong>to</strong> potentially speed up service <strong>to</strong> local riders on themost heavily-traveled local routes. Proposed revisions <strong>to</strong> Route 300could also be the basis of new and revised services based on bus rapidtransit (BRT) planning principles in an area unlikely <strong>to</strong> have direct railservice for many years, thereby complementing BART and eBART.Finally, paratransit service plans need <strong>to</strong> be consistent with revisions<strong>to</strong> the fixed route system. For example, additional Dial-A-Ride servicewould be required if planned fixed route extensions or new routesexpand the paratransit service area as defined by the ADA ¾-mile rule.92
Based on the principles listed above, three significant fixed routeservice initiatives are proposed for implementation before <strong>FY</strong> 2010:• Realign Route 300 Highway 4 Express service via the Highwaybypass upon completion south <strong>to</strong> Balfour Road.• Refine and expand Route 201 operations based on ridership andproductivity trends.• Increase midday service <strong>to</strong> every 30 minutes on selectedroutes, as shown in the <strong>FY</strong> <strong>2007</strong>-08 budget.Route 300 Realignment via Highway 4 BypassIncremental improvements as affordable are recommended for expressbus services operating <strong>to</strong> Pittsburg/Bay Point BART. As noted earlier,express bus ridership accounts for most of the system ridership gainssince 1997. The basic premise for rerouting is <strong>to</strong> reshape Route 300 <strong>to</strong>more of a BRT-style service when the Highway 4 bypass opensbetween Hillcrest Avenue and Lone Tree Way in late <strong>2007</strong>. Morefrequent service may be justified, and some increment of increasedservice would be funded in the <strong>FY</strong> <strong>2007</strong>-08 budget. The unconstrainedfrequency design guideline is <strong>to</strong> meet every peak period BART trainarrival and departure at Bay Point. Current ridership at first may onlysupport 30-minute headways on a Brentwood branch and every 30minutes <strong>to</strong>/from Oakley, with combined frequencies of 15 minutes <strong>to</strong>BART.Route 300 buses presently run non-s<strong>to</strong>p west of the Hillcrest Avenuepark-ride lot <strong>to</strong> BART, and make various s<strong>to</strong>ps east of Hillcrest on mainarteries through Oakley and Brentwood. Most Route 300 trips shouldbe realigned east of the Hillcrest park & ride <strong>to</strong> use the bypass <strong>to</strong> LoneTree Way and Balfour Road. Existing route segments on Main Streetand Brentwood would continue <strong>to</strong> be covered in Brentwood, Oakleyand Byron by Route 391.These changes likely would reduce scheduled bus travel time betweendown<strong>to</strong>wn Brentwood and BART by 15 minutes or more. Express bustravel times will further improve when planned HOV lanes arecompleted with the widening of Highway 4 east of Somersville Roadafter 2010. Travel times would be reduced further by leapfroggingRoute 300 buses past Hillcrest during peak periods, saving about 5-7minutes in each direction.In cooperation with BART, new park and ride opportunities should besought in the vicinity of future eBART station locations but mostimmediately near the Highway 4 bypass and Lone Tree Way. There issome reluctance <strong>to</strong> develop extensive parking capacity at future stationlocations beyond the current eBART project scope. However, ampleparking near future stations is needed <strong>to</strong> help build a patronage baseon bus connections <strong>to</strong> eBART and BART, and thus ensuring successover the long term.Under less constrained fiscal conditions, the short-term objectiveshould be <strong>to</strong> expand Route 300 weekday schedules <strong>to</strong> meet everyBART train arriving and departing Bay Point. Currently, BART trains934
depart Bay Point every 15 minutes on weekdays beginning at 4:02a.m. until approximately 7:30 p.m., and thereafter every 20 minutesuntil midnight. The <strong>FY</strong> <strong>2007</strong>-08 BART operating budget includes funds<strong>to</strong> increase evening and weekend train frequencies <strong>to</strong> every 15minutes, thus providing a base for 30-minute bus frequency whenpatronage is unlikely <strong>to</strong> support every 15-minutes.On weekdays, this would require three additional buses duringwe ekday peak periods, and four additional buses during weekday baseperiods. Nominal operational savings could result from the shorterrunning times on the bypass compared <strong>to</strong> the existing alignment onMain Street and Brentwood Boulevard. This savings could be combinedwith new resources <strong>to</strong> incrementally implement increased frequenciesas <strong>Tri</strong> <strong>Delta</strong> <strong>Transit</strong> can afford. Express buses currently do not operateon weekends. BART trains currently run every 20 minutes onweekends, but will soon be transitioning <strong>to</strong> 15-minute service. Halfhour frequencies on Route 300 would require 4 buses.Refine and Expand Route 201 OperationsRoute 201 began operation on August 27, <strong>2007</strong> between Bay Point andCentral Concord. During the first full month of operations, routeproductivity exceeded 11 boardings/RVH, indicating that matureridership levels after 18-24 months are likely <strong>to</strong> exceed the <strong>Tri</strong> <strong>Delta</strong><strong>Transit</strong> system average productivity by a substantial margin. Possibleimprovements <strong>to</strong> Route 201–<strong>to</strong> be developed in detail by transit staff–may include midday service every 30 minutes, and hourly service onweekends. Additional midday service would require about 2,500additional annual revenue vehicle hours; hourly weekend service wouldrequire adding about 3,000 annual RVH for Route 201 service between7:00 a.m. and 8:00 p.m.Midday Service Every 30 Minutes on Selected RoutesThe <strong>FY</strong> <strong>2007</strong>-08 <strong>Tri</strong> <strong>Delta</strong> <strong>Transit</strong> operating budget has sufficientfunding <strong>to</strong> increase fixed route services by about 15%. Many of theproposed improvements focus on improving midday service onweekdays <strong>to</strong> every 30 minutes on selected routes. Specificrecommendations for these selective service increases are currentlybeing developed by <strong>Tri</strong> <strong>Delta</strong> <strong>Transit</strong> staff.Service <strong>Plan</strong>ning Beyond 2010As noted earlier, introduction of eBART and supporting/complementarybus rapid transit (BRT) <strong>to</strong> East Contra Costa County would havesignificant impacts on the transit network serving <strong>Tri</strong> <strong>Delta</strong> <strong>Transit</strong>cus<strong>to</strong>mers and other commuters. BART currently provides about $2.0million annually <strong>to</strong> support bus connections <strong>to</strong> the Bay Point station.Additional State <strong>Transit</strong> Assistance (STA) funds are received from theBART coordination program; in effect, these two funding sources arefunctionally equivalent. Should these funding sources be discontinuedwhen the current eBART project opens, weekday <strong>Tri</strong> <strong>Delta</strong> <strong>Transit</strong> peakservice levels would have <strong>to</strong> be reduced proportionately.94
Future <strong>Tri</strong> <strong>Delta</strong> <strong>Transit</strong> route revisions designed <strong>to</strong> accommodateimproved access <strong>to</strong> new eBART stations, the current BART station, and<strong>to</strong> provide service where BRT strategies are appropriate, requires asystems level evaluation of the current system and development ofscenarios and plans <strong>to</strong> evaluate the best strategies for meeting thesedisparate needs. BRT strategies in particular may be suited <strong>to</strong> Federal<strong>Transit</strong> Administration (FTA) “Small Starts” funding, e.g., projects thatcost no more than $250 million and request a maximum of $75 millionfrom FTA New Starts funding. Should <strong>Tri</strong> <strong>Delta</strong> <strong>Transit</strong> decide <strong>to</strong> pursuefederal funding opportunities, a major study consistent with FTAplanning guidelines would be needed. In addition <strong>to</strong> standard transitplanning capabilities, this potential $300,000 <strong>to</strong> $500,000 studyprocess would require detailed traffic engineering expertise <strong>to</strong> evaluatesuitable locations for transit signal priorities, queue jumpers, potentials<strong>to</strong>p locations, and other improvements.Dial-a-Ride Operating <strong>Plan</strong>Projected Dial-a-Ride and Antioch Senior Bus Program service levelsare summarized in Table 5.2. Dial-A-Ride demand is projected <strong>to</strong> growby 12% between <strong>FY</strong> <strong>2007</strong> and <strong>FY</strong> <strong>2008</strong>, primarily due <strong>to</strong> an anticipated16% increase in service provided, paralleling projected increases infixed route operations in <strong>FY</strong> <strong>2008</strong>. Productivity is projected <strong>to</strong> increaseslightly over the life of the plan. Similarly, Antioch Senior Bus Programridership is projected <strong>to</strong> remain at current levels while service hourswill remain flat.Table 5.2 Projected <strong>Tri</strong> <strong>Delta</strong> <strong>Transit</strong> Dial-A-Ride Service LevelsFiscal Year Dial-A-Ride Dial-A-RideRevenue Vehicle Hours Revenue Vehicle Miles2006-07 41,748 577,127<strong>2007</strong>-08 48,400 670,000<strong>2008</strong>-09 48,400 670,0002009-10 48,400 670,0002010-11 48,400 670,0002011-12 48,400 670,0002012-13 48,400 670,0002013-14 48,400 670,0002014-15 48,400 670,0002015-16 48,400 670,0002016-17 48,400 670,0002017-18 48,400 670,00095
Operating Statistics & Budget ProjectionsFare revenues tend <strong>to</strong> follow patronage; in <strong>FY</strong> <strong>2007</strong>-08, a 10%-12%increase in <strong>to</strong>tal fixed route revenue is projected. Fixed routepatronage is projected <strong>to</strong> increase 2% annually in <strong>2008</strong>-09 andbeyond. All other revenue sources including TDA, STA, FTA and othersources are projected <strong>to</strong> grow at the MTC-sanctioned rate of 3.5%annually except for Regional Measure 2 bridge <strong>to</strong>lls, which areprojected <strong>to</strong> grow 1.5% annually. Operating expenses are alsoprojected <strong>to</strong> grow 3.5% annually, roughly at the rate of inflation exceptfor fuel, which is projected <strong>to</strong> increase at 6% annually.<strong>Transit</strong> funding sources include passenger fares, on-vehicle advertisingrevenues, state Transportation Development Act (TDA) funds, State<strong>Transit</strong> Assistance (STA) funds, Bay Air Quality Management District(BAQAMD) special project funds, Regional Measure 2 (RM02) bridge<strong>to</strong>lls for Route 70, Federal <strong>Transit</strong> Administration (FTA) Section 5307formula and 5303 planning funds.There may be capacity within the existing Dial-a-Ride operation <strong>to</strong>absorb up <strong>to</strong> 25% more passengers than presently are scheduled,particularly if <strong>Tri</strong> <strong>Delta</strong> <strong>Transit</strong> takes full advantage of improvingau<strong>to</strong>mated dispatching capabilities. The Antioch Senior Bus Programmay have capacity for approximately 10% more passengers withoutsignificantly increasing revenue hours. The 10-year operating planprojected that peak vehicles operated will increase from 19 during <strong>FY</strong>2006-07 <strong>to</strong> 23 during <strong>FY</strong> <strong>2007</strong>-8, then remaining the same during theremainder of the 10-year period.A 10-year revenue and expense analysis is provided in Tables 5.3through 5.6. Total annual revenues available for operations areprojected <strong>to</strong> incre ase from $20.2 million in <strong>FY</strong> <strong>2007</strong>-08 <strong>to</strong> over $29.3million in <strong>FY</strong> 2018. TDA, STA and Measure C revenues, which <strong>to</strong>getherprovide n early 70% of the operating budget, are fore cast by MTC <strong>to</strong>grow 3.5% annually through F Y 2018. The average annual growth rateall revenue sources combined is 3.8% over the ten-year period.Operating expenses are projected <strong>to</strong> increase from $ 20.2 million in <strong>FY</strong><strong>2008</strong> <strong>to</strong> $ 29.3 million in <strong>FY</strong> 2018. This assumes an a verage 3.8%increase in the cost per hour above <strong>FY</strong> <strong>2007</strong> actual e xpenses, allowingfor service increa ses during <strong>FY</strong> <strong>2007</strong>-08. This is cons idered a “bestcase” inflation assumption, barring unforeseen increases in employeehealth benefits, fuel and insurance costs. Higher inflation rates fromyear <strong>to</strong> year could necessitate minor service reductions <strong>to</strong> maintain abalanced budget. While ECCTA maintains a 20% farebox recoveryobjective for the fixed route system, an expectation of 15%-16%reflects a more realistic expectation of performance in the next severalyears. <strong>Tri</strong>ennial fare increases yielding 20% net higher fareboxrevenues are suggested in <strong>FY</strong> 2010 and <strong>FY</strong> 2015 <strong>to</strong> remain above the15% farebox recovery threshold. It may be appropriate <strong>to</strong> revise thefare structure entirely when eBART begins operating, though what yearthis will occur is not yet certain.96
100
CHAPTER6Capital <strong>Plan</strong>This chapter summarizes the proposed 10-year transit capital plan forthe <strong>Tri</strong> <strong>Delta</strong> <strong>Transit</strong> system for Fiscal Years <strong>2007</strong>-08 through 2017-18.Necessary capital improvements include revenue vehicle and nonrevenuevehicle replacements, upgrades <strong>to</strong> existing vehicles <strong>to</strong> meetCalifornia air quality regulations, improvements <strong>to</strong> fixed facilities suchas bus s<strong>to</strong>ps, and other supporting projects. Proposed capitalimprovements are constrained by future funding allocations. From aplanning perspective, a constrained capital plan that doesn’t includefull funding for capital projects will not meet all identified needs. Table6.1 below summarizes the projected 10-year <strong>Tri</strong> <strong>Delta</strong> <strong>Transit</strong> capitalplan. Total projected capital needs <strong>to</strong>tal $63 million through <strong>FY</strong>18.<strong>Tri</strong> <strong>Delta</strong> <strong>Transit</strong> Fleet <strong>Plan</strong>Table 6.2 summarizes particulars of the <strong>Tri</strong> <strong>Delta</strong> <strong>Transit</strong> vehicle flee<strong>to</strong>ver the 10-year planning horizon of this SRTP. The objective of thefleet plan is <strong>to</strong> maintain a fleet of 69 fixed route buses and 26 smallbuses for the paratransit operation during the 10-year horizon of theSRTP. A <strong>to</strong>tal of 69 fixed route buses and 26 dial-a-ride vehicles will bereplaced under the plan, consistent with a full useful life for eachvehicle consistent with FTA requirements.The California Air Resources Board (CARB) has established air pollutionrules that required retrofitting or retirement of pre-2006 transit busesthat didn’t meet specified, increasingly stiff emissions requirements.<strong>Tri</strong> <strong>Delta</strong> <strong>Transit</strong> has already retrofitted many of its fixed route fleetbuses <strong>to</strong> meet the stringent CARB requirements and has approvedfunding <strong>to</strong> retrofit the rest of the fleet as approved devices becomeavailable. The cost of these retrofits is included in the FR FleetEnhancement Projects line in Table 6.1. All future revenue vehiclepurchase will be made with full consideration of the fleet emissionsrequirements, starting with the upcoming purchase of diesel/electrichybrid buses <strong>to</strong> replace six, model year 1995 FR buses before the endof <strong>FY</strong>09.The 2006 SRTP document indicated that a <strong>to</strong>tal of 40 heavy-duty fixedroute replacement buses would use fuel cell propulsion. However, thestate of fuel cell technology is increasingly uncertain, and it is not clearwhether the technology is cost-effective for transit use. It is also notcompletely clear whether hybrid or future “clean diesel” technology ismost suitable for transit buses but hybrid technology is currentlyavailable and that is what is indicated in Table 6.2 for replacements.101
Table 6.1 ECCTA <strong>Plan</strong>ned CapitalPrior <strong>FY</strong>07 <strong>FY</strong>08 <strong>FY</strong>09 F Y1 0 <strong>FY</strong>11 <strong>FY</strong>12 <strong>FY</strong>13 <strong>FY</strong>14 <strong>FY</strong>15 <strong>FY</strong>16 <strong>FY</strong>17 <strong>FY</strong>18 TotalFR Fleet Enhanc ement Projects1,3 08 1,029 625 - - - - - - - - - - 2,962FR Fleet Replac ements- 2,538 607 5,733 65 6 5,675 6,398 7,301 6,483 3,803 3,918 2,035 2,035 47,182FR Fleet Addition s- - - 1,190 - - - - - - - - - 1,190DR Fleet Replac ements- - - 96 - 701 105 1,689 1,769 - 118 - - 4,478Non-Reven ue Vehicle Replacements - - - 250 - - 75 - - - - - 157 482Field Amenities 694 500 2,775 50 50 50 50 50 50 50 50 50 50 4,469Administra tion & Maintenance Facility 184 25 1,025 100 10 0 100 100 100 100 100 100 100 100 2,234Expenditure SummaryTo tal Capital Expenditure: 2,1 86 4,092 5,032 7,419 806 6,526 6,729 9,140 8,402 3,953 4,186 2,185 2,341 62,997102
FR FleetQty Current Size Class FuelTable 6.2 ECCTA <strong>Plan</strong>ned Fleet Capital Expenditure SummaryModelYearServiceYearLifePrior <strong>FY</strong>07 <strong>FY</strong>08 <strong>FY</strong>09 <strong>FY</strong>10 <strong>FY</strong>11 <strong>FY</strong>12 <strong>FY</strong>13 <strong>FY</strong>14 <strong>FY</strong>15 <strong>FY</strong>16 <strong>FY</strong>17 <strong>FY</strong>18 TOTALBus Catalysts 1,263 350 1,613ITS Project 640 610 1,250Bus Security & Farebox Replacements 45 39 15 99Replace FR Buses 6 Bus - <strong>Transit</strong> - 40' Heavy-Duty Dsl Hybrid 1995 1995 12 2,538 607 3,145Replace FR Buses 12 Bus - <strong>Transit</strong> - 40' Heavy-Duty Dsl Hybrid 1997 1998 12 5,733 656 6,389Replace FR Buses 7 Bus - <strong>Transit</strong> - 40' Heavy-Duty Dsl Hybrid 1998 1999 12 4,731 4,731Replace FR Buses 20 Bus - <strong>Transit</strong> - 40' Heavy-Duty Dsl Hybrid 2001 2001 12 3,586 3,691 3,803 3,918 14,998Replace FR Buses 9 Bus - <strong>Transit</strong> - 35' Medium-Duty Dsl Hybrid 2001 2006 10 5,912 5,912Replace FR Buses 2 Bus - <strong>Transit</strong> - 35' Heavy-Duty Dsl Hybrid 2001 2001 12 1,002 1,002Replace FR Buses 3 Bus - <strong>Transit</strong> - 30' Medium-Duty Dsl Hybrid 2000 2001 10 944 486 1,431Replace FR Buses 6 Bus-Over-the-Road 45' Heavy-Duty Dsl Hybrid 2000 2001 12 2,713 2,792 5,505Replace FR Buses 4 Bus-Over-the-Road 45' Heavy-Duty Dsl Hybrid 2001 2003 16 2,035 2,035 4,070Addtl Coaches for Express Bus project 2 Bus-Over-the-Road 45' Heavy-Duty Diesel 2010 2010 16 1,190 1,190Total FR 1,308 3,567 1,232 5,733 656 5,675 6,398 7,301 6,483 3,803 3,918 2,035 2,035 51,334DR FleetReplace DR Buses 20 Cutaway - 29' Medium-Duty Diesel 2006 2006 5 1,610 1,657 3,268Replace Med Vans 2 Au<strong>to</strong>/Minivan Light-Duty Gasoline 2002 2003 4 96 111 207Replace Med Vans 2 Au<strong>to</strong>/Minivan Light-Duty Gasoline <strong>2007</strong> <strong>2007</strong> 4 105 118 223Replace DR Buses (Antioch Sr.) 1 Cutaway - 29' Medium-Duty Gasoline 2004 2004 5 701 701Replace DR Buses (Antioch Sr.) 1 Cutaway - 29' Medium-Duty Gasoline 2006 2006 5 79 79Total DR 96 701 105 1,689 1,769 118 4,478Non-Revenue VehiclesDriver exchange cars 5 Au<strong>to</strong> - Gas Hybrid 2001 2001 5 130 130Admin Au<strong>to</strong> 1 Au<strong>to</strong> - Gas Hybrid 2001 2001 5 23 23Admin Van 1 Van - Gasoline 1996 1996 5 52 52Shop Truck 1 Truck Light Gasoline 2001 2001 5 60 78 138Shelter Truck 1 Truck Light Gasoline 1996 1996 5 60 78 138Total Non-Revenue Vehicle 250 75 157 482TOTAL FLEET CAPITAL COSTS 1,308 3,567 1,232 6,079 656 6,376 6,579 8,990 8,252 3,803 4,036 2,035 2,191 56,294103
Capital Project DetailsFR Fleet Enhancement ProjectsBus Catalyst Devices ($1.6 million)This project was previously discussed in the “Fleet <strong>Plan</strong>” section.Bus Security & Fare box Enhancements ($99 thousand)This project being completed during <strong>FY</strong> <strong>2008</strong>-09 will add digital cameraequipment and enhanced fare boxes <strong>to</strong> the fixed route fleet. The goalis <strong>to</strong> enhance passenger access, safety & security.Intelligent Transportation Systems Project ($1.3 million)This project will upgrade <strong>Tri</strong> <strong>Delta</strong> <strong>Transit</strong>’s fixed route system <strong>to</strong> thesame level of ITS technology that is already present on the Dial-a-Rideservice. Components will include GPS locaters, Mobile Data Terminalsand Au<strong>to</strong>matic S<strong>to</strong>p Enunciation and Au<strong>to</strong>matic Passenger counters.FR & DR Fleet Replacements ($52 million)Covered in “Fleet <strong>Plan</strong>” previously.Fixed Route Fleet Additions ($1.2 million)Two additional express buses for service outlined in “Park and RideAcquisition & Development” below. This will be STIP funded.Non-revenue Vehicle Replacements ($482 thousand)Mostly local fund sourced replacements for driver exchange cars andshop and field maintenance trucks.Field AmenitiesPark and Ride Acquisition & Development ($4 million)In <strong>FY</strong> 2004-05, <strong>Tri</strong> <strong>Delta</strong> <strong>Transit</strong> obtained a federal capital fundingearmark for the purchase of land for a park & ride lot near theproposed eBART station in Oakley. In <strong>FY</strong>08 that earmark was extendedand another was added. <strong>Tri</strong> <strong>Delta</strong> <strong>Transit</strong> is currently applying forthese funds and has identified a property. There are additional STIPfunds of $14 million outside of the scope of this SRTP <strong>to</strong> use for addingadditional satellite park and ride lots throughout the service area thatwill feed eBART when it is built and serve as inter-modal transferpoints for enhanced express bus service in the meantime. Twoadditional over-the-road coaches will need <strong>to</strong> be purchased asmentioned above in “Fixed Route Fleet Additions” <strong>to</strong> add service <strong>to</strong>these PnR lots.104
Bus S<strong>to</strong>p Enhancements ($500 thousand)The <strong>Tri</strong> <strong>Delta</strong> <strong>Transit</strong> capital plan earmarks $50m per year from localfunds <strong>to</strong> improve and upgrade the amenities at bus s<strong>to</strong>ps as needed.Administration and Maintenance Facility ($2.2 million)These are capitalized expenditures for maintenance of theadministrative and maintenance facility as well as office and shopequipment. There is a general allowance of $100 thousand/year. The<strong>to</strong>tal also includes $184 thousand for a recently completed bus washreplacement and a $1M, TDA funded, major capital facilityenhancement that has been deferred indefinitely.105
AppendixRESOLUTION #080123cBay Area Strategic Vision for <strong>Transit</strong> in MTC’s 2035 <strong>Plan</strong>Resolution #080123c supports the Bay Area Strategic Vision for<strong>Transit</strong> in the 2035 <strong>Plan</strong>.WHEREAS, <strong>Plan</strong>ners from Bay Area transit systems have worked<strong>to</strong>gether <strong>to</strong> develop advocacy points related <strong>to</strong> the provision of transit inthe upcoming 2035 Regional Transportation <strong>Plan</strong> being developed byMTC; andWHEREAS, Agencies that participated in the effort are: AC<strong>Transit</strong>,LAVTA, County Connection, Marin <strong>Transit</strong>, BART, NCPTA, MUNI,Sam Trans, Cal Train, Golden Gate, VTA, WestCAT, MTA, MTC, and<strong>Tri</strong> <strong>Delta</strong> <strong>Transit</strong>; andWHEREAS, attached is the strategic vision that was developed. Itincludes a vision statement, findings, and goals.NOW, THEREFORE, BE IT RESOLVED, by the Board of Direc<strong>to</strong>rsof the Eastern Contra Costa <strong>Transit</strong> Authority <strong>to</strong> adopt resolution#080123c supporting the Bay Area Strategic Vision for <strong>Transit</strong> in the 2035plan.PASSED AND ADOPTED THIS 23rd day of January <strong>2008</strong>, by thefollowing votes:EASTERN CONTRA COSTA TRANSIT AUTHORITYBarney Parsons, ChairJeanne Krieg, Chief Executive OfficerAYES:NOES:ABSENT:ABSTENTIONS:____________________106
Bay Area Strategic Vision for <strong>Transit</strong> in the 2035 <strong>Plan</strong>Vision StatementTo better serve the diverse needs of the region's urban, suburban and ruralresidents, improve the quality of life, provide for mobility and meet climatechange challenges, the Bay Area <strong>Transit</strong>Service Providers agree that theRegional Transportation <strong>Plan</strong> shall offer a family of integrated and seamlesstransit services, including rail and ferry transit, express/rapid/local buses,community shuttles, and paratransit and demand-responsive services. Further,the region shall preserve potential corridors so as not <strong>to</strong> preclude future transitexpansion, even if the expansion is not affordable or a priority in the near term.FindingsAs a basis for goal-setting, we make the following findings:I. Public Transparency and Accountability Require the Establishment ofService Criteria and Performance Metrics<strong>Transit</strong> opera<strong>to</strong>rs shall develop level-of-service guidelines <strong>to</strong> evaluate servicesupply and demand for the various categories of transit service. The performanceevaluation process shall be documented in transit opera<strong>to</strong>rs’ <strong>Short</strong> <strong>Range</strong> <strong>Transit</strong><strong>Plan</strong>s.II. Climate Change Challenges Require Increases in <strong>Transit</strong> Modal Shareand Decreases in Transportation’s Carbon Footprint.The region shall establish policies that promote transit beneficial investmentaimed at increasing transit modal share while supporting decreases in overallemissions from transportation. Higher transit mode shares will help meet thepublic’s demand for reductions in Greenhouse Gas Emissions, meet themandates of AB 32, and support carbon efficient Priority Development Areas. Toaccomplish that, the Region shall support public transit opera<strong>to</strong>rs in reducingtheir carbon footprint through an accelerated investment in cost-effective lower-carbon or zero emissions transit vehicle technologies.III. <strong>Transit</strong> Systems Deserve Innovativ e Management ToolsThe Region and the <strong>Transit</strong> Opera<strong>to</strong>rs shall promote the use of both existing anddeveloping technological innovation as a method of improving the performance ofthe system and providing the public with access <strong>to</strong> information.IV. Continuity Requires Honoring Our Prior <strong>Transit</strong> Commitments.The Regional Transportation <strong>Plan</strong> shall honor existing transit commitments.107
Goals1. Everyone in the Bay Region should have a transit option that provides areasonable and affordable alternative <strong>to</strong> single au<strong>to</strong> use.The Regional Transportation <strong>Plan</strong> shall establish a Useful <strong>Transit</strong> Network thatprovides a base level of public transit service that is competitive with privatevehicle travel and includes a network of freeway HOV and arterial corridors withfast, frequent (15-minute headway or better) and all-day service <strong>to</strong> serve curren<strong>to</strong>r future demand. A Useful <strong>Transit</strong> Network encompasses the Lifeline networkand ADA mandated paratransit, and is not separate from it. Furthermore, theregion should establish an integrated and affordable regional fare structure <strong>to</strong>both encourage transit use and ad dress mobility needs of low-income cus<strong>to</strong>mers,cus<strong>to</strong>mers with disabilities, seniors, and youth.2. Protect and Improve Speed and Reliability for <strong>Transit</strong> Vehicles.The Regional Transportation <strong>Plan</strong> shall identify and fund transit prioritymeasures, such as signal priority, bus lanes, bus bulbs and queue jumperswherever a speed or reliability advantage for transit can be demonstrated. Localstreets and roads maintenance priorities should be aligned with these transitcorridors. Such measures should be planned and implemented <strong>to</strong> protect interandintra-jurisdictional travel.3. Keep <strong>Transit</strong> Assets in a State of Good Repair.MTC and transit providers shall prioritize the rehabilitation and replacement of allrolling s<strong>to</strong>ck and fixed assets required <strong>to</strong> provide transit service.4. Focus Housing and Jobs around <strong>Transit</strong> Hubs and on <strong>Transit</strong> Corridors.<strong>Transit</strong> opera<strong>to</strong>rs shall support Regional Priority Development Areas and otherinfill development by prioritizing and focusing service planning and capitalinvestment on existing and future transit hubs and high volume travel corridors.5. Tie Pricing Strategies <strong>to</strong> Robust <strong>Transit</strong> Options.In order <strong>to</strong> support Regional Pricing Strategies, the Regional Transportation <strong>Plan</strong>shall include significantly improved transit options than are available <strong>to</strong>day inorder <strong>to</strong> provide real transit alternatives for those seeking <strong>to</strong> avoid user fees forsingle occupancy vehicle use. The funding for these transit services shall beincluded as an integral and initial component of any funding and operations planadopted in any pricing or <strong>to</strong>lling project.6. Expand EffectivelyIn addition <strong>to</strong> funding the Useful <strong>Transit</strong> Network, the Regional Transportation<strong>Plan</strong> shall invest in transit service enhancements and expansions that yieldpatronage commensurate with high levels of transit service and connectivity, andsignificantly contribute <strong>to</strong> achieving regional environmental, social and economictargets.108
7. Expand Travel Choices.In more suburban communities and given the rapidly aging region, the RegionalTransportation <strong>Plan</strong> shall pursue and "incentivize" a greater supply and use ofprivate and non-profit accessible taxis and vans <strong>to</strong> as an alternative <strong>to</strong> theprovision of fixed route and paratransit services in areas not well suited for fixedroute service.8. Safely Share the Public Right of WayThe Regional Transportation <strong>Plan</strong> shall encourage the adoption of Right-of-Waydesign standards by local communities that facilitate alternative modes oftransportation, such as bicycling, walking and public transit. These standardsshall embrace the concept of "complete streets" <strong>to</strong> encourage the balanced useof public rights of way for transit, bicycling and pedestrians <strong>to</strong> reduce au<strong>to</strong>mobiletraffic, improve public health, air quality and safety on our streets by all users.9. Better Coordinate <strong>Transit</strong> and Land Use <strong>Plan</strong>sMTC and the transit opera<strong>to</strong>rs shall participate with ABAG in an ongoing cycle ofintergovernmental and community-based consultation and coordination betweentransit and land use plans. ABAG shall establish a process for transit opera<strong>to</strong>rs <strong>to</strong>consult and coordinate with local governments, residents, transit cus<strong>to</strong>mers,businesses, and other community stakeholders who through their respective landuse-related decisions may have significant impacts on the effective provision oftransit services.109