A Profile of Hyndburn - 2004 - Hyndburn Borough Council
A Profile of Hyndburn - 2004 - Hyndburn Borough Council
A Profile of Hyndburn - 2004 - Hyndburn Borough Council

You also want an ePaper? Increase the reach of your titles
YUMPU automatically turns print PDFs into web optimized ePapers that Google loves.
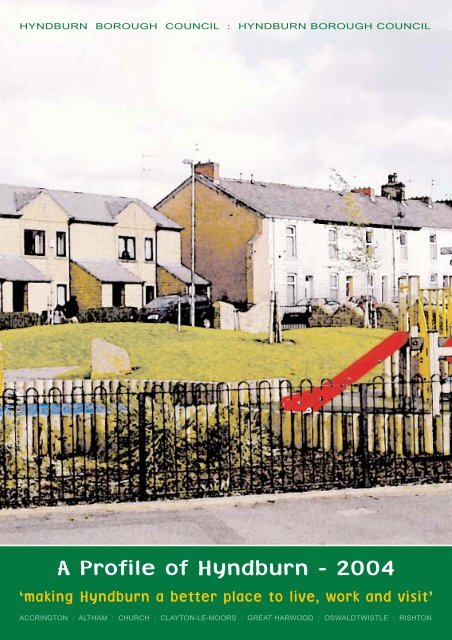
HYNDBURN BOROUGH COUNCIL : HYNDBURN BOROUGH COUNCILA <strong>Pr<strong>of</strong>ile</strong> <strong>of</strong> <strong>Hyndburn</strong> - <strong>2004</strong>‘making <strong>Hyndburn</strong> a better place to live, work and visit’ACCRINGTON : ALTHAM : CHURCH : CLAYTON-LE-MOORS : GREAT HARWOOD : OSWALDTWISTLE : RISHTON
A PROFILE OF HYNDBURNCONTENTSPage NumberA <strong>Pr<strong>of</strong>ile</strong> <strong>of</strong> <strong>Hyndburn</strong> <strong>2004</strong> - Purpose1. Introduction 22. The Economy 43. Population 104. Housing Stock 165. The Housing Market 276. Housing Needs – Supported Housing and Special Needs 36• Elderly Households• Physical disabilities/sensory Impairment/limiting long term illness• Mental health• Learning disabilities• Homeless households• Vulnerable young people• Lone teenage parents• Domestic violence• Minority ethnic groups• Other needs• Substance misuse7. Social factors – health 528. Social factors – education 559. Social factors – crime and community safety 5810. Appendices 61Appendix 1 – List <strong>of</strong> supporting informationAppendix 2 – Social rented stock in <strong>Hyndburn</strong>
A PROFILE OF HYNDBURN <strong>2004</strong> - PURPOSEThe <strong>Council</strong>’s Housing Strategy sets out <strong>Hyndburn</strong>’s priorities for strategichousing investment in the borough. It is a forward-looking strategy thatencompasses the <strong>Council</strong>’s vision for the future and has been developedusing a corporate approach. It aims to ensure that spending on housingsupports the <strong>Council</strong>’s wider objective <strong>of</strong> achieving balanced sustainablecommunities.To assist in developing the Strategy a thorough and comprehensive socioeconomicand demographic review <strong>of</strong> <strong>Hyndburn</strong> has been undertaken. Thisreview presents a detailed picture <strong>of</strong> the existing economic, housing, socialand demographic position within <strong>Hyndburn</strong>.The resulting <strong>Pr<strong>of</strong>ile</strong> document identifies the issues and themes that theHousing Strategy needs to address and provides a benchmark against whichthe progress and delivery <strong>of</strong> the Housing Strategy can be measured.1. INTRODUCTION<strong>Hyndburn</strong> is situated to the south east <strong>of</strong> Lancashire County in NorthwestEngland. It is the smallest district in the county, and comprises 17 wards. Ofthe six towns in the district, Accrington is the main town and administrativecentre – also the home <strong>of</strong> Accrington Stanley Football Club. The M65motorway runs through the district, linking the M6 and M62 and to the rest <strong>of</strong>the national network. Accrington has a railway station linking to the rest <strong>of</strong> thenorth and UK, whilst Manchester provides the nearest airport. The followingmaps show the borough’s locational context in relation to Lancashire and thenorth-west.Location <strong>of</strong> <strong>Hyndburn</strong> District2
Several important pieces <strong>of</strong> research have recently been undertaken in<strong>Hyndburn</strong> and East Lancashire that provide up to date and robust housingneeds information to underpin the Housing Strategy.A housing needs survey <strong>of</strong> the entire <strong>Hyndburn</strong> <strong>Borough</strong> was undertaken byDavid Couttie Associates during summer 2003, and a borough-wide housecondition survey as part <strong>of</strong> an East Lancashire wide survey has just beenfinished (Autumn <strong>2004</strong>) by consultants David Adamson. GVA GrimleyConsultants produced a comprehensive Strategic Development Frameworkfor <strong>Hyndburn</strong> in support <strong>of</strong> the submission to the Office <strong>of</strong> the Deputy PrimeMinister (ODPM) for the East Lancashire Housing Market Renewal Pathfinder‘Elevate East Lancashire’ in December 2003.Other council strategies and plans and those <strong>of</strong> our partner agencies within<strong>Hyndburn</strong> and across East Lancashire have also informed this pr<strong>of</strong>iledocument e.g. East Lancashire Housing Strategy, ‘Towards a Black andMinority Housing Strategy for East Lancashire’, <strong>Hyndburn</strong>’s CommunityStrategy 2003-2008 and <strong>Hyndburn</strong>’s Neighbourhood Renewal Strategy 2002-2008.Other key sources <strong>of</strong> information include the following. A comprehensive list<strong>of</strong> sources is identified at Appendix 1.• Census 2001• CURS – ‘Changing housing markets in Cheshire, Cumbria and Lancashire’2003• HM Land Registry• Lancashire Structure Plan 1991 – 2006• Joint Lancashire Structure Plan 2001 – 2016 (deposit edition)• <strong>Hyndburn</strong> Local Plan 1991 – 2006• DCA Housing Needs Survey 2003• DCA Supply / Demand Analysis 2003• LCC District Commissioning Plan for <strong>Hyndburn</strong> 20023
2. THE ECONOMYKEY TRENDS / THEMES• Unemployment is lower than the national average, however higher than theregional average• High % <strong>of</strong> unemployment in the 16 to 24 year age group• Low proportion <strong>of</strong> students and a high proportion <strong>of</strong> permanently sick / disabled• Decline in numbers employed in manufacturing, education, agriculture, forestry,fishing and mining• Increase in numbers employed in the construction and business sector• Average earnings below the national and regional average• 4 wards in the 10% most deprived wards in EnglandEconomic activity / InactivityEconomic activity rates measure the percentage <strong>of</strong> resident population aged16-74 in paid employment, unemployed people actively seeking employmentand full-time students. The rate in <strong>Hyndburn</strong> is higher than the regionalaverage and higher than other East Lancs districts, although slightly lowerthan the national average as the following table shows.Economic Activity Rates (Census 2001)LocalAuthorityAll peopleaged 16 -74(number)EconomicActivity Rate(%)%Economicallyactive:Employees(Part-time)%Economicallyactive:Employees(Full-time)%%Economicallyactive: SelfemployedEconomicallyactive:Unemployed%Economicallyactive: FulltimestudentBlackburn 94,322 61.33 11.77 36.79 6.5 4.13 2.14with DarwenBurnley 62,617 64.27 12.34 40.5 6.18 3.14 2.11<strong>Hyndburn</strong> 56,957 64.52 11.42 41.14 6.66 3.22 2.08Pendle 62,344 63.34 11.47 38.05 8.17 3.56 2.09Ribble Valley 39,005 69.49 12.83 39.96 12.75 1.61 2.34Rossendale 46,644 67.13 11.51 42.27 8.57 2.85 1.93East361,889 65.01 11.89 39.79 8.14 3.09 2.12LancashireNorth West 4,839,669 63.91 11.87 38.77 7.1 3.63 2.54England66.87 11.81 40.81 8.32 3.35 2.5835,532,091Source:- ONS Census <strong>of</strong> Population 2001Economic inactivity comprises those who are retired, permanently sick ordisabled, looking after home and family and part-time students. <strong>Hyndburn</strong> incommon with other East Lancs districts has a low proportion <strong>of</strong> students and ahigh proportion <strong>of</strong> permanently sick or disabled – in fact the highest in thearea.4
Economic Inactivity (Census 2001)VariablesAll peopleaged 16-74(number)% Retired % Student %- Lookingafterhome/family% Permanentlysick/disabled%Economically inactive:OtherTotalEconomicInactivity(%)Blackburn with 94,322 12.44 4.53 8.67 8.44 4.57 38.65DarwenBurnley 62,617 13.73 3.45 6.16 8.86 3.53 35.73<strong>Hyndburn</strong> 56,957 13.6 3.42 5.84 9.01 3.62 35.49Pendle 62,344 13.82 3.79 7.35 7.81 3.89 36.66Ribble Valley 39,005 16.52 3.26 4.34 4.46 1.93 30.51Rossendale 46,644 12.96 3.51 5.68 7.91 2.82 32.88East361,889 13.85 3.66 6.34 7.75 3.39 34.99LancashireNorth West 4,839,669 14.28 4.62 6.12 7.75 3.32 36.09England 35,532,091 13.54 4.67 6.52 5.3 3.1 33.13Source:- ONS Census <strong>of</strong> Population 2001Unemployment<strong>Hyndburn</strong> has a high % <strong>of</strong> unemployment in the 16 to 24 age group relative toother East Lancashire districts, the north-west and England as a whole,comprising a third <strong>of</strong> the total unemployed. In contrast the % aged 50 pluswho are unemployed is lower than the regional average, as is the % that havenever worked.Unemployment (Census 2001)VariablesAll peopleaged 16-74(number)% unemployed:Aged 16 - 24% unemployed:Aged 50 andover% unemployed:Who have neverworked% unemployed: Whoare long-termunemployedBlackburn with 94,322 31.38 13.85 12.28 29.08DarwenBurnley 62,617 31.88 15.35 7.63 24.1<strong>Hyndburn</strong> 56,957 35.81 14.85 7.64 21.18Pendle 62,344 32.3 14.73 8.42 24.95Ribble Valley 39,005 25.76 23.85 4.45 22.42Rossendale 46,644 33.96 17.55 7.76 25.68East361,889 31.85 16.70 8.03 24.57LancashireNorth West 4,839,669 28.39 17.28 10.16 31.66England 35,532,091 25.69 18.63 9.27 30.26Source:- ONS Census <strong>of</strong> Population 20015
Occupation groups / employment structure by sectorOccupation Groups, (Census 2001)All People Aged 16-74 in employment (%)Occupation GroupEastLancashireNorthWestEngland& WalesManagers & senior <strong>of</strong>ficials 13.5 13.7 15.1Pr<strong>of</strong>essional occupations 9.0 10.5 11.2Associate pr<strong>of</strong>essional & technical occupations 11.6 12.8 13.8Administrative & secretarial occupations 11.1 13.1 13.3Skilled trades occupations 13.6 11.7 11.6Personal service occupations 8.2 7.6 6.9Sales & customer service occupations 7.4 8.3 7.7Process; plant & machine operatives 13.7 9.8 8.5Elementary occupations 11.9 12.5 11.9All People Aged 16-74 in employment 219,772 2,900,020 23,627,754Source:- ONS Census <strong>of</strong> Population 2001The workforce in East Lancashire, including <strong>Hyndburn</strong>, is characterised by ahigh proportion employed as plant and machine operatives relative to theregional and national average, and an orientation towards skilled tradesoccupations. Relatively fewer people are employed in pr<strong>of</strong>essionaloccupations compared to the regional and national figures. A quarter <strong>of</strong> thepopulation is employed in the manufacturing sector.Employment ChangeEmployment Change, 1997-2001 - Employee Jobs1997 1998 1999 2000 20011997-01(%)DistrictBlackburn 58,800 62,000 60,500 61,100 61,700 +5.0Burnley 35,500 36,700 36,100 35,600 35,900 +1.3<strong>Hyndburn</strong> 27,100 27,500 26,600 28,000 28,600 +5.5Pendle 30,100 31,200 29,900 29,900 30,700 +2.0Ribble Valley 20,700 21,800 21,900 22,800 23,100 +11.5Rossendale 22,600 23,200 22,400 22,400 21,300 -6.0EAST LANCASHIRE 194,800 202,500 197,400 199,700 201,300 +3.4Sector AnalysisAgriculture,forestry,fishing 1,600 1,100 1,000 800 700 -54.6Mining; energy/water 600 400 400 600 500 -18.6Manufacturing 69,500 71,500 66,000 64,600 59,100 -14.9Construction 7,100 7,000 7,400 9,200 9,600 +34.5Wholesale & retail trades 31,300 33,800 34,400 34,000 37,000 +18.0Hotels & restaurants 9,500 10,000 9,600 11,700 10,900 +14.1Transport & communic. 8,400 9,100 8,800 8,200 9,200 +10.1Financial intermediation 3,200 3,200 2,900 2,600 2,600 -18.5Other business services 12,700 13,100 13,900 16,000 16,800 +32.5Public admin & defence 7,200 9,500 9,700 8,400 8,100 +11.9Education 13,500 14,500 11,700 11,800 11,800 -12.06
Health & social work 22,500 22,000 23,300 23,300 25,700 +14.0Other services 7,500 7,400 8,300 8,700 9,200 +22.7EAST LANCASHIRE 194,800 202,500 197,400 199,700 201,300 +3.4Lancashire 549,100 565,900 565,100 576,700 583,900 +6.4NW (thous) 2,701.0 2,788.4 2,840.8 2,846.0 2,887.0 +6.9GB (thous) 23,747.6 24,358.4 24,839.0 25,233.0 25,456.4 +7.2Source: ONS - Annual Employment Survey/Annual Business Inquiry (1997-2001)<strong>Hyndburn</strong> in common with other East Lancashire authorities has shownsignificantly less growth in the number <strong>of</strong> employee jobs than the region andthe UK. The area continues to undergo structural changes in key employmentareas i.e manufacturing. There is a decline in the numbers employed inmanufacturing, education, agriculture, forestry and fishing and mining, energyand water. Conversely, sub-regionally there has been an increase in thenumbers employed in construction and the business sector. This suggests abuoyant sector with potential for future growth and investment.Average earningsThe following table shows the average earnings for <strong>Hyndburn</strong> in 2002. Theyare significantly below the regional and national average and illustrate the lowwage nature <strong>of</strong> the East Lancashire economy. The key to successfulregeneration <strong>of</strong> the area will be the diversification <strong>of</strong> employment opportunitiesand the attraction and retention <strong>of</strong> higher wage employers. There is a need todrive up wages in order to facilitate local people’s access to decent housing.Average Earnings & Hours <strong>of</strong> Work - Full-Time Adult EmployeesApril 2002Average Gross WeeklyEarnings (£s)Average HourlyEarnings (£s)Average Weekly HoursBlackburn 370.20 9.46 39.0Burnley 366.99 9.18 39.8<strong>Hyndburn</strong> 386.77 9.60* 40.1Pendle 351.59 8.80* 39.5Ribble Valley 597.80* 10.10* 40.6Rossendale 337.48 8.40* 40.6EAST LANCASHIRE 395.80* 9.28 39.8Lancashire NUTS-2 407.63 10.10 39.5North West 426.75 10.75 39.5Great Britain 464.75 11.73 39.6Note: Data refers to full-time employees on adult rates; * = estimated figures (not <strong>of</strong>ficial)Source: ONS - New Earnings Survey, 2002Deprivation (index <strong>of</strong> multiple deprivation)Index <strong>of</strong> Deprivation 2000The Index <strong>of</strong> Multiple Deprivation 2000 is a measure <strong>of</strong> relative deprivationagainst 6 domain indices:- income, employment, health deprivation and7
disability, education, skills and training, housing and geographical access toservices. In 2000 <strong>Hyndburn</strong> ranked 51 st out <strong>of</strong> 354 local authorities inEngland. Currently (July <strong>2004</strong>) under the Indices <strong>of</strong> Deprivation (2000)<strong>Hyndburn</strong> is the 45 th most deprived district in England.The indices are also calculated for wards and ranked within the 8414 wards inEngland. The ward with a rank <strong>of</strong> 1 is the most deprived and 8414 the leastdeprived.In <strong>Hyndburn</strong> the wards <strong>of</strong> Church, Springhill, Barnfield and Central are allwithin the 10% most deprived wards in the country. Of these Central ward isthe most deprived ward in <strong>Hyndburn</strong>, with an overall rank <strong>of</strong> 95. A further 5wards are within the 20% most deprived wards. There are also pockets <strong>of</strong>deprivation in other areas <strong>of</strong> the borough.Index <strong>of</strong> Multiple Deprivation 2000 - <strong>Hyndburn</strong>Overall Housing EmploymentHealthEducationIncomeAccess(to shops,facilitiesetc)Central 95 15 410 275 462 38 8,239Springhill 427 348 932 390 663 402 5,109Church 324 628 581 149 567 412 7,044Barnfield 737 1,495 671 191 1,921 902 8,146<strong>Hyndburn</strong> 1,086 1,996 1,306 422 1,794 1,216 6,758In respect <strong>of</strong> child poverty two wards Central and Springhill are ranked in thetop 1% in England.Index <strong>of</strong> Deprivation <strong>2004</strong>In April <strong>2004</strong> the government published the English Indices <strong>of</strong> Deprivation(<strong>2004</strong>) which replace the Indices <strong>of</strong> Deprivation (2000). A number <strong>of</strong>deprivation indicators are combined across 7 domains into a singledeprivation score and rank for every area. Super Outputs Areas (SOA’s) areused for the production and dissemination <strong>of</strong> small area data. <strong>Hyndburn</strong> has53 SOA’s. In size they are between unit postcodes and wards.The new indices <strong>of</strong> deprivation include new measures for crime, housing andthe environment – the housing related one being ‘Barriers to Housing andServices’.Under the new index <strong>Hyndburn</strong> no longer has any ranking below 50. Thesingle deprivation score for <strong>Hyndburn</strong> is now 61. Reasons for the relativechange between the 2000 and <strong>2004</strong> Indices are because some real changehas taken place over time and the measurement methodology has beenrecalibrated and refined.Under 6 <strong>of</strong> the 7 new domains <strong>Hyndburn</strong> has several SOA’s ranked in thelowest 10% or lowest 10-20% <strong>of</strong> SOA’s in England. The exception is the8
domain that measures barriers to housing and key local services where no<strong>Hyndburn</strong> SOA is in the bottom 10% or 10-20%.In addition to the already recognised deprivation in the ‘4 wards’ (Barnfield,Central, Church and Springhill) all having SOA’s in the lowest 10%, the newrankings also highlight deprivation in Clayton Le Moors, Huncoat, Immanuel,Netherton and Peel.9
3. POPULATIONKEY TRENDS / THEMES• The population in the borough was 81,487 in 2001. Mid year estimate for 2002 is81,800• Population increased by 3.7% between 1991 and 2001 and is projected toincrease by a further 2% by 2016• BME population increased from 5.86% to 8.3% <strong>of</strong> total population between 1991and 2001• Projected increase in the 20 to 29, 45 to 64 and over 65 age groups by 2016• Projected fall in the 0 to 19, 30 to 44 and over 80 age groups by 2016• Household formation projected to rise at over 3 times the level <strong>of</strong> populationincrease up to 2016DensityEast Lancashire has high population densities relative to the rest <strong>of</strong>Lancashire and the north-west. <strong>Hyndburn</strong> has the second highest density inthe sub-region at 1,116 persons per square kilometre. The density isintrinsically linked to the historic layout <strong>of</strong> the town and the predominance <strong>of</strong>terraced housing.Population change / growth / household formationThe population <strong>of</strong> <strong>Hyndburn</strong> at the time <strong>of</strong> the 2001 census was 81,487.<strong>Hyndburn</strong> in common with other towns in East Lancashire has experiencedmarked out-migration over the last decades <strong>of</strong> the 20 th century in response tothe decline <strong>of</strong> traditional manufacturing activity. However this trend has beenlargely <strong>of</strong>fset by the level <strong>of</strong> natural growth.Between 1981 and 1991 <strong>Hyndburn</strong>’s population declined by 1.1%, howeverbetween 1991 and 2001 it increased by 3.7% or 2,900 persons - 2,100 <strong>of</strong>these were due to natural growth, 900 due to in-migration. In the sub-regiononly Pendle has experienced higher growth rates.The CURS research mentions that loses through out migration has takenplace across most age groups, however this has been counterbalanced byinternal gains.The Office <strong>of</strong> National Statistics 2002 mid year population estimate for<strong>Hyndburn</strong> is 81,800. The population is projected to increase (from the 2001census figures) by 1,604 (2%) by 2016 to 82,551.10
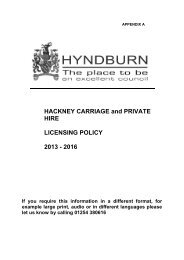
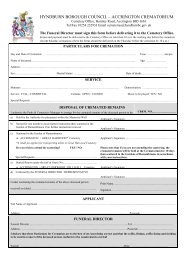
Age pr<strong>of</strong>ileThe age pr<strong>of</strong>ile <strong>of</strong> <strong>Hyndburn</strong> residents is largely consistent with county andregional averages for all ages.35Resident Population by Age Group %ONS – mid year estimates 200130%25201510<strong>Hyndburn</strong>E. LancsNW regionEngland & Wales500 - 14 15 - 24 25 - 44 45 - 64 65+Age GroupSource: ONS Mid-Year population estimates 2001EthnicityAccording to the 2001 census black and minority ethnic groups make up 8.3%<strong>of</strong> the borough’s population, (6,274 actual) with 96% <strong>of</strong> these being <strong>of</strong> Asianorigin. This percentage has increased considerably from the 1991 censusfigure <strong>of</strong> 5.62% as the following table shows. The 2001 census also indicatesthat the majority <strong>of</strong> BME communities are Muslims.<strong>Hyndburn</strong> Ethnic Groups %Ethnic Group 1991 Census 2001 CensusAll white groups 94.12 91.7All mixed N/a 0.6Indian 0.3Pakistani 4.956.7Bangladeshi 0.2Other Asian0.3Black/Black British 0.14 0.1Chinese/Other 0.53 0.2Born in Ireland 1.62Source:- ONS- Census11
Within <strong>Hyndburn</strong> the BME community is located in particular geographiclocations, primarily areas characterised by pre 1919 terraced stock.The most recent record <strong>of</strong> the ethnic origin <strong>of</strong> <strong>Hyndburn</strong> households wasobtained via the Housing Needs Survey 2003, the results <strong>of</strong> which are shownin the following table, with comparisons to the 2001 census.The ethnic origin recorded in the housing needs survey refers to ‘self’ which isin the main the head <strong>of</strong> household. 99.5% <strong>of</strong> respondents answered the ethnicorigin question, however the response from those <strong>of</strong> Pakistani background islow in comparison with the 2001 census whilst white households were overrepresented in the response.Ethnic Origin <strong>of</strong> Households in <strong>Hyndburn</strong>(Housing Needs Survey 2003)12
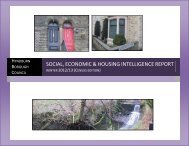
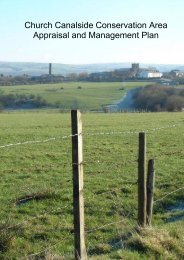
Household structure /household formation<strong>Hyndburn</strong> Population Structure - Census 2001Population Structure Census 20017.26%6.66%% aged 0 - 412.75% 16.19%% aged 5 - 15% aged 16 -2410.12%% aged 25 - 59% aged 60 - 74% aged 75+47.02%Change in Population Structure 1991 – 2001(Census 2001)% Change54321041.62.70.3All people0 - 45 - 1516 - 2425 - 59-1-2-3-0.6-2.6-1.660 - 7475+Age Group13
The graphs above show the population structure by age at the time <strong>of</strong> the2001 census and the % change in the structure between the 1991 and 2001census. Population has declined in the 0 – 4, 16 – 24, and 60 – 74 age groupsand risen significantly in the 25 – 59 age group.Population projections for the borough produced by Lancashire Countycouncil for the period 2001 – 2016 and detailed in the Housing Needs Survey2003, show the following trends:-Population Trends up to 2016Rise / Increase‣ Population projected to rise by 2%(1064 people) by 2016‣ The BME population has a youngerage structure than the whitepopulation with significant numbersunder aged 16‣ 20 to 29 year age group projected toincrease by 15.5% (1,427 people) by2016.‣ 45 to 64 year age group predicted torise by 22.9% (4,261 people) by2016. The largest increase between2006 and 2011‣ The 65 year plus age group grows by1,042 by 2016. The largest increasebetween 2011 and 2016Source:- Lancashire County <strong>Council</strong>Fall / Decrease‣ Up to 19 years age group projectedto fall by 4.8% (1,064 people. Thelargest fall between 2011 and 2016‣ The 30 – 44 year age group, the maineconomically active group, decreasesby 4,422. The largest fall between2011 and 2016‣ The over 80 years age group showsa fall <strong>of</strong> 2.2% - 69 fewer people by2016Up to 2016 household formation is projected to rise at over 3 times the level <strong>of</strong>population increase. This is due to a large increase in single personhouseholds through older people living longer, separation, divorce and youngpeople forming single person households – particularly in the 20 to 29 yearage group. This has implications for future affordable housing in the borough.14
Household CompositionHousehold Composition Census 20017%% one person h/h28.7%% pensioners living alone30.3%% other pensioner h/h% with dependent children% lone parent h/h8.2%14.8%Change in household composition 1991 to 2001(Census 2001)2017.36% Change1510507.8913.244.752.48All householdsone person h/hpensioners living aloneother pensioner h/hdependent childrenlone parent h/h-5-1.67Age Group15
In common with many other districts, <strong>Hyndburn</strong> has shown a significantincrease in one-person households and those containing dependent childrenbetween 1991 and 2001.4. HOUSING STOCKKEY TRENDS /THEMES• Percentage <strong>of</strong> owner-occupiers decreased from 79.2% to 74.6% between 1991and 2001• Percentage <strong>of</strong> households renting in the private sector increased from 6% to11% between 1991 and 2001• 5.6% <strong>of</strong> <strong>Hyndburn</strong>’s housing stock was vacant in March <strong>2004</strong>• Over 12,000 homes in the <strong>Borough</strong> are currently not compliant with thedecent homes standard. Of these 5,700 dwellings are statutorily unfit. – theseare over represented in vacant, pre 1919, terraced dwellings• 29.1% <strong>of</strong> housing in the Housing Market Renewal intervention areas is unfit• Over 50%<strong>of</strong> the housing stock is terraced limiting housing choiceThere are approximately 35,700 houses in <strong>Hyndburn</strong> (HIP 2003) with 22,000built before 1919. This includes dwellings that are vacant.The following table, with information from the Housing Needs Survey 2003,compares the dwelling type <strong>of</strong> <strong>Hyndburn</strong> housing stock in 1991, 2001 and2003.Dwelling TypeHNS 2003 % Nos. implied Census 2001%Census 1991%Detached 9.9 3,237 10.6Semidetached21.3 6,983 26.431.7Bungalow 6.7 2,183 N/aTerraced 53.3 17,424 54.3 60.2Flat /8.5 2,843 8.4 7.9MaisonetteMobile home 0.1 20 0.3 0.2Total 100.0 32,690 100.0 100.0Source:- HNS 2003• Locally the proportion <strong>of</strong> non – terraced houses and bungalows at 38% isbelow the national average <strong>of</strong> 54%• The supply <strong>of</strong> terraced houses at 53% is above the north-west average <strong>of</strong>31.7% and significantly above the national average <strong>of</strong> 20%16
TenureA defining characteristic <strong>of</strong> the tenure pr<strong>of</strong>ile in <strong>Hyndburn</strong> is the highproportion <strong>of</strong> owner-occupied housing at nearly 75% relative to the regional ornational average.The following table, with information from the Housing Needs Survey 2003,compares the tenure <strong>of</strong> <strong>Hyndburn</strong> households in 1991, 2001 and 2003.Household TenureTenure HNS 2003 % Nos. implied Census 2001%Census 1991%Owneroccupied40.5 13,286 39.8 44.0–mortgageOwneroccupied35.2 11,555 34.8 35.2–own outrightTotal owneroccupied75.7 24,841 74.6 79.2LA rented 10.6 3,489 9.9 12.7RSL rented 4.3 1,403 4.2 2.1Private rented 9.2 3,015 11.0 6.0Shared0.2 66 0.3 N/aownershipTOTAL 100.0 32,814 100.0 100.0Source:- HNS 2003Tenure Trends…• The proportion <strong>of</strong> owner-occupiers has decreased from 79.2% to 74.6%between 1991 and 2001• The size <strong>of</strong> the private rented sector has increased from 6% to 11% overthe same period and• The number <strong>of</strong> households occupying council accommodation has fallenby nearly 3% between 1991 and 2001Rented Social HousingA table <strong>of</strong> stock numbers by house type for <strong>Hyndburn</strong> Homes (council stock)and all registered social landlords is attached at Appendix 2<strong>Council</strong> housing characteristics• <strong>Hyndburn</strong> BC is the largest social rented landlord in the district with a totalstock <strong>of</strong> 3437 (Mar <strong>2004</strong>).• Approximately 67% <strong>of</strong> the stock is general needs and 33% shelteredaccommodation.17
• The total stock continues to diminish with the ongoing popularity <strong>of</strong> right tobuy. Over the period April 2003 to Mar <strong>2004</strong> a total <strong>of</strong> 115 units were sold.There has been an increase <strong>of</strong> 148% in the number <strong>of</strong> properties boughtunder RTB between 2000/01 and 2002/03. <strong>Hyndburn</strong> Homes BusinessPlan anticipates a drop in the stock <strong>of</strong> 100 per year in <strong>2004</strong>/05. The focus<strong>of</strong> RTB is on the more popular locations and the more popular propertytypes. Reasons for this increase include low interest rates, propertyspeculation and the impact <strong>of</strong> refurbishment <strong>of</strong> homes to meet the decenthomes standard. The emerging business plan for the new housingcompany needs to take account <strong>of</strong> the effects <strong>of</strong> this increase in right tobuy on the ability to pay for decent homes improvements.• 3.31% <strong>of</strong> the stock was vacant in March <strong>2004</strong> comprising 114 properties.However a significant number <strong>of</strong> these have been taken out <strong>of</strong>management pending a decision on their future. In May <strong>2004</strong>approximately 30 properties were unlettable due to lack <strong>of</strong> resources torepair and a further 20, whilst difficult to let, are in areas <strong>of</strong> potentialclearance as part <strong>of</strong> housing market renewal• Renting a council house is considered affordable with 97% <strong>of</strong> council rentsbeing below £60 /week.• The housing needs survey 2003 found that 81.8% <strong>of</strong> council tenants weresatisfied with their home. Of those households wishing to move within thenext 5 years, 24% <strong>of</strong> existing households expressed a preference forcouncil renting, this figure dropped to 17% for concealed households.However only 28% <strong>of</strong> new concealed households were registered on ahousing waiting list.• Over the last 5 years the number <strong>of</strong> households registered on the council’shousing register has shown an upward trend from 1096 in 2000 to 1455 in2003 and 2286 at the beginning <strong>of</strong> April <strong>2004</strong>. This trend is also reflectedin the number <strong>of</strong> households accepted as statutory homeless by thecouncil – 125 in 1999/00 and 288 in 2003/04.• The main reasons for households leaving council accommodation in2003/04 include tenants exercising their right to buy, with 115 householdsor 18% <strong>of</strong> all terminations. The next most common reasons were deathand abandonment. This reflects the high proportion <strong>of</strong> elderly tenants andsecondly the use <strong>of</strong> introductory tenancies for all new tenants. Othersignificant termination reasons between April 2003 to March <strong>2004</strong> include:-• 45 left as they were leaving the area• 47 moved into private renting• 41 were evicted• 33 moved into nursing homes18
Registered Social Landlords characteristics• The remainder <strong>of</strong> the social rented housing stock – 1635 at April <strong>2004</strong>– is owned and managed by 12 registered social landlords. TheAssociation with the largest number <strong>of</strong> properties is Accent with 568followed by Eaves Brook (part <strong>of</strong> the Harvest Housing Group) with 465.• At the beginning <strong>of</strong> April <strong>2004</strong> registered social landlords had 68dwellings vacant – just over 4% <strong>of</strong> their total stock.• In the <strong>2004</strong> HIP registered social landlords indicated that betweenthem they had a significant number <strong>of</strong> difficult to let and low demandproperties. Whilst these occur throughout the borough they are moreconcentrated in Accrington particularly the Woodnook and Scaitcliffeareas. Due to low demand some RSL’s do not have a waiting list forparts <strong>of</strong> their stock.• Findings from the housing needs survey indicate that 90.7% <strong>of</strong> housingassociation tenants were satisfied with their home and 12% <strong>of</strong> existinghouseholds wishing to move indicated a preference for housingassociation renting. Customer satisfaction surveys by individual RSL’sconfirm these findings in the majority <strong>of</strong> cases although satisfaction islower in areas where turnover is higher.• Although some RSL tenants have the Right to Acquire their housingassociation property there were no purchases from RSL’s with stock in<strong>Hyndburn</strong> during 2003/04.Private rented sector• The 2003 housing needs survey found that 9.2% <strong>of</strong> households rentedtheir home from a private landlord, implying approximately 3,015private rented dwellings in the borough. This has increased from 6%recorded in the 1991 census.• Rates <strong>of</strong> private renting in <strong>Hyndburn</strong>’s Housing Market Renewal area isabove average at 13.2% - the highest rate being in Clayton Le Moorsand Enfield at 17.9%.• It is estimated that there are approximately 1000 individual privatelandlords with properties in <strong>Hyndburn</strong>.• The housing needs survey indicate that 75.9% <strong>of</strong> occupants in thistenure were satisfied with their home. 3% <strong>of</strong> both existing householderslooking to move and newly forming / concealed households expresseda preference for private renting19
• The private rented sector is the tenure <strong>of</strong> necessity for thosehouseholds unable to access owner occupied or social rented housingi.e. younger single person households• The <strong>Council</strong> operates a voluntary accreditation scheme ‘<strong>Hyndburn</strong>Accredited Landlord Scheme’ (HALS) aimed at improving the quality <strong>of</strong>accommodation within the private sector. Since the scheme waslaunched in February <strong>2004</strong> over 200 landlords have expressed aninterest in the scheme, approximately 20% <strong>of</strong> all landlords in theborough. At the end <strong>of</strong> July <strong>2004</strong> 25 landlords had become accreditedwith a further 36 working towards accreditation. A total <strong>of</strong> 101properties have received accreditation.Houses in Multiple OccupationA House in Multiple occupation (HMO) is “ a house occupied by persons whodo not form a single household.” This broad definition includes bedsitters,hostels, flatlets, houses occupied with some degree <strong>of</strong> sharing and selfcontained units.It is estimated that there are in the region <strong>of</strong> 100 HMO’s throughout the<strong>Borough</strong> (HIP <strong>2004</strong>). These are mostly older 2 storey houses containing anumber <strong>of</strong> flatlets and bedsits. They are randomly scattered throughout theborough.Houses in Multiple Occupation represent some <strong>of</strong> the poorest housingconditions that are <strong>of</strong>ten occupied by some <strong>of</strong> the most vulnerable groups.All HMO’s known to the Authority are inspected according to a prioritisedinspection programme. 15 premises were visited during the last pro-activeprogramme. Of these 12 required statutory action and 3 were dealt with byinformal advice.Environmental Health Services aims to identify all HMO’s in the borough anduse all available statutory powers to improve conditions and ensure that alloccupants are able to enjoy a satisfactory standard <strong>of</strong> accommodation.Mandatory licensing for certain categories <strong>of</strong> HMO’s is being introduced. The<strong>Council</strong> is undertaking a survey <strong>of</strong> all HMO’s in the borough to highlight thosethat will be liable for compulsory licensing, with the intention <strong>of</strong> developing aseparate policy for the remainder.Vacancy rates and low demandVacancy rates are a key indicator <strong>of</strong> the health and effective functioning <strong>of</strong> thelocal housing market. In 2003 <strong>Hyndburn</strong> had the third highest proportion <strong>of</strong>stock that was vacant in Lancashire at 6.3% behind Burnley and Pendleboroughs and equal to Blackburn with Darwen. The updated <strong>2004</strong> HIPrecords that this percentage has now reduced to 5.6%. 2,021 properties werevacant at 1 April <strong>2004</strong>, <strong>of</strong> which 1,194 had been vacant for more than 620
months. Possible reasons for the reduction in the number <strong>of</strong> voids over thelast year include the expansion <strong>of</strong> the private buy to let market and theinvestment <strong>of</strong> private landlords in the local housing market.The following tables show <strong>Hyndburn</strong>’s proportion <strong>of</strong> vacant stock in relation toother boroughs in East Lancashire and shows the sub-regional picture.Proportion <strong>of</strong> Vacant Stock% vacant2001(Census)%vacant2003(HIP)%vacant<strong>2004</strong>(HIP)<strong>Hyndburn</strong> 6.1 6.3 5.6Burnley 7.4 7.8 8.3Pendle 6.3 6.5 6.6Rossendale 5.0 4.8 2.5Blackburn withnk 6.3 6.1DarwenNorth west 4.2 - -England and Wales 3.2 - -Source:- Census 2001/HIP 2003 & <strong>2004</strong>Results from the East Lancashire stock condition Survey indicate that 12.5%<strong>of</strong> the dwellings in <strong>Hyndburn</strong>’s Housing Market Renewal Intervention areasare vacant – 9.7% transitional vacant and 2.8% long term vacant. Springhilland Scaitcliffe ADF has the highest level <strong>of</strong> vacants at 18.6% followed byChurch and West Accrington with 15.3%. Short-term vacants (under 6months) are at risk <strong>of</strong> moving into the long term vacant classification.Private Sector Vacancy Rates by District (1996-2001)Variables % stock vacant (1996) % stock vacant (2001) Percentage change 1996-2001Blackburn with8.0 6.6 -1.4DarwenBurnley 7.1 10.2 2.9<strong>Hyndburn</strong> 6.3 8.7 2.4Pendle 6.1 5.8 -0.3Ribble Valley 4.6 4.7 0.1Rossendale 3.3 2.6 -0.9East Lancashire5.9 6.4 0.3(average)North West 4.7 4.7 0Source: CURS (2003) – “Changing Housing Markets in Cheshire, Cumbria and Lancashire”: dataderived from HIP data and DTLR websiteAs well as vacant properties, <strong>Hyndburn</strong> is characterised by a high level <strong>of</strong> lowdemand properties. The <strong>2004</strong> HIP classed approximately 12,000 dwellings aslow demand, the majority <strong>of</strong> which are in the owner-occupied sector. Howeverthere are a significant number in the social rented sector – 14.8% <strong>of</strong> the RSLstock is classed as low demand. Figures from GVA Grimley (2003) indicatethat 0.8% <strong>of</strong> council stock are low demand, rising to 15.1% in the RSL stock.The following table shows comparative data across East Lancashire.21
Local Authority Estimates <strong>of</strong> unfit, difficult to let and low demand dwellingsLocal Authority Unfit Dwellings Difficult to Let Dwellings Low Demand Dwellings% TotalSocialRentedDwellings% TotalPrivateDwellings% TotalLocalAuthorityDwellings% TotalHousingAssociationDwellings% Total LocalAuthorityDwellings% Total HousingAssociationDwellings% Total PrivatedwellingsBlackburn with6.2 42.4 n/a 1 n/a 53.4 43.4DarwenBurnley 0 27.4 n/a 30 n/a 30.9 52.9<strong>Hyndburn</strong> 0.5 29.3 1.2 14.8 0.8 15.1 39.1Pendle 10.8 11.7 17.5 2.2 20.5 18 63.6Ribble Valley 0 6 0 0 0 0 0Rossendale 6.4 9.4 10.1 5.9 21.1 21.1 13.5East Lancashire4 21 7.2 9 11 23 35(average)North West 13.9 9.6 18.3 8.4 24.6 13.4 13.1Source: Local Authority HIP returns, ODPM website adapted from CURS (2003) – Table 3.17 1Dwellings at riskRecent work undertaken by CURS sought to identify the number <strong>of</strong> propertieswithin East Lancashire considered to be ‘at risk <strong>of</strong> market decline’ in relationto the wider region. The trends are illustrated below.Dwellings within areas identified as at risk by Local Authority DistrictLocal Authority Total Dwellings %Dwellingsat RiskBlackburn withDarwenTotalHouseholds% OwnerOccupiersat Risk% PrivateTenants at Risk% Social Tenants atrisk55,177 74 37,394 61 6 34Burnley 38,513 73 25,764 68 9 23<strong>Hyndburn</strong> 32,795 79 23,986 75 7 18Pendle 36,370 73 24,734 77 8 16Ribble Valley 20,704 30 5,875 77 6 17Rossendale 27,438 57 14,734 66 6 28East Lancashire 210,997 64 145,895 68 7 25North West 2,828,338 57 1,506,810 54.4 8.5 37.1Source: CURS (2003) – “Changing housing markets in Cheshire, Cumbria and Lancashire”The May 2003 report by CURS on Changing House Markets in Cheshire,Cumbria and Lancashire considers areas at risk from changing demand. Itprovides a detailed analysis drawing on 1991 Census data, data from theIndex <strong>of</strong> Multiple Deprivation and house price data from the Land Registry.On the basis <strong>of</strong> previous work CURS focused on elements which they believeare crucial factors determining areas at risk because <strong>of</strong> changing demand andfor which data can be operationalised at enumeration district level. The factorsare:-22
• Areas or parts <strong>of</strong> the town in which there is a predominance <strong>of</strong> rentedhousing or low quality stock in owner occupation• A prevalence <strong>of</strong> obsolescent housing <strong>of</strong> a certain type• Areas with demographic characteristics likely to weaken demand• A concentration <strong>of</strong> households that are economically inactive orunemployedOverall <strong>Hyndburn</strong> has 79% <strong>of</strong> its total stock ‘at risk’ – higher than the subregionalaverage. The majority <strong>of</strong> at risk dwellings are concentrated in theprivate owner-occupied sector, although a significant number <strong>of</strong> socialtenants’ dwellings are also at risk at 18%.House Conditions and Unfitness<strong>Council</strong> stock conditionAn independently validated Public Stock Condition Survey <strong>of</strong> council stockwas completed in May 2003 based on a 15% representative sample. Thesurvey covered the current state <strong>of</strong> repair <strong>of</strong> properties and the rate <strong>of</strong> nondecency.The survey identified that the stock has benefited from the council’s pastmaintenance activity and is in relatively good order, although lack <strong>of</strong> someelements <strong>of</strong> planned and cyclical repair were evident. The report also showedthat:-• 664 homes failed the decent homes criterion (18.62% <strong>of</strong> the stock) and thecost <strong>of</strong> making them decent was £1,957,275• A further 2544 (71.34% <strong>of</strong> the stock) could fall into non-decency between2003 and 2010, if no appropriate investment is made into these properties.The cost <strong>of</strong> keeping these homes decent was £6,092,868.• A total <strong>of</strong> £154m <strong>of</strong> work is estimated to be required over the next 30 yearsto maintain the stockThe council stock condition survey information is updated on an ongoing basisfollowing completion <strong>of</strong> work or where data is found to be insufficient or out <strong>of</strong>date.RSL Stock ConditionMost registered social landlords with stock in the <strong>Hyndburn</strong> area have up todate information on their stock with house conditions surveys either beingcarried out recently or planned during the next couple <strong>of</strong> years. All RSL’srequire up to date information on stock to ensure their stock will meet thedecent homes standard by 2010.23
Stock Condition survey (all tenure)Over the last two or three years several strategies and documents have beenproduced in <strong>Hyndburn</strong> which include information on the condition <strong>of</strong> thehousing stock e.g. <strong>Hyndburn</strong>’s Neighbourhood Renewal Strategy 2002 – 2008and the East Lancashire Housing Market Renewal Pathfinder submission.However none <strong>of</strong> these have contained comprehensive stock conditioninformation and the council has relied on the 2001 census information toinform policy etc. However recently the council, in partnership with other EastLancashire local authorities, commissioned a comprehensive house conditionsurvey that took place during spring <strong>2004</strong>. The report produced results anddata for the entire <strong>Hyndburn</strong> district and more specifically for the HousingMarket Renewal Pathfinder areas within the district. Results from this inrelation to <strong>Hyndburn</strong> include the following:-• Overall 47.6% <strong>of</strong> dwellings in <strong>Hyndburn</strong> were constructed before 1919.This rises to 70.6% in <strong>Hyndburn</strong>’s Housing Market Renewal areas andto 85.7% in the Springhill and Scaitcliffe areas• <strong>Hyndburn</strong> has a vacancy rate above the national average, vacantproperties representing 7.5% <strong>of</strong> the total stock. This rises to 12.6% inthe housing market renewal areas.• The average rate <strong>of</strong> unfitness across <strong>Hyndburn</strong> is 17.1%, over 4 timesthe national average. However the rates vary from 6.4% in non housingmarket renewal areas to 29.1% in the Pathfinder area. The majority <strong>of</strong>unfitness is as a result <strong>of</strong> disrepair followed by dampness andinstability.• An estimated 12,165 dwellings in <strong>Hyndburn</strong> are not compliant with thedecent homes standard representing 36.1%. Non-compliance with thedecent homes standard is strongly associated with pre 1919 terraceddwellings and private sector vacant dwellings. Within the Pathfinderarea this rate rises to 51.6%.• The cost to remedy non decent homes within <strong>Hyndburn</strong> is estimated at£82.59m or an average <strong>of</strong> £6790 per dwelling. The average cost <strong>of</strong>remedying a non-decent home in the <strong>Hyndburn</strong> Housing MarketRenewal area is £7120, totaling over £58m.From existing sources i.e. Census 2001 and HIP <strong>2004</strong> the followinginformation is available:-• There are 9032 unfit properties in the <strong>Borough</strong> – accounting for 25% <strong>of</strong> thetotal stock. The majority <strong>of</strong> these are in the private sector.• The estimated cost <strong>of</strong> making 9000 private sector properties fit is £200m(HIP <strong>2004</strong>). Results from the House Condition Survey indicate the cost <strong>of</strong>making fit properties in the Housing Market Renewal areas is £57m.24
• From the Housing Needs Survey 2003, 13.5% <strong>of</strong> households (4330implied) live in housing inadequate for their needs. 1917 indicate theirproperty is too small and 3285 need repairs or improvements• 86% <strong>of</strong> households have central heating, with 78% having full centralheating, well below the national average <strong>of</strong> approx. 94%. Of council rentedaccommodation 90.7% <strong>of</strong> households have some form <strong>of</strong> central heating,above the all tenure average. (GVA Grimley)Meeting the Decent Homes StandardThe government target is to bring all social housing into decent condition by2010. A decent home has been defined as one that meets all <strong>of</strong> the followingcriteria:-A. It is above the current statutory minimum fitness standard for housingB. It is in a reasonable state <strong>of</strong> repairC. It has modern facilities and servicesD. It provides a reasonable degree <strong>of</strong> thermal comfortIn response to this <strong>Hyndburn</strong> <strong>Borough</strong> <strong>Council</strong> has carried out a sample stockcondition survey (see above) and an appraisal <strong>of</strong> its stock managementoptions to ensure that the decent homes standard is met and sustained in thefuture. The outcome <strong>of</strong> this has been a decision to carry out a large-scalestock transfer <strong>of</strong> the entire council stock to a new registered social landlord for<strong>Hyndburn</strong> but under the umbrella <strong>of</strong> an existing registered social landlordgroup. This transfer is expected to bring in about £154m <strong>of</strong> investment into theprivate sector housing stock over the next 30 years in order to meet the basicdecent homes standard and the requirements above this identified by tenantsin consultations – known as the <strong>Hyndburn</strong> Local Decency Standard.Energy efficiency – ‘safe, warm and healthy homes’The recent Elevate East Lancashire House Condition Survey (<strong>2004</strong>) foundthat the average SAP Rating for properties (all tenures) within the <strong>Hyndburn</strong>area is 53, above the national average <strong>of</strong> 51. It also found that almost 23% <strong>of</strong>households are in fuel poverty.‘Warm, affordable housing for all’ is part <strong>of</strong> the Community Vision for<strong>Hyndburn</strong> in the 21 st century expressed in the Sustainability Action Plan for<strong>Hyndburn</strong>.The <strong>Council</strong> works in partnership with a variety <strong>of</strong> agencies in <strong>Hyndburn</strong> todeliver initiatives to tackle fuel poverty and to promote affordable warmth.Within the <strong>Council</strong> the Home Energy Conservation Act (HECA) Group coordinatesactivities and promotes the council’s emerging Affordable WarmthStrategy and action plan. Wide-ranging measures to raise awareness <strong>of</strong> andinitiatives to promote energy efficiency are being developed within the actionplan.25
The council has worked in partnership with <strong>Hyndburn</strong> Homewise - the localHome Improvement Agency (HIA) – for the last 17 years, including providingfunding. Homewise co-ordinates the delivery <strong>of</strong> energy efficiency advice andgrants (for example Warm Front) to residents <strong>of</strong> the <strong>Borough</strong>.Energy efficiency advice, grant opportunities and help in maximisinghousehold income are delivered to residents in the four most deprived wardsin <strong>Hyndburn</strong> by the innovative Keep Warm and Keep Safe (KWAKS) Project(a Neighbourhood Renewal Funded initiative). This is co-ordinated anddelivered by <strong>Hyndburn</strong> Homewise.The council has a service level agreement with the Lancashire EnergyEfficiency Advice Centre (LEEAC). Information (such as individual HomeEnergy Check data) obtained from this partnership feeds into the <strong>Council</strong>'spicture <strong>of</strong> the housing stock in the <strong>Borough</strong>.The council is also part <strong>of</strong> the East Lancashire Continuous ImprovementGroup. This partnership is pro-active in promoting local activities, promotionsand grants among it's five East Lancs. local authority members.Through the Community Strategy, the <strong>Council</strong> is committed to increasing theaverage SAP rating (Standard Assessment Procedure – a measure <strong>of</strong> theenergy efficiency <strong>of</strong> an individual dwelling house) <strong>of</strong> homes in the <strong>Borough</strong>.There is a defined target in the Community Strategy Action Plan monitored bya specific Headline Indicator.The <strong>Hyndburn</strong> Accredited Landlord Scheme (HALS) requires landlords withinthe scheme to maximise and improve the energy efficiency <strong>of</strong> their properties.They are also required to encourage their tenants to save energy by makinginformation and opportunities available to them.The <strong>Council</strong>'s Private Sector Housing Grants Policy (2003) provides for allgrant-funded improvement work to incorporate energy-efficiency measuresand materials.26
KEY TRENDS / THEMES5. THE HOUSING MARKET• Average house price in <strong>Hyndburn</strong> in September <strong>2004</strong> was £75,960• Average prices for a terraced property in Sept. <strong>2004</strong> was £56,154• Between 2000 and <strong>2004</strong> house prices have risen by 74% in <strong>Hyndburn</strong>and by 39% in the last 12 months• 15% <strong>of</strong> all households are seeking to move by 2007• Over 2,000 households plan to leave <strong>Hyndburn</strong> in the next 3 years forbetter facilities and neighbourhoods• 57 new units <strong>of</strong> affordable housing per year need to be provided tosatisfy current housing needSub-regional comparisonSub-regional average house price comparisonsSeptember <strong>2004</strong>DetachedSemidetachedTerracedOverallaverage%changefromSept.2003%changefromJune<strong>2004</strong><strong>Hyndburn</strong> £159,209 £112,960 £56,154 £75,960 +39.18% +4.04%Burnley £171,504 £102,039 £40,505 £60,654 +24.47% +14.37%Pendle £232,816 £111,784 £49,939 £76,394 +18.66% -4.23%Rossendale £211,412 £124,055 £78,193 £116,223 +27.61% +10.73%BlackburnwithDarwen£178,866 £106,009 £62,232 £89,967 +32.43% +4.68%Lancashire £228,066 £135,202 £74,341 £121,750 +17.68% +2.3%North-west £252,135 £139,719 £84,680 £133,877 +23.96% +7.76%England & £284,145 £170,816 £143,771 £187,971 +16.73% +6.94%WalesSource:- HM Land RegistryThe table above shows sub-regional comparative house prices at September<strong>2004</strong> and percentage changes over the last 3 and 12 months. <strong>Hyndburn</strong> hasthe second lowest average house prices in East Lancashire behind Burnleyand similar to Pendle. Whilst house prices have been rising significantly in<strong>Hyndburn</strong> over the last 18 months, the rate <strong>of</strong> increase is now slowing down.The last quarter’s % increase <strong>of</strong> +4.04% is a reduction on the April - June<strong>2004</strong> figure <strong>of</strong> +17.27.Commentators and pr<strong>of</strong>essionals in the housing press have put some <strong>of</strong> therecent increase in house prices in parts <strong>of</strong> East Lancashire down tospeculation by developers keen to pr<strong>of</strong>it from the pathfinder work and throughsocial housing tenants exercising the right to buy. The residential lettingssurvey by the RICS in Jan. <strong>2004</strong> identified that first time buyers are being27
pushed out <strong>of</strong> the housing market by buy to let investors who becomelandlords <strong>of</strong> those who would otherwise be owner-occupiers.Local Housing Market TrendsThe house prices trends in <strong>Hyndburn</strong>, as calculated by the land registry, forthe 1999 – <strong>2004</strong> period are shown below. The general trend has beenupwards with a significant increase taking place over the last 12 months,however this is now leveling <strong>of</strong>f. There have been fluctuations, particularly inthe case <strong>of</strong> terraced houses when between 1999 and 2002 the price remainedrelatively static compared to the overall upward trend in prices.£180,000£160,000Average house prices in <strong>Hyndburn</strong> (1999 – <strong>2004</strong>)Average house prices in <strong>Hyndburn</strong> (1999 - <strong>2004</strong>)Average price£140,000£120,000£100,000£80,000£60,000£40,000£20,000£0DetachedSemi-detachedTerracedFlat / maisonetteOverall averageQuarter:APRIL - JUNE 1999APRIL - JUNE 2000APRIL - JUNE 2001APRIL - JUNE 2002APRIL - JUNE 2003APRIL - JUNE <strong>2004</strong>Source:- HM Land RegistryThe rate <strong>of</strong> increase or decrease in the price for each house type in <strong>Hyndburn</strong>over the 2000 –<strong>2004</strong> period is shown below.<strong>Hyndburn</strong> percentage change in prices by property typeDetached SemidetachedTerraced Overallaverage2000 - <strong>2004</strong> +76.34% +111.82% +102.64% +74.23%Jul - Sept 03ToJul - Sept 04+12.7% +44.44% +48.52% +39.18%Apr – Jun04To -0.17% +5.57% +11.58% +4.04%Jul – Sept04Source:- HM Land RegistryBetween 2000 and <strong>2004</strong> overall house prices have increased by 74% in<strong>Hyndburn</strong>, and during 2003/04 by over 39%, this is above the national28
average for England and Wales <strong>of</strong> +16.73%. During the last quarter, for whichfigures are available, average prices have increased by 4.04%, in line with thenational average for England and Wales <strong>of</strong> 6.94%. However the increase inhouse prices for semi-detached and terraced houses have been substantiallyin excess <strong>of</strong> this average, at 111% and 102% over the last 4 years.Whilst the statistics tell us average house prices this hides significantvariations in the local market. In Church and West Accrington, one <strong>of</strong> theintervention areas for housing market renewal, the price for a terraced housewas significantly below the borough average a year ago at approximately£20,000. During the last 6 months (Jan to June <strong>2004</strong>) the average price <strong>of</strong>terraced houses in this area has increased from £20,000 to £40,000. This isthe price for unmodernised properties with single glazing, no central heatingand where significant internal works are required. This reflects an upturn inthe housing market in the area with high demand from both local people andexternal private developers looking for opportunities that may arise fromhousing market renewal investment in the area. Prices <strong>of</strong> properties beingsold at auction are also attracting similar rates –recently an investor paid£15,000 for a property without a ro<strong>of</strong>.Investment in existing stock and new build residential developmentsince 1990The poor condition <strong>of</strong> a large proportion <strong>of</strong> the older private sector terracedstock has been the <strong>Council</strong>’s greatest cause for concern throughout the 1990sand continues to date. Over this period, social, demographic and economicchanges have dramatically increased the void rate in that sector, withconcentrations <strong>of</strong> empty properties serving to polarise the unpopularity <strong>of</strong>certain areas. At the same time, the private rented sector has increased,mainly in these same areas, as a result (initially) <strong>of</strong> an over-abundance <strong>of</strong>cheaply available property.The Urban (Private Sector) Renewal Strategy has concentrated availableinvestment into the areas where the problems <strong>of</strong> poor condition and oversupplyare most acute - the Scaitcliffe Renewal Area, and the Woodnook,West Accrington and Church areas.The level <strong>of</strong> demand for housing, as measured by the <strong>Council</strong>’s housingregister and housing associations’ waiting-lists and vacancy rates, hasindicated that during the period there has in the main been an adequatesupply <strong>of</strong> general needs social rented housing in the <strong>Borough</strong>. Exceptions tothis are to be found in some localised areas, for example Rishton where adevelopment <strong>of</strong> RSL general needs housing has been supported.RSL activity and investment has been concentrated on meeting two distincthousing needs, evidenced particularly by the previous Housing RequirementsStudy in 2000. These are to support the neighbourhood renewal and studyareas which mainly lie within the four wards with very high deprivationindicators, and to provide for identified special needs, specifically:29
• supported housing for young people• new accommodation and adaptations for those with physical disabilities• BME needs• housing and care needs <strong>of</strong> older peopleThe need for newbuild has always had to be very carefully weighed againstthe factors <strong>of</strong> over-supply and poor condition.Planning policy for the provision <strong>of</strong> new housing is based on householdformation rates and migration patterns. In the early 1990s the housing marketarea <strong>of</strong> Blackburn, <strong>Hyndburn</strong> and the Ribble Valley was expected to becomemore accessible (with the completion <strong>of</strong> the M65) and more closely linked tothe housing market operating in central Lancashire. Some compensatoryprovision (primarily in Blackburn) was made for the restraint placed uponfuture housebuilding in central Lancashire. Any housing clearance occurringwas presumed to be replaced on a one for one basis.The <strong>Hyndburn</strong> <strong>Borough</strong> Local Plan (adopted in November 1996) allocatedland to enable 3,300 dwellings to be built in the fifteen year period 1991 to2006. From mid 1991 to mid 2003 3,290 dwellings had been built, 43% onGreenfield land and 57% on previously developed land (brownfield.) Planningpolicy was to encourage development within the built up area <strong>of</strong> <strong>Hyndburn</strong>and during the period mid 1991 to mid 2003 98% <strong>of</strong> new dwellings were builtwithin the built up area.A major policy change occurred, at the national level, in March 2000 with thepublication <strong>of</strong> a revision to Planning Policy Guidance Note No. 3 on Housing(PPG 3.) This placed a greater emphasis on utilising previously developedland (brownfield) within built up areas for new house build rather than usingGreenfield land. It also advocated higher densities on sites with 30 dwellingsper hectare being the minimum. The average density figure in Lancashire atthe time was 24 dwellings per hectare. Following publication <strong>of</strong> PPG 3 the<strong>Council</strong> adopted Supplementary Planning Guidance on Housing ( in March2001) which made it clear that, with some exceptions, planning permissions inthe future would not be granted for housing development on Greenfield landor on land outside the built up area and development densities were expectedto be a minimum <strong>of</strong> 30 per hectare.In March 2003 new Regional Planning Guidance for the North West (RPG 13)was published with an emphasis on regeneration primarily in the metropolitanareas <strong>of</strong> Greater Manchester and Merseyside and to a lesser extent in EastLancashire. The result <strong>of</strong> this, and again taking account <strong>of</strong> householdformation and migration trends, was a reduced housing provision figure forLancashire as a whole and for the Districts within Lancashire.Existing planning approvals for new house building yet to be implementedmean that currently there is a significant oversupply <strong>of</strong> housing. In order totackle this issue changes were made to the Supplementary PlanningGuidance on housing (in November 2003) which now restricts the building <strong>of</strong>houses on all sites, with some exceptions, until the over provision diminishes.30
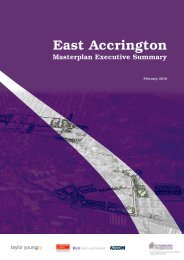
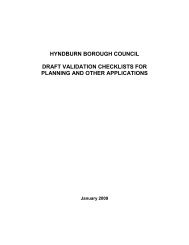
Future housing requirementsThe deposit edition <strong>of</strong> the Joint Lancashire Structure Plan 2001-2016 hasintroduced significantly lower housing targets for <strong>Hyndburn</strong> than the previousplans – 1850 dwellings for the period 2001 – 2016 with annual provision <strong>of</strong>110 dwellings between 2001 and 2006 and 130 dwellings between 2006 and2016. The Structure Plan also has the requirement that 85% <strong>of</strong> additionalhousing should be provided on previously developed land and through theconversion <strong>of</strong> buildings. Development on brownfield sites is also identified asa priority in The Sustainability Action Plan for <strong>Hyndburn</strong>.The Housing Needs Survey carried out by David Couttie Associates in 2003gathered comprehensive information on the future housing requirements <strong>of</strong>existing and newly forming households in <strong>Hyndburn</strong> over the next 3 years to2006. The key headline information is given in diagram below.In addition DCAssociates also completed a ‘Supply / Demand Analysis for<strong>Hyndburn</strong>’ the purpose <strong>of</strong> which was to identify over and under supply <strong>of</strong>specific house types and sizes by specific location. The results from theanalysis provide information from which to develop briefs for the delivery <strong>of</strong>social and affordable housing, with the objective <strong>of</strong> addressing stock gaps atlocal level.The key data from this analysis that will inform future delivery strategies is asfollows:-Private Sector Stock Supply / Demand Analysis• Demand for 1 bed stock exceedssupply in all areas except for Churchwhere a small surplus exists• There is a net surplus <strong>of</strong> 3 bed unitsacross the borough, particularly inAccrington. However shortfalls doexist in Church and Great Harwood• There is a stock shortfall <strong>of</strong> 2 bedaffordable homes – 61 units. Demandfor 2 bed flats is very low and onlyseen in the Clayton area.• A shortfall <strong>of</strong> 4+ bed stock existsacross the borough – 15 units in total.Shortfalls exist in Accrington, Rishtonand Great HarwoodAffordable Supply / Demand Analysis• There is a stock shortfall <strong>of</strong> 1 bedunits – 678 units. This is mostprominent in Accrington• 3 bed accommodation is in surplusacross the borough. Church has thelargest individual surplus.• Over 65% <strong>of</strong> the net shortfall <strong>of</strong>affordable housing arises in theAccrington area. The majority <strong>of</strong> thisshortfall relates to 1 and 2 bed flatsand 1 bed bungalows• Demand exceeds supply for 4+ bedaccommodation in all areas <strong>of</strong> theborough, except Clayton where asmall surplus existsThis analysis needs to be treated with caution as other sources <strong>of</strong> informationobtained through housing market renewal consultation indicate that local31
markets have their own characteristics. For example 1 bedroom units <strong>of</strong>accommodation are not popular and there is little demand for them. It hasbeen evident for some time that 1 bedroom bungalows are not popular withelderly or disabled households as an additional bedroom is needed for carers.32
Over 2000households plan toleave <strong>Hyndburn</strong> inthe next 3 years15% <strong>of</strong> householdsplan to move within3 years for betterneighbourhoodsand facilities7% <strong>of</strong>households wishto move butcannot afford toConcealed householdsmoving• 27% require onebedroomedaccommodation• 55% require twobedrooms• 77% would preferowner occupation• 17% prefer to rentfrom the council• 60% requireterracedaccommodationFuture housingrequirements41% <strong>of</strong> newly forminghouseholds cannotafford a mortgage <strong>of</strong>£50,000Existing householdsmoving• 72% require 2 or 3bedroomedaccommodation• 61% would preferowner-occupation• 24% prefer to rentfrom council• 12% prefer to rentfrom housingassociation33
Access to the marketDTZ Pieda Consulting carried out an assessment <strong>of</strong> the East LancashireHousing Market in 1999. The following key findings in relation to private pre1919 housing stock (primarily terraced housing) were made in respect <strong>of</strong><strong>Hyndburn</strong>.• A decline in demand equating to approximately 4,300 fewer propertiesbeing in demand by 2008• An increase in the number <strong>of</strong> vacant properties from 1,200 in 1998 to5,300 in 2008• Demand for pre-1919 property will continue to decline unless radical actionis takenData and analysis from the Housing Needs Survey 2003 make the followingobservations and comments on the relationship between local incomes andsupply <strong>of</strong> housing within <strong>Hyndburn</strong>.“First time buyers as new entrants to the housing market do not purchasehouses at average prices as they do not have average incomes” (HNS 2003).25% <strong>of</strong> households have annual incomes <strong>of</strong> less than £10,000 and 66% <strong>of</strong> thepopulation earn below the UK average <strong>of</strong> £23,000. The housing needs surveyfound that access to home ownership is beyond the reach <strong>of</strong> 25% <strong>of</strong>concealed households in <strong>Hyndburn</strong>. 65% <strong>of</strong> households are in receipt <strong>of</strong>financial support and 27% are in receipt <strong>of</strong> housing benefit. However,although the quality <strong>of</strong> stock is variable, it is not difficult for most workinghouseholds in the area to access owner occupation at least at the lower end<strong>of</strong> the market.To access the owner-occupied market in <strong>Hyndburn</strong> requires an income <strong>of</strong>£7,625 / annum to buy a 2 bed house in Accrington. To purchase a 3 bedterraced house in Clayton Le Moors and Great Harwood requires an income<strong>of</strong> £11,700 / annum. David Couttie Associates assess terraced houses to bethe main access property for first time buyers in view <strong>of</strong> their lower cost andhigh volume <strong>of</strong> sales in the <strong>Borough</strong>.Conversely access to the private rented sector is less affordable. An income<strong>of</strong> £10,600 / annum is required to rent a 1 bed flat in Rishton, rising to £14,400in Great Harwood. An annual income <strong>of</strong> £15,400 is required to rent a terracedhouse in Great Harwood. <strong>Hyndburn</strong> has the 2 nd highest % <strong>of</strong> housing benefitand council tax recipients in Lancashire.With mortgage interest rates at their lowest for over 35 years households whoare unable to enter the owner-occupied market at the present time may neverbe able to do so, unless they experienced a significant rise in income levels orthere is a significant collapse <strong>of</strong> the housing market.A key component <strong>of</strong> affordability is the size <strong>of</strong> the deposit necessary to bridgethe gap between the advance and purchase price. The average depositrequired by first time buyers in the fourth quarter <strong>of</strong> 2003 was 20.8% <strong>of</strong>34
purchase price. This compares with a low point <strong>of</strong> just 8.8% in the secondquarter <strong>of</strong> 1997. The other component <strong>of</strong> affordability is the ability to repaythe loan plus the ongoing cost <strong>of</strong> repairing and maintaining the property.(ODPM Housing Market Report Feb <strong>2004</strong>)This evidence shows that the costs <strong>of</strong> owner-occupation are very competitive.As mentioned above the increase in the prevalence <strong>of</strong> Buy to Let is resultingin many households being pushed into renting as owner-occupation becomesless affordable.AffordabilityThe 2003 Housing Needs Survey concluded that the total affordable housingneed annually in <strong>Hyndburn</strong> is for 774 units. Relets <strong>of</strong> the existing social rentedstock and new delivery averages 717 units and is the major means <strong>of</strong>addressing this need. After allowing for this level <strong>of</strong> supply, there will be anannual affordable housing shortfall <strong>of</strong> 57 units, which projected over the eightyearperiod to 2011 totals 456 units. This level <strong>of</strong> need is three times the level<strong>of</strong> new provision during the last 3 years which has averaged 19 units eachyear.The current local plan for the period 1991 – 2006, adopted in 1996, does nothave a policy on affordable housing. <strong>Hyndburn</strong> BC produced supplementaryplanning guidance in March 2001 (revised Nov 2003) in response to PPG3,Regional Planning Guidance for the north-west and publication <strong>of</strong> the depositedition <strong>of</strong> the JLSP 2001-2016. This guides the council as to materialconsiderations to be taken into account when determining residential planningapplications until the local plan is reviewed and was considered necessary toaddress 2 key issues:-• The oversupply <strong>of</strong> housing land already committed by existing planningpermissions• Managing the release <strong>of</strong> windfall sites, which are coming forward at agreater rate than predicted.The Lancashire Structure Plan for 2001-2016 states that the current levels <strong>of</strong>oversupply affecting parts <strong>of</strong> Lancashire may preclude the necessaryprovision <strong>of</strong> affordable houses. The main issue is to reverse past decline.Much new development in the past has been at the periphery <strong>of</strong> towns, awayfrom the inner urban communities. Elevate’s strategy for East Lancashireseeks to concentrate new housing development within or close to towncenters.Any future policy on affordable housing in <strong>Hyndburn</strong> will be addressed in thenew development plan document on housing that will be drafted in the nearfuture.The Housing Needs Survey concluded that the council will need to negotiatewith private landowners and developers to be able to deliver the scale <strong>of</strong>35
affordable housing required, particularly in the regeneration areas.Negotiations with the private sector for affordable housing will depend onlocation, market, site conditions and evidence <strong>of</strong> local need.KEY TRENDS / THEMES6. HOUSING NEEDSSPECIAL NEEDS/ SUPPORTED HOUSING• Promoting independence and supporting special needs groups inthe community and in supported accommodation• The decommissioning <strong>of</strong> residential homes and the development<strong>of</strong> extra care sheltered housing for older people• The development <strong>of</strong> an older person strategy• <strong>Hyndburn</strong> has a higher than county average <strong>of</strong> households with aphysical or sensory impairment or limiting long term illness• There is a shortfall <strong>of</strong> accommodation for people with mentalhealth problems• <strong>Hyndburn</strong> is a ‘hot spot’ for teenage pregnancies with conceptionrates higher than the national, regional and county averages• The BME population <strong>of</strong> <strong>Hyndburn</strong> has increased from 5.86% in1991 to 8.3% in 2001• The number <strong>of</strong> households applying to the council as homelesshas more than doubled in the last 5 yearsElderly householdsThe 2001 census shows that 14.8% <strong>of</strong> all households in <strong>Hyndburn</strong> arepensioners living alone, similar to the England and Wales average at 14.4%.The population <strong>of</strong> the 45 to 64 year and 65 year plus age groups is projectedto rise over the next 12 years to 2016. These age groups have also shown anincrease between the 1991 and 2001 census. The 2003 Housing NeedsSurvey shows a further increase since the 2001 census as the following tableshows.Age GroupPopulation Age GroupsHousing NeedsSurvey 2003%2001 Census%1991 Census%45 – 59 22.3 18.5 16.160 – 74 18.8 12.7 14.375+ 9.0 7.3 7.0Source:- HNS 200336
Although the very elderly population (85+) has increased by 0.4% between1991 and 2001, the projection to 2016 shows a fall <strong>of</strong> 2.2% in the over 80 agegroup.The housing needs survey found that 25.3% <strong>of</strong> respondents were in receipt <strong>of</strong>a state pension and 15.2% were receiving a pension from work.A significant feature <strong>of</strong> the social rented stock pr<strong>of</strong>ile is the number <strong>of</strong> tenantsaged 60 and above. Both <strong>Hyndburn</strong> Homes and Accent HA haveapproximately 50% <strong>of</strong> their tenants over 60 years (Accent 49%, <strong>Hyndburn</strong>Homes 55%).Demand for sheltered accommodation in <strong>Hyndburn</strong> tends to vary on an areabasis. Accent mentions that demand has declined but there are no difficult tolet areas. <strong>Hyndburn</strong> Homes states that difficult to let are primarily bedsits withpoor layout and small in size. There is low demand in some areas primarilydue to the location (on hill) e.g. Greenhill, Great Harwood and AlexandraClose, Clayton Le Moors both category 1 schemes. Finally Eaves Brook saysthat demand rose 5/6 years ago due to demographic trends, but has stabilisedover the last 1/2 years. Hyndbrook House was difficult to let but demand hasrisen slightly since conversion to extra care.Extra Care AccommodationPredictions by LCC social services indicate that between 2003 and 2006<strong>Hyndburn</strong> will have 184 elderly people who will require alternative supportedaccommodation to residential care.In response to this and in line with the LCC District Commissioning Planpriority to promote independence and support a higher proportion <strong>of</strong> elderlypeople in their own homes, Eaves Brook HA have recently developed(through remodelling) an extra care sheltered housing scheme in Accringtoncomprising 28 units to cater for the more frail elderly as an alternative toresidential care. This has been developed through a partnership between the<strong>Council</strong>, Social Services and the PCT in response to the county councilspolicy <strong>of</strong> closing residential care homes and promoting independence.Similar schemes have also been developed by Accent at Kirk House, Churchand by <strong>Hyndburn</strong> Homes on Plantation Square, Accrington, and the Springhillareas <strong>of</strong> Fairfield Street and Moorhouse Ave. At April <strong>2004</strong> there are a total <strong>of</strong>161 units <strong>of</strong> ‘extra care’ sheltered housing in <strong>Hyndburn</strong>.This has provided 3 levels <strong>of</strong> housing and care for elderly residents in theborough. The 3 levels <strong>of</strong> care provide the following services:-Category 1 – the benefits <strong>of</strong> a dispersed alarm intercom system linked to thecouncil’s 24-hour warden service.Category 2 – a dispersed alarm unit and the services <strong>of</strong> a resident schememanagerExtra care – as above plus the additional services that can include help withpersonal care, cooking and taking medication. These services will be tailored37
to individuals needs subject to an assessment by a social worker, DistrictNursing Officer and Housing Allocations Manager.The HNS recommends that a comprehensive older persons delivery strategyis developed to address the current and future growth in elderly and frailelderly households across all tenures and their related care and supportneeds.In addition a Lancashire wide Extra Care Sheltered Housing Strategy iscurrently being developed (August <strong>2004</strong>) to determine the future priorities forthe development and commissioning <strong>of</strong> extra care schemes in the county.Performance IndicatorsIn addition to LCC priority to promote independence and support a higherproportion <strong>of</strong> elderly people in their own homes, LCC and <strong>Hyndburn</strong> <strong>Borough</strong><strong>Council</strong> have signed up to the Older people PSA Target 5 to:-‘Improve the quality <strong>of</strong> life and independence <strong>of</strong> older people so that they canlive at home wherever possible, by increasing by March 2006 the number <strong>of</strong>those supported intensively to live at home to 30% <strong>of</strong> the total beingsupported by Social Services at home or in residential care.’The following indicators show the progression made towards meeting thistarget.National Performance Indicators collated by social services –2001/02 to 2003/04C26 - Admissions toresidential/nursing care(over 65) per 10,000 pop.2001/02 2002/03 2003/04<strong>Hyndburn</strong> 128.9 151.4 107.1Burnley 151.2 115.9 78.5Pendle 162.7 98.9 110.4Rossendale 137.5 120.9 135.6Ribble Valley 112.4 104.7 94.1Lancashire 118.9 107.4 99.8Source:- LCC Social ServicesThe figure for admissions <strong>of</strong> over 65’s to residential and nursing homes for<strong>Hyndburn</strong> has fallen over the last 3 years. The availability <strong>of</strong> extra caresheltered housing, intermediate care schemes and the preferred domiciliarycare provider scheme have all contributed to this fall. Although falling,<strong>Hyndburn</strong>’s admissions are still above the East Lancashire average with theexception <strong>of</strong> Rossendale. The target <strong>of</strong> social services locally is to reduce thisfigure still further in the future.38
C28 - Households (over 65)receiving intensive homecare per 1,000 pop.2001/02 2002/03 2003/04<strong>Hyndburn</strong> 14.8 19.6 22.4Burnley 13.4 16.7 22Pendle 13.7 16.3 18.4Rossendale 12.6 16.3 21.7Ribble Valley 10.1 11.5 12.1Lancashire 11.1 13.4 15.9Source:- LCC Social ServicesThis indicator measures the number <strong>of</strong> households receiving more than 10hours care and six visits per week. This figure has increased for <strong>Hyndburn</strong>over the 3-year period, the target is to continue increasing.C32 – Older people helpedto live at home (over 65) per1,000 pop.2001/02 2002/03 2003/04<strong>Hyndburn</strong> 90.59 91.99 92.2Burnley 77.81 82.32 85.3Pendle 81 80.96 84.6Rossendale 84.88 91.02 86.4Ribble Valley 70.12 70.74 65.6Lancashire 75.45 78.52 77.7Source:- LCC Social ServicesThis indicator shows the number <strong>of</strong> older people over 65 helped to live athome as an alternative to residential or nursing home admission. <strong>Hyndburn</strong>’srate, in common with most <strong>of</strong> East Lancashire, has increased slowly over thelast 3 years and needs to increase further in the future. <strong>Hyndburn</strong> Homewiseassists the County <strong>Council</strong> in meeting this target by providing aids andadaptations in older persons homes to assist in hospital discharges andprevent nursing home admissions.Physical disabilities / sensory impairment / limiting long term illnessThe term disability/sensory impairment covers a wide range <strong>of</strong> disability fromyoung people injured as a result <strong>of</strong> a road accident or sporting injury to people<strong>of</strong> any age who have had a stroke. Stroke is the most significant cause <strong>of</strong>disability in adults. The majority <strong>of</strong> people with a physical disability are under55.• The 2001 census indicates that 22% <strong>of</strong> the population suffers from alimiting long-term illness (LLTI).• The Lancashire CC district pr<strong>of</strong>ile in 2001 identified that 41% <strong>of</strong>households in <strong>Hyndburn</strong> have a member with LLT illness/disability –13,644 implied – an increase from the 1991 census <strong>of</strong> 11%. This figure is39
also 4% above the county figure. In addition 12% <strong>of</strong> <strong>Hyndburn</strong>’s populationdescribe their health as ‘not good’, compared with 10% for the countyaverage.• The LCC District Commissioning Plan 2002 states that the <strong>Hyndburn</strong>district has 8.2% <strong>of</strong> people with a LLTI / disability between the ages <strong>of</strong> 18 –64 years.The LCC Supporting people database has established that only a smallpercentage <strong>of</strong> people with a PD/SI are being helped by supporting peopleprojects – approx. 11.66%. <strong>Hyndburn</strong> is one <strong>of</strong> 6 districts in Lancashire thathas a higher than county average percentage <strong>of</strong> households with aPD/SI/LLTI, in both the general population and within the BME population,therefore would benefit from additional resources.The 2003 Housing Needs Survey found that 33% <strong>of</strong> households in the areacontained someone with a disability (10,767 implied). The highest proportionwas found to be living in rented accommodation (all tenures). The high level <strong>of</strong>owner occupiers without a mortgage reflects the older age pr<strong>of</strong>ile in thistenure.(p60) By far the largest group was those with walking difficulties, with8.2% <strong>of</strong> households containing a wheelchair user.The survey found that 10.9% <strong>of</strong> properties in the borough have been adapted.The most common form <strong>of</strong> adaptation was the provision <strong>of</strong> hand and grab railsfollowed by bathroom adaptations. Adaptation <strong>of</strong> council and housingassociation stock is considerably higher than the owner occupied sector.National Performance Indicators collated by social services2001/02 to 2003/04C27 - Admissions toresidential/nursing care(18 - 64) per 10,000 pop.2001/02 2002/03 2003/04<strong>Hyndburn</strong> 4.7 2.9 2.5Burnley 6 5.3 3.4Pendle 5.1 5 5Rossendale 4.6 4.3 2.3Ribble Valley 2.1 1.2 3.9Lancashire 3.5 3.35 2.7Source:- LCC Social ServicesThe number <strong>of</strong> admissions to residential and nursing care for 18 to 64 yearolds has reduced significantly in <strong>Hyndburn</strong> over the last 3 years exceeding thecounty average.40
C29 – people with physicaldisabilities helped to live athome (18 to 64) per 1,000pop.2001/02 2002/03 2003/04<strong>Hyndburn</strong> 5.85 6.05 5.8Burnley 4.8 4.64 5.1Pendle 4.62 4.54 4.9Rossendale 4.65 4.7 4.3Ribble Valley 2.83 2.54 2.5Lancashire 4.07 4.18 4.3Source:- LCC Social ServicesConversely in line with the LCC District Commissioning Plan to promoteindependence by living in supported housing rather than residentialaccommodation the number <strong>of</strong> people with physical disabilities between 18and 64 helped to live at home has remained steady over the last 3 years. Thetarget is to increase this figure.The National Service Framework for people with long-term health conditionsis expected to be published soon. The general emphasis <strong>of</strong> the NSF will be onempowering people to manage their own conditions. Close collaborationbetween partner agencies to ensure people get the support they need will berequired.Mental HealthNational Performance indicators for mental health services2001/02 to 2003/04C31 – people with mentalhealth problems helped tolive at home (18 to 64) per1,000 pop.2001/02 2002/03 2003/04<strong>Hyndburn</strong> 1 1.34 3.5Burnley 1.85 2.49 4.2Pendle 1.98 2.28 3.8Rossendale 2.34 2.71 2Ribble Valley 1.7 2.91 2.6Lancashire 1.87 2.48 3.13Source:- LCC Social ServicesThe 2002 LCC District Commissioning Plan for people with mental healthproblems is based on decommissioning residential care, and prioritises thecommissioning <strong>of</strong> services to support people to live at home including thedevelopment <strong>of</strong> additional supported housing in partnership with districtcouncils and RSL’s. The figures in the table above show the effects <strong>of</strong> thispolicy in <strong>Hyndburn</strong> with an increase in the number <strong>of</strong> people with mentalhealth problems helped to live at home over the last 3 years.41
The Mental Health and Social Care Strategy agreed by the LancashirePartnership Board in <strong>2004</strong> recommends that local needs for rentedaccommodation for people with mental health problems are assessed in eachdistrict in Lancashire.Gathering statistical information through postal surveys on the prevalence <strong>of</strong>mental illness in the community is unreliable and difficult. The 2003 housingneeds survey, through self-assessment, found 5.4% <strong>of</strong> respondents (1054households implied) mention that they suffered from a mental health problem.There is only limited specialist accommodation in the borough for people witha mental health problem – approximately 33 units <strong>of</strong> supportedaccommodation is receiving supporting people funding. This accommodationis provided through a number <strong>of</strong> specialist providers including Carr Gomm,Creative Support and staff from the Community Mental Health Team.Longer-term tenancy support for adults with mental health problems isidentified as a priority during <strong>2004</strong>/05 for <strong>Hyndburn</strong> in the LancashireSupporting People Shadow Strategy. There is a general shortfall in supportedaccommodation for people with mental health problems, reflected in the lowproportion <strong>of</strong> supporting people resources targeted at this client group. Thisleads to people being in hospital or rehab units for longer than necessary andmakes them less able to cope when they eventually move-on.Research by the SP team based on the needs <strong>of</strong> existing known clientsindicates that there is an estimated need for an additional 20 move-on unitsand 6 complex needs tenancies in <strong>Hyndburn</strong>.Several pieces <strong>of</strong> research have highlighted the need for:-• An integrated approach to housing and support• The provision <strong>of</strong> a wider spectrum <strong>of</strong> accommodation e.g. t<strong>of</strong>acilitate early discharge from hospital• A need to develop more flexible support arrangements to meetthe diverse needs and expectations <strong>of</strong> individuals who requireboth care and support• Specialist support for people with complex needsThere are increasing numbers <strong>of</strong> people with mental health problemspresenting to the council as homeless. The figure has increased steadily overthe last 3 years, and doubled during the last year with 34 householdsaccepted as statutory homeless in 2003/04. The borough’s homelessnessstrategy identifies as a priority partnership working to improve the support andaccommodation options available for homeless households with mental healthneeds.Learning disabilitiesSimilar to mental health, gathering information on the number <strong>of</strong> householdscontaining a member with a learning difficulty is also difficult. The 200342
housing needs survey found that 2.4% <strong>of</strong> respondents (465 implied) identifiedthemselves as having a learning difficulty.Preliminary figures from the LCC Supporting People Team indicate that thereare approximately 268 adults with Learning Disabilities in <strong>Hyndburn</strong>accounting for 0.33% <strong>of</strong> the population. The number <strong>of</strong> people living insupported accommodation in <strong>Hyndburn</strong> is 77 in an adult care home and 32 insupported living tenancies.In common with people with mental health problems, the LCC DistrictCommissioning Plan is committed to supporting more people with learningdisabilities in the community and in supported accommodation and make lessuse <strong>of</strong> residential and nursing home care, as the following table shows.National Performance indicator for learning disabilities service2001/02 to 2003/04C30 – people with learningdisabilities helped to live athome (18 to 64) per 1,000pop.2001/02 2002/03 2003/04<strong>Hyndburn</strong> 2.4 2.77 3.4Burnley 2.58 2.39 2.8Pendle 1.86 1.96 2.3Rossendale 1.57 1.96 2.4Ribble Valley 2.09 2.3 2.5Lancashire 2.09 2.31 2.7Source:- LCC Social ServicesThere are over 200 units <strong>of</strong> accommodation in <strong>Hyndburn</strong> for people withlearning difficulties funded through the supporting people regime. Provision isthrough a variety <strong>of</strong> providers including Social Services, the NHS Trust andPCT <strong>of</strong>ten in partnership with accommodation providers e.g. <strong>Hyndburn</strong>Homes and Eaves Brook HA. The National Autistic Society has 21 units <strong>of</strong>accommodation funded through supporting people based in <strong>Hyndburn</strong>.Homeless householdsThe number <strong>of</strong> households making homeless applications to <strong>Hyndburn</strong><strong>Borough</strong> <strong>Council</strong> has increased significantly over the last 5 years from 258 in1999/2000 to 676 in 2003/04. Of all the decisions made in 2003/04 - 42%were accepted for the full statutory rehousing duty.The main causes <strong>of</strong> homelessness in <strong>Hyndburn</strong>, in common with mostdistricts are parents, relatives and friends unable or unwilling toaccommodate, relationship breakdown (including domestic violence) and theending <strong>of</strong> assured shorthold tenancies.The following table shows the breakdown <strong>of</strong> reasons for homelessness overthe last 3 years.43
Reasons for Homelessness 2001 / 02 2002 / 03 2003 / 04Parents no longer able to accommodate 33 62 54Other relatives or friends no longer able 18 25 27to accommodateViolent relationship breakdown with 48 32 58partnerNon-violent relationship breakdown 37 38 39with partnerViolent relationship breakdown - 13 4involving associated personRacially motivated violence - 0 0Other forms <strong>of</strong> violence - 3 3Racially motivated harassment - 0 1Other forms <strong>of</strong> harassment - 7 11Mortgage arrears 7 2 4LA rent arrears - 0 1RSL rent arrears 0 2 0Private sector rent arrears 2 4 6End <strong>of</strong> assured shorthold tenancy 13 22 44Other reasons for loss <strong>of</strong> rented or tied 11 12 18accommodationIn institution 2 5 1Emergency / other 16 5 17TOTAL 187 232 288Source:- P1E returnsTemporary accommodation in <strong>Hyndburn</strong> is limited to one 6 unit homelesshostel primarily for women and children and 4 self-contained bedsits for youngsingle people aged 16 to 25. Refuges for those suffering from domestic abuseare accessed out <strong>of</strong> the borough as is short-term accommodation for singlepeople. Other homeless households remain ‘homeless at home’ with family,friends or relatives until a suitable permanent housing solution is identified.Both the <strong>Hyndburn</strong> Homelessness Strategy for 2003 – 2008 and theLancashire Shadow Supporting People Strategy identify lack <strong>of</strong> suitableaccommodation for single people over 25 and for those clients with a mentalillness as a priority for future development in the district.The multi-agency Homeless in <strong>Hyndburn</strong> is working in partnership with thestatutory and voluntary sector to deliver the priorities identified in thehomelessness strategy. To assist in achieving this a number <strong>of</strong> ServiceDelivery Groups have been developed to take specific projects forward e.g.mental health accommodation and a group to improve the services <strong>of</strong>fered toyoung homeless people.In preparation for the large-scale transfer <strong>of</strong> the council stock to an RSL, thecouncil has split the landlord and strategic housing function. The housingadvice and homelessness service remains with and is delivered through<strong>Hyndburn</strong> First, <strong>Hyndburn</strong> <strong>Borough</strong> <strong>Council</strong>’s regeneration agency.44
Vulnerable young peopleThe housing needs <strong>of</strong> the 16 to 25 year age group are well documented andfeature significantly in the <strong>Hyndburn</strong> Homelessness Strategy as a priority foradditional resources. During 2003/04 the council accepted 26 young peopleaged 16 and 17 as statutorily homeless, an increase <strong>of</strong> 3 since 2002/03. The2001 census found the 16 to 24 year age group to make up 10.1% <strong>of</strong> the totalpopulation, a decrease from 12.6% in 1991. However projections up to 2016indicate a rise in the 20 to 29 year group.<strong>Hyndburn</strong> has specialist emergency access accommodation for homelessyoung people (4 bedspaces) and a further 7 units <strong>of</strong> self contained move-onaccommodation with floating support provided through a partnership betweena housing association and a local voluntary agency / charity. Unfortunately interms <strong>of</strong> emergency or short-term accommodation, due to the shortage <strong>of</strong>accommodation young people <strong>of</strong>ten access accommodation options outsidethe borough.In respect <strong>of</strong> long term permanent accommodation the council ensures thatany tenancy given to a young person under the age <strong>of</strong> 18 is accompanied bya secure floating support package – although invariably demand outstripssupply. During 2003/04 the council rehoused 19 young people aged 16 and17 in tenancies with support. In respect <strong>of</strong> the ‘older’ young people 70 singlepeople aged 18 to 25 were allocated council tenancies during the sameperiod. RSL’s also require a level <strong>of</strong> support to be provided for all tenantsunder 18.Young people leaving care and youth <strong>of</strong>fenders aged 16 –19 also featurewithin the ‘vulnerable young people’ category. Three young people aged 18to 20 formerly in care received assistance under the homelessness legislationin 2003/04 and the Youth Offending Team indicates that approximately 12 <strong>of</strong>their clients will require assistance with accommodation during 2003/04.Lone teenage parentsResearch and statistics show that the rate <strong>of</strong> teenage pregnancies is highestin the most economically disadvantaged communities and amongst the mostvulnerable young people. East Lancashire has higher conception rates thanthe national, regional and county rates with <strong>Hyndburn</strong> identified as a ‘hotspot’. The high conception rates in East Lancs have also been linked to thetradition <strong>of</strong> young parenthood and larger families. The following table showsthe number <strong>of</strong> live births in under 18’s across East Lancashire.District Live births in under 18’s2001<strong>Hyndburn</strong> 62Burnley 56Rossendale 33Pendle 50Ribble Valley 7Source:- Lancs Teenage Pregnancy Partnership45
Within <strong>Hyndburn</strong>, Church ward is amongst 20 wards in Lancashire with thehighest conception rates.The government has a target that “all under 18 lone teenage parents whocannot live with family or partner should be placed in semi-independenthousing with support not in an independent tenancy.” In response to this theLancashire Teenage Pregnancy Partnership has been formed to co-ordinateplanning to meet this target, through detailed action plans. This is coordinatedin <strong>Hyndburn</strong> through the <strong>Hyndburn</strong> and Ribble Valley TeenagePregnancy Partnership.The council is committed to reducing teenage pregnancy and has ‘signed up’to LPSA Target 6 to ‘Reduce under the 18-conception rate’ and is workingwith LCC to achieve this. The Lancashire Teenage Pregnancy Partnershipgoal is to halve the rate <strong>of</strong> under 18 conceptions by 2010 and set a firmlydownward trend in under 16 conceptions.In respect <strong>of</strong> under 18 abortion rates, the latest figures available for 2001show that at 32.6% <strong>Hyndburn</strong> is below the county average <strong>of</strong> 40.6%. Nationaldata suggests conceptions to young women in more affluent areas are morelikely to lead to abortion, this is less likely in more deprived areas.Between July 2002 and Feb <strong>2004</strong> the council received homelesspresentations from 15 single pregnant girls under 18 and 18 teenage parentswith children.During 2003/04 the <strong>Council</strong> rehoused 13 lone parents under 18 inaccommodation with floating support (HIP <strong>2004</strong>). None were rehousedwithout support. At 1 April <strong>2004</strong> there were 3 lone parents under 18 in counciltenancies receiving floating support from the Carr Gomm Society.The district has up to 10 units <strong>of</strong> floating support for under 18 lone parentsprovided by Carr Gomm Society for households housed in council rentedaccommodation. Between March and June <strong>2004</strong> 8 out <strong>of</strong> 10 referrals to theCarr Gomm Project were from lone teenage parents or expectant teenageparents under 18.An ongoing survey carried out via the <strong>Hyndburn</strong> and Ribble Valley TeenagePregnancy Partnership has provided information on the housing and supportneeds <strong>of</strong> teenage parents. Between November 2003 and Feb <strong>2004</strong> <strong>of</strong> the 22young mothers seen, 1 lived in a homeless hostel and 6 lived in other forms <strong>of</strong>temporary accommodation. Comments made in respect <strong>of</strong> access housing in<strong>Hyndburn</strong> include ‘poor housing’, ‘too frightened to live in own house’, ‘longwaiting list for council property’ and ‘undesirable / bad areas’.46
Domestic violenceIn common with most local authorities, relationship breakdown is one <strong>of</strong> themost common reasons for homelessness in <strong>Hyndburn</strong>. During 2003/04 violentrelationship breakdown accounted for 20% <strong>of</strong> all acceptances and non-violentrelationship breakdown accounted for 13.5%.HARV – the <strong>Hyndburn</strong> and Ribble Valley Domestic Violence Team <strong>of</strong>fers avaluable one-stop access point <strong>of</strong> support and advice for women and childrensuffering abuse in the home. Services <strong>of</strong>fered include a telephone helpline,outreach support, counsellors and appointments at the centre, advice andinformation and practical support. In <strong>Hyndburn</strong> the majority <strong>of</strong> the funding forthe project has been secured through SRB6 (Single Regeneration Budget)and ERDF (European Regional Development Fund) which enables the projectto target work in four specific wards – Barnfield, Central, Church andSpringhill.The number <strong>of</strong> referrals to HARV has increased substantially in the lastquarter <strong>of</strong> 2003/04 as can be seen from the following chart. This increase hasalso been sustained between April and June <strong>2004</strong>.Referrals to HARVNumber <strong>of</strong> Referrals504540353025201510515519 181012354245392724Women fromSRB6/ERDF areasChildren fromSRB6/ERDF areasWomen from <strong>Hyndburn</strong>Children from<strong>Hyndburn</strong>0June 03 Sept 03 Dec 03 March 04 June 04Quarter EndingThere is no refuge accommodation for women and children fleeing domesticviolence in <strong>Hyndburn</strong> although access is possible to refuges in neighbouringBurnley and Blackburn. Locally there is provision <strong>of</strong> temporaryaccommodation at the council’s homeless families unit, although the natureand safety <strong>of</strong> this accommodation is not ideal.47
Provision <strong>of</strong> additional services for victims <strong>of</strong> domestic abuse is one <strong>of</strong> thesupporting people priorities for new services during <strong>2004</strong>/05.Minority ethnic groupsAccording to the 2001 census black and minority ethnic groups make up 8.3%<strong>of</strong> the borough’s population, (6,274 actual) with 96% <strong>of</strong> these being <strong>of</strong> Asianorigin. This percentage has increased considerably from the 1991 censusfigure <strong>of</strong> 5.86%. The 2001 census also shows that the majority <strong>of</strong> BMEcommunities are Muslims.Recent studies have also shown that BME communities have unique needs inrespect <strong>of</strong> religious and cultural aspects <strong>of</strong> lifestyles that do not match theexisting available housing stock. Relatively large family sizes give rise tosevere levels <strong>of</strong> overcrowding which impact on the quality <strong>of</strong> life. Other needsidentified include high levels <strong>of</strong> concealed homelessness (extended familynetwork), high levels <strong>of</strong> joblessness, which impacts on tenure choice, poorquality housing in the private sector and a high proportion <strong>of</strong> under 16 yearolds.The <strong>Hyndburn</strong> Homelessness Review 2003 found that BME households areunder represented in the homeless presentation figures when compared tothe percentage <strong>of</strong> the total population. In 2002/03 they represented 4.3% <strong>of</strong> allpresentations, against BME communities making up 8.3% <strong>of</strong> the borough’spopulation. There is also little demand from BME households for social rentedhousing, they accounted for just 1.5% <strong>of</strong> all council tenancies in 2003.The 2003 Housing Needs Survey looked specifically at the housing needs <strong>of</strong>BME households (n.b. this also included white Irish and white other). Thesurvey found that 71% <strong>of</strong> respondents live in terraced housing and overall49% <strong>of</strong> BME respondents live in 2-bed accommodation. 73.5% <strong>of</strong>respondents indicated that their homes were adequate, and <strong>of</strong> those thatstated their home was inadequate 67% cited ‘too small’ as the reason, slightlyhigher than the 62% found in the whole population.41.7% <strong>of</strong> the BME sample had a member <strong>of</strong> their household with a disabilityor long-term limiting illness, higher than the level <strong>of</strong> 33% found in the generalpopulation. (Confirmed by SP research) Difficulty walking was the maindisability, similar to the full population sample. Since physical disability andsensory impairment are more prevalent in older people, and certain long-termdisabilities have a higher prevalence amongst minority ethnic communities,this may influence the number <strong>of</strong> people who will have housing relatedsupport needs in future years.Income levels for BME households are similar to those in the wholepopulation, with 26% having an annual income <strong>of</strong> below £10,000. Of thosewishing to move, 78% said they could not afford to and nearly 20% indicatedthat they could not sell their existing home, compared to 13.6% in the generalpopulation.48
Safety and fear <strong>of</strong> crime were the two main reasons given for BMEhouseholds leaving the borough, followed closely by employment and accessto work. Although these reasons featured in the general population they werenot as prominent.Of those BME households looking to move within the next 5 years 87.4%expressed a preference for owner-occupation and 12.6% for council renting(bungalows). The survey found that <strong>of</strong> the 48 new forming BME households inthe borough all require terraced houses, 68% require three bedrooms.Through the East Lancashire Housing Forum, <strong>Hyndburn</strong> BC has been apartner in commissioning Housing and Diversity Services Ltd., to produce“Towards a black and minority housing strategy for East Lancashire” (Sept.2003). The document provides the background and sets the objectives toaddress the housing and wider issues facing BME Communities in EastLancashire.Other needsBoth the homelessness review and the supporting people needs analysishave identified the need for more supported housing for particular groups.Ex OffendersLancashire Probation Service figures show that 33% <strong>of</strong> prisoners leavingcustody do not have settled accommodation on their release. This figure islikely to be an under representation <strong>of</strong> the true figures. Research has foundthat a lack <strong>of</strong> settled accommodation is a key contributory factor to re<strong>of</strong>fending.Since the Homelessness Act 2002 local authorities now have astatutory duty to rehouse all those leaving prison who are vulnerable due totheir <strong>of</strong>fending behaviour and lack <strong>of</strong> accommodation. Over the last 2 yearsthe council has accepted a statutory homeless duty to 3 persons whosepriority need for homelessness was leaving custody or remand.<strong>Hyndburn</strong> has a Probation Service approved hostel accommodation unit with18 bedspaces in Accrington, 4 <strong>of</strong> which are for women, although it is one <strong>of</strong>only two premises covering the whole <strong>of</strong> Lancashire. The LancashireSupporting People Shadow Strategy identifies a need for supportedaccommodation for ex-<strong>of</strong>fenders with complex needs.Substance misuseSome key statistics on drug and substance misuse for <strong>Hyndburn</strong> include thefollowing:-• The drug misusing population in 2001/02 totaled 7.12% - the seventhhighest in Lancashire• It has the lowest heroin use and the second highest level prevalence <strong>of</strong>methadone misuse in the county• It has the highest level <strong>of</strong> amphetamine use49
• The age range pr<strong>of</strong>ile indicates that <strong>Hyndburn</strong> has a high level <strong>of</strong>substance misuse between the 25 – 29 age range at 31%Source:- ‘Drug and Substance Misuse Services in <strong>2004</strong> and Beyond’ Lancashire DAT (<strong>2004</strong>)Accrington has supported accommodation (13 bedspaces) for peoplerecovering from drug problems - an Inward House Project. However thisprovision is for the whole <strong>of</strong> East Lancashire, with an average <strong>of</strong> 2 bedspacesfor <strong>Hyndburn</strong>. The services include structured day programmes, aftercare, afloating support service and prison link service. There is no accommodationfor people with alcohol problems or the more complex needs referred tobelow. A priority for <strong>2004</strong>/05 in the Supporting People Shadow Strategy is toprovide floating support for people with alcohol problems.-The Drug Misuse Database Reports 2000 show details <strong>of</strong> the accommodationtype that known drug users in <strong>Hyndburn</strong> inhabit as follows:-Owner-occupation 18%Local authority 17%Private Rent 37%RSL 0%Total in rented accommodation 54%Those in unstable accommodation 28%Although the information indicates that the majority <strong>of</strong> individuals are in rentedaccommodation, it is important that any housing related support service needsto be tenure blind to ensure that all individuals have equal access to theservice. The percentage <strong>of</strong> people in unstable accommodation in <strong>Hyndburn</strong> ishigh at 28% - well above percentages for other districts in Lancashire, whichare below 10% with the exception <strong>of</strong> Preston at 17%.HIV and AidsDespite the lack <strong>of</strong> detailed information on the housing needs <strong>of</strong> this groupwithin <strong>Hyndburn</strong>, access to good quality mainstream housing with links toquality health and social care is important. There is little evidence to suggestthat people wish to live in specialist or supported accommodation.Multiple NeedsEvidence from agencies working in <strong>Hyndburn</strong> report an increasing number <strong>of</strong>people requiring housing who have multiple needs. A definition by HomelessLink refers to this as a person who has two or more <strong>of</strong> the followingproblems:- mental health, drug and alcohol dependencies, multiple substancemisuse, personality disorders, <strong>of</strong>fending behaviour, learning difficulties,physical health problems, challenging behaviour and vulnerability due to age.Households in these groups are being increasingly excluded from existingforms <strong>of</strong> temporary and short-term accommodation.50
Asylum Seekers and Refugees<strong>Hyndburn</strong> is not a major beneficiary <strong>of</strong> recipients, although any futuregovernment plans concerning the dispersal <strong>of</strong> asylum seekers will be watchedclosely for any impact they may have in the district and sub-region.TravellersThere are marked seasonal differences in the number <strong>of</strong> travellers in<strong>Hyndburn</strong> with increased numbers during the summer months. Unauthorisedencampments tend to be located in Accrington, Church, Huncoat and Altham.New travellers don’t present any significant problems with more traditionalgypsies and travellers forming the greater percentage <strong>of</strong> unauthorisedencampments.Government guidance no longer requires local authorities to provide travellerssites, although there is a permanent site at Whinney Hill, Altham owned byLancashire County <strong>Council</strong> and managed by <strong>Hyndburn</strong> <strong>Borough</strong> <strong>Council</strong>providing 15 pitches. There are also several private sites within the <strong>Hyndburn</strong>area that provide a further 92 pitches.The <strong>Council</strong> will continue to provide a permanent site for travellers at WhinneyHill but has no <strong>of</strong>ficial sites for new travellers nor any <strong>of</strong>ficial transit sites <strong>of</strong>temporary stopping places. In respect <strong>of</strong> future provision the <strong>Council</strong> will referto provision in the development plan and include locational and/or criteriabased policies for this.The travelling community is able to apply for social rented housing in thesame way as members <strong>of</strong> the settled community and have the right to receivehousing advice and to make a homeless application if they are threatenedwith or likely to become homeless i.e. from an unauthorised site.51
7. SOCIAL FACTORS – HEALTHKEY TRENDS /THEMES• <strong>Hyndburn</strong> has one <strong>of</strong> the lowest life expectancy rates in East Lancs• 22% <strong>of</strong> <strong>Hyndburn</strong>’s population suffers from a long-term limitingillness• Over 64% <strong>of</strong> <strong>Hyndburn</strong>’s population say their general health is‘good’• Mortality rates due to circulatory diseases are higher than thecounty averageDecent and secure housing has a fundamental role in maintaining mental andphysical well-being. It is central to preventing ill-health and enabling recovery.It is widely acknowledged that inadequate housing contributes to poor health.Whilst some areas <strong>of</strong> <strong>Hyndburn</strong> enjoy a reasonably healthy lifestyle, there aresubstantial inequalities in health with residents suffering poorer health thanthe population <strong>of</strong> England and Wales as a whole. The following indicatorsillustrate this.The following key health indicators for <strong>Hyndburn</strong> show that the rates arepoorer than for Lancashire as a whole.Key Health Indicators – <strong>Hyndburn</strong> 2001<strong>Hyndburn</strong> LancashireLive birth rate per 1,000 population (2001) 12.5 10.7Total fertility rate (2001) 1.96 1.67Death rate per 1,000 population (2001) 11.2 11.1Standardised mortality ratio (UK =100) 113 105Infant mortality rate 1999 - 2001 7.6 6.9% persons with limiting long standing illness 2001 22.0 20.2Source:- ONS – Regional Trends 2002 / Region in Figures, North West 2003General healthThe 2001 census asked people to rate their health as good, fairly good or notgood. The results for <strong>Hyndburn</strong> were as follows:-Good 64.4%Fairly good 23.59%Not good 12.01This data for the district reflects the regional and national health rates.52
Life expectancyLife expectancy at birth is an estimate <strong>of</strong> the number <strong>of</strong> years that a new bornbaby would survive, based upon the prevalent age-specific mortality rates thatare associated with particular areas. The following table shows that <strong>Hyndburn</strong>has one <strong>of</strong> the lowest life expectancy rates in East Lancashire and also fallsbelow the north-west and England averages.Life Expectancy at Birth1997 - 1998 1998 - 2000Male Female Male Female<strong>Hyndburn</strong> 72.3 77.6 72.9 77.8North-west 73.6 80.1 74.0 79.0England 75.2 78.7 75.5 80.3Source:- ONSThe 1998 – 2000 life expectancy data can also be ranked against data for 432local authorities at national level (with 432 being the worst and 1 being thebest). <strong>Hyndburn</strong> ranks within the worst 10% <strong>of</strong> local authorities in terms <strong>of</strong> lifeexpectancy for both men and women. The male rank is 405 and the female416.Mortality RatesMortality rates in East Lancashire are significantly higher than both Cumbriaand Lancashire and national comparators. The following table gives the ratesfor mortality due to circulatory diseases for 1998 – 2000 and the % changebetween then and the mid 1990’s.Circulatory Diseases Mortality Rates per 100,000 populationPrimary Care Trust 1998-2000 rate % change 1995-1997 to1998-2000<strong>Hyndburn</strong> & Ribble Valley 145.0 -14.2%Cumbria & Lancashire 138.9 -12.0%England and Wales 121.1 -12.2%Source:- Health authority dataThere is clear statistical evidence linking high incidences <strong>of</strong> cancer withdeprivation, accordingly <strong>Hyndburn</strong> experiences high rates <strong>of</strong> death due tocancer. Mortality rates are also high for diseases <strong>of</strong> the respiratory system.Limiting long-term illnessA limiting long-term illness (LLTI) is a disability, health problem or long-termillness which restricts a persons daily activities. In <strong>Hyndburn</strong> 22% <strong>of</strong> thepopulation as a whole suffers from a limiting long-term illness compared witha figure <strong>of</strong> 20.7% for the north-west and 18.2% for England and Wales.53
In the working age population 18.3% <strong>of</strong> <strong>Hyndburn</strong>’s population has a LLTIcompared with the north-west average <strong>of</strong> 16.4% and a figure <strong>of</strong> 13.6% forEngland and Wales.Teenage PregnancyAs mentioned above (see Chapter 6) East Lancashire is a hot spot forteenage pregnancies. High rates are likely to occur where teenagers have loweducational and work aspirations. It also links to health indicators, especiallythose on child health such as low birth weight and infant mortality. Thefollowing table gives information on conception rates in the district.Area <strong>of</strong> residenceTeenage Pregnancy RatesNumber <strong>of</strong>conceptions1999 – 2001Rate per 1,000(women aged 15-17)% leading toabortion<strong>Hyndburn</strong> 282 62.4 35Lancashire 2,858 43.6 41Source:- Lancashire Teenage Pregnancy PartnershipReduction in teenage pregnancy rates is included as a target in the LocalPublic Service Agreement and <strong>Hyndburn</strong> <strong>Borough</strong> <strong>Council</strong> is working inpartnership with Lancashire County <strong>Council</strong> to effect Target 6 to ‘reduce theunder 18 conception rate’. This imposes a target <strong>of</strong> achieving an averageyearly conception rate <strong>of</strong> 35 by 2006 with an interim target <strong>of</strong> 38.5 by <strong>2004</strong>.54
8. SOCIAL FACTORS – EDUCATIONKEY TRENDS / THEMES• Performance <strong>of</strong> school leavers in <strong>Hyndburn</strong> is below the regionaland national average• Fewer school leavers pursue the academic route than the regionalaverage• 35.5% <strong>of</strong> the population had no qualifications at the time <strong>of</strong> the 2001censusPoor housing accompanied by poverty, poor nutrition and ill health is <strong>of</strong>tenassociated with low literacy rates and low respect for education. This meansthat children from such backgrounds are less likely to access and succeed ineducation. Key educational statistics for <strong>Hyndburn</strong> indicate that:-• 35% <strong>of</strong> the population aged 16 to 74 have no qualifications• 18% <strong>of</strong> the population hold a Level 1 qualification (1+ GCSE pass)• 19% <strong>of</strong> the population hold a Level 2 qualification (5+ GCSE passes)• 6% <strong>of</strong> the population hold a Level 3 qualification (A levels)• 27.3% <strong>of</strong> adults in <strong>Hyndburn</strong> have poor literacy skills• 29% <strong>of</strong> adults have poor numeracy skillsSeveral barriers to participation in education and learning in <strong>Hyndburn</strong> havebeen identified including the following:-• People have low self esteem and low aspirations• Parents <strong>of</strong>ten have low literacy and numeracy levels and are insufficientlyinvolved in their children’s education• There is a high percentage <strong>of</strong> Asian Heritage communities with English asan additional language• Take up <strong>of</strong> post-16 training and learning for those with young children islimited due to lack <strong>of</strong> readily available crèche and child care facilities• Job prospects in the area are poor even with appropriate qualifications• There is <strong>of</strong>ten a lack <strong>of</strong> available finances within households for educationand trainingWhilst these indicators are apparent across the whole <strong>of</strong> <strong>Hyndburn</strong>, they aremore pronounced and evident in the 4 neighbourhood renewal priority wards<strong>of</strong> Barnfield, Central, Church and Springhill with educational attainment belowthe regional and national average.QualificationsEast Lancashire is characterised by a working age population with loweducational attainment levels. The proportion <strong>of</strong> people with no qualificationsis higher than the national and regional averages. In <strong>Hyndburn</strong> this was35.5% at the time <strong>of</strong> the 2001 census. Levels <strong>of</strong> attainment decline,55
particularly at further and higher education levels. This low attainment <strong>of</strong>higher qualifications will serve to limit the skill levels <strong>of</strong> the local labour pooland could potentially put a break on the economic development potential forthe sub-region. The table below shows information on qualifications obtained.4035Highest Qualifications <strong>of</strong> all people aged 16 – 74 – 2001 (%)%30252015105<strong>Hyndburn</strong>North-westEngland & Wales0NoneLevel 1Level 2Level 3Level 4/5Other /LevelunknownQualificationsLevel 1 = 1 + O level passes, 1 + CSE/GCSE any grades, NVQ level 1, Foundation GNVQLevel 2 = 5 + O level passes, 5 + CSE’s (grade 1), 5+ GCSE’s (grades A-C), Schoolcertificate, 1 + A levels/AS levels, NVQ level 2, intermediate GNVQLevel 3 = 2 + A levels, 4 + AS levels, Higher school Certificate, NVQ level 3, advanced GNVQLevel 4/5 = 1 st degree, higher degree, NVQ levels 4 and 5, HNC, HND, Qualified teacherstatus, qualified medical doctor, qualified dentist, qualified nurse, midwife, health visitorIn general terms educational attainment levels in <strong>Hyndburn</strong> do not meetregional or national averages.Local School Performance (Level 2)The following table shows the <strong>Hyndburn</strong> secondary school performance onexam successes and compares this with the Lancashire and Englandaverages.Secondary School (GCSE/GNVQ) Performance tables5 or more grades A - C No passes2000 2001 2002 2003 2000 2001 2002 2003Moorhead High School 25% 22% 22% 17% 9% 8% 11% 5%St Christopher,s 59% 54% 67% 64% 2% 1% 1% 1%Hollins 43% 33% 40% 31% 4% 8% 5% 3%Mount Carmel 42% 38% 52% 35% 3% 10% 2% 5%Norden High School 39% 35% 39% 40% 7% 2% 5% 6%Rhyddings High School 34% 34% 42% 46% 2% 1% 1% 1%Lancashire average 49.6% 50.1% 51.7% 53.4% 4.3% 4.2% 4% 4.6%England average 49.2% 50% 51.6% 52.9% 5.6% 5.5% 5.4% 5.2%Source:- Department for Education and Skills56
The performance for <strong>Hyndburn</strong>’s schools in pupils attaining 5 or more grade Ato C passes is below the Lancashire and England averages. The exception tothis is St Christopher’s whose performance is significantly above the regionaland national average. In respect <strong>of</strong> pupils who left school without obtainingany formal qualifications only Norden High School performs worse than theLancashire and England average, with St Christopher’s and Rhyddingsperforming significantly better than the regional and national averages.School Leaver DestinationThe following data on school leaver destinations is based upon an analysis <strong>of</strong>the school the student left.School Leaver DestinationsLocal Authority % School Leavers (2001)FE College 6 th Form Other Job without Unemployed OtherCollege Training TrainingBlackburn 55.2 9.8 15.3 3 7.1 7.4Burnley 40.9 21.4 17 2.7 5.5 6.8<strong>Hyndburn</strong> 49 4.5 25 2.7 8.2 9.7Pendle 56.7 3.2 20.8 2.5 6.7 6.3Ribble Valley 49.4 28.4 19.6 2.9 2.7 2.1Rossendale 33.4 34.4 13 1.5 3.1 8.7East Lancashire 47.4 17.0 18.5 2.6 5.6 6.8Lancashire 50 15.9 18.8 2.8 5.4 6.9Source: Lancashire LSC (2003)- “Skills Need Assessment” – adapted from “Destination by District”table<strong>Hyndburn</strong> along with Pendle demonstrates the lowest progression rates t<strong>of</strong>ull-time education, achieving 54%.Educational aspirations <strong>of</strong> school leavers in <strong>Hyndburn</strong> is low. The low level <strong>of</strong>attainment at level 2 (GCSE’s) means that the academic standard <strong>of</strong> schoolleavers is not high enough to go down the ‘A’ level route. As an alternative t<strong>of</strong>urther academic studies school leavers either seek work in low status jobs ortake the vocational training route through modern apprenticeships. This is<strong>of</strong>ten undertaken at Accrington and Rossendale College. However as thelevels <strong>of</strong> literacy and numeracy <strong>of</strong> some school leavers is poor many studentsneed to complete a foundation year and redo level 2 studies before being ableto access the vocational training courses on <strong>of</strong>fer.For school leavers wishing and able to pursue the academic route <strong>of</strong> ‘A’levels, the provision in <strong>Hyndburn</strong> is limited. This lack <strong>of</strong> provision for A leveleducation in the <strong>Hyndburn</strong> area is encouraging 16 to 19 year olds to leave theborough to seek provision in the wider area particularly Blackburn. This has aknock on effect in that they may not return to form the new households in<strong>Hyndburn</strong> in the future. Additionally families are choosing not to live in<strong>Hyndburn</strong> as there is a lack <strong>of</strong> continuous 11 to 18 years education.57
9. SOCIAL FACTORS – CRIME AND COMMUNITY SAFETYKEY TRENDS / THEMES•• Rates <strong>of</strong> crime in <strong>Hyndburn</strong> compare favourably with other East Lancsdistricts• Incidences <strong>of</strong> criminal damage to dwellings, theft in dwellings anddeliberate building fires have increased over the last 2 years• The physical layout <strong>of</strong> terraced blocks <strong>of</strong> houses and lack <strong>of</strong> naturalsurveillance at the rear make then easy prey for burglary <strong>of</strong>fencesAs above - unsure what to put in this section – any thoughts welcome –Crime and fear <strong>of</strong> crime are significant factors in people’s perception <strong>of</strong>neighbourhoods and their willingness to invest and live in areas.The following table compares <strong>Hyndburn</strong>’s level <strong>of</strong> property crime with those <strong>of</strong>other borough’s in East Lancashire. The rates <strong>of</strong> crime compare favourablywith those <strong>of</strong> other boroughs – although all levels are slightly above theLancashire average.Property Crime per 1000 People - <strong>2004</strong><strong>Borough</strong>BurglarydwellingsTheft <strong>of</strong> vehicle Theft fromvehicle<strong>Hyndburn</strong> 15.2 3.7 6.0Blackburn with Darwen 18.3 6.1 9.5Burnley 26.7 5.6 11.3Pendle 21.3 3.7 10.2Rossendale 18.6 6.5 10.5Lancashire average 14.3 3.4 7.6Source:- Safer Lancashire Website – June <strong>2004</strong>58
Property Crime RatesThe following table shows property related crime figures for <strong>Hyndburn</strong> for thelast 2 years.1200<strong>Hyndburn</strong> Property Related Crime Data1000Number8006004002002002/20032003/<strong>2004</strong>0DomesticBurglaryCriminaldamage todwellingsSource:- Safer Lancashire Website – June <strong>2004</strong>Theft indwellingTypeDeliberatebuilding firesDomesticViolenceSource:- Safer Lancashire Website – June <strong>2004</strong>The incidences <strong>of</strong> domestic burglary and recorded incidences <strong>of</strong> domesticviolence have both reduced over the last 2 years. However the remaining 3property related crimes have all shown an increase over the same period.The majority <strong>of</strong> premises targeted for burglary in <strong>Hyndburn</strong> are terracedproperties with rear alleyway access, reflecting the predominance <strong>of</strong> this type<strong>of</strong> housing in the district. Alleys are <strong>of</strong>ten unlit or poorly lit, easy to movearound and <strong>of</strong>fer little surveillance either from neighbouring dwellings orpassers by. Once inside back yards the <strong>of</strong>fender is unable to be observed –the yard walls affording excellent cover. Many <strong>of</strong> the back doors also affordlittle security <strong>of</strong>ten being ill fitting and with a wooden and glass construction.Priorities for the Police and the <strong>Hyndburn</strong> Community Safety Partnership arein producing housing that conforms with ‘better by design’ principals to reducethe opportunities for crime, making neighbourhoods safer and enhancingcommunity safety.Location <strong>of</strong> Property CrimeDomestic BurglaryDomestic burglaries, while higher than the average for Lancashire has showna downward trend since April 2001. Seasonal trends show that peaks occur59
over the summer holidays and Christmas with troughs occurring in lateautumn and January/February. The top 3 highest areas for domestic burglaryper thousand households during 2003/4 were Barnfield, Church and Altham.The majority <strong>of</strong> domestic burglaries occur during the day, with peak times atlunchtime, tea-time and early evening. Thursday, Friday and Saturday havebeen highlighted as peak days.Vehicle crimeThere has been a gradual downward trend over the last three years. Nearly61% <strong>of</strong> vehicle crime during 2003/4 was Theft from a Vehicle, with theremaining 39% being Theft <strong>of</strong> a Vehicle. The top 3 highest wards for Theft <strong>of</strong>a Vehicle per thousand population were Barnfield, Church and Peel. Analysisshows that vehicle taking is most likely to occur on a Friday or Saturday night,between 7pm and midnight. The top 3 highest wards for Theft from a Vehicleper thousand population were Peel, Central and Barnfield. Thefts fromVehicles start to increase around 3pm to a peak at midnight and is fairlyevenly spread over the week.Property Crime TargetsThe <strong>Hyndburn</strong> Community Safety Partnership target is to reduce domesticburglary by 20.6% and vehicle crime by 16.9% by March 2005. The ‘Securedby Design’ initiative has been promoted in <strong>Hyndburn</strong> by including informationleaflets with planning applications. <strong>Hyndburn</strong> Homes have also installedadditional and improved security devises whilst refurbishing its dwellings. TheCommunity Safety Partnership ensure that all victims <strong>of</strong> domestic burglary are<strong>of</strong>fered appropriate help and/or referral to <strong>Hyndburn</strong> Homewise or the PoliceCrime Prevention Officer for crime prevention advice and security packages.In respect <strong>of</strong> domestic violence incidents the target is to increase the number<strong>of</strong> reported domestic violence incidents in the <strong>Borough</strong> by 10% by March2005. Specific actions to assist in meeting this target include increasing theconfidence <strong>of</strong> victims <strong>of</strong> domestic violence to report incidences by thecontinued emphasis on zero tolerance and by raising the awareness <strong>of</strong>domestic violence within the general community and within the minority ethniccommunity.60
APPENDIX 1LIST OF SUPPORTING INFORMATION1. <strong>Hyndburn</strong>’s Homelessness Review and Strategy 20032. <strong>Hyndburn</strong> Homes – Housing Business Plan <strong>2004</strong> –20093. <strong>Hyndburn</strong> Community Safety Partnership – Annual Report 2002 – 20034. <strong>Hyndburn</strong> <strong>Borough</strong> housing Needs Survey 2003 – David CouttieAssociates Ltd.5. ‘Towards a Black and Minority Housing strategy for East Lancashire’ 20036. <strong>Hyndburn</strong>’s Neighbourhood Renewal Strategy 2002 – 20087. <strong>Hyndburn</strong>’s Community Strategy 2003 – 20088. <strong>Hyndburn</strong> Anti-Social Behaviour Strategy <strong>2004</strong> – 20059. East Lancashire Housing Strategy 200310. <strong>Hyndburn</strong> and Ribble Valley PCT – Director <strong>of</strong> Public Health Report 200311. <strong>Hyndburn</strong> Local Plan 1991 – 200612. <strong>Hyndburn</strong> Housing Strategy 2002 – 2005 and 2003 update13. Crime and Disorder and Road Traffic Audit 200214. Community Safety Partnership Project Elevate – Appraise <strong>of</strong> CurrentCrime Trends15. 1991 and 2001 Census - ONS16. Elevate East Lancashire – housing market Renewal Pathfinder Prospectus– December 200317. Prospects ‘ Your Place in the Future’. The Sustainability Action plan for<strong>Hyndburn</strong> – 200118. <strong>Hyndburn</strong> District Commissioning Plan 2001 – 2002 – Lancashire County<strong>Council</strong> Social Services Directorate19. LCC Supporting People Shadow Strategy – September 200220. HM Land Registry website21. Lancashire Structure Plan 2001 – 2016 (deposit edition)61
22. <strong>Hyndburn</strong> Private Sector Housing Renewal Policy – May 200323. <strong>Hyndburn</strong> Stock Condition Survey (Rand Associates) – June 200324. Housing Need and Demand Survey, <strong>Hyndburn</strong> Homes. (HACASChapman Hendy – December 200325. CURS Study – Changing Housing markets in Cheshire, Lancashire andCumbria 200326. P1E Homelessness statistical returns27. HARV Annual Report 2003/0428. <strong>Hyndburn</strong> <strong>Borough</strong> <strong>Council</strong> House Condition Survey <strong>2004</strong> (DavidAdamson)For further details about the information in this document pleasecontact:-Fiona GoodfellowHousing Needs and Strategy Co-Ordinator<strong>Hyndburn</strong> First20 Cannon StreetAccringtonBB5 1NJTel:- 01254 380195E-mail:- fiona.goodfellow@hyndburnbc.gov.uk62
HYNDBURN SOCIAL RENTED STOCKAT 1 APRIL <strong>2004</strong>APPENDIX 2LandlordElderly+warden1 bedElderly+warden2 bedElderlyNowarden1 bedElderlynowarden2 bedGeneral1 bedGeneral2 bedGeneral3 bedGeneral4 bed +Specialneeds<strong>Hyndburn</strong>1130 44 - - 259 1103 849 47 5 3437HomesAshiana - - - - - 4 15 9 - 28Accent 156 2 100 1 33 206 47 23 - 568New Progress - - - - 10 4 14 2 - 30St Vincent - - 2 12 22 72 46 4 11 169Carr Gomm - - - - - - - - 8 8Anchor Trust 147 - - - - - - - - 147North British - - 8 - - 50 29 - - 87SPACE - - - 33 - 48 1 - - 82English- - 10 - - - - - - 10ChurchesContour - - - - - - - - 21 21Muir Group - - - - - 17 3 - - 20Eaves Brook 104 1 51 0 18 173 93 9 16 465Totals 1537 47 171 46 342 1677 1097 94 61 5072Total63
HYNDBURN BOROUGH COUNCIL : HYNDBURN BOROUGH COUNCILFOR COPIES OF THE FULLSTRATEGY, PROFILE OF HYNDBURNDOCUMENT OR ANY OTHER QUERIES,PLEASE CONTACT:-Strategic Housing, 20 Cannon Street,Accrington, Lancs. BB5 1NJTelephone: 01254 388111e-mail: housing@hyndburnbc.gov.ukMark Hoyle,Strategic Housing Manager,Regeneration Services,Telephone: 01254 380662e-mail: mark.hoyle@hyndburnbc.gov.ukFiona Goodfellow,Housing Needs and Strategy Co-ordinator,Regeneration Services,Telephone: 01254 380195e-mail: fiona.goodfellow@hyndburnbc.gov.ukDesigned by the Graphics Section, Regeneration Services‘making <strong>Hyndburn</strong> a better place to live, work and visit’ACCRINGTON : ALTHAM : CHURCH : CLAYTON-LE-MOORS : GREAT HARWOOD : OSWALDTWISTLE : RISHTON