Where is South Florida Heading? - Miami Downtown Development ...
Where is South Florida Heading? - Miami Downtown Development ...
Where is South Florida Heading? - Miami Downtown Development ...

You also want an ePaper? Increase the reach of your titles
YUMPU automatically turns print PDFs into web optimized ePapers that Google loves.
Center for Urban and Environmental Solutions (CUES) Regional InitiativesCUES at FAU will focus its regional initiatives on fostering solutions to challenges identified in Charting the Course:<strong>Where</strong> <strong>is</strong> <strong>South</strong> <strong>Florida</strong> <strong>Heading</strong>? Current regional programs include:RESEARCH<strong>South</strong><strong>Florida</strong>: Facilitates collaboration among <strong>South</strong> <strong>Florida</strong>’s researchers to work in inter-organizationaland interd<strong>is</strong>ciplinary teams to help resolve some of the region’s complex problems. See www.researchsouthflorida.org for more information.<strong>Florida</strong> Public Officials Design Institute at Abacoa: Elected officials are educated on how to use different designoptions and tools to address specific community problems and integrate social, economic, and environmental concernsinto city plans. See www.floridadesigninstitute.org for more information.The <strong>South</strong> <strong>Florida</strong> Regional Resource Center: A partnership organization admin<strong>is</strong>tered by CUES that also includesthe Collins Center for Public Policy, Inc., and the <strong>South</strong> <strong>Florida</strong> and Treasure Coast Regional Planning Councils. Seewww.sfrrc.net for more information.Regional Indicators: Reports and monitors the demographic, environmental, and economic conditions of the region,identifies trends and critical <strong>is</strong>sues, and demonstrates the interconnectedness of the seven counties in order to ra<strong>is</strong>ecommunity awareness and stimulate innovative regional solutions. See www.soflo.org for more information.Funding: Th<strong>is</strong> report <strong>is</strong> generously supported by a grant from the John D. and Catherine T. MacArthur Foundation.It updates our 2004 Regional Shift: <strong>South</strong> <strong>Florida</strong> in Transition and continues the emerging dialogue about the <strong>South</strong><strong>Florida</strong> region and its future. For more information on the MacArthur Foundation, v<strong>is</strong>it www.macfound.org.111 E Las Olas Blvd, Suite AT- 709 Fort Lauderdale, FL 33301 Phone: 954.762.5255 www.cuesfau.org2
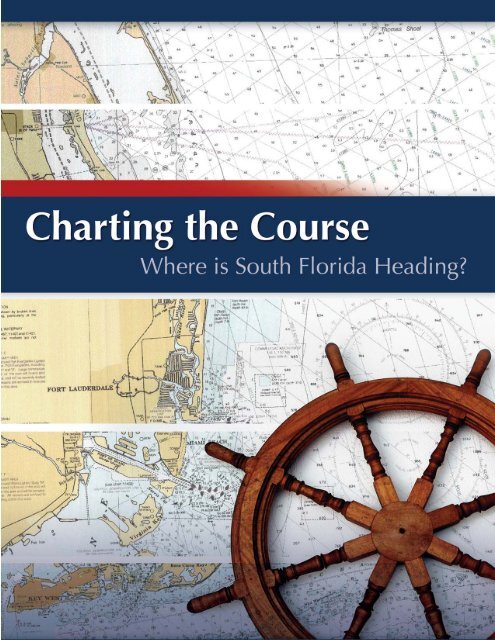
Charting the Course:<strong>Where</strong> <strong>is</strong> <strong>South</strong> <strong>Florida</strong> <strong>Heading</strong>?A Report by the Anthony J. CataneseCenter for Urban and Environmental Solutionsat <strong>Florida</strong> Atlantic UniversityFunded by theJohn D. and Catherine T. MacArthur FoundationJames F. Murley, JDLenore Alpert, PhDLindsay O. Walker, MAM. J. Matthews, JDMaryBeth Burton, MLA, AICPChr<strong>is</strong>tina M. Bryk, MSMatthew Kurry, MAIn consultation withAllan Wall<strong>is</strong>, PhDAssociate Professor of Public PolicyUniversity of Colorado at Denver2006
Table of ContentsIntroduction . . . . . . . 1People . . . . . . . 5Population Changes . . . . . 7<strong>South</strong> <strong>Florida</strong>’s Population Growth . 7Sources of Population Growth . . 7Racial and Ethnic Diversity . . 8An Aging Population . . . . 9Social Equity . . . . . . . 10Poverty Rates . . . . . 10Students Receiving Free Lunch . 11Household Income D<strong>is</strong>tribution . 11K-12 Education . . . . . . 12School Quality and Achievement . 12High School Completion . . . 13Academic Performance . . . 15Educational Resources 15Higher Education . . . . . 16College Enrollment . . . . 16College Completion . . . . 17Civic Engagement . . . . . 17Voter Participation . . . . 17Youth Offenders . . . . . 18<strong>Florida</strong> Regional Highlights . . . 19Commentary from the Experts . . 21Place . . . . . . . 23The Natural Environment . . . 25Restoring the Ecosystem . . . 25Land Acqu<strong>is</strong>ition . . . . . 25Nesting Wading Birds . . . . 26Water Supply . . . . . 26Water Quality . . . . . 27Beach Erosion . . . . . 27Beach Adv<strong>is</strong>ories . . . . . 28F<strong>is</strong>h Landings . . . . . 29Land Use . . . . . . . 29Urban Areas . . . . . . 29Rural and Agricultural Areas . . 30Conservation Areas . . . . 31Housing . . . . . . . 32The Housing Market . . . . 32Housing Affordability . . . . 32Transportation . . . . . . 34Highway Congestion . . . . 34Public Transit . . . . . . 34Spotlight on the Hurricanes . . . 36<strong>Florida</strong> Regional Highlights . . . 37Commentary from the Experts . . 39Prosperity . . . . . . . 41Workforce . . . . . . . 43Employment and Job Growth . . 43Labor Force . . . . . . 43Unemployment . . . . . 44Workforce Education . . . . 45Income . . . . . . . 45Wages . . . . . . . 45Per Capita Income . . . . 46Sources of Income . . . . 47Employment Sectors . . . . . 47Industry Sectors . . . . . 47Agriculture . . . . . 49Marine Industry . . . . . 50Trade and Tour<strong>is</strong>m . . . . 50Spotlight on the Hurricanes . . . 54<strong>Florida</strong> Regional Highlights . . . 55Commentary from the Experts . . 57Conclusion . . . . . . . 59Endnotes . . . . . . . 617
CHARTING THE COURSEIntroductionThe United States has become a nation of regions, with a shared destiny among individual communities withinthose regions. We acknowledge that reality in the way we live our daily lives, which involves traveling fromone community to another for work, play, and services, often crossing county and, in some regions, nationalboundaries. The physical infrastructure that supports these regions (e.g., roads, drainage, water supply) must be integrated,and to a large extent they are. Labor and housing markets are also integrated, though not by policy. Individualcommunities share a common responsibility for protection of the physical environment. Governor Bush endorsedth<strong>is</strong> regional perspective when describing the potential impact of Scripps Research Institute on <strong>South</strong> <strong>Florida</strong>: “I thinkwe’ve gotten a little too focused on zip codes. It’s time to move on. . . . We’re a region.” 1MEGAPOLITAN REGIONSRobert E. Lang and Dawn Dhavale of the Metropolitan Institute at Virginia Tech have advanced the concept that a newtrans-metropolitan geography <strong>is</strong> emerging across the United States. “Megapolitan Areas” are “large-scale, clusterednetworks of two or more metropolitan and Micropolitan areas” 2 that are connected spatially and functionally. They haveresulted from the rapid integration of cities and regions in the nation over the past 50 years “because of massive decentralization. . . and corridors of linked urban space, with accelerated movements of people and goods among them.” 3Key components of the mega-region are a shared physical environment, economic networks, transportation infrastructurenetworks, and shared culture and regional identity. While these mega-regions contain less than one-fifth of all landarea in the continental U.S., they house more than two-thirds of the nation’s population, almost 200 million people. Eachmega-region <strong>is</strong> expected to exceed 10 million residents by 2030. Lang and Dhavale advocate formal recognition by theU.S. Census Bureau in order to foster recognition by private industries and local governments and improve largescaleregional development. 4 These metropolitan areas working as a mega-region are targeted as critical components1
WHERE IS SOUTH FLORIDA HEADING?to the “21st century survivaland success” 5 of the nation. The“Peninsula” megapolitan regionextends from Central <strong>Florida</strong>to the tip of the state. It couldeven expand to include Caribbeanand Latin American areas.In 2003, it covered 1.2 percentof the total continental U.S. landmass and almost 5 percent of itspopulation. 6 The internationaltrading region, known as the“Floribbean,” combines all of<strong>Florida</strong> with the surroundingCaribbean and Latin Americanarea.FLORIDA’S REGIONSIn 25 years or less, <strong>Florida</strong> willsurpass New York, becomingthe third most populous statein the nation. Interestingly, thethree largest states then will allbe located in the Sunbelt andwill likely remain, as they aretoday, major gateways for immigrants—especiallyH<strong>is</strong>panics—into th<strong>is</strong> country. But populationgrowth and increased sizedo not guarantee success. Successcons<strong>is</strong>ts of growing largerwhile also becoming moresustainable and more prosperous.All of <strong>Florida</strong>’s regions areexperiencing many of the samegrowth-related <strong>is</strong>sues. Some regionsare beginning to identifythemselves as such, realizing that many of today’s important <strong>is</strong>sues—housing, transportation, education, economicdiversification—must be addressed by collaborating across county and municipal boundaries. Enterpr<strong>is</strong>e <strong>Florida</strong>, theeconomic development entity for the state, has identified eight d<strong>is</strong>tinct economic regions in <strong>Florida</strong> in its Strategic Economic<strong>Development</strong> Plan for the state. These same eight regions are used by the <strong>Florida</strong> Department of Transportationin its Strategic Intermodal Systems Plan. Th<strong>is</strong> report relies on these urban and rural regions of the state as the bas<strong>is</strong>for its regional analys<strong>is</strong>. The Cornerstone report, developed under the auspices of the <strong>Florida</strong> Chamber Foundation,encourages approaching economic development in the state from the perspective of regional competitiveness. The<strong>Florida</strong> Chamber Foundation recognizes the importance of regional approaches and that strong regional partnershipsare important components to realizing <strong>Florida</strong>’s economic potential. It emphasizes “nurturing home-grown businessesand workers and expanding their global markets” 7 in order to diversify and strengthen the economy, facilitate prosperityamong workers, and improve quality of life. The Urban Land Institute also recognizes that regional solutions andstate support are critical to <strong>Florida</strong>’s economic and social health, urging the use of indicators to benchmark progresstoward regional goals and to measure the effectiveness of regional policies. 82
CHARTING THE COURSETHE SOUTH FLORIDA REGION<strong>South</strong> <strong>Florida</strong> will continue as the state’s most populous region over the next two decades, with a population largerthan 35 states. The region stretches along <strong>Florida</strong>’s southeast coast, bounded by the Atlantic Ocean on the east andthe Everglades on the west, extending from Sebastian Inlet in the north to the <strong>Florida</strong> Keys in the south. Interestingly,<strong>South</strong> <strong>Florida</strong> has evolvedas a linear coastal band ofhighly urbanized, increasinglycontinuous communities, withno truly dominant core cities.Much of the land area coversprotected federal wetlands andagricultural reserves, most notablythe Everglades and LakeOkeechobee, confining urbandevelopment to the east.Th<strong>is</strong> report d<strong>is</strong>cusses the <strong>South</strong><strong>Florida</strong> region as a seven countyarea, cons<strong>is</strong>tent with Enterpr<strong>is</strong>e<strong>Florida</strong>’s definition. The region’smost populous core countiesare <strong>Miami</strong>-Dade, Broward, andPalm Beach. Martin, St. Lucie,and Indian River counties inthe Treasure Coast sub-region,along with Monroe County inthe far south, are also includedas part of the <strong>South</strong> <strong>Florida</strong> regionbecause a substantial partof their present and projectedgrowth will be an extension ofdevelopments in the core counties.Th<strong>is</strong> seven county region<strong>is</strong> designated as the “<strong>South</strong>east<strong>Florida</strong> Region” by Enterpr<strong>is</strong>e<strong>Florida</strong> and by the <strong>Florida</strong> Departmentof Transportation. Wehave used the term “<strong>South</strong>east”<strong>Florida</strong> interchangeably with“<strong>South</strong>” <strong>Florida</strong> to define thestudy region for th<strong>is</strong> report.ORGANIZATION OF THE REPORTFocus on 2030Over the past four years we have tracked key trends in the <strong>South</strong> <strong>Florida</strong> region, reaching back a decade or two tod<strong>is</strong>cern their trajectory to the present. In th<strong>is</strong> report, we extrapolate some key trends to the year 2030. By that date, theregion’s population <strong>is</strong> projected to increase by 42 percent, to about 8.4 million people. Long-term planners in a numberof public agencies are already working to determine how that population will be accommodated. <strong>Where</strong> possible, ourreport employs their forecasts, but we have also relied on the opinions and commentary of key regional observers tohelp image the future.3
WHERE IS SOUTH FLORIDA HEADING?Key TrendsThe trends reported here are organized in three sections: People, Place, and Prosperity. These are the three areasin which sustainable development <strong>is</strong> usually analyzed. We open each section with a two-page spread highlighting keychanges. The direction of trends <strong>is</strong> indicated with arrows:an up arrow indicating an improving trend, a downarrow indicating decline, and a horizontal arrow indicatingno significant change. The body of each sectionlooks at specific trends in detail. Trends are reportedImprovingfor the region as a whole, for all seven counties, for thecore counties, or for the Metropolitan Stat<strong>is</strong>tical Areas(MSA) within the region, depending on data availability.In addition, some indicators focus on the Treasure Coastsub-region, and where necessary, we highlight the subregionto demonstrate its unique identity ( Focus onDecliningTreasure Coast). In many ways, the Treasure Coast<strong>is</strong> emerging as the primary growth area of the regionthat has not yet experienced the dramatic changes of itspopulous neighbors to its south. While it <strong>is</strong> important tonote the differences, it <strong>is</strong> also crucial to include thesecounties as part of the region and to track the changesUnchangedunderway at the edge of the region.Hurricane FocusA “Spotlight on the Hurricanes” in Place and Prosperity highlights the impact of the 2004 and 2005 hurricane seasonson <strong>South</strong> <strong>Florida</strong>. <strong>Where</strong> possible, we have included data on the impact on housing and the economy. Climate expertspredict a cycle of increasing hurricane activity, and in the future, we will monitor preparedness activities and degree ofcommunity resiliency to catastrophic tropical climate events.Regional Compar<strong>is</strong>onsTrend information <strong>is</strong> followed by a compar<strong>is</strong>on of <strong>South</strong> <strong>Florida</strong> with other urban regions in the state. We hope thatthese compar<strong>is</strong>ons provide a perspective on how <strong>Florida</strong> as a whole <strong>is</strong> now compr<strong>is</strong>ed primarily of regions. The futureof those regions—each quite d<strong>is</strong>tinct and largely complementary to one another—<strong>is</strong> the future of the state. Theseregions can learn from each other, particularly where they share similar challenges. They can strengthen their causeby collaborating to address problems that cross regional boundaries. Five regions—<strong>South</strong> <strong>Florida</strong>, Central <strong>Florida</strong>,Tampa Bay, Northeast and Northwest <strong>Florida</strong>—have identified themselves as part of the <strong>Florida</strong> Regional IndicatorsNetwork, started by CUES in 2004. Data are reported in th<strong>is</strong> section either for whole regions, the core counties of theregions, or the MSAs within the regions, depending on data availability. 9V<strong>is</strong>ioning the FutureIn charting our future, we are unable to determine a specific direction because the region lacks an overall v<strong>is</strong>ion. Whileth<strong>is</strong> report compares trends and develops scenarios, the region <strong>is</strong> m<strong>is</strong>sing th<strong>is</strong> long-term v<strong>is</strong>ion to help direct andguide us to the most desirable future. We have incorporated interviews with experts from across the region to provideinsights into the future needs and potential choices for <strong>South</strong> <strong>Florida</strong>. Scenarios are developed in the Conclusion toillustrate these “windows in the future,” which can be used to frame the regional outlook in 2030. By using scenarios,we have tried to capture the scope of choices about where the region <strong>is</strong> heading.4
Over the next 25 years, <strong>Florida</strong>’s population will reach 25.5 million people, and the state will become the thirdmost populous in the U.S., behind California and Texas. It will also rank among the fastest growing states,with a growth rate nearly three times that of the nation. 1 During the same period, <strong>South</strong> <strong>Florida</strong> <strong>is</strong> expectedto remain the most populous part of the state, adding 2.5 million people. However, its growth rate in the next quartercentury <strong>is</strong> expected to be slower than that experienced over the last 25 years.The greatest source of <strong>South</strong> <strong>Florida</strong>’s current population growth comes from international immigration originatingin Latin America and the Caribbean. The region <strong>is</strong> now composed of immigrants, domestic newcomers, and nativeFloridians, whose backgrounds, cultures, and needs are increasingly diverse. <strong>South</strong> <strong>Florida</strong> exemplifies the rapiddemographic transformation of the U.S., which <strong>is</strong> now experiencing the second largest period of international immigrationin its h<strong>is</strong>tory. Th<strong>is</strong> transformation cons<strong>is</strong>ts of the development of gateway regions, with higher than averageconcentrations of foreign-born residents, and boomer regions, with higher than average concentrations of retiredpeople. 2 Today the southern part of <strong>South</strong> <strong>Florida</strong> <strong>is</strong> clearly a gateway, while the northern part <strong>is</strong> a boomer stronghold.Will th<strong>is</strong> dual pattern become more pronounced by 2030 or will the entire region become a gateway?<strong>South</strong> <strong>Florida</strong> has many opportunities and challenges resulting from rapid population growth and increasing diversity,including closing the gap between growing economic and social d<strong>is</strong>parities. <strong>South</strong> <strong>Florida</strong> <strong>is</strong> home to extremed<strong>is</strong>parities, including some of the poorest and richest cities in the nation. Poverty and wealth are geographically concentrated,with barrier <strong>is</strong>lands and Intracoastal locations housing the greatest wealth, and inner city neighborhoodsand outlying rural areas containing the greatest poverty. Will th<strong>is</strong> pattern continue, widening div<strong>is</strong>ions between therich and poor? Or will the region retain and grow its middle-class by creating educational and economic opportunityfor all residents?5
PEOPLESOCIAL EQUITY• Among the region’s core counties, <strong>Miami</strong>-Dade has the highest rates of unemploymentand poverty. These rates may be underestimated because of undocumented workersin the region.• Poverty has been increasing in rapidly growing St. Lucie County, which increasinglyserves as a bedroom community for low-wage service sector workers in the region.• In <strong>Miami</strong>-Dade, Broward, and Palm Beach counties, almost half of the population hasa household income below that needed to make housing affordable.EDUCATION• On an aggregate bas<strong>is</strong>, school performance has been improving. Although three of theregion’s seven d<strong>is</strong>tricts scored A, social d<strong>is</strong>parities are manifested in individually lowperforming (D and F) schools, concentrated in areas with the highest percentage ofstudents eligible for free or reduced cost lunch programs.• The region’s core counties also have graduation rates significantly lower than the statewideaverage, especially among blacks and H<strong>is</strong>panics.• With respect to preparation for college, students in the region’s core counties hadhigher SAT scores than the state average, but lower than the national average. SATscores for H<strong>is</strong>panics, and especially for blacks, were significantly lower than scores forwhite graduates in the region.• Combined class and racial d<strong>is</strong>parities in educational achievement present a challengefor the future competitiveness of <strong>South</strong> <strong>Florida</strong>’s workforce, which <strong>is</strong> projected tobe 44 percent H<strong>is</strong>panic and 22 percent black by 2030.CIVIC ENGAGEMENT• Voter reg<strong>is</strong>tration increased at a faster rate than the voting age population from 1996to 2002. Voter turnout increased throughout most of the region as well, but especiallyin St. Lucie County.• Youth felony and m<strong>is</strong>demeanor referrals declined in most of the region from 1999/2000to 2003/04. <strong>Miami</strong>-Dade, which had the largest number of referrals in the region, hadsignificant declines in both felonies and m<strong>is</strong>demeanors.6
CHARTING THE COURSEPOPULATION CHANGES<strong>South</strong> <strong>Florida</strong>’s Population GrowthRapid population growth continues to be the primarydriver behind many of the challenges facing the region—from affordable housing, water supply, environmentaldegradation, traffic and congestion, to economic opportunity.In 2004, the seven-county region reached 5.9 millionpeople—up from 5.5 million in 2000— accounting for aquarter of the state’s 1.5 million new residents, a quarterof the state’s growth, and a third of its total population. 3The region <strong>is</strong> projected to reach 8.4 million residents by2030, retaining one-third share of the state’s population.State and regional growth rates will be slower than inthe past, but absolute numbers will make the state thethird most populous in the nation by 2030. <strong>South</strong> <strong>Florida</strong>will continue to be the most populous region in the state,and <strong>Miami</strong>-Dade, Broward, and Palm Beach counties willcontinue to be the most populous counties in the state. 4In 2004, the core counties were home to 5.4 million people,accounting for 90 percent of the region’s population.The northern counties accommodated eight percent of itspopulation. 5 From July 2003 to July 2004, the core countieswere among the nation’s top 20 counties in terms ofhaving the greatest number of new residents. St. LucieCounty ranked 43rd in the nation. 6 The region <strong>is</strong> projectedto grow by 2.5 million by 2030, with the core countiescontinuing to house 90 percent of the population.Though total populations are largest in the core counties,growth rates are highest in the northern counties. From2000 to 2004, St. Lucie County had the highest rate ofpopulation growth at 17 percent, followed by Indian River,Palm Beach, Martin, <strong>Miami</strong>-Dade, Broward, and Monroe. 7From July 2003 to July 2004, St. Lucie County had the 18thhighest growth rate in the nation. <strong>South</strong> <strong>Florida</strong> was alsohome to two of the fastest growing cities in the nation. Duringth<strong>is</strong> period, the City of Port St. Lucie was the fastestgrowing municipality in the nation. Miramar, in BrowardCounty, ranked eighth, with 5.3 percent growth. 8 Through2030, Palm Beach and St. Lucie counties are expected togrow most rapidly, followed by Indian River, Martin, Broward,<strong>Miami</strong>-Dade, and Monroe counties. However, by2030, they are expected to have similar growth rates. 9Sources of Population Growth<strong>Florida</strong> has long been known as a preferred retirementdestination. However, the reality <strong>is</strong> that <strong>South</strong> <strong>Florida</strong>’spopulation growth has largely been the result of immigrationfrom Latin America and the Caribbean, followedby natural increase (births minus deaths), and a smallportion from domestic migration. From 2000 to 2004, internationalimmigration had a stronger impact on growthin the region’s southern counties than in the northerncounties, accounting for most of the population growth inMonroe, <strong>Miami</strong>-Dade, and Broward counties. Domesticmigration accounted for most of the population growth inPalm Beach, Martin, St. Lucie, and Indian River counties.While domestic migration accounted for a small part ofBroward’s growth, <strong>Miami</strong>-Dade saw negative net domesticmigration, with 135,000 people leaving the county. 10<strong>South</strong> <strong>Florida</strong>'s Population by County1980-2030Millions of People3.53.02.52.01.51.00.5Millions of People0.450.400.350.300.250.200.150.1001980 1985 1990 1995 2000 2005 2010 2015 2020 2025 20300.01980 1985 1990 1995 2000 2005 2010 2015 2020 2025 2030Focus on Treasure CoastMonroe <strong>Miami</strong>-Dade Broward Palm Beach Martin St. Lucie Indian River7
WHERE IS SOUTH FLORIDA HEADING?Origins of <strong>South</strong> <strong>Florida</strong>'s Population Change2000-200424%6%70%International Immigration Natural Growth Domestic MigrationInternational immigration continues to be the most significantdriver of population change, accounting for thevast majority of the region’s population growth from 2000to 2004. 11 However, natural increase accounted for almosta quarter of the regional population change from 2000to 2004, up from one-fifth for the two-year period from2000 to 2002. Th<strong>is</strong> emerging trend <strong>is</strong> most evident in theregion’s southern counties, especially <strong>Miami</strong>-Dade andBroward, and <strong>is</strong> partially the result of higher birth ratesamong H<strong>is</strong>panics and th<strong>is</strong> group’s growing share of thepopulation. In Broward County, births are projected toovertake immigration as the greatest source of populationgrowth by 2020. 12Racial and Ethnic Diversity: The Latinization of <strong>South</strong> <strong>Florida</strong>Thousands of People200150100500-50-100Origins of Population Change by County2000-2004Cons<strong>is</strong>tent with the influx of immigrants from LatinAmerica and the Caribbean, <strong>South</strong> <strong>Florida</strong> has seen significantgrowth in its H<strong>is</strong>panic community, mirroring thenational trend. H<strong>is</strong>panics accounted for a third of the region’spopulation in 2003, projected to r<strong>is</strong>e to 39 percentby 2030. Less change <strong>is</strong> apparent in the black population,accounting for 19 percent of the region’s population in2003 and becoming 21 percent by 2030. In sharp contrast,the non-H<strong>is</strong>panic white population will decline from 46percent of the region in 2003 to 37 percent by 2030, bywhich time H<strong>is</strong>panics will have surpassed non-H<strong>is</strong>panicsin absolute numbers in <strong>South</strong> <strong>Florida</strong>. 13-150Natural Growth International Migration Domestic MigrationMonroe <strong>Miami</strong>-Dade Broward Palm BeachMartin St. Lucie Indian RiverWithin the region, <strong>Miami</strong>-Dade County will continue tohave the largest H<strong>is</strong>panic population. Currently, H<strong>is</strong>panicsaccount for about 60 percent of that county’s populationand th<strong>is</strong> <strong>is</strong> projected toincrease to 70 percent byH<strong>is</strong>panic Population by County2000-203080%14%Percent of County Population70%60%50%40%30%20%10%0%2000 2005 2010 2015 2020 2025 2030Percent of County Population12%10%8%6%4%2%0%2000 2005 2010 2015 2020 2025 2030Focus on Treasure CoastMonroe <strong>Miami</strong>-Dade Broward Palm Beach Martin St. Lucie Indian River8
CHARTING THE COURSE(18-64) and 35 percent are under 18. Nearly half do nothave a high school education. They work in the lowestpaying jobs, such as farming, cleaning, and construction,yet they fill the demand for labor in a country with a largepopulation that <strong>is</strong> reaching retirement age. 15An Aging Population: Back to the FutureThroughout <strong>Florida</strong>, the senior population will have amuch larger increase than the youth population over thenext 25 years. The senior population <strong>is</strong> expected to increasefrom 2.9 million in 2003 to 6.3 million in 2030, andthe youth population <strong>is</strong> expected to increase from 3.9 millionto 5.3 million. 162030. To a lesser degree, growth in the number of H<strong>is</strong>panicswill occur across all <strong>South</strong> <strong>Florida</strong> counties as well.In Broward and St. Lucie counties, the black population<strong>is</strong> expected to remain slightly larger than the H<strong>is</strong>panicpopulation. Non-H<strong>is</strong>panic whites are expected to retainthe greatest proportion of the population in all but <strong>Miami</strong>-DadeCounty, although they will fall to less than 50percent in Broward County. 14Millions of People3.53.02.52.01.51.00.50.0<strong>South</strong> <strong>Florida</strong>'s Population Projectionsby Race and Ethnicity2000-20302000 2005 2010 2015 2020 2025 2030White Black H<strong>is</strong>panicOne component of the H<strong>is</strong>panic population <strong>is</strong> unauthorizedimmigrants, most of which are from Latin America.According to the Pew H<strong>is</strong>panic Center, the State of<strong>Florida</strong> was home to an estimated 850,000 unauthorizedimmigrants as of March 2004, nine percent of the U.S.total. <strong>Florida</strong> was third in the nation in absolute numbers,behind California and Texas. Unauthorized immigrationhas implications for the cost of education and healthservices, and for the job economy. Sixty-four percent ofunauthorized immigrants in the U.S. are of working ageMillions of People2,5002,0001,5001,000Population Change by Age in <strong>South</strong> <strong>Florida</strong>2000-203050002000 2005 2010 2015 2020 2025 20300-17 18-34 35-54 55-64 65+During the past decade, <strong>South</strong> <strong>Florida</strong> has seen a surgein the youth population under age 18; however, the futureholds a resurgence of senior citizens over 65 years old.As Baby Boomers age, a rapidly growing senior population<strong>is</strong> expected to nearly equal the middle-age populationby 2030 and slightly surpass the youth population.As it grows, the senior sector will significantly increaseits proportion of the total regional population. By 2030,seniors will r<strong>is</strong>e to 23 percent of the region’s population. 17The youth share of the population will decrease slightlyto 22 percent. With youths and seniors projected to benearly equal, the region will be challenged to meet thehealthcare needs of the elderly, along with the additionaleducational needs of youth. 18As both <strong>South</strong> <strong>Florida</strong> and the state experience largernumbers of seniors and a shrinking working-age populationby 2030, the ability to attract legal immigrants maybecome increasingly important in supplying the workforce,in contrast to what Dr. William Frey of the BrookingsInstitution called the “slow-growing immigrantstarvedstates that will undergo ‘extreme aging’.” 199
WHERE IS SOUTH FLORIDA HEADING?composing nearly half of the working-age population andblacks nearly a quarter, it will be necessary to addressthe educational challenges faced by minority groups inthe region in order to retain a skilled workforce duringthe next 25 years. By contrast, the senior citizen population<strong>is</strong> and will continue to be composed largely of non-H<strong>is</strong>panic whites, though H<strong>is</strong>panics and blacks will gainsome share of the senior population. 22An emerging trend that will affect the culture, politics,and economy of the region <strong>is</strong> the difference in racial andethnic composition among age groups. Young <strong>South</strong>Floridians are far more diverse than older residents,especially senior citizens. Th<strong>is</strong> trend <strong>is</strong> expected to continuefor the next 25 years. By 2030, the number of blackyouths will increase slightly to 28 percent of the population,while the number of H<strong>is</strong>panic children will increasesubstantially to 42 percent. Non-H<strong>is</strong>panic whites will decreasesharply to 26 percent of the population. 20Within ethnic and racial groups, age d<strong>is</strong>tributions arechanging most significantly in the white population.Youth will compr<strong>is</strong>e only 15 percent by 2030, the workingage population 47 percent, and the senior population 37percent by 2030. 23 With H<strong>is</strong>panics dominating the youthand working-age groups, the region will likely becomeeven more H<strong>is</strong>panic in the years after 2030, changing thepolitical dynamics of the region and further linking itseconomy to Latin America and the Caribbean.Age D<strong>is</strong>tribution in <strong>South</strong> <strong>Florida</strong> by Race and Ethnicity2003 and 2030100%80%60%40%20%Percent of Total Population25%23%21%19%17%15%Senior Citizen and Youth Populationsin <strong>South</strong> <strong>Florida</strong>2000-20302000 2005 2010 2015 2020 2025 2030Youth (0-17) Elderly (65+)As H<strong>is</strong>panic children age, the region will develop a morediverse working population (ages 18 to 64). In 2030, theworking population <strong>is</strong> expected to be 31 percent white, 22percent black, and 44 percent H<strong>is</strong>panic. 21 With H<strong>is</strong>panics0%SOCIAL EQUITYPoverty Rates2003 2030 2003 2030 2003 20300-17 years old 18-64 years old 65+ years oldWhite Black H<strong>is</strong>panicThe poverty level <strong>is</strong> defined by the federal governmentand was set in 2003/04 as an annual household incomeof $18,400 or less for a family of four. Poverty rates varyamong the core counties of <strong>South</strong> <strong>Florida</strong>. In Browardand Palm Beach counties, they were below or comparableto the state and national rates from 2000 to 2004. However,<strong>Miami</strong>-Dade’s rate has been cons<strong>is</strong>tently higher. 24In 2004, the City of <strong>Miami</strong> was the third poorest majorcity in the nation, up from fifth in 2003 and down fromfirst in 2002. 25 In <strong>Miami</strong>-Dade County, poverty rates arehigher among the most vulnerable populations—youthand senior citizens—with one quarter living in poverty.10
CHARTING THE COURSEIn both Broward and Palm Beach counties, the povertyrate among youth <strong>is</strong> higher than that of the total population,but the rate for senior citizens <strong>is</strong> lower. Rates forthese groups are much lower in Broward and Palm Beachcounties than in <strong>Miami</strong>-Dade. 2620%18%Poverty Rates in <strong>South</strong> <strong>Florida</strong>2000-2004The eligibility threshold for free lunch for a family of fourin school year 2003/04 was an annual household incomeof $23,920. For reduced lunch it was $34,040. Statewide,45 percent of students in pre-kindergarten through 12thgrade received lunch benefits in 2003/04, up from 43 percentin 1994/95. Rates for most <strong>South</strong> <strong>Florida</strong> countiesare below the state average of 45 percent. However, ratesare higher in <strong>Miami</strong>-Dade and St. Lucie counties. 27Percent of Students Eligible for Free and Reduced Lunch2003 and 200470%16%14%12%60%50%40%30%<strong>Florida</strong>10%8%25%20%15%10%5%0%2000 2001 2002 2003 2004<strong>Miami</strong>-Dade<strong>Florida</strong>BrowardUnited StatesPalm BeachPoverty Rates among Youths and Seniors2004<strong>Miami</strong>-Dade Broward Palm Beach <strong>Florida</strong> United StatesYouthsSeniorsStudents Receiving Free/Reduced School LunchEligibility for free or reduced school lunch <strong>is</strong> often usedas a surrogate measure for poverty that shows how manychildren live in households with very low incomes. Thehousehold income eligibility threshold <strong>is</strong> higher thanthat for poverty but represents an income at which a familywill not be able to meet its needs without ass<strong>is</strong>tance.20%10%0%Monroe <strong>Miami</strong>-Dade Broward Palm Beach Martin St. Lucie Indian RiverHousehold Income D<strong>is</strong>tributionHousehold income d<strong>is</strong>tribution <strong>is</strong> a measure of equity thatshows how the region’s wealth <strong>is</strong> shared among its residents.While the per capita income may indicate prosperityin a county, the d<strong>is</strong>tribution shows how many sharein that prosperity. Within the region, almost one half ofhouseholds had incomes of less than $35,000 in 2003. 28While only some of these households live at the federallydefined poverty level, none of them has the income neededto afford a two-bedroom apartment at fair market rent,called the housing wage. In 2003, the housing wage was$37,160 in <strong>Miami</strong>-Dade, $39,920 in Broward, and $35,920 inPalm Beach. 29 In the region, <strong>Miami</strong>-Dade has the highestproportion of households making less than $35,000 annuallyand the lowest proportion making more than $50,000.Palm Beach, on the other hand, has the lowest proportionof households making less than $35,000 and the highestproportion making $75,000 or more. The smallest part ofthe population <strong>is</strong> in the middle income bracket of $35,000to $50,000. 30 Due to the high cost of living, th<strong>is</strong> incomedoes not have the same purchasing power in <strong>South</strong> <strong>Florida</strong>as in other areas of the state and nation.There <strong>is</strong> great d<strong>is</strong>parity in <strong>South</strong> <strong>Florida</strong> between the incomesof the wealthiest and the poorest residents, as wellas geographic concentrations of wealth and poverty. Anincome gap ex<strong>is</strong>ts between the suburbs and the central11
WHERE IS SOUTH FLORIDA HEADING?100%D<strong>is</strong>tribution of Households by Household Income2003from poorer areas and significantly limits residents’ opportunities.These areas fare poorly in job opportunities,health care services, schools, and municipal services.80%60%40%20%0%51%49%59%41%61%39%56%44%60%40%<strong>Miami</strong>-Dade Broward Palm Beach <strong>Florida</strong> United StatesLess than $35,000$35,000 or moreK-12 EDUCATIONSchool Quality and Achievement<strong>Florida</strong> educates one out of every 20 students in the nation,making the quality of a <strong>Florida</strong> education importantto both the state and national economies. 32 A good educationsystem, along with a strong economy, can help closea widening gap between the wealthy and the poor andprovide opportunities to achieve a good quality of life.cities, although the gap <strong>is</strong> decreasing. In 2000, the <strong>Miami</strong>Metropolitan Stat<strong>is</strong>tical Area (MSA) and the West PalmBeach MSA were among cities with the highest gapsbetween per capita income in the central cities and suburbs,ranking 14th and 16th nationally. However, that gap<strong>is</strong> decreasing. In <strong>Miami</strong>, one of four cities with the largestincome gaps in 1990, the gap decreased by 11 points in2000; West Palm Beach lowered its gap by two points.Economic segregation <strong>is</strong> now prominent in the suburbs aswell, with a large gap between wealthy and poor suburbs.The West Palm Beach/Boca Raton MSA has the greatestincome gap in the nation between its wealthy and poorsuburbs; the <strong>Miami</strong> MSA has the fourth largest gap. TheWest Palm Beach/Boca MSA <strong>is</strong> home not only to fourof the 50 wealthiest suburban places in the country, butalso to seven of the poorest suburban places, includingthe poorest, Belle Glade Camp. The <strong>Miami</strong> MSA <strong>is</strong> hometo four of the 50 wealthiest suburban places in the nation,including the two wealthiest, F<strong>is</strong>her Island and IndianCreek Village. 31 It <strong>is</strong> also home to two of the 50 poorestplaces. Economic segregation siphons resources awayIn 2004/05, <strong>South</strong> <strong>Florida</strong> educated about 900,000 studentsin 506 elementary schools, 128 middle schools, 111high schools, and 100 charter or combination schools. 33The ability of the region’s educational institutions to preparethe local population to enter post-secondary schooland to fill knowledge-based positions <strong>is</strong> crucial to overalleconomic competitiveness. “Labor force quality <strong>is</strong> directlyrelated to economic growth and education <strong>is</strong> thestrongest proven influence on the quality of the laborforce” according to the <strong>Florida</strong> Taxwatch Center for EducationalPerformance & Accountability. 34The <strong>Florida</strong> Comprehensive Assessment Test (FCAT) <strong>is</strong>used to measure student achievement and school quality.Each year <strong>Florida</strong> schools are given a letter grade that indicatesthe level of the school’s performance. It <strong>is</strong> basedon a combination of student performance in reading, writing,and math on the FCAT and students’ progress fromthe prior year, especially those with the lowest scores.In <strong>South</strong> <strong>Florida</strong>, since 2001/02, the number of A, B, andF schools increased while C and D schools decreased.From 2003/04 to 2004/05 there was a slight decline inC and D schools and an increase in A, B, and F schools.The recent increase in F schools may be due to the factthat writing standards were ra<strong>is</strong>ed in 2004/05, and thelearning gains of students with d<strong>is</strong>abilities and limitedEngl<strong>is</strong>h proficiency were included in school grade calculationsfor the first time. 35The achievement of the entire school d<strong>is</strong>trict <strong>is</strong> based onan aggregation of school scores. In the 2004/05 schoolyear, three <strong>South</strong> <strong>Florida</strong> school d<strong>is</strong>tricts were among the15 d<strong>is</strong>tricts in the state that received a grade of A. Theyare Palm Beach, Indian River, and Martin school d<strong>is</strong>-12
CHARTING THE COURSE<strong>South</strong> <strong>Florida</strong> FCAT Grades by County2004-2005100%80%60%40%20%0%Monroe <strong>Miami</strong>-Dade Broward Palm Beach Martin St. Lucie Indian Rivertricts. Palm Beach and Indian River both went from a Bin 2003/04 to an A in 2004/05. Martin retained its A fromthe previous year and achieved the highest scores in thestate in 2004/05. Monroe and Broward counties bothretained a B from 2003/04 to 2004/05, and <strong>Miami</strong>-Dadewent from a C to a B in the same period. <strong>Miami</strong>-Dade hadthe third largest increase in scores in the state. St. Luciereceived a C, down from a B in 2003/04. In 2004/05,five out of the seven counties have a greater number ofschools that improved since 2003/04 than declined. OnlyBroward and St. Lucie counties have more schools thatfell a letter grade. In <strong>Miami</strong>-Dade, 80 schools improved,while only 46 declined.Underperforming elementary schools are often locatedin areas with higher concentrations of poverty andamong schools in which a large percentage of studentsare eligible for free or reduced lunch. In <strong>Miami</strong>-DadeCounty, 85 percent of D or F elementary schools have 90percent or more of their students eligible for free or reducedlunch. Only 15 percent of A schools had 90 percentor more of their students eligible for the lunch program.In Broward County, 60 percent 36 of D and F schools had90 percent lunch program eligibility, compared to 1 percentfor A schools. In Palm Beach County, 33 percent ofD and F schools had 90 percent lunch program eligibility,compared to three percent for A schools. 37High School CompletionA B C D FRates of high school completion show that a large segmentof <strong>South</strong> <strong>Florida</strong> youth do not reach adulthood withthe education needed to compete among a skilled workforce.In the region’s core counties, 2003/04 four-yeargraduation rates were well below the statewide averagein <strong>Miami</strong>-Dade, Broward, and Palm Beach, a cons<strong>is</strong>tenttrend since 1998/99. Martin, St. Lucie, and Indian Rivercounties continued to have a higher rate than the statewideaverage. Although much of <strong>South</strong> <strong>Florida</strong> lags behindthe state in four-year graduation rates, there hasbeen progress in all seven counties during the past sixyears. 38 There are significant differences in graduationrates among <strong>South</strong> <strong>Florida</strong>’s three major racial and ethnicgroups. In all counties, white students have the highestgraduation rates, black students have the lowest, andH<strong>is</strong>panics are mid-range. 3990%85%80%75%70%65%60%55%50%100%90%80%70%60%50%40%30%20%10%0%<strong>South</strong> <strong>Florida</strong> High School Graduation Rates1998-20041998-1999 1999-2000 2000-2001 2001-2002 2002-2003 2003-2004Monroe <strong>Miami</strong>-Dade Broward Palm BeachMartin St. Lucie Indian River <strong>Florida</strong><strong>South</strong> <strong>Florida</strong> Graduation Ratesby Race and Ethnicity 2003-2004Monroe <strong>Miami</strong>-Dade Broward Palm Beach Martin St. Lucie Indian RiverWhite Black H<strong>is</strong>panic13
CHARTING THE COURSEOn a positive note, <strong>South</strong> <strong>Florida</strong> <strong>is</strong> steadily decreasingits high school dropout rates, most significantly in <strong>Miami</strong>-DadeCounty. Only <strong>Miami</strong>-Dade and Monroe countieshad higher rates than the state in 2003/04. MartinCounty continues to maintain the lowest dropout ratein <strong>Florida</strong>. 40 While dropout rates have been decreasingamong all three major racial and ethnic groups, d<strong>is</strong>paritydoes ex<strong>is</strong>t. In every county but Martin, dropout ratesare highest among black youths and lowest among whiteyouths. In Martin County, H<strong>is</strong>panic youths have the highestdropout rates. 41Martin and Indian River counties, <strong>South</strong> <strong>Florida</strong>’s SATscores have cons<strong>is</strong>tently fallen below both state and nationalaverages from 1997/98 to 2002/03. 42Within the region in 2002/03, Palm Beach, Martin, andIndian River counties had average SAT scores above1000, higher than the state average but lower than thenational average. The other four counties all fell belowthe state, with <strong>Miami</strong>-Dade and Broward trailing othersin the region. Only Monroe, Palm Beach, and St. Luciecounties increased SAT scores between 1997 and 2003. 4312%10%8%6%4%2%0%<strong>South</strong> <strong>Florida</strong> High School Dropout Rates1998-20041998-1999 1999-2000 2000-2001 2000-2002 2002-2003 2003-2004Monroe <strong>Miami</strong>-Dade Broward Palm BeachMartin St. Lucie Indian River <strong>Florida</strong>As with high school completion, there <strong>is</strong> also a performancegap on the SAT among white, black, and H<strong>is</strong>panictest-takers. Since 1990, the average score of black testtakersin <strong>Florida</strong> has fallen nearly 200 points below theaverage score of white test-takers. H<strong>is</strong>panic test-takershave cons<strong>is</strong>tently scored nearly 100 points below whitetest-takers. These ethnic groups show similar patternsthroughout the region. 44 In addition, average scoresamong H<strong>is</strong>panics vary according to the first languageof the student. Statewide, those whose first language <strong>is</strong>Engl<strong>is</strong>h have cons<strong>is</strong>tently scored better than those wholearned two languages at the same time and those wholearned Engl<strong>is</strong>h as their second language. However,H<strong>is</strong>panic SAT test-takers in <strong>Florida</strong> have cons<strong>is</strong>tentlyachieved higher average scores than H<strong>is</strong>panics nationwidesince 1990. White test-takers in <strong>Florida</strong> have loweraverage scores than white test-takers nationwide. 45<strong>South</strong> <strong>Florida</strong> Dropout Rates by Race and Ethnicity2003-20048%7%6%5%4%3%2%1%0%Monroe <strong>Miami</strong>-Dade Broward Palm Beach Martin St. Lucie Indian RiverWhite Black H<strong>is</strong>panicMean SAT ScoreSAT Scores by Race and Ethnicity by County2004120010008006004002000Monroe <strong>Miami</strong>-Dade Broward Palm Beach Martin St. Lucie Indian RiverWhite Black H<strong>is</strong>panicAcademic PerformanceHigh school students across the nation must take theScholastic Aptitude Test (SAT) to be eligible for collegeadm<strong>is</strong>sion, making it an important measure of collegereadiness and competitiveness. With the exception ofEducational ResourcesEducational resources, such as adequate funding andqualified teachers, are the foundation of a good education.However, <strong>Florida</strong> spends less on its students thanmost other states. It <strong>is</strong> cons<strong>is</strong>tently among the bottom ten15
WHERE IS SOUTH FLORIDA HEADING?states in per student expenditures. In 2004/05, <strong>Florida</strong>’sper student expenditure was $7,040, 82 percent of the nationalaverage of $8,554. Of the six most populous statesin the U.S., <strong>Florida</strong> has the highest personal income perstudent but the lowest spending per pupil. The averageannual teacher salary ranks 32nd among the states.<strong>Florida</strong> ranks eighth in the nation in rates of d<strong>is</strong>advantagedstudents. D<strong>is</strong>advantaged students, which includestudents in poverty, non-Engl<strong>is</strong>h-speaking students, andexceptional education students, are more costly to educate.The number of students in Limited Engl<strong>is</strong>h Proficiencyprograms more than doubled from 1992/93 to2001/02. Minority student enrollment has increased by172 percent since 1976. Total public school enrollmentincreased by 70 percent, while program enrollment inexceptional student education programs increased 172percent between 1983/84 and 2002/03. 46Despite the prevalence of minority and poor students in<strong>Florida</strong> and in <strong>South</strong> <strong>Florida</strong>, there <strong>is</strong> d<strong>is</strong>parity in the resourcesof high- and low-minority schools and high- andlow-poverty schools. One measure of d<strong>is</strong>parity <strong>is</strong> the qualityof teachers, based on their qualifications in the subjectarea taught. In <strong>Florida</strong>, where minority students lag behindon SAT scores, teachers without a major or minor in theirsubject area are more prevalent in high-poverty schools andhigh-minority schools. Almost half lack subject area credentialsin high-poverty schools, compared to 15 percent in lowpovertyschools. In high-minority schools, 30 percent lack adegree in their field, compared to 18 percent in low-minorityschools. In addition, <strong>Florida</strong> <strong>is</strong> one of only 13 states that donot provide additional funding for students living below thepoverty level. 47 Th<strong>is</strong> <strong>is</strong> especially critical considering theirimportance to the economic future of the state.50%45%40%35%30%25%20%15%10%5%0%<strong>Florida</strong> Secondary Teachers LackingMajor or Minor in Subject Area1990-2000Low PovertySchoolsHigh PovertySchools<strong>Florida</strong> AverageLow MinoritySchoolsHigh MinoritySchools<strong>South</strong> <strong>Florida</strong> <strong>is</strong> highly representative of the challengesthat <strong>Florida</strong> faces in educating its youth. With a largeminority population, it <strong>is</strong> a major point of entry for immigrantswho may not speak Engl<strong>is</strong>h. Furthermore, it<strong>is</strong> the site of one of the poorest cities in the nation, <strong>Miami</strong>.Additional resources are needed to educate <strong>South</strong><strong>Florida</strong>’s diverse population for the future. Yet four counties—Monroe,<strong>Miami</strong>-Dade, Broward, and Palm Beach—have lost money under the new funding formula enactedby the state leg<strong>is</strong>lature in 2004. It <strong>is</strong> estimated that thesecounties have already lost $60 million and will lose another$90 million in 2006 and $150 million in 2007. Theregion’s school d<strong>is</strong>tricts claim that the new wage-basedformula gives other counties a competitive edge in thehiring of teachers. 48HIGHER EDUCATIONCollege EnrollmentPost-secondary education <strong>is</strong> also a critical element in thequality of <strong>South</strong> <strong>Florida</strong>’s workforce. According to the<strong>Florida</strong> Taxwatch Center for Educational Performance &Accountability, “Through 2010, nine of the top ten fastestgrowing jobs in <strong>Florida</strong> will require an associate’s degreeor a postsecondary vocational certificate.” 49 In <strong>South</strong> <strong>Florida</strong>,64 percent of 2002/03 high school graduates went onto post-secondary school at an in-state institution, comparedto 60 percent statewide. In Monroe, <strong>Miami</strong>-Dade,Broward, and Martin counties, rates are just above theregional average. 50 In Palm Beach, St. Lucie, and IndianRiver counties, they are comparable to the state. 51Among students who attend post-secondary school in<strong>Florida</strong>, there <strong>is</strong> a gap in continuing education rates betweenwhite, black, and H<strong>is</strong>panic students. In the corecounties, which compr<strong>is</strong>e 90 percent of the region’s students,continuing education rates among white studentsled those of black and H<strong>is</strong>panic students. 52In 2004/05, <strong>South</strong> <strong>Florida</strong> colleges enrolled 239,429 students;127,000 attended one of the region’s five communitycolleges, and 113,000 attended one of its universities.53 Within the public universities, about 16 percent ofstudents were enrolled in graduate and professional programs.At the private universities, graduate enrollmentreached almost 35 percent at the University of <strong>Miami</strong> and77 percent at Nova <strong>South</strong>eastern University. Blacks andH<strong>is</strong>panics were more likely to attend community colleges,while whites were more likely to attend universities. 5416
CHARTING THE COURSENumber of StudentsStudents Enrolled in <strong>South</strong> <strong>Florida</strong> Colleges2004-200550,00040,00030,00020,00010,000International University’s graduation rate <strong>is</strong> lower thanthe state average and ranks sixth among the ten universitiesranked. Th<strong>is</strong> <strong>is</strong> not favorable for an educated regionalworkforce, considering the large proportion of FAU andFIU students who originate from <strong>South</strong> <strong>Florida</strong>. 62Degrees Awarded at Select <strong>South</strong> <strong>Florida</strong> Universities2000-20048,0000To increase workforce education, it <strong>is</strong> optimal that localstudents return home after college or stay in the regionto attend college. Data <strong>is</strong> not available to determine howmany college students come from <strong>South</strong> <strong>Florida</strong> or howmany will use their education within the region aftergraduating, but residency stat<strong>is</strong>tics give some indication.In the region’s two public universities (<strong>Florida</strong> AtlanticUniversity and <strong>Florida</strong> International University), in-stateresidents compr<strong>is</strong>e over 90 percent of the student body,most of whom are from <strong>South</strong> <strong>Florida</strong>. 55 In the two largestprivate universities (University of <strong>Miami</strong> and Nova<strong>South</strong>eastern University), between 50 and 60 percent ofstudents are <strong>Florida</strong> residents. It <strong>is</strong> not possible to determinehow many students in the private universities comefrom the region, but students from <strong>Miami</strong>-Dade and Browardcounties constitute 37 percent of total enrollment atthe University of <strong>Miami</strong>. 56 The consortium of universitiesthat will center around Scripps has the potential to increaseregional enrollment in the field of biotechnology.College CompletionWhite Black H<strong>is</strong>panic OtherCommunity CollegesUniversities<strong>South</strong> <strong>Florida</strong>’s five community colleges graduated 14,000people in 2003/04, with either Associate of Arts or Associateof Science degrees or vocational and technical certificates.57 Thirty-nine percent of graduates were white,18 percent were black, and 33 percent were H<strong>is</strong>panic. 58<strong>South</strong> <strong>Florida</strong> universities have been increasing the numberof degrees awarded. In 2003/04, four <strong>South</strong> <strong>Florida</strong>universities 59 awarded 22,500 degrees, up from 18,400 in1999/2000. The two public universities drew more than85 percent of their students from the region and awarded12,000 of the degrees conferred in 2003/04. 60College graduation rates are lower in <strong>South</strong> <strong>Florida</strong>’s publicuniversities than in the other state universities examinedby the <strong>Florida</strong> Department of Education. 61 <strong>Florida</strong>Atlantic University has the lowest graduation rate. <strong>Florida</strong>Number of DegreesNumber of Graduates7,0006,0005,0004,0003,0006,0005,0004,0003,0002,0001,00001999-2000 2000-2001 2001-2002 2002-2003 2003-2004<strong>Florida</strong> Atlantic University<strong>Florida</strong> International UniversityCIVIC ENGAGEMENTVoter ParticipationUniversity of <strong>Miami</strong>Nova <strong>South</strong>eastern University<strong>South</strong> <strong>Florida</strong> Community College Graduatesby Race and Ethnicity2003-2004White Black H<strong>is</strong>panic OtherCivic engagement refers to citizen participation in theircommunities and governments. It <strong>is</strong> an important componentof social capital, the connection among individualsbased on trust, and shared goals and values. Civic engagement<strong>is</strong> an important factor in building strong communitiesand bringing about social change.Voter participation measures conventional political engagement.It reflects confidence in political systems,concern about the fate of the community, and feelings of17
WHERE IS SOUTH FLORIDA HEADING?Voter Turnout in Presidential Elections1996-200480%75%70%65%60%1996 2000 2004Monroe <strong>Miami</strong>-Dade Broward Palm BeachMartin St. Lucie Indian River <strong>Florida</strong>empowerment. Voter reg<strong>is</strong>tration increased 17 percentfrom 1996 to 2002, while the voting population increased14 percent. Reg<strong>is</strong>tered voters increased from 68 percentof the voting age population in 1996 to 70 percent in 2002.Voter turnout increased throughout most of the regionas well. For presidential election years, every countyincreased its turnout rates from 1996 to 2004. Th<strong>is</strong> wasmost significant in St. Lucie County, where voter turnoutincreased 11 percentage points from 1996 to 2004, althoughit remains below the rate of other counties in theregion. Voter turnout also increased in non-presidentialelection years in every county except Broward. Again, St.Lucie County had the largest increase. Increases in reg<strong>is</strong>trationand turnout were greater from 2000 to 2004 thanfrom 1996 to 2000, possibly due to the national attentionthat <strong>South</strong> <strong>Florida</strong> received in the 2000 election. 63Youth OffendersFeelings of safety can promote a sense of communitywhile crime and the fear of crime can undermine thatsense. Juvenile delinquency, as measured by the numberof youths referred for committing crimes, <strong>is</strong> one measureof the present d<strong>is</strong>engagement of youth and the future ofcivic engagement. Felony referrals declined in five of theseven counties in the region from 1999/2000 to 2003/04.<strong>Miami</strong>-Dade, which had the largest number of referrals inthe region, declined 27 percent. 64 Though the number ofreferrals in St. Lucie County <strong>is</strong> small, 65 the county had thelargest increase at 11 percent, a challenge facing manyrapidly growing areas. Trends were mixed for m<strong>is</strong>demeanorreferrals. Only two counties showed a decreasein the number of referrals from 1999/2000 to 2003/04.The largest county, <strong>Miami</strong>-Dade, had a significant declinein m<strong>is</strong>demeanor referrals—a 36 percent decrease duringthat timeframe. Martin also had a 17 percent decline. 66Youths Referred for Felonies2000-2004Number of Youths6,0005,0004,0003,0002,0001,000Number of Youths90080070060050040030020010001999-2000 2000-2001 2001-2002 2002-2003 2003-200401999-2000 2000-2001 2001-2002 2002-2003 2003-2004Focus on Treasure CoastMonroe <strong>Miami</strong>-Dade Broward Palm Beach Martin St. Lucie Indian River18
CHARTING THE COURSEFLORIDA REGIONAL HIGHLIGHTS<strong>Florida</strong> <strong>is</strong> fast becoming the third largest state, and comparable demographic changes are occurring across all of itsregions. While <strong>South</strong> <strong>Florida</strong> remains a mecca for H<strong>is</strong>panics, th<strong>is</strong> trend <strong>is</strong> also being experienced in other areas of thestate. Further, the aging population <strong>is</strong> impacting other regions, some even moreso than <strong>South</strong> <strong>Florida</strong>. Education andequity <strong>is</strong>sues remain at the forefront as the state grapples with the array of demographic changes.POPULATION CHANGESThe regions of <strong>Florida</strong> will retain their shares of the state population from 2004 through 2030. <strong>South</strong> <strong>Florida</strong> will continueto have one-third of the population. Central <strong>Florida</strong> and Tampa Bay will each have about one-fifth, and Northeastand Northwest <strong>Florida</strong> will each continue to have about seven percent.Growth rates will be slower than they have been h<strong>is</strong>torically, but absolute numbers make the state one of the mostpopulous in the nation, with <strong>South</strong> <strong>Florida</strong> home to the most populous counties in the state—<strong>Miami</strong>-Dade, Broward,and Palm Beach counties. H<strong>is</strong>panics will continue to thrive in <strong>South</strong> <strong>Florida</strong>. The state’s other regions will also seesignificant increases in their H<strong>is</strong>panic populations, though perhaps not as dramatically as in <strong>South</strong> <strong>Florida</strong>.Millions of People1086420Population Projections for <strong>Florida</strong>'s2000-2030Regions2000 2005 2010 2015 2020 2025 2030Percentage of Region’s Population50%40%30%20%10%0%H<strong>is</strong>panic Population in <strong>Florida</strong>'s2000-2030Regions2000 2005 2010 2015 2020 2025 2030<strong>South</strong> <strong>Florida</strong> Central <strong>Florida</strong> Tampa Bay<strong>South</strong> <strong>Florida</strong> Central <strong>Florida</strong> Tampa BayNortheast <strong>Florida</strong>Northwest <strong>Florida</strong>Northeast <strong>Florida</strong>Northwest <strong>Florida</strong><strong>Florida</strong>Throughout <strong>Florida</strong>, seniors will gain in population share, and the youth population will lose its share of the total. Seniorsare expected to increase 114 percent, from 2.9 million in 2003 to 6.3 million in 2030, while youths are expected toincrease only 37 percent, from 3.9 million to 5.3 million in the same period. In both <strong>South</strong> and Central <strong>Florida</strong>, seniorsand youths will compr<strong>is</strong>e comparable shares of the population. Seniors will dominate in Tampa Bay, while youths willdominate in Northeast <strong>Florida</strong>.19
WHERE IS SOUTH FLORIDA HEADING?EDUCATIONEducation <strong>is</strong> a priority for the state and the nation. In theworld of global competition, it <strong>is</strong> critical for preparing theworkers of tomorrow. Unfortunately, <strong>Florida</strong> has not beena leader on th<strong>is</strong> important <strong>is</strong>sue, although it <strong>is</strong> improving.With regard to the regions of the state, major metropolitanareas were compared on high school graduation and dropoutrates, as well as on national test scores.<strong>Florida</strong>’s statewide graduation rate <strong>is</strong> 72 percent, comparedto rates in key metropolitan areas that vary considerably.Exceeding the state rate are Hillsborough County at 79percent and Orange County at 73 percent. Those countieslagging the state average are Escambia at 71 percent andDuval at 67 percent, Palm Beach and Broward at 66 percent,trailed by <strong>Miami</strong>-Dade at 61 percent. <strong>Florida</strong> has astatewide dropout rate of three percent. Duval and <strong>Miami</strong>-Dade exceed the state rate, with a five percent dropoutrate. Other counties rank at or below the state rate—PalmBeach and Orange at three percent, Hillsborough and Escambiaat two percent, and Broward at one percent. Thesouthern counties and Duval County are lagging the stateon these two measures of educational performance whileCentral <strong>Florida</strong> <strong>is</strong> leading the regions.SAT scores of <strong>Florida</strong>’s students are significantly lowerthan the national average. <strong>South</strong> <strong>Florida</strong> ranks lowestamong the major regions in <strong>Florida</strong> and below the state average.However, increases over the two-year period from2002 to 2003 were greater in <strong>South</strong> <strong>Florida</strong> and Northeast<strong>Florida</strong>.While there are no future projections of th<strong>is</strong> trend,education scores clearly need to improve to make <strong>Florida</strong>more competitive with other parts of the nation.Mean SAT Score1030Regional, State , and National SAT Scores2002-20031020101010009909809709602001-2002 2002-2003<strong>South</strong> <strong>Florida</strong> Central <strong>Florida</strong> Tampa BayNortheast <strong>Florida</strong> <strong>Florida</strong> United StatesPercentage of Region's PopulationProjected Youth (Ages 0-17) in <strong>Florida</strong>'s2000-203030%25%20%15%Regions2000 2005 2010 2015 2020 2025 2030<strong>South</strong> <strong>Florida</strong> Central <strong>Florida</strong> Tampa BayPercentage of Region's Population30%25%20%15%10%Projected Senior Citizens in <strong>Florida</strong>'s2000-2030Regions2000 2005 2010 2015 2020 2025 2030<strong>South</strong> <strong>Florida</strong> Central <strong>Florida</strong> Tampa BayNortheast <strong>Florida</strong>Northwest <strong>Florida</strong><strong>Florida</strong>Northeast <strong>Florida</strong>Northwest <strong>Florida</strong><strong>Florida</strong>20
CHARTING THE COURSECOMMENTARY FROM THE EXPERTSDr. Dario Moreno, DirectorMetropolitan Center<strong>Florida</strong> International UniversityPast 20 years. The single most important change hasbeen the empowerment of the <strong>South</strong> <strong>Florida</strong> community,both economically and politically. Most of the H<strong>is</strong>panicscoming to <strong>Florida</strong> are middle class, which <strong>is</strong> a differentH<strong>is</strong>panic population than what you see in California orNew York. With the importance of social <strong>is</strong>sues added tothat, what you see in <strong>Florida</strong> <strong>is</strong> a very dynamic H<strong>is</strong>panicpopulation with very substantial <strong>is</strong>sues of part<strong>is</strong>anship.Th<strong>is</strong> <strong>is</strong> redefining for the rest of the country what a H<strong>is</strong>panic<strong>is</strong>---a H<strong>is</strong>panic <strong>is</strong> no longer viewed as necessarilyworking class or poor. <strong>South</strong> <strong>Florida</strong> has shown that theH<strong>is</strong>panic population can be a professional, r<strong>is</strong>ing middleclass population. These trends are not only important for<strong>Florida</strong>, but for the rest of the country in terms of ourperception of what it <strong>is</strong> to be H<strong>is</strong>panic in the U.S.Next 20 years. I think diversity <strong>is</strong> making <strong>Miami</strong> a worldclass city, a truly international city. One of the importantdemographic trends <strong>is</strong> the black population of <strong>Miami</strong>-Dade County moving to Broward. They are driven toBroward by being able to buy more house for the money,a perception that the school system <strong>is</strong> better, and a viewthat <strong>Miami</strong>-Dade County <strong>is</strong> going to be increasingly H<strong>is</strong>panic.I think we were wrong in the perception that Browardwill be increasingly H<strong>is</strong>panic. I think the westernpart of Broward will see the continuing H<strong>is</strong>panics, butfarther north of that (Treasure Coast), you are going tohave increases based on how low the population <strong>is</strong> there.Palm Beach County will see more H<strong>is</strong>panics move in.In terms of the creative class that <strong>is</strong> coming in, especiallyto <strong>Miami</strong>-Dade and Broward counties, these people arereally changing that age cohort difference. Surely there<strong>is</strong> an aging population and their age <strong>is</strong> growing, but thedynam<strong>is</strong>m <strong>is</strong> looking at who <strong>is</strong> moving into the luxurybuildings and going to the night spots. I think what drives<strong>South</strong> <strong>Florida</strong> <strong>is</strong> part-time residents; they have a tremendousimpact on our economy.What needs to be done. The fact <strong>is</strong> that people here (in<strong>Miami</strong>-Dade) have figured out how we can all prospertogether. We face challenges in affordable housing, anaging population, health care, and transportation, but wealso have a booming economy, a v<strong>is</strong>ion of how the cityand county should look. Concerns that have been long ignoredin terms of environment, <strong>is</strong>sues of social equity andprosperity are being taken, and we are d<strong>is</strong>cussing themnow. These changes are incredibly positive. Are we still ayoung region that has a long way to go? Sure, but at theend of the day, I am optim<strong>is</strong>tic. All the heavy lifting hasbeen done in terms of the old tensions that have haunted<strong>Miami</strong>-Dade County: ethnic, economic, political.I see a more vertical <strong>South</strong> <strong>Florida</strong>, especially in the twosouthern counties. I see the great environmental challengesas the population grows and the elected officialsare willing to continue to move the urban developmentboundary west and south. I see the development of <strong>South</strong>Dade as the last frontier. I see institutions continuing tobe challenged.Daniella LevineExecutive Director and FounderHuman Services CoalitionPast 20 years. In the 23 years that I have lived in <strong>South</strong> <strong>Florida</strong>,I have seen the arrival of many different groups. <strong>Miami</strong>,in particular, has become one of the most international citiesin the world, with 60 percent foreign born. Many of thepeople who were uncomfortable with that change have left,so most of those who are here are comfortable with andembrace internationalization and diversity.All these waves of immigration have had a depressing effecton wages. <strong>Miami</strong>-Dade has a low salary scale, not justin the service industry, but also for professionals. With <strong>Miami</strong>remaining a mecca for the affluent, there <strong>is</strong> a growingBalkanization between the affluent and a small, middle,and growing underclass.Next 20 years. We are at a turning point, and I think thatwe could go in two different directions. We could movetoward increased Balkanization in terms of class div<strong>is</strong>ions,or we could move toward becoming a place that <strong>is</strong>far more cosmopolitan by embracing our cross-culturaldiversity and our agility in dealing with change. Whichpath we go down will depend on a lot of things, but threeare especially important—education, housing, and civicinvestment. We are doomed economically to a second-ratestatus unless we have an educated population to bolsterour competitiveness as a creative economy, and support21
WHERE IS SOUTH FLORIDA HEADING?our retiring population. The benefits of increased wageswill be wiped out unless we can do something to stabilizeour housing cr<strong>is</strong><strong>is</strong>. The current speculative bubble hascreated a huge gap between wages and housing costs,making us the community with the highest housing burdenin the nation. People are being pushed out of themarket with no place to go.What needs to be done. There <strong>is</strong> a need for coalition buildingacross the sectors (public, private, and nonprofit) toaddress these large challenges. We are a region wherepeople and organizations have typically worked independently.Essentially what we are trying to do with Imagine<strong>Miami</strong> <strong>is</strong> to identify a common v<strong>is</strong>ion for the future of theregion that will reactivate civic spirit and create a strongcommitment to th<strong>is</strong> extraordinary place.Because things have been changing so rapidly, we don’thave clearly establ<strong>is</strong>hed civic leadership. That’s a challengeas well as a huge opportunity. I believe that <strong>Miami</strong><strong>is</strong> the place where diversity will fuel a new model of civicengagement that celebrates difference, vitality, and communityresilience in the face of constant change.Carolyn Dekle, Executive Director<strong>South</strong> <strong>Florida</strong> RegionalPlanning CouncilPast 20 years. Internationalization has been a drivingforce in the region. Anytime there <strong>is</strong> a change in a LatinAmerican government or policy, it affects the populationhere. The region has experienced a great deal of changeand continues to evolve because of <strong>South</strong> <strong>Florida</strong>’s connectionto and relationship with Latin America and theCaribbean. <strong>Miami</strong>-Dade County has had a large Cuban-American community since the late 50s and early 60s,and the region’s population continues to diversify due toimmigration from the Caribbean and Latin America, aswell as other parts of the world.There <strong>is</strong> a great d<strong>is</strong>parity in incomes and wealth in the region.As the cost of living continues to increase at fasterrate than income, it will become more challenging for theless affluent, including many in the “middle class,” to liveand prosper in <strong>South</strong> <strong>Florida</strong>. But there <strong>is</strong> also a lot ofmoney moving around that <strong>is</strong> not fully quantified or understood.There are a lot of people with second or thirdjobs on the side, and a lot of money moves out of the regionto other countries. Many people come here in searchof a better quality of life because they are unable to makea living in the countries they are from and/or they areconcerned with the political climate in their countries.Many support their family members back home with theincome they earn here and products, such as clothingand medicine, they ship overseas.<strong>South</strong> <strong>Florida</strong>’s population <strong>is</strong> older than the rest of the nation,but it <strong>is</strong> getting older more slowly now. The region’spopulation <strong>is</strong> growing younger, and many of the oldercommunities that we typically associate with large retirementpopulations are rev<strong>is</strong>iting their schools and publicservices to meet the needs of new families with children.I think <strong>South</strong> <strong>Florida</strong>’s retirement population will beginto shift to other areas of the state and country because ofthe high cost of living in the region, coupled with retirementplans that are less generous than they have been inthe past. Today, fewer and fewer industries are able to offerand support a defined benefit retirement plan. <strong>South</strong><strong>Florida</strong> will become less attractive to persons on a fixedor limited income. As these types of benefits decrease,the economy of <strong>Florida</strong>, at one time highly dependent ontransfer payments, will change as well.You get a wider range of choices through public schoolsthan private schools. I know a lot of affluent families whochoose to place their children in the public school systembecause they are able to offer a broader range of programs.Of course, there are also instances where a publicschool can improve. Accountability <strong>is</strong> important but wecannot lose sight of the state’s responsibility to ensurethat there are adequate state and local resources availableto support our schools, teachers, and support staff,and children who may require additional ass<strong>is</strong>tance orsupport. We also need to be innovative and adapt if weare going to address the changing needs of our communities.What needs to be done. We are the heart of an internationalregion and the heart of a domestic region. That <strong>is</strong>a big challenge for all of us who work here professionally.If you do not have an intuitive sense about the peoplefor whom you are providing services, it <strong>is</strong> hard to knowwhat to do. In the next ten years, th<strong>is</strong> will be one of ourbig challenges. We’re going to have to figure out how toconduct “regional conversations.” We need to figure outhow to d<strong>is</strong>cuss shared concerns from different parts ofthe region. It will not surpr<strong>is</strong>e me to see in ten years aregional dec<strong>is</strong>ion-making process. I think there <strong>is</strong> politicalacceptance for the need for that. But what will be essentialin getting there <strong>is</strong> to reach agreement on whatare the regional <strong>is</strong>sues, as opposed to local, and dec<strong>is</strong>ionsthat need to be made.22
PlaceBounded by the ocean on one side and the Everglades on the other, land for human settlement has now becomea scarce resource, contributing to escalating housing costs that many residents cannot afford. Overthe past several decades, new growth has been accommodated in large-scale communities built at ever lowerdensities. In addition, traffic congestion has increased with the population, polluting the environment and causingmassive delays for commuters. It will be difficult, if not impossible, to sustain that pattern of development as 2.5million more people are added to the region. The challenge of growth will come not only from increasingly limitedsupplies of available land, but also from the cost of providing both new and ex<strong>is</strong>ting development with adequateinfrastructure.Sustainable development requires that population growth be accommodated in ways that enhance, not degrade,the natural and built environments for future generations. <strong>South</strong> <strong>Florida</strong> boasts a richly diverse but fragile naturalenvironment that includes the only subtropical ecological community in the continental United States. Over thelast 55 years—a period during which the region’s population exploded from 764,000 to almost six million—the vastwetlands in the heart of the region were reduced by more than a third. Habitat for tens of millions of birds and otherspecies has d<strong>is</strong>appeared, and the natural restorative capacity of the underlying aquifers that supply water has beencomprom<strong>is</strong>ed. Only by altering aspects of the region’s natural environment have land, water, and other natural amenitiesbeen made available to support the current population. Are these practices sustainable as the region expandsby another 2.5 million people in only a quarter of a century?WATER SUPPLY• The state has put new and expanded water storage projects (Acceler8) on a fasttrack for completion by 2010, helping to ensure adequate future water supplies.• Currently used, inexpensive sources of water are reaching their limit. However, thedemand for water will outpace population growth through 2025.• As Everglades restoration proceeds, the region’s urban areas cannot continue withoutsignificant water reuse. Unfortunately, the most populous counties in the state,<strong>Miami</strong>-Dade and Broward, are not using alternative water supplies, have not implementedsufficient reuse programs, and have the lowest per capita water reuse in theregion. The northern counties, especially Palm Beach, Martin, and St. Lucie counties,are models for the rest of the region with much higher per capita water reuse.ENVIRONMENT• The State of <strong>Florida</strong>, along with federal and local partners, has acquired 56 percentof the land currently needed for water projects and 99 percent of the land needed forhabitat restoration.• Nesting wading birds in the Everglades ecosystem have increased significantly since1999. However, because of the high waters caused by the 2004 hurricane season, notall of the bird species met the targets in 2005.• Critical beach erosion, which threatens land for development, recreation, and wildlifehabitats, has been increasing, due in part to significant hurricane activity.23
PLACEHOUSINGMOBILITY• The region’s housing market has been one of the nation’s top performers in terms ofthe overall value of sales. But residents are being priced out of the housing market withmedian prices of single family homes reaching almost $400,000 in July 2005. Medianprices in the Treasure Coast are not as high but have increased rapidly over the lastseveral years.• Throughout the region, there are large gaps between the income needed to afford ahome at the median price and the income of workers in traditional occupations. Therental market has also become increasingly tight, and the percentage of renters unableto afford fair market rent has been on the r<strong>is</strong>e since the late 1990s.• The annual delay per driver increased 31 percent from 1993 to 2003, and congestioncosts rose 70 percent. The overall number of vehicle miles traveled per household continuesto climb as the result of sprawl-type development, which requires people to usetheir cars for almost everything.• The use of public transit has been mixed over the past decade, with only a slight overallincrease. However, the Regional Transportation Authority <strong>is</strong> in the process of doubletrackingTri-Rail, thereby decreasing the time between trains from one hour to 20 minutes,and train schedules are being coordinated with buses, showing some signs ofhope for consumers.24
CHARTING THE COURSETHE NATURAL ENVIRONMENTRestoring the <strong>South</strong> <strong>Florida</strong> EcosystemA dike was built around Lake Okeechobee after a devastatinghurricane in 1928. About 30 years later, the ArmyCorps of Engineers was authorized to design the Centraland <strong>South</strong>ern <strong>Florida</strong> Flood Control Project to help protectthe region from flooding and assure the supply ofwater for urban and agricultural uses. While the projectshave been successful in meeting these needs, they havesignificantly altered the natural hydrology (timing, quantityand d<strong>is</strong>tribution of water) in the region, comprom<strong>is</strong>ingthe quality and quantity of the water, as well as thehabitats of numerous species.In 2000, Congress authorized the $8.5 billion ComprehensiveEverglades Restoration Plan (CERP) as part ofthe Water Resource <strong>Development</strong> Act of 2000 to helpimprove water quality and assure future water supply,while recovering some of the original ecology of the Everglades.The project, which aims to store,treat, and use excess water rather thanletting it run out into the ocean, <strong>is</strong> in thebeginning stages of implementation andwill be executed over the next 45 years.Projects already underway are expected toprovide 261,400 acre-feet of water storageand 4,000 acres of stormwater treatmentarea. They will also restore the quantity,quality, timing, and d<strong>is</strong>tribution of freshwaterflow to the Manatee Bay and BarnesSound estuarine systems and restorewetlands and habitats. The state and the<strong>South</strong> <strong>Florida</strong> Water Management D<strong>is</strong>trict(SFWMD) have created the Acceler8 plan,which will provide $1.5 billion to advanceCERP projects. Eight restoration projectsare expected to be completed by 2010, adecade ahead of schedule, and six of theseprojects are in <strong>South</strong> <strong>Florida</strong>. 1other important <strong>is</strong>sues compete for federal dollars. Overall,environmental<strong>is</strong>ts credit the restoration effort for coordinatingand funding scientific research, but say it hasfallen behind in the completion of important projects. 3Land Acqu<strong>is</strong>itionLand acqu<strong>is</strong>ition plays a central role in restoring the ecosystem.Land <strong>is</strong> needed for water storage and treatmentareas, aquifer recharge areas, wildlife habitat, and as abuffer between the built and natural environments. As ofDecember 2004, the State of <strong>Florida</strong>, along with federaland local partners, had identified 483,805 acres to be acquiredspecifically for water projects, over half of whichhave already been acquired. They have also identified1,702,831 for habitat restoration, almost all of which havealready been acquired. About 405,000 acres are neededfor CERP projects, half of which have already been acquiredand overlap with land for other water and habitatprojects. Th<strong>is</strong> land <strong>is</strong> in addition to the federally ownedEverglades National Park. 4Other proposed projects seek to provideadditional water storage, restore wetlands,and restore freshwater flow to B<strong>is</strong>cayneBay and B<strong>is</strong>cayne National Park in thesouthern part of the region and to the IndianRiver Lagoon and St. Lucie Estuary inthe north. 2 However, authorization of $1.2billion to save the St. Lucie Estuary andthe Indian River Lagoon, vital componentsof restoration, has stalled in Congress as25
WHERE IS SOUTH FLORIDA HEADING ?Nesting Wading Birds in <strong>South</strong> <strong>Florida</strong>1986-200530,00025,000Pairs of Birds20,00015,00010,0005,00001986-881988-90 1990-92 1992-94 1994-96 1996-98 1998-00 2000-02 2002-041987-89 1989-91 1991-93 1993-95 1995-97 1997-99 1999-01 2001-03 2003-05White Ib<strong>is</strong>Great EgretSnowy Egret/ Tricolored HeronWood StorksNesting Wading BirdsThe <strong>South</strong> <strong>Florida</strong> Ecosystem Restoration Task Forceidentified nesting wading bird populations as an indicatorof ecosystem health and establ<strong>is</strong>hed targeted increases inthe populations for four species of nesting wading birds.About a century ago, the population of nesting wadingbirds in the greater Everglades region, which includesboth coasts of <strong>South</strong> <strong>Florida</strong>, was about 2.5 million. Withthe drainage of the wetlands, th<strong>is</strong> population has plummeted.The restoration of the natural hydrology and waterlevels <strong>is</strong> expected to increase populations of nestingwading birds and cause a return to their h<strong>is</strong>toric nestinglocations. All four species met their targets in 2004;however, because of high waters caused by the 2004hurricane season, only two species met their targets in2005. But, h<strong>is</strong>toric nesting patterns have not reemerged.In 2005, only 5.5 percent of nesting birds were found inthe southern mainland estuaries, their h<strong>is</strong>toric nestinglocation. Most were found in the central and northernEverglades. 5Water SupplyPrimary goals of ecosystem restoration are to ensurethat water will be available for ex<strong>is</strong>ting and future uses,while protecting and enhancing natural systems. Freshwater <strong>is</strong> drawn from both surface waters, such as LakeOkeechobee, and from underground aquifers, which areporous stone formations that are recharged very slowlythrough the seepage of groundwater. Water used for agriculture,commercial irrigation, and power generationcomes largely from surface waters, while water used byresidents (including residential irrigation) and industries<strong>is</strong> derived primarily from groundwater.It <strong>is</strong> critical to extract no more groundwater from aquifersthan <strong>is</strong> recharged. During a prolonged drought inthe early 1970s, water tables dropped to a point wheresalt water was absorbed into coastal wells. The largestsource of groundwater withdrawals <strong>is</strong> public supply,which comes from the city or county water supply systemand <strong>is</strong> delivered to homes, businesses, and schools,among others. Public water supply withdrawals currentlyaccount for 70 percent of fresh groundwater withdrawalsin the region. Based on preliminary estimates of publicwater supply demand, such withdrawals are expected toincrease 60 percent by 2025. 6 Agricultural demand, whichhas a greater impact on surface waters, <strong>is</strong> expected to decrease.However, due to the limited amount of inexpensive,easily extracted water, and the impact of water withdrawalson the Everglades, it will be a challenge to meetthe increasing water demands of the rapidly expandingpopulation.Million Gallons per Day2,0001,7501,5001,2501,000750500Freshwater Withdrawals in <strong>South</strong> <strong>Florida</strong>1975-20001975 1980 1985 1990 1995 2000Surface WaterGroundw ater26
CHARTING THE COURSEH<strong>is</strong>toric and Projected Population and Public SupplyWater Demand in <strong>South</strong> <strong>Florida</strong>2000-2025Thousands of People8,0007,0006,0005,0004,0002000 2025PopulationWater Demand1,6001,4001,2001,000The SFWMD recommends increasing the use of reclaimedwater. Reclaimed and treated wastewater <strong>is</strong> largelyused for landscape irrigation, agriculture, groundwaterrecharge, and industrial uses, offsetting groundwaterand surface water withdrawals. In <strong>South</strong> <strong>Florida</strong>, waterreuse <strong>is</strong> highest in the core counties, reaching 35 milliongallons per day in Palm Beach. However, per capita waterreuse <strong>is</strong> much higher in the northern counties, withBroward and <strong>Miami</strong>-Dade lagging behind the rest of theregion. 7 Alternatives for helping <strong>South</strong> <strong>Florida</strong> reach asustainable balance between water supply and water consumptioninclude the use of treated wastewater for irrigationand agriculture, desalinization and reverse osmos<strong>is</strong>of salt water, and conservation measures encouragedthrough public awareness campaigns.In addition, the ability of the region to meet its futurewater needs largely depends on the completion of CERPprojects and effective growth management. <strong>Florida</strong>’s newgrowth management law of June 2005 appropriated $1.1800Million Gallons per Daybillion for water over the next ten years, largely to developalternative sources. 8 The law encourages cooperationin the development of water supplies and regional watersupply authorities by municipalities, counties, and speciald<strong>is</strong>tricts; requires budget allocations to be used foralternative water supply development by water managementd<strong>is</strong>tricts; and establ<strong>is</strong>hes economic incentives foralternative water supply development. The new law alsorequires that communities develop plans for water supplyand infrastructure before allowing population and urbangrowth. They will be expected to “pay as they grow.” 9Water QualityThe groundwater that supplies most of the region’spotable water meets quality standards. However, thesurface waters, which are used for agricultural andrecreational irrigation, recreational activities such asswimming and f<strong>is</strong>hing, and as habitats for numerousplants and animals, are easily contaminated by urbanstormwater, agricultural runoff, domestic and industrialwastewater, and hydrologic modifications. Surface watercontaminated to the point it fails to meet its designateduse (e.g., f<strong>is</strong>hing, swimming, drinking) <strong>is</strong> consideredimpaired. Federal and state laws require that waters bemonitored for pollutants and that total maximum dailyloads (TMDLs) be developed for impaired waters. TheTMDL <strong>is</strong> the maximum amount of any particular nutrient(e.g., nitrates and phosphates) or pollutant (e.g.,mercury) that a water body can contain and still meet itsdesignated use. In <strong>South</strong> <strong>Florida</strong>, 134 tested water bodies(34% of total tested) were identified as contaminated,necessitating development of TMDLs for different pollutants.Of these, 11 water bodies have been identifiedas having one or more contaminants, making them highpriority for TMDL remediation. 10Water Reuse in <strong>South</strong> <strong>Florida</strong>2004Water Bodies Targeted for Pollution Monitoring2004Millions of Gallons403530252015105080706050403020100Gallons per Day per PersonNumber of Water Bodies Impaired50403020100100%80%60%40%20%0%Percent of Water Bodies ImpairedMonroe <strong>Miami</strong>-Dade Broward Palm Beach Martin St. Lucie Indian RiverMonroe <strong>Miami</strong>-Dade Broward Palm Beach Martin St. LucieIndian RiverTotal Water ReusePer Capita Water ReuseTotal Impaired% Impaired27
WHERE IS SOUTH FLORIDA HEADING ?Beach Erosion<strong>South</strong> <strong>Florida</strong>’s beaches and coastal waters are importantto the region’s economic and ecological health. They attracttour<strong>is</strong>ts, provide habitat for wildlife, and enhance thequality of life for the region’s residents. The challenge <strong>is</strong>for both the beaches and the coastal waters to overcomeenvironmental and man-made hazards that threaten theirecological health. Beach erosion <strong>is</strong> a primary concern,particularly in <strong>South</strong> <strong>Florida</strong>. Some beach erosion <strong>is</strong> dueto natural forces, such as high winds and tidal surgescaused by hurricanes. Some <strong>is</strong> due to coastal developmentand sea walls built to protect against storm surges.Most <strong>is</strong> the result of the construction and maintenance ofnavigational inlets. As trade and tour<strong>is</strong>m grow at <strong>South</strong><strong>Florida</strong> ports, it has become necessary to deepen inletsto accommodate commercial and recreational vessels, interruptingthe natural flow of sand and causing sand lossfrom the beaches. 11In 2004, after <strong>Florida</strong> was ravaged by four hurricanes,nearly 60 percent of the state’s 825 miles of beacheswere eroded, and more than 40 percent were criticallyeroded—threatened with loss of land for upland development,recreational interests, wildlife habitat, or importantcultural resources. <strong>South</strong> <strong>Florida</strong> has a larger proportionof critically eroded beaches, 16 percent above the statebenchmark. <strong>South</strong> <strong>Florida</strong> beaches now compr<strong>is</strong>e 33 percentof the state’s critically eroded beaches. 12Each year <strong>Florida</strong> spends $113 million on restorationand nour<strong>is</strong>hment projects at priority beach sites. Regularnour<strong>is</strong>hment and restoration activities for f<strong>is</strong>cal year2004/05 included four priority projects in <strong>South</strong> <strong>Florida</strong>:<strong>South</strong> Boca Raton, Palm Beach Island, Hutchinson Island,and Fort Pierce. The St. Lucie Inlet ManagementImplementation Plan <strong>is</strong> also a priority project. In addition,17 projects will be undertaken throughout the region torestore about 90 miles of <strong>South</strong> <strong>Florida</strong> beaches that wereimpacted by hurricanes Frances and Jeanne in 2004.Beach Adv<strong>is</strong>oriesOcean water in <strong>Florida</strong>’s coastal counties <strong>is</strong> tested ford<strong>is</strong>ease-causing bacteria caused by human and animalwaste that comes from stormwater runoff from urban,suburban, and rural areas; from d<strong>is</strong>charges of untreatedwastewater from sewage treatment plants; or from septictank failures. An adv<strong>is</strong>ory <strong>is</strong> <strong>is</strong>sued when the amount ofbacteria measured exceeds the acceptable amount.Overall, adv<strong>is</strong>ories have been minimal in <strong>Miami</strong>-Dade,Palm Beach, Martin, and Indian River counties, thoughPalm Beach and Martin experienced anomalies in 2004.The number of days that adv<strong>is</strong>ories were <strong>is</strong>sued in <strong>South</strong><strong>Florida</strong> increased 25 percent from 2003 to 2004, 13 withmuch of the contamination in Monroe and Palm Beachcounties localized in just a few beach areas. 14 MonroeBeach Miles Critically Eroded400350300250200150100500Beach Erosion in <strong>Florida</strong> and <strong>South</strong> <strong>Florida</strong>1999-20051999 2002 2005Number of Days6005004003002001000Beach Adv<strong>is</strong>ories in <strong>South</strong> <strong>Florida</strong>2003-20042003 2004<strong>South</strong> <strong>Florida</strong><strong>Florida</strong>Monroe <strong>Miami</strong>-Dade Broward Palm BeachMartin St. Lucie Indian River28
CHARTING THE COURSECounty had a large number of adv<strong>is</strong>ories due to runofffrom a population heavily dependent on septic tanks andliving in close proximity to the water. The substantial decreasein Broward <strong>is</strong> m<strong>is</strong>leading because the Intracoastaltesting site that resulted in many of the adv<strong>is</strong>ories in 2003was no longer monitored in 2004. 15 Because tougher standardswere establ<strong>is</strong>hed in August 2002, adv<strong>is</strong>ories priorto 2003 are not comparable.Not only have Broward County’s beaches had minimalcontamination in 2004, but five have been certified bythe Clean Beaches Council as Blue Wave Beaches, indicatingthat they are clean, healthy, and environmentallywell-managed. The five beaches—Hollywood, DaniaBeach, Fort Lauderdale, Pompano Beach, and DeerfieldBeach—all met criteria for water quality, beach conditions,safety, service, habitat conservation, erosion management,and public information and education. 16F<strong>is</strong>h Landings<strong>South</strong> <strong>Florida</strong>’s coastal waters also include bays, estuaries,and lagoons, all of which are located close to theocean, composed of both saltwater and freshwater sources,and are threatened by pollution from urban runoffand salinity imbalances. Shellf<strong>is</strong>h are very sensitive tochanges in the water’s salinity, and an imbalance can leadto a decline in shellf<strong>is</strong>h populations and, therefore, shellf<strong>is</strong>hcatches. Shellf<strong>is</strong>h catches in <strong>South</strong> <strong>Florida</strong> remainedfairly constant from 1990 to 2000 but declined sharplyfrom 2000 to 2001, due largely to a 43 percent decreasein Monroe County, where almost 90 percent of <strong>South</strong><strong>Florida</strong>’s shellf<strong>is</strong>h <strong>is</strong> caught. From 2001 to 2003, catchesincreased slightly in Monroe County, but decreased in allother counties. 17 Saltwater f<strong>is</strong>h catches also indicate thehealth of coastal waters. Smaller catches can result fromMillions of Pounds15141312111098Landings of F<strong>is</strong>h and Shellf<strong>is</strong>h in <strong>South</strong> <strong>Florida</strong>2000-20032000 2001 2002 2003Shellf<strong>is</strong>hF<strong>is</strong>hpollution, declines in water clarity, loss of seagrass,damage to coral reefs, as well as over-f<strong>is</strong>hing. Overall f<strong>is</strong>hlandings decreased by 42 percent from 1990 to 2000, butrose slightly by 2003. 18LAND USEUrban AreasThe region cons<strong>is</strong>ts of 5.3 million acres of land. The threesouthern counties—Monroe, <strong>Miami</strong>-Dade, and Broward—cover2.7 million acres, about 70 percent of which<strong>is</strong> part of the original Everglades. The rest <strong>is</strong> largely urbanizedarea with some agriculture. Almost 70 percent ofPalm Beach County’s 1.4 million acres <strong>is</strong> either conservationor agricultural land. About half of the three northerncounties <strong>is</strong> composed of agricultural land, followed byabout one-third urban areas. 19The pressure of population growth has led to significantexpansion of urban areas, largely in the western partsof the region, in low-density suburban communities. Inthe core counties, the populations of the western areasgrew by at least 30 percent from 1990 to 2002, and manyexceeded 65 percent. In contrast, most urbanized easterncommunities grew by less than 20 percent and someeven lost population. 20 The predominance of growth inthe western part of the region represents urban sprawl,which <strong>is</strong> a geographically radiating pattern of developmentthat moves outward from the urban core and threatensrural and environmentally sensitive lands in the region.Currently, <strong>South</strong> <strong>Florida</strong> ranks number eight amongthe top 20 sprawling economic areas in the country. 21 By2025, <strong>South</strong> <strong>Florida</strong> <strong>is</strong> expected to have the eighth highesthousehold growth among the nation’s economic areas.It <strong>is</strong> also expected that <strong>South</strong> Floridians will pay $194billion (or $36,336 per person) over 25 years (2000-2025)29
WHERE IS SOUTH FLORIDA HEADING ?<strong>South</strong> <strong>Florida</strong>'s Land Use by County(in acres)Indian RiverSt. LucieMartinPalm BeachBroward<strong>Miami</strong>-DadeMonroe96,750 191,333 58,62726,240 221,537 161,52373,000 206,198 170,252466,000 535,965 427,685432,710 23,741 319,239837,630 90,373 335,417591,970 40,0400% 10% 20% 30% 40% 50% 60% 70% 80% 90% 100%Conservation Agriculture Urbanto live in sprawling communities. If just a quarter of lowdensitygrowth <strong>is</strong> shifted to higher density growth, residentscould save $18 billion (or $3,277 per person). 22In addition to low-density residential development, officelocations in the region are also highly d<strong>is</strong>persed. 23 Comparedto 12 other major metropolitan areas throughoutthe United States, <strong>South</strong> <strong>Florida</strong> has the largest percentageof office space in suburban areas. 24 The urban areasof downtown <strong>Miami</strong>, downtown Fort Lauderdale, BocaRaton, and <strong>Miami</strong> International Airport accounted foronly 34 percent of office space in 1999. Suburban citiesaccounted for 66 percent. Th<strong>is</strong> <strong>is</strong> not new for <strong>South</strong> <strong>Florida</strong>,where office space was similarly d<strong>is</strong>tributed prior to1980, with 69 percent in the suburbs. 25Th<strong>is</strong> pattern of residential and office development jeopardizesundeveloped land and contributes to trafficcongestion. D<strong>is</strong>persed workplace concentrations makeit difficult to provide mass transit, resulting in longercommutes and reducing available time with family andfriends. Additionally, th<strong>is</strong> development pattern decreasesemployment opportunities for residents of declining innercities. On the other hand, some argue that althoughurban sprawl increases commuting d<strong>is</strong>tance, it also increasesspeed and decreases congestion because driversare more d<strong>is</strong>persed. 26Population and urban area growth in the northern countiesof Martin, St. Lucie, and Indian River are in their earlystages, and St. Lucie has become a “hot spot” for moreaffordable housing. Growth management <strong>is</strong> an important<strong>is</strong>sue in these counties as they face dual <strong>is</strong>sues of sprawland land conservation. 27Rural and Agricultural AreasRural and agricultural lands are an essential part of theregion’s sustainability and an important link between thenatural and built environments. They provide natural areasfor water retention and treatment, aid in aquifer recharge,provide wildlife habitat, help direct developmentto urban areas, and provide space for recreation and30
CHARTING THE COURSEenjoyment of nature. However, they are threatened bychanges in the agriculture industry and pressures from agrowing population. According to St. Lucie County Comm<strong>is</strong>sionerDoug Coward, “[T]he region’s rural lands andnatural systems are in cr<strong>is</strong><strong>is</strong>. Unless we take bold stepsto protect and restore large natural areas, contiguous expansesof open space, and agricultural lands, and changehow and where we develop, the cr<strong>is</strong><strong>is</strong> will only accelerateas the population grows.” 28Thousands of AcresAgriculture contributes almost $1.8 billion annually to<strong>South</strong> <strong>Florida</strong>’s economy, although the market value ofagricultural products has decreased. Regionally, marketvalues fell two percent from 1992 to 2002, and farmlanddecreased ten percent. In Palm Beach County, which hasthe largest regional agriculture sector, profits decreased15 percent over the decade and farmland decreased 16percent. In the Treasure Coast, market values fell 26 percent,and farmland decreased seven percent. However, in<strong>Miami</strong>-Dade County, market values increased 62 percent,and farmland increased eight percent. 29Global competition from countries with lower productioncosts and fewer environmental regulations <strong>is</strong> making itdifficult for American farmers to remain competitive.Th<strong>is</strong> intensified in 2004 when two hurricanes devastated<strong>South</strong> <strong>Florida</strong>’s crops. About 60 percent of citrus cropswere destroyed and winds spread canker d<strong>is</strong>ease, causingfurther losses. These economic conditions, alongwith demand for low-density, moderately priced housing,make rural lands much more valuable when developedthan when farmed. 30Rural landowners have been under increasing pressurefrom developers to sell their land. To retain rural lands, it8007006005004003002001000<strong>South</strong> <strong>Florida</strong>'s Agricultural Lands1982-20021982 1987 1992 1997 2002<strong>Miami</strong>-DadeBrowardPalm BeachMartinSt. LucieIndian River<strong>is</strong> essential that landowners generate sufficient revenues,or that lands are protected by government programs. Currently,some rural lands are protected by conservationeasements, limiting use to designated purposes and prohibitingsales for development. Another retention strategy<strong>is</strong> to increase the land’s revenue-producing capacity ininnovative ways, such as supplanting profitable crops likespecialty crops and horticulture for traditional crops, andcreating multiple uses for the land. Th<strong>is</strong> includes offeringservices and products such as stormwater and wastewatertreatment, wildlife habitat, and recreation and openspace. These would be produced and marketed as part ofthe landowner’s business. 31Conservation AreasAs urban development proceeds and rural lands becomeprime areas for future development, it <strong>is</strong> essential toconserve environmentally sensitive lands to protect andrestore <strong>South</strong> <strong>Florida</strong>’s ecosystem and to provide openspace and recreational areas for residents and v<strong>is</strong>itorsalike. Land <strong>is</strong> acquired by the public through fundingpartnerships between local, county, and state governments,as well as conservation groups such as the Trustfor Public Land, 1000 Friends of <strong>Florida</strong>, the <strong>Florida</strong>Audubon Society, and The Nature Conservancy.The State of <strong>Florida</strong> provides $300 million annuallythrough the <strong>Florida</strong> Forever program, and county and citygovernments ra<strong>is</strong>e money for land acqu<strong>is</strong>ition throughbonds and taxes. In the past five years, 13 measureshave been approved at the county and municipal levels.In 2004, seven measures passed in <strong>South</strong> <strong>Florida</strong>. Threewere in <strong>Miami</strong>-Dade County, where $1.4 billion in bondswas approved for improvement of parks and recreationalfacilities, preservation of endangered lands, land acqu<strong>is</strong>ition,new playgrounds, and h<strong>is</strong>toric site preservation.31
WHERE IS SOUTH FLORIDA HEADING ?Three were in Palm Beach County, totaling $76 million,including a countywide bond to acquire property to protect,preserve, and expand public access to waterwaysand working waterfronts. The other two were passedby municipalities. One in Jupiter was for land preservationand the other in Delray Beach for acqu<strong>is</strong>ition ofnew parks and improvement of ex<strong>is</strong>ting parks. The lastmeasure was in Indian River County, where a $50 millionbond was approved for the purchase of environmentallysensitive lands and open space. 32 In some cases, there <strong>is</strong>a significant difference between the total amount of bondmeasures approved by voters and the amount allocatedfor land acqu<strong>is</strong>ition because more of the money <strong>is</strong> allocatedfor capital improvements to recreation centers.Number of Purchases900800700600500400300200Foreign Real Estate Investmentin <strong>South</strong> <strong>Florida</strong>’s Core Counties1983-2003$1,800$1,600$1,400$1,200$1,000$800$600$400Millions of Dollars of PurchasesHOUSINGThe Housing Market<strong>South</strong> <strong>Florida</strong>’s housing market remains strong and hasbeen characterized by continuous demand and escalatinghome prices. The region’s metropolitan areas havecons<strong>is</strong>tently been among the top performing housingmarkets in the nation. West Palm Beach-Boca Raton, <strong>Miami</strong>-Hialeah,and Fort Lauderdale-Hollywood-PompanoBeach ranked among the nation’s top 15 housing marketsin the first quarter of 2005, although appreciationrates are slowing from a year ago. 331000$01983 1987 1991 1995 1999 20031985 1989 1993 1997 2001Number of Purchases$200Dollar Volume of Purchasesstructures. Overall, th<strong>is</strong> will result in a 52 percent regionwideincrease in residential units. The total number ofresidential units, including new and ex<strong>is</strong>ting units, willreach over three million. 35Sales and construction are booming, with residents andforeigners continuing to invest in real estate. In <strong>Miami</strong>-Dade, new residential construction permits hit a ten-yearpeak in 2004, due largely to construction in Homestead.In Palm Beach, the trend has been one of growth, peakingin 2003 and falling slightly in 2004. Though the northerncounties did not undergo the same volume of residentialconstruction permitting as the southern counties, therate of growth has been more dramatic. The only exception<strong>is</strong> Broward, which <strong>is</strong> approaching build-out.In 2004, 55 percent of <strong>Miami</strong>-Dade’s new residentialpermits were for multi-family housing, reflected in theincreasing number of condominium conversions. Multifamilyhousing accounted for 45 percent of new permitsin Broward County and 30 percent in Palm Beach County.In the northern counties, only 15 percent of 2004 permitswere for multi-family units. 34It <strong>is</strong> projected that, at a minimum, an additional 1.5 millionresidential units will be needed during the next 25years to house the region’s population and to replace old32
CHARTING THE COURSEHousing AffordabilityAlthough the real estate market <strong>is</strong> strong, the region’sworkers continue to be challenged by the escalatingprice of housing. In July 2005, median prices for theregion’s ex<strong>is</strong>ting single family homes reached almost$400,000, except in the Fort Pierce MSA where medianhome prices reached $265,300. The region’s July 2005median sales prices were 26 to 37 percent higher thana year ago. 36 By October 2005, median prices had fallenslightly in the Fort Lauderdale MSA and Fort PierceMSA due to Hurricane Wilma and the cooling housingmarket. Some experts say that the market has peaked,and appreciation rates may slow to single digits. 37 Condominiumsand townhouses are a more affordable option,yet they are also expensive and rapidly appreciating invalue. For example, in June 2005, the median price of atownhouse/condo was $205,000 in Broward County and$259,000 in <strong>Miami</strong>-Dade. 38Rapid appreciation has made it increasingly difficult forthe average worker to afford a single-family home sincewages cannot keep pace with prices. Regionally, abouta quarter of homeowner households in 2002 paid morethan 30 percent of their income on housing. The householdcost burden <strong>is</strong> highest among homeowners in Broward,followed by <strong>Miami</strong>-Dade, Palm Beach, Monroe, St.Lucie, Indian River, and Martin counties. <strong>Miami</strong>-Dadeand Broward have the largest percentage of homeownerhouseholds statewide paying more than half of their incomeon housing. 39 The pool of affordable housing in theregion has declined substantially over the past decade, sothat median income households can now afford less thana third of homes, and only 14 percent in <strong>Miami</strong>. 40The gap between the money needed to purchase a home(single or multi family) and the salary of workers in traditionaloccupations (such as elementary school teachersand police officers) <strong>is</strong> becoming greater. In 2005, policeofficers’ salaries were well below that needed to purchasea home, compared to 1999, when police officers’ incomesexceeded that necessary to afford a home. The salariesof elementary school teachers in 2005 were well belowthat needed to buy a home. 41Not only <strong>is</strong> homeownership becoming farther out ofreach, but the gap between renters’ incomes and fairmarket rents also continues to grow. <strong>Florida</strong> ranked 49thin the country for rental housing affordability and morethan 40 percent of renter households statewide are “costburdened,” meaning that more than 30 percent of incomegoes toward housing. 42PercentHomes Affordable for Median Income Households1995-200580%70%60%50%40%30%20%10%0%<strong>Miami</strong>-<strong>Miami</strong> Beach-KendallFort Lauderdale-Pompano Beach-Deerfield Beach1995 2005West Palm Beach-Boca Raton-Boynton BeachPort St. Lucie-Fort PierceMedian Price of Ex<strong>is</strong>ting Single Family Homein <strong>South</strong> <strong>Florida</strong> MSAs1994 and 2004Housing Affordability for Elementary School Teachersin <strong>South</strong> <strong>Florida</strong>’s MSAs2005$400$80,000$70,000Thousands$300$200$100United States<strong>Florida</strong>$60,000$50,000$40,000$30,000$20,000$10,000$0$019942004<strong>Miami</strong>-Dade Fort Lauderdale West Palm Beach Fort Pierce<strong>Miami</strong>Fort LauderdaleWest Palm Beach-Boca RatonFort Pierce-Port St. LucieIncome Needed to Afford Median Priced HomeElementary School Teacher’s Income33
WHERE IS SOUTH FLORIDA HEADING ?In 1992, the <strong>Florida</strong> Leg<strong>is</strong>lature passed the William E. SadowskiAffordable Housing Act to provide money to localgovernments for affordable housing initiatives. Underthe act, the State Housing Initiative Partnership programprovides funding for both ownership and rental units tocounty and city governments based on population size.Local governments leverage these appropriations with localpublic and private sector funds. Since its inception, theamount of money from the state to the region increasedmore than 800 percent, from four million dollars in f<strong>is</strong>calyear 1994/95 to $37 million in 2003/04. 43 <strong>Florida</strong> hasbeen a national leader in establ<strong>is</strong>hing a dedicated fundingsource for affordable housing, the documentary stamptax. However, 2002/03 was the last year of full funding,at $250 million statewide. Since then, funding has beencapped and has decreased to under $200 million, whileadditional money from the housing fund was appropriatedfor other uses. In 2006/07 $243 million was appropriatedfor housing. If funding <strong>is</strong> not capped th<strong>is</strong> year, anadditional $400 million will be available for housing. 44TRANSPORTATIONHighway CongestionPopulation growth, sprawling land development, crosscountycommuting, and a lack of transportation alternativeshave led to increasing traffic congestion regionwide.In 2003, the annual delay per peak hour driver in the<strong>Miami</strong>-Fort Lauderdale-West Palm Beach MSA reached51 hours, up 31 percent from 1993. The <strong>South</strong> <strong>Florida</strong>MSA had the 13th highest per-driver annual delay amonglarge MSAs nationwide. The cost of congestion has r<strong>is</strong>enas well, reaching $869 in 2003, up 70 percent from 1993. 45Cons<strong>is</strong>tent with increased traffic delays and congestioncosts, drivers are traveling more miles on <strong>South</strong> <strong>Florida</strong>highways. Vehicle miles of travel (VMT) <strong>is</strong> the sum of thed<strong>is</strong>tances traveled by all motor vehicles in the region in aspecified period of time. Increases in VMT add to air pollution,fuel consumption, and traffic congestion. Due tothe large population increase from 1990 to 2000, the totalnumber of VMT in the region grew 45 percent while percapita VMT grew 17 percent. Monroe, Broward, PalmBeach, and Indian River all experienced more than a 20percent increase in per capita VMT, with Indian Riverleading the way at 29 percent. <strong>Miami</strong>-Dade, Martin, andSt. Lucie counties realized increases between 10 and 14percent. 46 In addition, excess fuel consumption has increased329 percent from 1983 to 2003. 47Projections for 2030 yield similar results. Total VMT <strong>is</strong>projected to increase another 107 percent from 2000 toCongestion Cost (Dollars)1200100080060040020002030. 48 Population increases and additional drivers willfuel much of th<strong>is</strong> increase, as per capita VMT <strong>is</strong> projectedto increase by 36 percent. Palm Beach County <strong>is</strong> expectedto have the largest per capita VMT increase from2000 to 2030, trailed by Monroe, <strong>Miami</strong>-Dade, Broward,Indian River, St. Lucie, and Martin counties. 49Public TransitTraffic Congestion in <strong>South</strong> <strong>Florida</strong>1983-20031983 1988 1993 1998 2003Public transit has been slow to gain popularity among<strong>South</strong> <strong>Florida</strong> residents, in part because of limited and inconvenientboarding locations and long travel times. Busridership has increased slowly but steadily in Browardand Palm Beach counties from 1994 to 2004. In <strong>Miami</strong>-Dade, it decreased through the 1990s and through 2002but began to increase from 2003 to 2004, likely due toincreases in the price of fuel. 50 Tri-Rail gained numerousriders when it became available to ease traffic congestionwhile Interstate 95 was under construction, but ridershipDelay (Person-hours)Delay per Peak TravelerCongestion Cost per Peak TravelerVehicle Miles Traveled in <strong>South</strong> <strong>Florida</strong> Region1990-2030Millions of Miles3503002502001501005001990 2000 2010 2020 2030Per Capita Vehicle M iles TraveledTotal Vehicle M iles Traveled35302520151050Miles Per Capita34
CHARTING THE COURSEMillions of Riders120115110105100959085807570Public Transit Ridership in <strong>South</strong> <strong>Florida</strong>1992-20041992 1994 1996 1998 2000 2002 20041993 1995 1997 1999 2001 2003Core-County Bus Ridershipswiftly declined after 1994. It has been on an upward trendrecently, increasing 29 percent from 1999 to 2004. 51As the region’s available land for highways declines andvehicle travel becomes increasingly inefficient, urbaninfill, transit-oriented development, and public transportationprojects are gaining attention. Transit supportivedevelopment can improve mobility and ease congestionwhile giving greater access to jobs and affordable housing.However, creating and maintaining a quality transitsystem requires significant resources for building infrastructureand fleet capacity in addition to system operationand maintenance costs.In 2006, the tri-county area will receive almost $25 millionfrom the federal government as part of its transportationspending bill, in addition to monies from the TransportationEquity Act. Funded projects include expansion ofMetrorail in <strong>Miami</strong>-Dade, street enhancements and alternativefuel buses in Broward County, and buses and trolleyshelters in Palm Beach County. 523.02.92.82.72.62.52.42.32.22.12.0Tri-Rail RidershipMillions of RidersHowever, to receive the maximum amount of appropriationsfrom the federal government, the counties musthave a dedicated funding source for transit improvements,in addition to working together as a region. <strong>Miami</strong>-Dade<strong>is</strong> the only county with a dedicated source oftransit funding, a one-half cent sales tax passed by votersin 2002. In 2004, the tax ra<strong>is</strong>ed $151 million and <strong>is</strong>anticipated to generate $160 million in 2005, with a fivepercent annual increase. When supplemented with stateand federal resources, funding <strong>is</strong> expected to total $503million in 2005. Broward and Palm Beach counties lackdedicated funding sources, leaving them ineligible formillions of dollars of federal matching funds. 54Broward County’s business leaders are lobbying for aone-cent sales tax referendum on the November 2006ballot to fund transit improvements. The SFRTA <strong>is</strong> proposingto the <strong>Florida</strong> Leg<strong>is</strong>lature the creation of regionaldedicated funding. According to a study by the <strong>South</strong><strong>Florida</strong> Regional Planning Council, a one-cent sales tax <strong>is</strong>the best alternative for ra<strong>is</strong>ing adequate funds, with theadded benefit of shifting a portion of the cost to millionsof <strong>South</strong> <strong>Florida</strong> tour<strong>is</strong>ts who use and benefit from theregion’s transportation system. Th<strong>is</strong> would make <strong>South</strong><strong>Florida</strong> eligible for additional transportation fundingfrom the federal government. 55In addition, the <strong>South</strong>east <strong>Florida</strong> Transportation Council,composed of the core-county MPOs, was created inJanuary 2006. It <strong>is</strong> lobbying state lawmakers to approve atri-county dedicated source of funding for improvementsto highways, airports, and seaports. These improvementswould be funded through <strong>Florida</strong>’s TransportationRegional Incentive Program, which requires 50 percentmatching funds from the counties. 56The price of addressing regional transportation needs <strong>is</strong>often beyond the reach of individual counties, requiringregional cooperation to leverage the maximum federalfunding. In 2003, business and government leaders from<strong>Miami</strong>-Dade, Broward, and Palm Beach collaborated tocreate the <strong>South</strong> <strong>Florida</strong> Regional Transportation Authority(SFRTA). Its seeks to develop a seamless masstransit system spanning the three counties. It <strong>is</strong> currentlyinvolved in a project to double-track Tri-Rail, reducingheadways between trains from one hour to 20 minutesin 2006 and serving 10.2 million riders annually by 2015.Extension into the northern counties of the region <strong>is</strong> alsobeing evaluated. 5335
WHERE IS SOUTH FLORIDA HEADING ?SPOTLIGHT ON THE HURRICANESSeven of the ten most expensive hurricanes in U.S. h<strong>is</strong>tory occurred between August 2004 and October 2005, andall seven affected <strong>Florida</strong>. Hurricanes Charley, Frances, Ivan, and Jeanne swept through <strong>Florida</strong> in 2004, resulting inmore than two million insurance claims for damages exceeding$22 billion, $2 billion more than Hurricane Andrew 12 years earlier.57 In 2005, Denn<strong>is</strong>, Katrina, Rita, and Wilma passed through<strong>Florida</strong>. Wilma was the most destructive of the three for <strong>Florida</strong>,costing over $7 billion in insured damages statewide. Though asubstantial amount of damage, it <strong>is</strong> not near the damage an extremehurricane could cost the state, or even the region. <strong>South</strong><strong>Florida</strong> <strong>is</strong> particularly susceptible to hurricane impacts. It <strong>is</strong> alow-lying region where, as of 2000, more than one million peoplelived in flood-prone areas and nearly 900,000 lived in Category 1hurricane surge zones. 58 <strong>Miami</strong>-Fort Lauderdale was ranked theworst place in the nation for an extreme hurricane to strike, withthe potential for $61.3 billion in insurance losses. 59 Experts estimatethat “if no other changes are made, and growth continues,a <strong>South</strong> <strong>Florida</strong> hurricane in 2020 might wreak physical damagesand economic losses totaling $500 billion.” 60 Responses to hurricanesdemonstrate <strong>South</strong> <strong>Florida</strong>’s exposure r<strong>is</strong>k and capacityfor resilience. Since Hurricane Andrew, building codes and otherregulatory policy have required tougher construction standardsto help overcome some of the region’s vulnerability.The <strong>South</strong> <strong>Florida</strong> CoastlineHurricanes Frances and Jeanne made landfall in <strong>South</strong> <strong>Florida</strong>, within one mile of each other, significantly impactingbeaches, foliage, and structures in Palm Beach, Martin, St. Lucie, and Indian River counties, with Broward and<strong>Miami</strong>-Dade affected to a lesser extent. Hurricane-related beach restoration cost $54 million in the region. Thegreatest expenses were in Palm Beach and Indian River counties. 61 Beach damage assessments are not yet availablefor Hurricane Wilma, which largely affected Broward and Palm Beach counties. Furthermore, th<strong>is</strong> may not be thelast of the hurricane damage. If h<strong>is</strong>torical patterns pers<strong>is</strong>t, more intense storms will affect the area over the next 20to 30 years. 62Ten Most Costly Hurricanes in U.S. H<strong>is</strong>toryResidential DamageNearly one million households statewide, including home-ownersand renters, applied for FEMA Housing Ass<strong>is</strong>tance as a resultof hurricane damage in 2004. About 115,000 home-ownerhouseholds 63 received FEMA ass<strong>is</strong>tance for structural damage,a quarter of them in <strong>South</strong> <strong>Florida</strong>. 64 Hardest hit were St. Lucieand Indian River counties, where nearly ten percent of homessuffered damage after hurricanes Frances and Jeanne. 65 Thestring of <strong>is</strong>lands along the east coast <strong>is</strong> especially vulnerable.The Treasure Coast barrier <strong>is</strong>lands alone sustained substantialdamage to 459 structures. 66 In 2005, Hurricane Wilma d<strong>is</strong>placedthousands of low- and moderate-income residents when 13,000units in Broward and <strong>Miami</strong>-Dade counties were declared uninhabitable.67 Governor Bush has recommended that $302 millionbe appropriated for hurricane housing recovery programs. 68Billions$40$35$30$25$20$15$10$5$0Georges Frances1998 2004Jeanne2004Rita2005Hugo1989Ivan2004Wilma2005Charley2004Andrew1992Katrina200536
CHARTING THE COURSEFLORIDA REGIONAL HIGHLIGHTS<strong>Florida</strong>’s metropolitan areas share the impact of development resulting from a spiraling population. Therefore, it <strong>is</strong> notsurpr<strong>is</strong>ing that they share many policy concerns, including concerns over water availability, lack of affordable workforcehousing, and increasing traffic congestion. <strong>Florida</strong>’s urban areas have also faced the devastation of hurricanes inthe recent past, as evidenced by coastal erosion of beaches around the state.WATER REUSE<strong>South</strong> <strong>Florida</strong>’s core counties compare unfavorably to most of the major metropolitan counties of other regions in waterreuse. Unfortunately, the two most populous counties in the state, <strong>Miami</strong>-Dade and Broward, do not use alternativewater supplies, nor do they reuse a sufficient amount of wastewater. Palm Beach County and the northern countiesuse more reclaimed water, much of which <strong>is</strong> used for landscape irrigation. Per capita water reuse in <strong>Miami</strong>-Dade andBroward counties <strong>is</strong> below 10 gallons per person per day, compared to about 20 or more across the state’s metropolitancounties. Per capita reuse reaches over 80 gallons per day per person in Central <strong>Florida</strong>’s Orange County.Millions of Gallons per DayWater Reuse in <strong>Florida</strong> Regions20049080706050403020100<strong>Miami</strong>-Dade Broward Palm Beach Orange Hillsborough Duval EscambiaGallons per Day per PersonTotal Water ReusePer Capita Water ReuseBEACH EROSIONBeaches are a vital part of the tour<strong>is</strong>t economy throughoutthe state. Beach tour<strong>is</strong>m has an annual economic impact of$40 billion and 536,000 jobs. In 2004, almost 40 percent ofdomestic v<strong>is</strong>itors participated in beach activities. Yet nearly60 percent of the state’s 825 miles of beaches were erodedin 2004, and, in part due to hurricanes, 45 percent werecritically eroded—threatened with loss of land for development,recreation, wildlife habitat, and cultural resources.37
WHERE IS SOUTH FLORIDA HEADING ?HOUSING AFFORDABILITYWhile the prices of ex<strong>is</strong>ting single-family homes have increased all over <strong>Florida</strong> over the past decade, they have skyrocketedin <strong>South</strong> <strong>Florida</strong>’s MSAs. In the decade from 1994-2004, <strong>South</strong> <strong>Florida</strong>’s median price increased between 155and 170 percent, compared to 112 percent in Tampa Bay MSA, 90 percent in Jacksonville MSA, 88 percent in OrlandoMSA, and 71 percent in Pensacola MSA. Equally dramatic, the median home price for <strong>South</strong> <strong>Florida</strong> exceeds that of<strong>Florida</strong>’s other MSAs. Most important, <strong>South</strong> <strong>Florida</strong> suffers from a larger housing affordability gap—the d<strong>is</strong>paritybetween the income needed to afford a home and that earned by workers in traditional occupations such as schoolteachers. There were, however, affordability gaps for elementary school teachers across the state’s major MSAs in2005. Not surpr<strong>is</strong>ingly, there are far fewer homes affordable for median income households in <strong>South</strong> <strong>Florida</strong> comparedto housing markets in Orlando, Pensacola, Jacksonville or Tampa. Fewer than a third of homes in <strong>South</strong> <strong>Florida</strong> areaffordable for median income households compared to other regions. 69Thousands of Dollars32027022017012070Median Price of Ex<strong>is</strong>ting Single Family Homesin <strong>Florida</strong>’s MSAs1994-20041994 1995 1996 1997 1998 1999 2000 2001 2002 2003 2004<strong>Miami</strong>OrlandoFort LauderdaleTampa- St. Petersburg-ClearwaterWest Palm Beach-Boca Raton JacksonvilleFort Pierce-Port St. LuciePensacolaHousing Affordability for Elementary School Teachersin <strong>Florida</strong>’s MSAs2005$90,000$80,000$70,000$60,000$50,000$40,000$30,000$20,000$10,000$0<strong>Miami</strong>-Dade West Palm Beach Orlando JacksonvilleFort Lauderdale Fort Pierce Tampa PensacolaIncome Needed to Afford Median Priced HomeElementary School Teacher’s IncomeTRAFFIC CONGESTIONTraffic congestion has worsened in all of <strong>Florida</strong>’s MSAs.In 2003, Orlando reached 55 hours of annual traffic delayper peak traveler. <strong>Miami</strong> and Tampa were not far behind,with 51 and 46 hours of annual delay, respectively. Delaysin Jacksonville, on par with <strong>Miami</strong> 20 years prior, havenot increased as steeply, nor have they in Pensacola. Thecost of congestion in the forms of time and money hasincreased around the state as well. In 2003, it was highestin the Orlando MSA at $935 per peak traveler. The<strong>Miami</strong> MSA and Tampa MSA followed close behind withcongestion costs of $869 and $772, respectively, per peaktraveler. The Jacksonville MSA came in at $573 and thePensacola MSA at $300.person-hours6050403020100Annual Traffic Delay per Peak Travelerin <strong>Florida</strong>'s Regions1983-20031983 1988 1993 1998 2003<strong>Miami</strong> MSAOrlando MSATampa- St. Petersburg MSAJacksonville MSAPensacola MSA38
CHARTING THE COURSECOMMENTARY FROM THE EXPERTSKen Ammon, Deputy ExecutiveDirector, <strong>South</strong> <strong>Florida</strong> WaterManagement D<strong>is</strong>trictPast 20 years. The construction of the central and south<strong>Florida</strong> system was set up and did exactly what it wassupposed to do--that was to provide for safe flood control,future development (agricultural and urban), and tosupply needs of that growth. It also had what we alwaystermed unintended consequences, a light term when youconsider the immense unintended consequences causedby that system. No one knew the significant impacts ofnot only the water supply but primarily the flood controlworks, which reduced water levels up to six feet alongthe coast, resulting in immense amounts of seepage comingout of the Everglades. The ground and surface waterthat used to be on the east coast development side waslost. The environmental impacts were not clearly recognizeduntil the early to mid ‘90s. We needed to reverse thetrend, but first you have to identify the problem, then putin place potential projects (structural or non-structural)to try to correct or minimize the environmental impact.Next 20 years. Since WRDA 2000, the d<strong>is</strong>trict has beenworking on the planning aspects to receive federal approvalto construct projects to reverse the impacts andprovide for future growth out to 2050. The water use thatwas projected to be used in 2050 in some areas of thelower east coast has already been exceeded. There <strong>is</strong> alimit to h<strong>is</strong>toric, inexpensive sources of water for futuregrowth. We need to shift growth off the surficial systembecause that <strong>is</strong> in direct competition with the naturalsystems in the Everglades. Two primary directions that<strong>South</strong> <strong>Florida</strong> utilities need to consider are reverse osmos<strong>is</strong>and the <strong>Florida</strong>n Aquifer. CERP will provide somewater for future growth, but it <strong>is</strong> dependent on projectsgetting planned, designed, certified, and constructed sothat the water <strong>is</strong> available before we can ever permit it.If counties aren’t going to limit future growth, whichmost have been hesitant to do, then growth outpacesthe planned projections, and the water use <strong>is</strong> earlier. Ido not see the growth tapering off. There are very fewlocal counties who are not embracing a full-scale reuseprogram and a significant alternative source program,but the two largest counties need to step up, and we willhelp them. Martin County has a very aggressive alternativewater supply program; they understand their futuregrowth <strong>is</strong> being supplied by reuse or deep water aquifer.Broward and <strong>Miami</strong>-Dade counties have lagged h<strong>is</strong>toricallyin the entire d<strong>is</strong>trict from a wastewater reuse perspective,and they have also res<strong>is</strong>ted, for whatever reason,the more expensive alternative sources.What needs to be done. Enough <strong>is</strong> enough---we have thefunding, we have the alternatives. A train wreck <strong>is</strong> coming---whenthere will be no more water permitting fromthe Everglades. It <strong>is</strong> just a matter of recognizing thatth<strong>is</strong> <strong>is</strong> the direction for sustainability. Landscape architectinstitutes and big developers have had significantd<strong>is</strong>cussion on future water supply, sustainability of resources,and water preservation <strong>is</strong>sues. In the future,th<strong>is</strong> will mean that we do not have a lot of flexibility topull water out of the natural systems to sustain growth.That <strong>is</strong> where other projects and alternative sources willhave to provide it. There <strong>is</strong> a need for significant regionalsolutions for water supply in the area (<strong>Miami</strong>-Dade andBroward), and a desalinization plan <strong>is</strong> a high probabilityfor <strong>Miami</strong>-Dade and Fort Lauderdale’s needs, plus an enhancedwater conservation plan as well. There <strong>is</strong> politicalwill at the state level, but not yet at the local level.Peter Spyke, OwnerArapaho Citrus Management, Inc.Past 20 years. Urbanization and land speculation havebeen the biggest changes to the agriculture industryin <strong>South</strong> <strong>Florida</strong>. The value of land as agriculture hasbeen dimin<strong>is</strong>hing because commodity prices have beensteadily falling, while the value of land for developmenthas been increasing. It’s affected all of the counties, allthe way up to Indian River. Global competition <strong>is</strong> one importantfactor in falling commodity prices. Another factor<strong>is</strong> consolidation of buyers. The third factor <strong>is</strong> consolidationof growers. Hurricanes generally have short-termimpacts, but what <strong>is</strong> happening now <strong>is</strong> that hurricane orcanker damage <strong>is</strong> layered on top of falling commodityvalues. If you’re a grower, you can replant and take 15 or20 years to get your capital back, or you can sell the landfor ten times more than what it’s worth as a farm. A lot ofpeople are choosing to sell instead of replant.Next 20 years. I think there’s a role for agriculture in ourstate, and I think that other people see it as well. If Browardand Dade have done anything, they have pointed39
WHERE IS SOUTH FLORIDA HEADING ?out to us clearly what’s going to happen if we don’t makedifferent choices---there <strong>is</strong> simply no open space. We’reall trying to figure out how to keep that from happeningin the Treasure Coast. Agricultural lands have a significantrole to play in planning land settlements to accompl<strong>is</strong>hdifferent patterns. Instead of just paving over everything,you would cluster growth into compact urbanareas and preserve in perpetuity significant percentagesof countryside around those urban areas. There’s noquestion that there are going to be competing uses forland, which will affect the long-term viability of agriculture.For example, Scripps coming to <strong>South</strong> <strong>Florida</strong> <strong>is</strong>going to result in a lot of economic activity; it’s going togenerate a pretty robust real estate market. If there’s lessand less agriculture in the areas, it’s going to be harderto keep farming, so our land value for agriculture <strong>is</strong> goingto go down. The more demand there <strong>is</strong> for land, for housing,for Scripps, the higher that value <strong>is</strong> going to be.What needs to be done. The most important thing thatneeds to happen <strong>is</strong> to figure out how to conduct a stableand successful transfer of development rights (TDR)program. Right now I need to ra<strong>is</strong>e capital because I gotwiped out by canker during the hurricane. My land <strong>is</strong> mynumber one residual source of capital value, but the onlyway that I can ra<strong>is</strong>e money from it <strong>is</strong> to sell it. With a TDR,I can sell my development rights to somebody who wantsto develop in an area deemed favorable for development.My land will be stripped of those rights, and I keep theland for farming. The other part of the equation <strong>is</strong> thatthe land has to make money. A combination of those twothings, the profits from agriculture and the TDR, has tobe equal to or greater than the land value from the alternativeuse in the long term. The counties are responsiblefor bringing about these changes. The state couldalso encourage them by providing technical ass<strong>is</strong>tanceand perhaps funding and other things that would allowa county to adopt TDR programs. It’s going to help thatagriculture <strong>is</strong> going to evolve into a form that fits in an urbanenvironment as opposed to being a commodity type,production machine. I’m optim<strong>is</strong>tic about it. I think thatth<strong>is</strong> <strong>is</strong> going to be very exciting, and to the people whofigure out how to do it, it’s going to be profitable.Michael Busha, Executive DirectorTreasure Coast RegionalPlanning CouncilPast 20 years. The pattern of strips malls, sprawling subdiv<strong>is</strong>ions,and parochial<strong>is</strong>m has shaped the region. I believethese forces have not only irreversibly damaged thenatural environment, the political landscape, and socialfabric of the region, but also our ability to act regionallyand compete at the national and international level.Next 20 years. The next few years should yield a fewsmall victories. We will continue to see more communitiesacting regionally and adopting new urban<strong>is</strong>m, but 10-15 years out, I think that we’re going to see a lot moreprogress. The old model, the car-dependent model, <strong>is</strong> goingto become less normal because of increasing energy,construction, and transportation costs. In the 15-20 yearsafter, I believe the old model <strong>is</strong> replaced in response tothese global <strong>is</strong>sues. As transportation-related mobilitydeclines and our capacity to absorb energy costs dimin<strong>is</strong>hes,we localize economies and regional<strong>is</strong>m even more.Th<strong>is</strong> <strong>is</strong> why I don’t think the power of local governments<strong>is</strong> going to dimin<strong>is</strong>h in any significant way. At the regionallevel, we’ll have strategic interventions to do specificthings that strengthen local economies and sustainability.We do get better at working together. But we nevermove away from the predominant model of control bylocal towns and cities. I believe each locality will need tobecome more sustainable locally, but still engage in beneficialregional activities that help mitigate the negativeeffect those <strong>is</strong>sues will have on our economy.What needs to be done. It will be essential to have effectivestate and local leadership in overhauling how we practicegrowth management. No more leg<strong>is</strong>lative band-aids. Realchange needs to happen. There’s no glory in doing theright thing. <strong>Where</strong> the glory <strong>is</strong>—it’s in quick fixes andgetting a little more local money or regulatory “wiggleroom”that temporarily improves things for a few. Education,increasing wages, and place-making are the keys.We need a different kind of v<strong>is</strong>ion, along with leg<strong>is</strong>lation,that institutionalizes the 27 principles of new urban<strong>is</strong>m inour growth management system. There are a lot of counterfeitand weak hybrid systems being proposed—a little“v<strong>is</strong>ioning,” a lot of sprawl, sprinkled with a little newtown, and a dash of lifestyle center. Th<strong>is</strong> <strong>is</strong> not the recipefor turning things around. I think applying a strong, authenticsystem based on the principles of new urban<strong>is</strong>m<strong>is</strong> the only approach to addressing the root cause of allthe major planning, transportation, environmental, f<strong>is</strong>cal,and political <strong>is</strong>sues, which go unresolved. No one hasbeen able to show me any system that works better. I’mcautiously optim<strong>is</strong>tic for the long term. In the short term,however, I believe we will look back on the last ten yearsas a decade of d<strong>is</strong>appointment when we had the collectivepower to reverse the damaging trend of sprawl and parochial<strong>is</strong>mbut didn’t seize the opportunity for change.40
Prosperity<strong>Florida</strong>, California, and Texas will account for nearly one-third of the nation’s job growth of 50 million jobsover the next 20 years. 1 The good news <strong>is</strong> that <strong>South</strong> <strong>Florida</strong> <strong>is</strong> leading the nation in creating jobs andreaching full employment and <strong>is</strong> projected to continue as the state’s largest single job market. The badnews <strong>is</strong> that growth <strong>is</strong> fueled by low-wage jobs. Projections indicate that the greatest employment growth by2012 will continue to be low-wage jobs. Some higher paying jobs, e.g., teachers and reg<strong>is</strong>tered nurses, will alsobe growth areas. Job growth <strong>is</strong> dominated by four employment sectors—trade, transportation, and utilities; educationand health services; professional and business services; and le<strong>is</strong>ure and hospitality. Unfortunately, threeof these sectors are low paying, making wages problematic for many <strong>South</strong> <strong>Florida</strong> workers.Trade and tour<strong>is</strong>m continue to be primary economic drivers in the region. <strong>South</strong> <strong>Florida</strong> <strong>is</strong> a major tour<strong>is</strong>t destination.It <strong>is</strong> the “cru<strong>is</strong>e capital of the world” and a hot spot for megayachts. It <strong>is</strong> also a major center for internationaltrade with the Latin Hem<strong>is</strong>phere. <strong>Miami</strong> International Airport ranks first among the nation’s airportsin international freight and third in international passengers. Passenger traffic at Fort Lauderdale-HollywoodInternational Airport has been significantly boosted by the addition of five more low-cost carriers since 1996,which now handle almost 50 percent of its passengers. 2 While trade and tour<strong>is</strong>m are welcome and vital componentsof the economy, the region must diversify and increase high-wage jobs in order to remain attractive andcompetitive, while maintaining a good quality of life.Today, the core counties remain the job center of the region. However, following the pattern of population growth,the trend for locations of new jobs shows a red<strong>is</strong>tribution farther north. For example, in 1994, <strong>Miami</strong>-Dade held43 percent of the region’s jobs, while a decade later it had only 38 percent.41
PROSPERITYJOB GROWTH• Over the past decade, the region’s economy has been producing jobs at a faster ratethan the nation but at a slower pace than the state. From 2003-2005, it has outpaced thestate as well.• The region’s job growth has outpaced its labor force growth over the past decade,resulting in a cons<strong>is</strong>tent decrease in the official unemployment rate. In 2004, the unemploymentrate in Broward County was on par with the state, while it was higher in<strong>Miami</strong>-Dade and Palm Beach counties. Unemployment rates were highest in St. Lucieand Indian River counties.WAGE GROWTH• Along with the challenge of growing new jobs to keep pace with population increases,wages must increase to meet escalating living expenses. For most households, thesingle greatest expense <strong>is</strong> housing. In the core counties of the region, growth of thehousing wage, that <strong>is</strong>, the wage needed to afford rent for a two-bedroom apartment,was about double the growth in average wages from 2000 to 2003. So even as wageearnings r<strong>is</strong>e, their relative value <strong>is</strong> declining. In the Treasure Coast, average wagegrowth outpaced housing wage growth, although housing <strong>is</strong> still out of range for manyresidents.• Although the region continues its robust growth in volume of jobs, many of them arenot quality jobs. <strong>Florida</strong> ranked 15th in job opportunities in the Work EnvironmentIndex, but only 49th in job quality, based on wages and the proportion of workers receivinghealth and retirement benefits. 3COMPETITIVENESS• The region’s greatest prom<strong>is</strong>e for future economic competitiveness lies in industryclusters of life sciences (health and biological research), aviation and aerospace, andfinancial and professional services. Of these competitive clusters, <strong>South</strong> <strong>Florida</strong> <strong>is</strong>strong in the life sciences, very strong in aviation, but weak in the financial servicessector.• Several planned developments in biotechnolocy—such as the Scripps Research Institutein Jupiter, the Burnham Institute proposed for St. Lucie County, the new AcademicalVillage planned at Nova <strong>South</strong>eastern University, and the new biotechnologyvillage planned by the University of <strong>Miami</strong>/Jackson Memorial Hospital—may improvefuture competitiveness in the industry.• Free trade agreements (e.g., the Free Trade Agreement of the Americas and the DominicanRepublic-Central American Free Trade Agreement) could enhance <strong>South</strong><strong>Florida</strong>’s position as a major financial and business hub.42
CHARTING THE COURSEWORKFORCEEmployment and Job GrowthEmployment growth <strong>is</strong> a basic measure of the economy’shealth. The state increased its jobs by 23 percent, reaching8 million from 1994 to 2004, compared to a nationalincrease of 13 percent. Over th<strong>is</strong> same period, <strong>South</strong><strong>Florida</strong>’s job growth rate of 21 percent lagged the statebut exceeded the national rate. However, from 2000 to2004, the rate of job growth in the region exceeded bothstate and national rates. <strong>South</strong> <strong>Florida</strong>’s employment <strong>is</strong>expected to increase 15 percent by 2012, reaching 3.2million. <strong>Florida</strong>’s employment will increase 16 percent,reaching 9.5 million jobs. 44.0%3.5%3.0%2.5%2.0%1.5%1.0%0.5%0.0%-0.5%National, State, and RegionalAnnual Job Growth Rates1994-2004-1.0%1993-94 1995-96 1997-98 1999-00 2001-02 2003-041994-95 1996-97 1998-99 2000-01 2002-03<strong>South</strong> <strong>Florida</strong> <strong>Florida</strong> United StatesThe region’s core counties provide about one-third of thestate’s jobs and over 90 percent of the region’s jobs. <strong>Miami</strong>-Dadeaccounts for the largest number of jobs, trailedby Broward and Palm Beach, but its share decreasedfrom 1994 to 2004. Rates of job growth have tracked populationgrowth, increasing more rapidly north of <strong>Miami</strong>-Dade County. Between 1994 and 2004, Broward and PalmBeach counties each increased their share of the region’sjobs by two percent, while St. Lucie gained one percent.Five percent was lost by <strong>Miami</strong>-Dade County. 5Labor ForceThe labor force <strong>is</strong> the total of employed workers and unemployedworkers who file for unemployment benefits.It does not include people who have stopped looking forwork or have stopped collecting unemployment benefits.From 1994 to 2004, <strong>Florida</strong>’s labor force grew 21 percentreaching 8.4 million, compared to the national increaseof 13 percent. The regional labor force grew 17 percentfrom 1994 to 2004, reaching 2.9 million.Mirroring employment, the core counties account forabout one-third of the state’s labor force and over 90percent of the region’s labor force. <strong>Miami</strong>-Dade Countyhas the largest labor force in the region, as well as in thestate, followed by Broward and Palm Beach. However, itlost five percent of the regional labor force over the pastdecade due to higher growth rates in the northern counties.From 1994 to 2004, Broward County gained one percentof the labor force, Palm Beach gained two and St.Lucie gained one percent. Monroe, Martin, and IndianRiver have remained constant, each with two percent. 6Thousands of Jobs1,2001,0008006004002000<strong>South</strong> <strong>Florida</strong> Job Growth by County1994-20041994 1995 1996 1997 1998 1999 2000 2001 2002 2003 2004Thousands of Jobs1201008060402001994 1995 1996 1997 1998 1999 2000 2001 2002 2003 2004Focus on Treasure CoastMonroe <strong>Miami</strong>-Dade Broward Palm Beach Martin St. Lucie Indian River43
WHERE IS SOUTH FLORIDA HEADING?National, State, and RegionalAnnual Labor Force Growth Rates1994-20044.5%4.0%3.5%3.0%2.5%2.0%1.5%1.0%0.5%0.0%1994-951995-961996-971997-981998-991999-002000-012001-022002-032003-04<strong>South</strong> <strong>Florida</strong> <strong>Florida</strong> United StatesUnemployment<strong>South</strong> <strong>Florida</strong>’s unemployment rate has been higher thanthe state and the nation every year since 1994, except in2004, when it fell below the national rate. Over th<strong>is</strong> tenyear time period, the rate of employment growth (21%)has outpaced the rate of labor force growth (17%). Therefore,the official unemployment rate has decreased. 7Within <strong>South</strong> <strong>Florida</strong>, unemployment rates vary by county,though most are trending downward and have becomeincreasingly comparable over the past decade. In 2004,Monroe County continued to have the lowest unemploymentrate, while St. Lucie and Indian River counties hadthe highest rates. Among the region’s core counties,<strong>Miami</strong>-Dade had the highest unemployment rate, PalmBeach came in below the national rate at 5.1 percent, andBroward matched the state rate at 4.8 percent. 8 In 2004,Annual Labor Force and Job GrowthRates in <strong>South</strong> <strong>Florida</strong>1994-20044.5%4.0%3.5%3.0%2.5%2.0%1.5%1.0%0.5%0.0%-0.5%1993-94 1995-96 1997-98 1999-00 2001-02 2003-041994-95 1996-97 1998-99 2000-01 2002-03Labor ForceJobsthe Milken Institute ranked West Palm Beach and FortLauderdale among the top ten performing cities basedon their ability to create and sustain job growth. 9<strong>South</strong> <strong>Florida</strong>’s declining unemployment rates give theimpression that the region’s economy and job growth arein good health. However, according to Dr. Bruce N<strong>is</strong>senof <strong>Florida</strong> International University’s Center for Labor Researchand Studies, the true picture emerges when comparingjob growth to population growth. N<strong>is</strong>sen believesthat “job growth lagging behind population growth <strong>is</strong> ahighly undesirable trend.” 10 But th<strong>is</strong> <strong>is</strong> indeed what hasoccurred in <strong>Florida</strong> as the state’s working age populationgrew 8.6 percent, while employment only grew 4.9 percent,leaving a 267,000 job deficit from the recession of2001 to December of 2004. 11 The gap between jobs andworking age population <strong>is</strong> not reflected in unemploymentrates because they do not account for the chronically unemployedwho have dropped out of the labor force andno longer file for unemployment. Nor do they account for20%18%16%14%12%10%<strong>South</strong> <strong>Florida</strong> Unemployment Rates by County1990-20048%6%4%2%0%1990 1991 19921993 1994 1995 1996 1997 1998 1999 2000 2001 2002 2003 2004Monroe<strong>Miami</strong>-DadeBrowardPalm BeachMartinSt. LucieIndian River<strong>Florida</strong>44
CHARTING THE COURSEthe percentage of the population that has a graduate orprofessional degree. Broward County was just below thenational rate. 13 The region <strong>is</strong> also similar to the state andnation with respect to persons with an associate degree,with an additional seven to eight percent of residents age25 and older holding th<strong>is</strong> degree. 14INCOMEpeople who work in the informal economy, including undocumentedworkers and others who do not report theiremployment. 12Workforce EducationReducing the gap between the population and job growth<strong>is</strong> not enough. The region’s economic health requiresmore high-wage jobs. The fastest growing part of theU.S. economy <strong>is</strong> the service sector. Th<strong>is</strong> sector includeslow-wage jobs such as those found in the hospitality industry,which have been d<strong>is</strong>proportionately representedin the region’s job growth. But it also includes high-wagejobs requiring post-secondary, vocational, or higher education.In 2004, <strong>Miami</strong>-Dade County was on par with the statewith about a quarter of its population age 25 and olderholding a bachelor’s degree. Broward and Palm Beachcounties slightly surpassed the state and the nation.However, all three core counties surpassed the state inWagesA good indicator of job quality, economic vitality, andthe capacity of residents to afford housing, transportation,and other necessities of a good quality of life <strong>is</strong> theaverage annual wage, calculated by dividing total wagesby employment. In 2003, average annual wages in thepopulous core counties compared favorably to the state’saverage annual wage but were slightly lower than that ofthe nation. Monroe, Martin, St. Lucie, and Indian Rivercounties all fell well below the state and the nation. 15From 1993 to 2003, wage growth in <strong>South</strong> <strong>Florida</strong> countieswas greatest in the southern counties. However, theregion as a whole lagged behind the nation and state inwage growth. In the more recent period, from 2000 to2003, wage growth in Monroe, <strong>Miami</strong>-Dade, Martin, andSt. Lucie has exceeded that of the state and the nation. St.Lucie County’s growth surpassed the rest of <strong>South</strong> <strong>Florida</strong>.Wage growth in Broward and Indian River countiessurpassed the state, but remained lower than the nation. 17While average wages in the core counties are comparableto the nation and higher than the state, a wage gapProportion of Population Age 25 Years and Olderwith a Bachelor’s Degree or Higher2000-200434%32%30%28%26%24%22%20%2000 2001 2002 2003 2004<strong>Miami</strong>-DadeBrowardPalm BeachUnited States<strong>Florida</strong>$38,000$36,000$34,000$32,000$30,000$28,000$26,000$24,000Average Annual Wage per Job2000-20032000 2001 2002 2003Monroe<strong>Miami</strong>-DadeBrowardPalm BeachMartinSt. LucieIndian River<strong>Florida</strong>United States45
WHERE IS SOUTH FLORIDA HEADING?remains. Seventy-five percent of workers region-wideearn less than average wage. Among the small percentageof workers who make the average wage or more,some professions, e.g., chief executives, pharmac<strong>is</strong>ts,and architects, are paid higher wages than their counterpartsacross the nation. In lower-wage professions, suchas construction, maintenance, and cleaning, workers arepaid lower wages than their counterparts nationwide. 18In addition, wage growth can only provide a good qualityof life if it keeps up with the cost of living. One way to assessthat <strong>is</strong> by comparing wage growth to the increase inthe housing wage, as calculated by the National Low IncomeHousing Coalition. The housing wage <strong>is</strong> the amountthat a full-time worker (40 hours per week) must earn toafford a two-bedroom unit at the area’s fair market rent.A unit <strong>is</strong> considered affordable if it costs no more than 30percent of the renter’s income.In the core counties, as well as in the state, average annualwages have not kept pace with the housing wage.Wages increased between 2.2 and 3.3 percent a year from2000 to 2003, while the housing wage increased between4.1 and 6.6 percent. In Monroe County, as well as in thenorthern counties, annual wages per job have grown fasterthan the housing wage. 19 However, in St. Lucie County,which <strong>is</strong> in the midst of a population and housing boom,the prices of single-family homes have been increasing ata fast rate since 2003, a trend that may affect both ownerand renter markets.7%6%Average Annual Housing Wage Growthvs. Average Annual Wage Growth2000-20032003 per capita income of $33,269 was 11 percent higherthan the state average of $30,098 and 6 percent higherthan the national average of $31,472. Within the region,<strong>Miami</strong>-Dade and St. Lucie counties were below the stateand national per capita income levels, while Monroe, Broward,Palm Beach, Martin, and Indian River all exceededit. Martin and Palm Beach counties led both the region andthe state in per capita income, reflecting the large amountof non-wage income (investment returns) there. 20Although the region includes <strong>Florida</strong>’s two wealthiestcounties (Martin and Palm Beach), its per capita incomegrowth of 38 percent was less than the state growth of 43percent and the national growth of 47 percent from 1993to 2003. 21 Within <strong>South</strong> <strong>Florida</strong>, the core counties laggedbehind the state and the nation in per capita growth from1993 to 2003. St. Lucie and Martin counties both laggedbehind the state as well. Monroe and Indian River countiesled the region and surpassed the state. 22Regional, State, and National Per Capita Income1993-2003$50,000$45,000$40,000$35,000$30,000$25,000$20,000$15,0001993 1994 1995 1996 1997 1998 1999 2000 2001 2002 2003Monroe<strong>Miami</strong>-DadeBrowardPalm BeachMartinSt. LucieIndian River<strong>Florida</strong>United States5%4%3%2%Average Annual per Capita Income Growth1993-20031%0%Monroe <strong>Miami</strong>-Dade Broward Palm Beach Martin St. Lucie Indian River <strong>Florida</strong>Housing Wage GrowthWage per Job Growth6%5%4%United States<strong>Florida</strong>Per Capita IncomePer capita income <strong>is</strong> the total of all income, including wages,rents, investment returns, and government transferpayments, divided by the total population. <strong>South</strong> <strong>Florida</strong>’s3%2%1%0%Monroe <strong>Miami</strong>-Dade Broward Palm Beach Martin St. Lucie Indian River46
CHARTING THE COURSEComponents of Personal Income2003Indian RiverSt. LucieMartinPalm BeachBroward<strong>Miami</strong>-DadeMonroe<strong>Florida</strong>United StatesSources of IncomeTotal personal income <strong>is</strong> the income of individuals fromall sources, including earned income (wages), unearnedincome (dividends, interest, and rent), and transfer paymentsfrom the government (i.e., social security and welfarepayments). It indicates the size of an economy, aswell as overall prosperity, economic growth, and generalpurchasing power. <strong>South</strong> <strong>Florida</strong>’s total personal incomegrew 69 percent from $114 billion in 1993 to $193 billionin 2003 and accounted for the greatest share, 38 percent,of the state’s total personal income. Growth rates arehighest in the northern part of the region.As a retirement destination, the State of <strong>Florida</strong> has ahigher percentage of unearned income than the nation asa whole, indicating that personal wealth <strong>is</strong> not tied to locallyearned wages. In 2003, unearned income accountedfor 23 percent of <strong>Florida</strong>’s personal income, compared to16 percent nationally. Transfer payments accounted for17 percent, compared to 15 percent nationally. Much of<strong>South</strong> <strong>Florida</strong> has a higher percentage of unearned incomethan the state. The total personal income of thewealthier counties (Monroe, Palm Beach, Martin, andIndian River) <strong>is</strong> composed of 37 to 48 percent unearnedincome, while unearned income makes up only 18 to 23percent in <strong>Miami</strong>-Dade, Broward, and St. Lucie, wherewages are a more significant source of personal income.<strong>Miami</strong>-Dade and St. Lucie have the highest proportionof transfer payments in the region, cons<strong>is</strong>tent with theirhigher poverty and unemployment rates.The region’s income composition has experienced minorchanges in the past decade. The most significant changesfrom 1993 to 2003 were in Broward and Palm Beachcounties, where unearned income decreased 5 percentagepoints, earnings from wages increased 5 to 6 percentagepoints, and transfer payments decreased slightly. 23EMPLOYMENT SECTORSIndustry Sectors0% 20% 40% 60% 80% 100%Earnings by Place of Work Dividends, Interest, and RentTransfer PaymentsA diverse economic base helps a region withstand changesin any one sector, and a favorable balance can helpsupport the growth of quality, high-wage jobs. In 2004,<strong>South</strong> <strong>Florida</strong>’s economy was dominated by the trade,transportation, and utilities sector, which accounted for21 percent of the region’s employment. It was followedby industries in the services sectors, such as educationAverage Weekly Wages by Industry Sector andSector’s Share of <strong>South</strong> <strong>Florida</strong> JobsIndustry SectorAverageWeekly Wage% ofEmploymentFinancial Activities $800-$1150 6%Information $770-$1100 3%Manufacturing $680-$1050 4%Government $780-$1000 6%Business andProfessional$620-$870 15%ServicesConstruction $625-$780 5%Education andHealth Services$700-$740 18%Trade,Transportation, and $570-$690 21%UtilitiesOther Services $450-520 4%Natural Resourcesand Mining$410-$505 1%Le<strong>is</strong>ure andHospitality$311-$420 10%47
WHERE IS SOUTH FLORIDA HEADING?Projected Employment Growth by Sector2004-2012700,000600,000500,000400,000300,000200,000100,0000TradeTransportationand UtlitiesEducationand HealthServicesProfessionaland BusinessServicesLe<strong>is</strong>ureandHospitalityFinancialActivitiesPublic ConstructionAdmin<strong>is</strong>tration2004 2012OtherServicesManufacturingInformationNaturalResourcesand Miningand health services, professional and business services, andle<strong>is</strong>ure and hospitality. The highest paying sectors make upa smaller portion of employment in <strong>South</strong> <strong>Florida</strong>. 24The d<strong>is</strong>tribution of <strong>South</strong> <strong>Florida</strong>’s employment <strong>is</strong> expectedto remain similar by 2012. Trade, transportation,and utilities will gain employment but drop to only 20percent. Education and health services, and professionaland business services will grow the most, increasingtheir share of employment.Unfortunately, the occupations that will offer the mostnew work in the region by 2012 will be low-wage jobsthat pay between $6 and $12 an hour. These include retailsalespersons, waiters and waitresses, food preparationand service workers, and janitors and cleaners. The onlyexception among the top five occupations <strong>is</strong> reg<strong>is</strong>terednurses, who are in high demand and receive higher wagesof $22 to $27 an hour. In addition, elementary schoolteachers will be in high demand with an average pay ofabout $25 to $27 an hour. 25Occupations Projected to Gain the Most New Jobs2004-2012OccupationNew Jobs AnnuallyRetail Salespersons 5010Waiters and Waitresses 3583Food Preparation & ServingWorkers 2887Reg<strong>is</strong>tered Nurses 2711Janitors and Cleaners 2200Key Industry ClustersThe state identified six industry clusters in which <strong>Florida</strong>has h<strong>is</strong>torically shown strength and which are key to successin the new economy. 26 These industry clusters---lifesciences, aviation and aerospace, financial and professionalservices, information technology, defense, andmanufacturing---require skilled employees and pay highwages, with statewide annual average wages between$43,000 and $56,000. Four clusters have a significantpresence in <strong>South</strong> <strong>Florida</strong> and are critical for future jobgrowth.The life sciences employed 619,350 workers in <strong>Florida</strong>in 2003, eight percent of all employment. <strong>South</strong> <strong>Florida</strong>holds over a third of the jobs in th<strong>is</strong> industry cluster, comparableto its proportion of the state’s population (36%). 27Major projects, such as the new Scripps Research Institute,may generate an additional 6,500 jobs over the nextdecade and a half, as well as a projected 40,000 more highpayingjobs from industries clustered around Scripps. 28For example, the Burnham Institute, a biotechnology researchinstitute from California, <strong>is</strong> considering locatingin St. Lucie County. <strong>Miami</strong>-Dade County <strong>is</strong> also trying tofurther expand the biotechnology sector within the region.Planning <strong>is</strong> underway for a biotechnology villageconnected to the University of <strong>Miami</strong>/Jackson MemorialMedical Center. 29 In Broward County, the AcademicalVillage will house biotechnology and medical researchat the <strong>Florida</strong> Interd<strong>is</strong>ciplinary Science Center, whereNova <strong>South</strong>eastern University will partner with the UnitedStates Geological Survey, <strong>Florida</strong> Atlantic University,and the University of <strong>Florida</strong>. 30 The Research Coast Economic<strong>Development</strong> Coalition (Treasure Coast) and theiCoast (core counties) are working to attract additionalbioscience industries, as well as other research and development,science, and technology-related businesses.48
CHARTING THE COURSEThe aviation industry <strong>is</strong> very prominent in <strong>South</strong> <strong>Florida</strong>.<strong>Miami</strong> International Airport (MIA) <strong>is</strong> a major internationalgateway for both trade and passenger travel, and FortLauderdale/Hollywood International Airport (FLL) <strong>is</strong> amajor domestic hub. Altogether, <strong>South</strong> <strong>Florida</strong>’s four airports,which include Palm Beach International and KeyWest International, account for 41 percent of the state’saviation and aerospace industry, providing 33,813 of thestate’s 82,430 jobs in th<strong>is</strong> sector. FLL <strong>is</strong> Broward County’slargest employer. 31The financial and professional services industry cluster provides782,045 jobs statewide, 273,707 of which are in <strong>South</strong><strong>Florida</strong>. With 35 percent of the jobs in th<strong>is</strong> industry cluster,<strong>South</strong> <strong>Florida</strong> has a share comparable to its share of thepopulation. In information technology, <strong>South</strong> <strong>Florida</strong> <strong>is</strong> fallingbehind, holding only 25 percent of state employment. 32Creative IndustriesThere <strong>is</strong> growing recognition that in the new knowledgebasedeconomy, knowledge workers and creative industriesare integral to competitiveness in the national andglobal economies. Creative industries are those “basedon individuals with creative art skills. . . making marketableproducts, and whose economic value lies in theircultural (or intellectual) properties.” 33 The creative industriesspan many sectors and include occupations intechnology, science, medicine, arts, entertainment, information,and communication, among others.In 2005, nearly 570,000 workers in <strong>Miami</strong>-Fort Lauderdaleand West Palm Beach were employed in creativeindustries. 34 However, the concentration of knowledgeworkers and high technology industries <strong>is</strong> not favorable.Among 25 regions across the nation, the <strong>Miami</strong>-Fort LauderdaleMSA was the lowest in the number of knowledgeworkers per million people and concentrations of hightechnology industries. <strong>Miami</strong>-Fort Lauderdale rankedlow in the quality of life character<strong>is</strong>tics that attract knowledgeworkers, including environmental quality and amenities,such as outdoor recreational activities, art<strong>is</strong>tic andcultural activities, nightlife, and youth-oriented amenities.<strong>Miami</strong>-Fort Lauderdale ranked high only on diversity,along with 12 other regions. Of these regions, <strong>Miami</strong>-FortLauderdale was the only one that failed to rankin the upper half on the measure of knowledge workers. 35The region was urged to invest in the creative industriesand work cohesively in order to compete with the globalcreative economy. Escalating housing costs was identifiedas one of the major barriers to increasing knowledgeworkers in <strong>South</strong> <strong>Florida</strong>. 36 <strong>South</strong> <strong>Florida</strong>’s economic developmentorganizations are recognizing the role of thecreative industries and developing strategies to produce,attract, and retain knowledge workers.AgricultureAgricultural production remains an important industryfor <strong>Florida</strong>, with a market value of $6.2 billion in 2002. In2003, the state accounted for 75 percent of annual U.S.citrus production, 19 percent of the world’s oranges (secondonly to Brazil), and 45 percent of the world’s grapefruitproduction. <strong>Florida</strong> ranks second nationally in freshvegetable production, providing 12 percent of the U.S.total, and provides 80 percent of the winter vegetablesgrown in the U.S. <strong>Florida</strong> <strong>is</strong> also the nation’s second largestproducer of horticulture (greenhouse/nursery), withannual sales over $1.5 billion. 37<strong>South</strong> <strong>Florida</strong> leads the state in agricultural production.In 2002, Palm Beach County led the state in total valueof agricultural products sold ($760 million), due in largepart to its sugarcane harvest. Although Palm BeachCounty continues to be the top agricultural producer inthe state, sales decreased 15 percent from 1992 to 2002.<strong>Miami</strong>-Dade County, the second-largest agricultural producerin the region, has increased its sales 62 percentfrom 1992 to 2002, reaching $578 million. Within the region,the market value of agricultural production <strong>is</strong> $1.76billion, two percent less than in 1992. 38<strong>Florida</strong>’s agricultural lands have continued to decline overthe past 20 years, from 12.8 million acres in 1982 to 10.8 in1992, and down to 10.2 million acres in 2002. The region<strong>is</strong> under pressure to convert agricultural land for urbaniza-Millions$1,000$800$600$400$200$0Market Value of Agricultural Productionin <strong>South</strong> <strong>Florida</strong>1974-20021974 1978 1982 1987 1992 1997 2002<strong>Miami</strong>-DadeBrowardPalm BeachMartinSt. LucieIndian River49
WHERE IS SOUTH FLORIDA HEADING?tion and to support uses that are necessary to restore thehydrology and ecology of the Everglades (such as rechargeponds). Growing pressure pers<strong>is</strong>ts to push <strong>Miami</strong>-Dade’surban growth boundary farther west, opening agriculturallands to urban uses. Agricultural uses have virtually d<strong>is</strong>appearedfrom Broward County, where large-scale developmentsalready reach the edge of the Everglades. Between1992 and 2002, Palm Beach County lost 16 percent of itsagricultural lands (paralleling the decline in the value of itstotal agricultural product). 39 Pressure for land conversion <strong>is</strong>also growing in Martin, St. Lucie, and Indian River counties,where successive seasons of citrus canker and hurricanedamage have severely impacted the value of orchards. Inshort, the future of agriculture <strong>is</strong> uncertain in the most agriculturallyproductive region of the state.Marine IndustryOne of the region’s largest industries, the marine industryhas an economic impact ($14 billion) that far surpassesthe impact of the citrus and cru<strong>is</strong>eship industries in theentire state. With $2.7 billion in sales in 2005, the corecountyarea accounted for 46 percent of marine sales inthe state. The industry contributes almost $5 billion inearnings in the region and 162,000 jobs. Almost 80 percentof the marine industry’s economic activity regionwide<strong>is</strong> in Broward County, which alone accounts for a$10.8 billion economic impact, $3.8 billion in earnings,and 135,000 jobs. However, from 2000 to 2005, marineindustry sales in Palm Beach County grew about threetimes faster than in Broward. But, like agriculture, thefuture of the marine industry <strong>is</strong> uncertain. As land valuesappreciate, marina owners are pressured to sell their waterfrontreal estate for residential development. 40Trade and Tour<strong>is</strong>mAirports<strong>South</strong> <strong>Florida</strong> airports continued to grow in 2004, with55 million air travelers passing through its three mainairports, <strong>Miami</strong> International (MIA), Fort-Lauderdale/Hollywood International (FLL) and Palm Beach International(PBIA). To a large extent, these airports complementeach other. While MIA acts as a major hub for internationaltravel (with 91 percent of international v<strong>is</strong>itorshailing from Latin America or the Caribbean), FLL andPBIA are principal hubs for domestic flights.MIA continues to be the nation’s premier gateway to andfrom Latin America. It ranks first among U.S. airports forComparative Economic Impact of Key <strong>Florida</strong> Industries2005BillionsBillions$15$10$0.5 $5$0$2.0$1.5$1.0$0.5$0.0Tri-CountyMarine industryCitrus IndustryCru<strong>is</strong>e ShipsMarine Gross Sales in <strong>South</strong> <strong>Florida</strong>1994-20051994 2000 2005<strong>Miami</strong>-Dade Broward Palm Beachinternational freight and third for international passengers.41 Two million tons of cargo passed through MIA in2004, increasing 8.5 percent over 2003 to reverse the declinethat took place after 1998. 42 MIA also saw a minimalincrease of two percent in passenger traffic in 2004, primarilyfrom domestic travel, after declining since 2001.The year-end passenger total at MIA was 30 million. 4350
CHARTING THE COURSEFLL cargo climbed 4.1 percent from 2003 to 2004, reaching180,000 tons, reversing a trend of decline since 2000. 44The year 2004 was the ninth consecutive year of positivepassenger growth for FLL, when it reached 21 millionpassengers. 45 Th<strong>is</strong> represents a 66 percent increase since1998, which may be due to greater passenger capacity,as well the availability of nine low-cost carriers. Thesetwo airports have a combined economic impact of $21 billionon the region. MIA’s impact <strong>is</strong> $19 billion, generating242,387 direct and indirect jobs. FLL’s impact <strong>is</strong> $2 billion,generating 31,000 direct and indirect jobs. 46With over 6.5 million passengers in 2004, PBIA <strong>is</strong> considerablysmaller than the region’s other two major airportsbut provides opportunity for significant growth. 47 Futureimprovements include the addition of up to 24 gates,concessions in the concourses, and new exits linking theairport directly to Interstate 95, which could make PBIAa preferred alternative for residents and v<strong>is</strong>itors to thenorthern part of the region. 48Cargo (In Millions of Tons)2.52.01.51.00.50Airport Cargo in <strong>South</strong> <strong>Florida</strong>1990-20041990 1995 1998 2000 2002 2003 2004<strong>Miami</strong> International AirportFort Lauderdale/ Hollywood International AirportSeaportsIn 2002, the total economic impact of <strong>Florida</strong>’s seaportswas over $50 billion and 288,696 direct and indirect jobs,expected to reach $62 billion and 348,000 jobs by 2008.<strong>South</strong> <strong>Florida</strong> <strong>is</strong> home to three of the state’s top five deepwaterports (Port of <strong>Miami</strong>, Port Everglades, and thePort of Palm Beach). Of the 13 ports in <strong>Florida</strong>, <strong>South</strong><strong>Florida</strong>’s three main ports accounted for 63 percent ofthe total dollar value of <strong>Florida</strong>’s waterborne foreign exportsand imports in 2004. 49 The Port of <strong>Miami</strong> has anannual economic impact of $12 billion and 90,000 directand indirect jobs in <strong>Miami</strong>-Dade County. Port Evergladeshas an annual economic impact of $3.2 billion and 26,000direct and indirect jobs in Broward County. 50The Port of <strong>Miami</strong>’s total waterborne commerce was 9.2million tons in 2004, up three percent from 2003. However,annual gross revenue fell from $83 million in 2003 to $79million in 2004, due to decreases in cru<strong>is</strong>e passengers. 51Port Everglades saw an increase in waterborne commerce,reaching 25.5 million tons in 2004, and it reached$56 million in gross annual revenue in 2004, up 57 percentfrom 2003. 52 The Port of Palm Beach saw a small decreasein waterborne commerce. 53 By 2008, waterborneAir Passengers in <strong>South</strong> <strong>Florida</strong>1998-2004Waterborne Commerce at <strong>South</strong> <strong>Florida</strong>’s Ports2000-20084030Millions of Passengers3530252015105Millions of Tons25201510501998 1999 2000 2001 2002 2003 200402000 2004 2008MIA FLL PBIAPort EvergladesPort of <strong>Miami</strong>Port of Palm Beach51
WHERE IS SOUTH FLORIDA HEADING?International TradeInternational trade <strong>is</strong> one of <strong>Florida</strong>’s largest industries.Total trade in goods (both imports and exports) <strong>is</strong> valuedat $81 billion. In 2004, exports equaled $38 billion, 44 percentof which was accounted for by <strong>South</strong> <strong>Florida</strong>. Whenexported services are included, annual exports are valuedat $50 billion, one-twelfth of the state’s annual economicoutput, sustaining 580,000 jobs in the state. Tradewithin the “Floribbean” region (<strong>Florida</strong>, Latin Americanand Caribbean nations) accounts for 60 percent of <strong>Florida</strong>’sinternational trade. 56cargo in the region <strong>is</strong> expected to reach 43 million tonsand constitute 30 percent of the state’s total, down from32 percent in 2004. 54 <strong>South</strong> <strong>Florida</strong> <strong>is</strong> also home to a largeshallow-water port, the <strong>Miami</strong> River. As the fifth largestport in the state, it handles about $4 billion in cargo annually.A long-awaited dredging project, begun in 2004, willenable the port to accommodate larger vessels.The region <strong>is</strong> a major staging area for cru<strong>is</strong>e ships and<strong>is</strong> known as the “cru<strong>is</strong>e capital of the world.” The Portof <strong>Miami</strong> and Port Everglades continue to lead the statein cru<strong>is</strong>eship traffic, a trend expected to continue into2008. Mirroring gains in cargo, Port Everglades’ cru<strong>is</strong>eshipindustry saw a 21 percent increase from 2003, exceedingfour million passengers for the first time in 2004.The Port of <strong>Miami</strong> saw an 11 percent decrease, falling to3.5 million passengers in 2004. The Port of Key West retainedits one million passengers while the Port of PalmBeach fell 15 percent to 540,000 passengers in 2004. By2008, cru<strong>is</strong>e passengers in the region are expected toreach 11.8 million and constitute 56 percent of the state’stotal cru<strong>is</strong>e passengers, down from 62 percent in 2004. 55Millions of Passengers6543210Cru<strong>is</strong>e Passengers at <strong>South</strong> <strong>Florida</strong>'s Ports2000-20082000 2004 2008Port of <strong>Miami</strong>Port of Key WestPort EvergladesPort of Palm Beach<strong>South</strong> <strong>Florida</strong>, especially <strong>Miami</strong>-Dade County, <strong>is</strong> a hubfor trade in goods and services with Latin America andthe Caribbean. In 2005, the region was home to almost1,400 multinational businesses that employed over 61,000people. In <strong>Miami</strong>-Dade, over 46,000 are employed at internationalcompanies, accounting for four percent of thecounty’s total employment. 57 In addition, <strong>Miami</strong>-DadeCounty <strong>is</strong> home to 31 international banks, 35 bi-nationalchambers of commerce, and international offices forseveral large corporations serving Latin American andCaribbean markets. They include Home Depot, AmericanAirlines, United Parcel Service, FedEx Corporation,D<strong>is</strong>covery Networks Latin America, HBO Latin America,and MTV Networks Latin America. 58International Companies in <strong>South</strong> <strong>Florida</strong>, 2005County # of Companies Total EmploymentMonroe 2 147<strong>Miami</strong>-Dade 1,030 46,449Broward 250 7,712Palm Beach 98 6,410Martin 6 249St. Lucie 0 0Indian River 7 99Total 1,393 61,066Free trade agreements, such as the Free Trade Area ofthe Americas (FTAA) and the Dominican Republic-CentralAmerican Free Trade Agreement (CAFTA), are expectedto provide substantial new trade and service-relatedeconomic opportunities for <strong>Florida</strong> businesses. TheUnited States recently ratified CAFTA, which seeks to removetrade barriers such as tariffs between the U.S. andthe Dominican Republic, Costa Rica, El Salvador, Guatemala,Honduras, and Nicaragua. Enactment of CAFTA<strong>is</strong> pending ratification by the Dominican Republic andCosta Rica.52
CHARTING THE COURSEWith half of the volume of merchand<strong>is</strong>e trade betweenthe U.S. and CAFTA countries flowing through <strong>Florida</strong>,the state and the region stand to gain more than elsewherein the United States. CAFTA countries collectivelyrepresent the largest market in Latin America for <strong>Florida</strong>’sgoods and services, supporting 65,000 jobs. The U.S.Chamber of Commerce estimates the potential impact at$5.2 billion in sales, $1.2 billion in personal income, and37,000 new jobs nine years after implementation. The creationof a free trade zone among these nations will helpthe apparel and textile industries remain competitive asChina emerges as the world’s largest producer and exporterof textiles and apparels. It will also produce confidenceand new investment in CAFTA countries, movethe Western Hem<strong>is</strong>phere closer to a free internal market,help solidify <strong>Florida</strong>’s role as the “Gateway of the Americas,”and increase <strong>Miami</strong>’s chance of being the FTAApermanent secretariat. 59Tour<strong>is</strong>mIn 2003, 75 million domestic v<strong>is</strong>itors came to <strong>Florida</strong>,including 25 million to <strong>South</strong> <strong>Florida</strong>. 60 <strong>Miami</strong>-Dade,Broward, and Palm Beach counties were among thetop seven destination counties in <strong>Florida</strong>, hosting 17million domestic v<strong>is</strong>itors in 2004, up 10 percent from2000. International tour<strong>is</strong>m has remained cons<strong>is</strong>tentMillionsthroughout the decade. In 2004, there were 7.6 million internationalv<strong>is</strong>itors to the region’s core counties, primarilyfrom Canada and Latin America. 61 In addition, hoteloccupancy rates have increased significantly in three ofthe region’s tour<strong>is</strong>t destinations—<strong>Miami</strong>-Dade, Broward,and Palm Beach counties—with the largest increases inBroward and Palm Beach. 62<strong>South</strong> <strong>Florida</strong>’s beaches are a major tour<strong>is</strong>t attraction.A large portion (44%) of <strong>South</strong> <strong>Florida</strong> tour<strong>is</strong>ts v<strong>is</strong>itedthe beaches, contributing a total of $18.5 billion to theregion’s economy and adding 253,000 jobs. 63181614121086420Tour<strong>is</strong>ts V<strong>is</strong>iting <strong>South</strong> <strong>Florida</strong>'sCore-County Area1997-20041997 1998 1999 2000 2001 2002 20032004DomesticInternational53
WHERE IS SOUTH FLORIDA HEADING?SPOTLIGHT ON THE HURRICANESSignificant economic impacts were felt across thestate and region when they were hit with four hurricanesin 2004 and two in 2005. 64 The hurricanes ledto property damage to businesses, lost economicactivity, and layoffs at businesses that were temporarilyor permanently shut down. In 2004, the totalstatewide insured economic losses for the four hurricanesexceeded $20 billion. Losses for hurricanesFrances and Jeanne, which hit hard in Martin, St.Lucie, and Indian River counties, were $3.7 billionand $4.6 billion, respectively. 65 Losses were greatestfor the agriculture, tour<strong>is</strong>m, and international tradeindustries, all important segments of <strong>South</strong> <strong>Florida</strong>’seconomy.EmploymentIn 2004, employment loss was greatest, though temporary, in the tour<strong>is</strong>m-related industries when flights and hotelreservations were cancelled, and airports and seaports were closed. It was also significant in the agriculture industry,though it did not rebound as in the tour<strong>is</strong>m industry. Some sectors, such as insurance companies, utility crews,and construction companies, gained employment. Home improvement stores and hotels in unaffected areas saw anupsurge in activity. The total statewide job loss between August 2004 and September 2004 <strong>is</strong> estimated at 30,000, withabout 9,500 jobs in agriculture. However, in the final months of 2004, jobs rebounded with growth of 5.1 percent. 66With an estimated $7.2 billion in insured losses, Hurricane Wilma in 2005 was the fourth most costly hurricane in U.S.h<strong>is</strong>tory. Thirty-five percent of insured losses affected commercial and business property. Structural damage, alongwith power outages to 3.2 million customers for days or even weeks, had devastating effects on many <strong>South</strong> <strong>Florida</strong>businesses. 67 Initial damage assessment surveys showed that in Broward County, 20 percent of businesses will shutdown due to damage, and 24 percent said they will have to lay off employees. 68Impact on Agriculture<strong>Florida</strong> agriculture, especially the citrus industry, sustained significant hurricane damage in 2004. Orchards weredestroyed, and high winds and rain spread canker to citrus trees across the Treasure Coast. Statewide, 2004 orangeproduction levels were down 27 percent, and grapefruit was down 63 percent from 2003. Damage and loss are estimatedat $3 billion. In addition, damage to greenhouse and nursery plant production <strong>is</strong> estimated at $500 million.Damage assessments from Hurricane Wilma are not yetavailable.Even with a citrus crop shortage, prices are notincreasing to compensate for decreased supply becausedemand <strong>is</strong> being met by international growers, largelyfrom Brazil. It will be a challenge for the citrus industryalong the Treasure Coast to recover its competitiveadvantage. “To retain rural lands . . . it <strong>is</strong> important thatagriculture remain economically viable. Doing that willrequire local, as well as state and federal, leadership andsupport and strong public-private partnerships,” accordingto Chuck Aller of the Committee for a SustainableTreasure Coast. 69 0Millions of Customers3.53.02.52.01.51.00.5Power Outages due to 2005 HurricanesWilma Katrina Rita54
CHARTING THE COURSEFLORIDA REGIONAL HIGHLIGHTSIn terms of wages and employment, <strong>Florida</strong>’s economy <strong>is</strong> booming. However, wage d<strong>is</strong>parity permeates th<strong>is</strong> overallprosperity, particularly in <strong>South</strong> <strong>Florida</strong>, and d<strong>is</strong>proportionately effects workers in low-end jobs. Due to lower rates ofwage growth, the housing gap <strong>is</strong> more dramatic in <strong>South</strong> <strong>Florida</strong> than in other regions, though Central <strong>Florida</strong> <strong>is</strong> alsoexperiencing escalating housing costs. Per capita income growth <strong>is</strong> also lagging in <strong>South</strong> <strong>Florida</strong>. Different regions aredominated by somewhat different industry sectors, suggesting a complementary niche for sectors by region.WAGESAverage wages in <strong>South</strong> <strong>Florida</strong>’s core counties are comparable to those in <strong>Florida</strong>’s other regions, although wagesremain lower in Escambia County in Northwest <strong>Florida</strong>. Th<strong>is</strong> suggests similar levels of economic vitality; however, in<strong>South</strong> <strong>Florida</strong>, there <strong>is</strong> a great deal of wage d<strong>is</strong>parity that <strong>is</strong> masked by the average annual wage.Annual wages have not kept pace with r<strong>is</strong>ing housing costs in the most populous counties of <strong>Florida</strong>. In <strong>South</strong> <strong>Florida</strong>’score counties, housing wages rose at average annual rates ranging from 4.2 percent to 7 percent from 2000 to 2003,while wages only rose at average annual rates between 2.2 percent and 3.4 percent. The gap <strong>is</strong> also apparent in Orangeand Hillsborough counties, where housing wages rose at average annual rates ranging between 6.0 percent and6.8 percent, while wages rose at average annual rates between 3.8 percent and 4.1 percent. Duval, the most populouscounty of Northeast <strong>Florida</strong>, and Escambia, the most populous county of Northwest <strong>Florida</strong>, experienced the oppositetrend. Such stark differences between wages and the cost of living are pricing residents out of the housing market inmajor metropolitan areas of <strong>Florida</strong>.$40,000$35,000$30,000$25,000$20,000Average Wage Per Jobin the Core Counties of <strong>Florida</strong>'s Regions1993-20031993 1994 1995 1996 1997 1998 1999 2000 2001 2002 2003<strong>Miami</strong>-Dade Broward Palm BeachHillsborough Orange DuvalEscambia <strong>Florida</strong> United States7%6%5%4%3%2%1%0%Average Annual Housing Wage Growthvs.Average Annual Wage Growth2000-2003<strong>Miami</strong>-Dade Palm Beach Hillsborough EscambiaBroward Orange Duval <strong>Florida</strong>Housing Wage GrowthWage per Job Growth55
WHERE IS SOUTH FLORIDA HEADING?PER CAPITA PERSONAL INCOMEBroward and Palm Beach counties both surpass thestate and other regions in per capita income. <strong>Miami</strong>-Dade’s per capita income <strong>is</strong> lower than all but Escambia.However, from 1993 to 2003, per capita income growthrates in <strong>Miami</strong>-Dade, Broward, and Palm Beach countieswere well below rates in Orange, Hillsborough, Duval,and Escambia counties. <strong>South</strong> <strong>Florida</strong> derives a greatershare of its personal income from unearned income andless from wages, indicating a greater share of retireesand wealthy residents in the region.INDUSTRY SECTORSCompared to <strong>Florida</strong>’s other major urban regions, <strong>South</strong><strong>Florida</strong> <strong>is</strong> expected to lag in the growth of jobs in somehigh-wage sectors. Northeast <strong>Florida</strong> <strong>is</strong> projected to leadin higher paying financial activities, and though <strong>South</strong><strong>Florida</strong> will grow its business and professional servicessector, Tampa Bay <strong>is</strong> expected to dominate. <strong>South</strong> <strong>Florida</strong>’sstrongest sector will continue to be trade, transportation,and utilities, but will also include large educationand health services and professional and business servicessectors. Central <strong>Florida</strong> will lead in le<strong>is</strong>ure and hospitality.BEACH TOURISMAlthough Central <strong>Florida</strong> <strong>is</strong> the strongest tour<strong>is</strong>t marketin the state, the beaches draw v<strong>is</strong>itors to the southerncoasts. Beach tour<strong>is</strong>m has a significant economic impacton both <strong>South</strong> <strong>Florida</strong> ($18 billion) and <strong>South</strong>west <strong>Florida</strong>($13 billion). It also provides 253,000 jobs in <strong>South</strong><strong>Florida</strong>, 177,000 in <strong>South</strong>west <strong>Florida</strong>, 79,000 in Northwest<strong>Florida</strong>, and 27,000 in Northeast <strong>Florida</strong>.$45,000$40,000$35,000$30,000$25,000$20,000$15,000United StatesPer Capita Incomein the Core Counties of <strong>Florida</strong>'s Regions1993-20031993 1994 1995 1996 1997 1998 1999 2000 2001 2002 2003Palm BeachBroward<strong>Miami</strong>-DadeOrangeHillsboroughDuvalEscambia<strong>Florida</strong><strong>Miami</strong>-Dade Broward Palm BeachHillsborough Orange DuvalEscambia<strong>Florida</strong>0% 20% 40% 60% 80% 100%Earnings by Place of WorkSources of Personal Income2003Transfer PaymentsDividends, Interest and RentEconomic Impact ofRegional Beach Tour<strong>is</strong>m in <strong>Florida</strong>$20Billions of Dollars$15$10$5$0$1.0$1.0$9.4$9.1Northeast <strong>South</strong>east <strong>South</strong>west NorthwestDirect Spending$6.6$6.4 $2.9$2.8Indirect Spending56
CHARTING THE COURSECOMMENTARY FROM THE EXPERTSDr. Bruce N<strong>is</strong>sen, DirectorCenter for Labor Research & Studies<strong>Florida</strong> International UniversityPast 20 years. <strong>Miami</strong>’s role as a world city connected toour neighbors in the south <strong>is</strong> a key change in the economy.<strong>Miami</strong> has become a Latin American center for bankingand finance. The nature of immigrants has changed.For Cuba, for example, it’s been lower and lower downthe socioeconomic scale from the beginning of the CubanRevolution. First, you had the very rich coming, andthen you had the upper-middle class, then the middleclass, and now immigrants coming from Cuba tend tobe working class. Now we have more racial divides andmore immigrants from Central American countries.Inequality has been growing. <strong>Miami</strong>-Dade County hasthe second highest average wage of <strong>Florida</strong> counties, andalso <strong>is</strong> among the highest poverty counties in the nation.How could the county be one of the richest in the stateand yet have some of the highest poverty rates? The answer<strong>is</strong>: The money <strong>is</strong> here but d<strong>is</strong>tributed so unequally.Th<strong>is</strong> <strong>is</strong> a high-inequality area of the nation and the state.If you are an immigrant and don’t speak much Engl<strong>is</strong>h,even if you are educated, you will more than likely end upin the retail or service business. People in poverty mostlywork in the retail trades where there are few tips, usuallynone. Underreporting of tipped income <strong>is</strong> greatest forthose who work in upscale types of establ<strong>is</strong>hments, notfor those working in establ<strong>is</strong>hments catering to the workingpopulation. Most low-wage immigrants or minoritiesare not making a huge amount of money from tips.Next 20 years. In 20 years from now, <strong>Florida</strong> will continueto have jobs skewed toward tour<strong>is</strong>ts and wealthyretirees because we are a place for the middle class andupper class to vacation and to retire. We are stuck withthe structural fact that our economy <strong>is</strong> skewed towardwhat are to some degree these low-wage industries. Wehave an overrepresentation of retail jobs, an overrepresentationof le<strong>is</strong>ure and hospitality and lodging and thosekinds of employment, and there <strong>is</strong> just no way out of thatfact. We’ve got to start ra<strong>is</strong>ing the floor both on wagesand conditions for those low-wage workers; otherw<strong>is</strong>e,we are facing increased crime rates, bad health care, allthose things that go along with high poverty.What needs to be done. Try to attract more high-skilledand “high-value” industries and employers into the state.We’ve got to try to move the mix of jobs in <strong>Florida</strong> to industriesand occupations that add higher value and havea higher wage. I believe that because of the “fun in thesun” syndrome and the warm weather, and because ofsome of the “world city” and banking and other kinds ofnodes that we have down here, there might be a shot atbuilding a high-tech sector in <strong>South</strong> <strong>Florida</strong>. The thingthat makes that unlikely <strong>is</strong> <strong>Florida</strong>’s refusal to invest inthe proper infrastructure to really make it happen—therefusal to fund the kind of world-class education systemyou’d have to have to really make that work.We need to build up community-based groups, what Icall the “social justice infrastructure.” We need to organizeand rebuild social movements that address trendstoward low wages and inequality. If we can build up thevarious pieces of the “social justice infrastructure” to givea voice to working people and develop vehicles for a collectiveimmigrant voice, then we will have the bas<strong>is</strong> for aprogressive future for <strong>Florida</strong>. We especially need a lotmore organizing in Latino communities.Mike Jones, Executive DirectorEconomic Council ofPalm Beach CountyPast 20 years. Looking back 20 years ago, the Palm BeachCounty economy was heavily dependent on agricultureand tour<strong>is</strong>m. Global competition, however, has reducedthe heavy dependence on vegetable growing, and thesugar and citrus industries are now under increasingpressure because of trade policies.Anything that diversifies your economic base should havea positive impact. What remains to be seen <strong>is</strong> the degreeto which it multiplies. The same pressures that make itdifficult to remain competitive in a single source, soleproduct, manufacturing economy would apply to some ofthe components of the biotech industry. Scripps <strong>is</strong> justpart of the puzzle—the bigger potential component <strong>is</strong> theresearch and the spin-off businesses that may result.Next 20 years. We have been prioritizing for the last fouryears—education, transportation, housing, and growthand development. The immigrant population, the less57
WHERE IS SOUTH FLORIDA HEADING?educated, the less job ready, strain available communityresources. The elderly who come here with a nest egg, ifthey haven’t accurately projected, may become anothergroup. There’s a growing awareness that the market areaextends beyond governmental jur<strong>is</strong>dictional lines; moreand more organizations realize their success <strong>is</strong> dependenton the ability to do business within a wider regionalmarket area economy. One of the good things that hasrecently happened here <strong>is</strong> the public support to buildschools in Palm Beach County.What needs to be done. I see a bright future, but I don’t seeany silver bullets. We must continue to strive to developthe basic infrastructures that make life pleasant—goodschools, friendly neighborhoods, ease of mobility, affordablehousing, and a mixture of housing. I think peoplewho move to <strong>South</strong> <strong>Florida</strong> want the option to rent orown, and we have some policies that are making it difficult,if not impossible, to find affordable rentals, not justaffordable to buy. The critical infrastructure needs arenot being funded at the levels necessary to keep pacewith growth. If we don’t have more Scripps and more entrepreneurs,and don’t remain on the cutting edge of technologyadvancements, and diversify our economy, we willinevitably become increasingly dependent on the serviceindustry, and the quality of life will go down. But overall,we have more opportunities than we do challenges.I believe from a business standpoint, th<strong>is</strong> <strong>is</strong> a frontier. Idon’t think the business community has worked collaborativelyto take full advantage of its potential. Businessmust play a leadership role. It’s challenging to get thebusiness community to come together on <strong>is</strong>sues andspeak with one voice to demand policy changes. Once wemaster that, we can harness the untapped resources.Mason Jackson, President/CEOWorkforce One, Broward CountyPast 20 years. About 87 percent of job growth <strong>is</strong> in jobsthat pay below the current median wage—retail, hospitality—andhousing costs are increasing in some placesas much as 70 percent a year. If teachers can’t afford tolive here, education suffers. We’ve got to do the kind ofeconomic development that <strong>is</strong> going to bring in a diversifiedeconomy and better jobs at higher wages and higherskills. Another <strong>is</strong>sue <strong>is</strong> that we are a melting pot with increasingnumbers coming in, and many people lack thebasic skills and language skills to take the higher wage/higher skill jobs. Therefore we may not be able to supporthigh numbers of highly technical jobs.Next 20 years. I see a changing labor marketplace, whichchanges at an ever-increasing rate. I see a difficulty inprojecting those changes, even figuring out what theyare as they happen. It will be difficult to keep the communicationlines open between the business community andthose responsible for turning out our workforce. Publicinstitutions will be challenged to keep up with the changes.Over 75 percent of jobs require some kind of trainingbeyond high school. Getting training or degrees in themid part of the day, which <strong>is</strong> traditional in institutions,will not work anymore. There will need to be more nightand weekend classes, along with d<strong>is</strong>tance learning. Educationwill have to become more flexible and nimble.What needs to be done. We need a world-class educationsystem and a good quality of life to get a handle on affordablehousing and transportation to attract people to comehere. Th<strong>is</strong> <strong>is</strong>, more than anything else, a communicationsproblem. As long as these problems remain hidden, andnot on the public agenda, they will not be solved. I’m positivethat these problems are solvable. Do we have the willto do it? Do we have the kind of short-term sacrifice forlong-term gain? That, I’m not so sure about.Ralph Marrinson, ChairmanRegional Business AlliancePast 20 years. The `70s began the boom and the `80s tookoff. At that time, it became apparent to us that the communitiesneeded to work together. Nobody env<strong>is</strong>ionedthe real growth in the `80s of the tri-county area. Therefore,we’d better open our eyes and see that other counties,such as Indian River, are involved in th<strong>is</strong> growth.Next 20 years. Th<strong>is</strong> region <strong>is</strong> exciting, dynamic, culturallymixed; it has a unique flavor in different sections witheconomic opportunities. The changes that have takenplace have not impacted the region evenly, but one of thecommon impacts <strong>is</strong> transportation. I predict that within 8to 10 years there will be another north-south rail systemand a concerted effort to develop the east-west linkage.What needs to be done. Education <strong>is</strong> number one—equalfunding <strong>is</strong> necessary as an influx of population continues.We are the testing laboratory for the nation as we grow indiversity. We will have to become a multilingual society.We need to work together for economic growth, involvinga diverse economic base to bring a variety of employmentopportunities. We have begun to do that but needto keep moving along. We are no longer competing withTampa or Orlando but are competing internationally.58
CHARTING THE COURSEConclusionTOWARD A PROSPEROUS AND SUSTAINABLE FUTURERecent events in <strong>South</strong> <strong>Florida</strong> suggest that thefuture prosperity of the region <strong>is</strong> closely tiedto research investments. Commenting on the dec<strong>is</strong>ionto locate Scripps Research Institute at the FAU MacArthurcampus in Jupiter, Governor Bush stressed theimportance of regional collaboration. “In order for the v<strong>is</strong>ionof Scripps Research Institute to be successful in creatinghigh-wage jobs, collaboration <strong>is</strong> going to be key.” 1The <strong>Miami</strong> Herald applauded the Scripps dec<strong>is</strong>ion as aboost to the entire region because it “will lift everyone’sboat by drawing more high-tech research and developmentoutfits to the area” and “signal a genuine sea changein what sort of business investments come our way, furtherdiversifying the region’s economy.” 2 The location ofScripps invites collaboration among ex<strong>is</strong>ting and plannedhigh-tech research investments in the region. North ofScripps lies Harbor Branch Oceanographic Institution,the University of <strong>Florida</strong>/IFAS Indian River Research andEducation Center, and the U. S. Department of Agriculture’sHorticultural Research Laboratory in Fort Pierce.Another biomedical research institute, the Burnham Institute,<strong>is</strong> proposed for Port St. Lucie. <strong>South</strong> of Scripps<strong>is</strong> the reemergence of the IBM facility at T-REX in BocaRaton. The U.S. Geological Survey will collaborate with<strong>Florida</strong> universities at the <strong>Florida</strong> Interd<strong>is</strong>ciplinary ScienceCenter research and education complexin central Broward. Finally, the University of<strong>Miami</strong> plans a biotechnology research complexin the City of <strong>Miami</strong> in concert with theJackson Memorial Medical Center.community working to maximize its own tax base often incompetition with its neighbors. <strong>South</strong> <strong>Florida</strong> <strong>is</strong> not significantlydifferent from other regions in th<strong>is</strong> regard. There <strong>is</strong>little political will to act regionally instead of locally.<strong>South</strong> <strong>Florida</strong> and <strong>Florida</strong>’s regions in general are furtherchallenged by the fact that they are relatively young, asmeasured by the age of higher education institutions, majorfoundations, and cities reaching a significant thresholdof population. Furthermore, their population growth<strong>is</strong> significantly driven by people who were not born hereand therefore have a shorter acquaintance and attachmentto these places.There are two overriding challenges that <strong>South</strong> <strong>Florida</strong>must be able to meet as a region. First, it must be ableto grow physically in a manner that <strong>is</strong> sustainable. Second,it must be able to develop its economy in a waythat assures prosperity. Clearly these two challenges arerelated, but succeeding at one does not assure successwith the other. Some alternative futures might be basedon differing degrees of success at meeting the goals of asustainable and prosperous region. Imagine four alternativefutures by 2030. These four are defined by successor failure at achieving sustainability and prosperity. Nowimagine that the region <strong>is</strong> at the crossroads of these twoaxes. Its future will either have more or less prosperityand sustainability than it has now.ProsperityAny v<strong>is</strong>ion of the future economic prosperityof the region must be balanced with effortsto achieve environmental sustainability, especiallyEverglades restoration. Continuingthe present pattern of sprawl developmentwill challenge the region’s ability to build andmaintain its physical infrastructure, maintainits hydrology, and restore its wildlife habitats.While the regional realities of daily living maybe self evident, the ability to act regionally lagsbehind that reality. Governmental dec<strong>is</strong>ionmakingremains highly fragmented, with eachPaved Parad<strong>is</strong>eProm<strong>is</strong>ed LandDegradationSustainabilityDevastated Wastelandand Economic DivideScarcity59
WHERE IS SOUTH FLORIDA HEADING?Prom<strong>is</strong>ed Land. The future would be one in which bothgoals are achieved. By 2030, <strong>South</strong> <strong>Florida</strong> would be a regionin which Everglades habitats and the underlying watersupply were significantly restored. It would be a placewith reduced social d<strong>is</strong>parities because the economy hasgenerated more high-paying jobs. It would also be a placewith reduced congestion because of an improved balancebetween jobs and housing.Paved Parad<strong>is</strong>e. Prosperity would have been achieved, butat a significant cost to the region’s environment. Th<strong>is</strong> couldbe a future in which urban growth was allowed to push fartherwest and north in order to maintain current forms ofdevelopment, d<strong>is</strong>placing wetlands and agriculture, defeatingEverglades restoration, and aggravating roadway congestion.Prosperity could be built by attracting more internationalcapital to the region. Other residents would presumablybenefit from the trickle down effects of th<strong>is</strong> wealth.Economic Divide. Citizens of the region would enjoy agood physical environment, but poor socio-economic conditions.Such a future could occur if environmental sustainabilitywere achieved without a v<strong>is</strong>ion for how urban areas dealwith population growth. Increased competition for limitedland could ra<strong>is</strong>e housing costs, further aggravating sociald<strong>is</strong>parities and impacting the recruitment of new industries.Devastated Wasteland. In th<strong>is</strong> future, neither the goalof prosperity nor environmental protection has beenachieved. Th<strong>is</strong> <strong>is</strong> a likely outcome if current governmentalfragmentation prevails, and each community assumesa go-it-alone stance. Something that would definitely tipthe balance toward th<strong>is</strong> quadrant <strong>is</strong> a failure of the Evergladesrestoration project, especially if it were combinedwith the impact of some major devastating hurricane,such as Hurricane Katrina’s damage to the Gulf Coast.The scenarios described above will help <strong>South</strong> <strong>Florida</strong>understand the need for a regional v<strong>is</strong>ion. It will also helpthe region measure its progress in moving toward thatv<strong>is</strong>ion. Th<strong>is</strong> report of trends and projections representsmarkers on the map to guide the v<strong>is</strong>ioning process. Wehope you will agree that the region <strong>is</strong> at a critical crossroadsin charting its direction.<strong>South</strong> <strong>Florida</strong>’s Regional Initiatives<strong>South</strong> <strong>Florida</strong>’s initiatives cons<strong>is</strong>t of state, regional, andsub-regional collaborations. These efforts are helping tosolidify the identity of the region and may bring aboutpositive changes in regional policy and action. Theyrange from county v<strong>is</strong>ioning, to collaboration amongpartners in the larger region, to specific business economicefforts to coalesce the region.The Urban Land Institute developed state strategies forregional cooperation that focused on recommendations tosupport regions. They developed four key recommendationsto build regional<strong>is</strong>m in <strong>Florida</strong>, beginning with gubernatorialleadership on statewide regional cooperation,regional v<strong>is</strong>ions and action plans, state agency cooperationto promote regional<strong>is</strong>m, and state support for progress towardregional v<strong>is</strong>ions. With state and local support and direction,<strong>Florida</strong>’s regions have the ability to develop theirown v<strong>is</strong>ions, unique to their regions. These v<strong>is</strong>ions willhelp map long-term goals for <strong>South</strong> <strong>Florida</strong>’s future, aswell as that of other regions. 3Many institutions are trying to help guide the future of the<strong>South</strong> <strong>Florida</strong> region. <strong>Florida</strong> Atlantic University’s CUESadmin<strong>is</strong>ters the <strong>South</strong> <strong>Florida</strong> Regional Resource Centerto provide community planning support and leadership education,linking citizens to policy dec<strong>is</strong>ions. RESEARCH-<strong>South</strong><strong>Florida</strong> <strong>is</strong> developing collaboration among researchinstitutions. The Committee for a Sustainable TreasureCoast developed a long-range plan for sustainable developmentin Treasure Coast counties. The Economic <strong>Development</strong>Research Institute <strong>is</strong> working on economic studiesand initiatives for the region. The Regional Business Alliance<strong>is</strong> focusing on three specific <strong>is</strong>sues that cross countyboundaries—transportation, education, and housing. TheTri-County Leadership Council <strong>is</strong> educating leaders on regionalcollaboration. The iCoast, composed of the region’score counties, <strong>is</strong> focusing on economic development andinvestment in the region’s technology sector, while theResearch Coast <strong>is</strong> addressing economic development inTreasure Coast counties.The reality of the <strong>is</strong>sues facing <strong>Florida</strong> and its regions inthe 21st century requires collaboration, but it <strong>is</strong> impededby a lack of shared identities and goals, and the absenceof regional leadership and state support for regional<strong>is</strong>m. If<strong>Florida</strong> <strong>is</strong> to successfully address its complex <strong>is</strong>sues, reachits ambitious economic goals and retain the quality of lifethat Floridians expect, the future will likely hold a greateremphas<strong>is</strong> on and acceptance of regional solutions by thestate, regions, counties, and municipalities. Clearly, thefuture of the region <strong>is</strong> uncertain. Which direction it takeswill depend on intentional and forward-looking policies establ<strong>is</strong>hednow and effectively implemented. These policychoices will determine whether <strong>South</strong> <strong>Florida</strong> faces a positiveor negative future. Thus, the destiny of the region’sfuture citizens <strong>is</strong> being determined today.60
EndnotesINTRODUCTION1 Johnston, P. (2006, February 17). Bush says “time to moveon,” Supports Scripps Jupiter choice. Boca Raton News.Retrieved February 20, 2006 from http://www.bocaratonnews.com/;Pounds, M.H. (2006, February 16). IBM,Scripps join in Palm Beach County to fight Bird Flu. Sun-Sentinel. Retrieved February 20, 2006 from http://www.sun-sentinel.com/.2 Dhavale, D., & Lang, R.E. (2005, July). Beyond megalopol<strong>is</strong>:Exploring America’s new “Megapolitan” geography. MetropolitanInstitute Census Report Series, MetropolitanInstitute at Virginia Tech.3 Peirce, N. (2005, July 17). “Megalopol<strong>is</strong>” comes of age. RetrievedJanuary 11, 2006 from http://www.stateline.org.4 Dhavale, D., & Lang, R.E. (2005, July). Beyond megalopol<strong>is</strong>:Exploring America’s new “Megapolitan” geography. MetropolitanInstitute Census Report Series, MetropolitanInstitute at Virginia Tech.5 Peirce, N. (2005, July 17). “Megalopol<strong>is</strong>” comes of age. RetrievedJanuary 11, 2006 from http://www.stateline.org.6 Dhavale, D., & Lang, R.E. (2005, July). Beyond megalopol<strong>is</strong>:Exploring America’s new “Megapolitan” geography. MetropolitanInstitute Census Report Series, MetropolitanInstitute at Virginia Tech.7 Cambridge Systematics, Inc. (2003). New cornerstone: A v<strong>is</strong>ionfor <strong>Florida</strong>’s economic future. Tallahassee, FL: <strong>Florida</strong>Chamber of Commerce. The <strong>Florida</strong> Chamber Foundation<strong>is</strong> the research arm of the <strong>Florida</strong> Chamber of Commerce.8 Urban Land Institute, <strong>Florida</strong> Committee for Regional Cooperation.(2005). Building <strong>Florida</strong>’s future: State strategiesfor regional cooperation. Washington, DC: The Urban LandInstitute.9 Another regional network, the <strong>Florida</strong> Regional StewardshipAlliance, <strong>is</strong> also emerging in the state, founded by the<strong>Florida</strong> Chamber Foundation.PEOPLE1 U.S. Census Bureau. (2005, April). State interim populationprojections by age and sex: 2004 – 2030. Retrieved June 17,2005. Data available from http://www.census.gov/population/www/projections/projectionsagesex.html;AssociatedPress. (2005, April 21). Census projects <strong>Florida</strong> to hit No. 3in population by 2030. <strong>Miami</strong> Herald; Kunerth, J., & Newman,J. (2005, April 21). <strong>Florida</strong> to hit No. 3 in population by2030, census projects. Sun-Sentinel; <strong>Florida</strong> will be the thirdfastest-growing state behind Nevada and Arizona.2 DeVol, R., & Frey, W. (2000, March). America’s demographyin the new century: Aging babyboomers and new immigrantsas major players. Santa Monica, CA: Milken Institute.3 Bureau of Economic and Business Research. (2005).<strong>Florida</strong> estimates of population 2004. Gainesville, FL:University of <strong>Florida</strong>.4 Bureau of Economic and Business Research. (2004).<strong>Florida</strong> population studies: Bulletin 139, 37.3. Gainesville,FL: University of <strong>Florida</strong>.5 26,216 in St. Lucie, 137,637 in Martin, and 126,829 in IndianRiver.6 U.S. Census Bureau. (2005, April). 2004 PopulationEstimates. Retrieved February 6, 2006 from http://www.census.gov/Press-Release/www/releases/archives/pio_table2_est2004.pdf; U.S. Census Bureau. (2005, April 14).Flagler, Fla. nation’s fastest-growing county. Newsroom. RetrievedJune 10, 2005 from http://www.census.gov/Press-Release/www/releases/archives/population/004654.html; <strong>Miami</strong>-Dade ranked number 12, Broward 16th, PalmBeach 8th, and St. Lucie County 43rd.7 From 2000 to 2004, growth rates were as follows: Monroe,2%; <strong>Miami</strong>-Dade, 6%; Broward, 6%; Palm Beach, 10%; Martin,9%; St. Lucie, 17%; and Indian River, 12%.8 U.S. Census Bureau. (2005, April). 2004 PopulationEstimates. Retrieved February 6, 2006 from http://www.census.gov/Press-Release/www/releases/archives/pio_table2_est2004.pdf; U.S. Census Bureau. (2005, April14). Flagler, Fla. nation’s fastest–growing county. Newsroom.Retrieved June 10, 2005 from http://www.census.gov/Press-Release/www/releases/archives/population/004654.html;U.S. Census Bureau. (2005, June 30).Port St. Lucie, Fla., <strong>is</strong> fastest–growing city, census bureausays. Newsroom. Retrieved June 30, 2005 from http://www.census.gov/Press-Release/www/releases/archives/population/005268.html; Broward grew from 96,390 inJuly 2003 to 101,486 in July 2004; St. Lucie grew 12% from105,707 to 118,396, 18th highest among cities with populationsover 100,000; Port St. Lucie also had the 7th largestnumerical increase, 12,700.9 Bureau of Economic and Business Research. (2004).<strong>Florida</strong> population studies: Bulletin 139, 37.3. Gainesville,FL: University of <strong>Florida</strong>; Bureau of Economic and BusinessResearch. (2005). <strong>Florida</strong> estimates of population2004. Gainesville, FL: University of <strong>Florida</strong>; The 2004 to2030 projected growth by county <strong>is</strong> Palm Beach 54%, St.Lucie 50%, Indian River 47%, Martin 47%, Broward 47%,<strong>Miami</strong>-Dade 33%, and Monroe 3%.10 <strong>South</strong> <strong>Florida</strong> Regional Planning Council. (n.d.). Demographics.Our Region. Data compiled by Richard Ogburn.Retrieved from http://www.sfrpc.com/region/demographics.htm.11 Ibid.12 Siegel, R. (2005, June 9). Interview with Jeffrey Passel;H<strong>is</strong>panics in the U.S.: Breaking down the numbers.[Audio Broadcast]. All Things Considered (NPR). Availablefrom http://www.npr.org/templates/story/story.php?storyId=4696640; Broward County Planning ServicesDiv<strong>is</strong>ion. (2005, May). Broward County Population ForecastingModel Update, 2005.13 Bureau of Economic and Business Research. (2004).<strong>Florida</strong> population studies: Bulletin 139, 37.3. Gainesville,61
FL: University of <strong>Florida</strong>; 2003 data <strong>is</strong> the most currentavailable for racial and ethnic population breakdown; 2004data not yet released as of January 2006.14 Bureau of Economic and Business Research. (2004).<strong>Florida</strong> Population Studies: Bulletin 139, 37.3. Gainesville,FL: University of <strong>Florida</strong>.15 Passel, J. (2005, June 14). Unauthorized migrants: numbersand character<strong>is</strong>tics. Washington, DC: Pew H<strong>is</strong>panic Center;An estimate for the number of illegal immigrants in theregion <strong>is</strong> not available, but in proportion to the region’sshare of the state’s population, it could be about 280,000(5% of the regional population).16 Bureau of Economic and Business Research. (2004).<strong>Florida</strong> Population Studies: Bulletin 139, 37.3. Gainesville,FL: University of <strong>Florida</strong>.17 Up from 17% in 2000.18 Bureau of Economic and Business Research. (2004).<strong>Florida</strong> Population Studies: Bulletin 139, 37.3. Gainesville,FL: University of <strong>Florida</strong>; 2003 data <strong>is</strong> the most currentavailable for the population’s age breakdown; 2004 data notyet released as of January 2006.19 Frey, W. (2005, June 9). Migrant policy could fractureAmerica. The Financial Times.20 In 2003, 37% of the youth population was non-H<strong>is</strong>panicwhite, 26% was black, and 34% was H<strong>is</strong>panic. Th<strong>is</strong> increasein H<strong>is</strong>panics <strong>is</strong> due to the age of the H<strong>is</strong>panic population—the median age of the H<strong>is</strong>panic population <strong>is</strong> ten yearsyounger than that of the white population. In addition,there <strong>is</strong> a large population of H<strong>is</strong>panic women under age40, and fertility rates are higher among H<strong>is</strong>panics; Siegel,R. (June 9, 2005). Interview with Jeffrey Passel; H<strong>is</strong>panicsin the U.S.: Breaking down the numbers. [Audio Broadcast].All Things Considered (NPR). Available from http://www.npr.org/templates/story/story.php?storyId=4696640; Seealso El Nasser, H. & Grant, L. (2005, June 9). Immigrationcauses age, race split. USA Today; El Nasser, H. & Grant, L.(2005, June 9). Diversity tints new kind of generation gap.USA Today.21 In 2003, its composition was 44% white, 19% black, and 35%H<strong>is</strong>panic.22 In 2003, 67% of seniors were white, 7% were black, and 24%were H<strong>is</strong>panic; There <strong>is</strong> projected to be only a slight shiftby 2030, to 62% white, 11% black, and 26% H<strong>is</strong>panic.23 Bureau of Economic and Business Research. (2004)<strong>Florida</strong> Population Studies: Bulletin 139, 37.3. Gainesville,FL: University of <strong>Florida</strong>; In 2003, 19% of the populationwas under 18 years old, the working age population was57%, and the senior population was 25%.24 U.S. Census Bureau. American Community Survey.(2005). 2003 Multi-year profiles. Retrieved July 11, 2005from http://www.census.gov/acs/www/Products/Profiles/Chg/2003/ACS/index.htm;In 2003, they were 10%in Broward, 12% in Palm Beach, and 18% in <strong>Miami</strong>-Dade.From 2000 to 2003, the state rate was cons<strong>is</strong>tent at 13%.The national rate remained at 12% from 2000 to 2002 thenhit 13% in 2003.25 U.S. Census Bureau. American Community Survey.(2005). Data profiles (2002-2004 Multi-year profiles).Retrieved July 11, 2005 from http://www.census.gov/acs/www/Products/index.htm.26 U.S. Census Bureau. American Community Survey. (2005).2003 Multi-year profiles. Retrieved July 11, 2005 fromhttp://www.census.gov/acs/www/Products/Profiles/Chg/2003/ACS/index.htm; In <strong>Miami</strong>-Dade, 24% of youthand 23% of senior citizens live in poverty. In BrowardCounty, the poverty rate among the youth <strong>is</strong> 16% and therate for senior citizens, 10%. In Palm Beach County, theyouth poverty rate <strong>is</strong> 13% and the senior poverty rate <strong>is</strong> 8%.27 Education Information & Accountability Services. <strong>Florida</strong>Department of Education. (2004, April). <strong>Florida</strong> InformationNote 2004-22F: Free/reduced price lunch eligibility.Rates are 36% in Monroe, 40% in Broward, 42% in PalmBeach, 32% in Martin, 40% in Indian River, 63% in <strong>Miami</strong>-Dade, and 52% in St. Lucie counties.28 49% in <strong>Miami</strong>-Dade, 41% in Broward, 39% in Palm Beach.29 National Low Income Housing Coalition. (2004). Out ofreach-2004.30 U.S. Census Bureau. American Community Survey.(2005). 2003 Multi-year profiles. Retrieved July 12, 2005from http://www.census.gov/acs/www/Products/Profiles/Chg/2003/ACS/index.htm.31 Swanstrom, T., et al. (2004, October). Pulling apart:Economic segregation among suburbs and central cities inmajor metropolitan areas. Washington, D.C.: MetropolitanPolicy Program, Brookings Institution.32 <strong>Florida</strong> Taxwatch Center for Educational Performance &Accountability. (2005, February). <strong>Florida</strong>’s financial commitmentto K-12 education: How much money <strong>is</strong> enough?33 Department of Education. (2005). School d<strong>is</strong>trict data.Your <strong>Florida</strong> Department of Education. Retrieved October4, 2005 from http://www.firn.edu/doe/eias/flmove/county.htm.34 <strong>Florida</strong> Taxwatch Center for Educational Performance &Accountability. (2005, February). <strong>Florida</strong>’s financial commitmentto K-12 education: How much money <strong>is</strong> enough?35 “A” schools increased from 33% of schools in 2001/02to 47% in 2003/04. In that same time period, “B” schoolsdecreased slightly from 20% to 17%, “C” schools decreasedfrom 32% to 25%, “D” schools decreased from 12% to 9%,and “F” schools increased from 2% to 4% percent.36 Two schools that received Fs that have less than 90%lunch program eligibility are special needs schools for thementally and physically d<strong>is</strong>abled and were graded for thefirst time th<strong>is</strong> year. In <strong>Miami</strong>-Dade, one of the F schools <strong>is</strong>a special needs school.37 <strong>Florida</strong> Department of Education. (2005). School d<strong>is</strong>trictdata. Your <strong>Florida</strong> Department of Education. RetrievedJuly 25, 2005. Data available from http://schoolgrades.fldoe.org/0405/.38 <strong>Florida</strong> Department of Education. (2005). Reports: EducationInformation & Accountability Services. Your <strong>Florida</strong>Department of Education. Retrieved July 15, 2005. Dataavailable from http://www.firn.edu/doe/eias/eiaspubs/reports.htm; <strong>Miami</strong>-Dade increased from 53% in 1998/99.Broward and Palm Beach increased from 54% and 58%,respectively, in 1998/99. In <strong>Miami</strong>-Dade graduation ratesincreased to 61% in 2003/04. Broward and Palm Beachgraduation rates both reached 66% and Martin, St. Lucie,and Indian River counties reached more than 80%.39 Education Information & Accountability Services. <strong>Florida</strong>62
Department of Education. (2005, April). Stat<strong>is</strong>tical Brief,2005-20B: <strong>Florida</strong>’s public high school graduation rates,2004/05; In 2003/04, graduation rates for white studentsranged from 74% in <strong>Miami</strong>-Dade to 90% in Martin County.For black students they ranged from 48% in Palm BeachCounty to 70% in Martin County. H<strong>is</strong>panic graduation ratesranged from 57% in Palm Beach County to 76% in St. LucieCounty.40 The dropout rates in 2003/04 were 4% in Monroe, 5% in<strong>Miami</strong>-Dade, 1% in Broward, 3% in Palm Beach, 1% in Martin,3% in St. Lucie, 1% in Indian River, and 3% in <strong>Florida</strong>.41 Education Information & Accountability Services. <strong>Florida</strong>Department of Education (2005, January). <strong>Florida</strong> InformationNote, 2005-14F: Dropout demographics in <strong>Florida</strong>’s publicschools, and dropout rates; Among blacks, dropout ratesgenerally range from 1% to 5%, but reach 7% in MonroeCounty. Among H<strong>is</strong>panics, rates generally range from 1% to5%, but reach 6% in Monroe County; Dropout rates amongwhites range from 0.4% to 3.5%.42 <strong>South</strong> <strong>Florida</strong>’s mean score in 2002/03 was 989, comparedto a state score of 996 and a national score of 1026.43 The College Board SAT. (2003). <strong>Florida</strong> Report- 2003 College-boundseniors: A profile of SAT program test takers. RetrievedJuly 10, 2005 from http://www.collegeboard.com/prod_downloads/about/news_info/cbsenior/yr2003/pdf/2003_FLORIDA.pdf; Average SAT scores were 992 inMonroe, 930 in <strong>Miami</strong>-Dade, 967 in Broward, 1004 in PalmBeach, 1015 in Martin, 994 in St. Lucie, and 1023 in IndianRiver.44 Department of Education. (2005). Profile of <strong>Florida</strong> schoold<strong>is</strong>tricts: Financial data. <strong>Florida</strong> Department of Education.Retrieved July 4, 2005 from http://www.firn.edu/doe/fefp/profile.htm; <strong>Florida</strong> Department of Education. Data file ofSAT scores for all seniors in <strong>Florida</strong> public schools in theClass of 2004. For the seven d<strong>is</strong>tricts requested (Broward,<strong>Miami</strong>/Dade, Indian River, Martin, Monroe, Palm Beach,St. Lucie) a table was built by Martha Miller to show thenumber of 2004 test takers, verbal score, math score, andthe combined score for the following racial-ethnic groups:white non-H<strong>is</strong>panic, African American, H<strong>is</strong>panic, Asian, andother (Native American + Multiracial); <strong>Florida</strong> Departmentof Education. (2004, August). SAT Trends: <strong>Florida</strong> and theNation. Retrieved July 4, 2005 from http://www.firn.edu/doe/evaluation/pdf/sat.pdf; In the region, in 2004 the averagescores of black students ranged between 124 and 240points lower than white students. Among H<strong>is</strong>panic students,there was a 10 to 100 point lag.45 <strong>Florida</strong> Department of Education. (2004, August). SATtrends: <strong>Florida</strong> and the Nation. Retrieved July 4, 2005 fromhttp://www.firn.edu/doe/evaluation/pdf/sat.pdf.46 <strong>Florida</strong> Taxwatch Center for Educational Performance & Accountability.(2005, February). <strong>Florida</strong>’s financial commitmentto K-12 education: How much money <strong>is</strong> enough?; Forster, G.,& Greene, H. (2004, September). The teachability index: Cand<strong>is</strong>advantaged students learn? New York: Manhattan Institute.47 Education Trust, Inc. (2004, Spring). Education watch:<strong>Florida</strong> key education facts and figures; <strong>Florida</strong> TaxwatchCenter for Educational Performance & Accountability.(2005, February). <strong>Florida</strong>’s financial commitment to K-12education: How much money <strong>is</strong> enough?48 Hobbs, E. (2005, June 11). Judge d<strong>is</strong>m<strong>is</strong>ses lawsuit onschool-funding formula. Sun-Sentinel, p. 7B; (2005, June15). Lawmakers put politics ahead of our children. Keynoter,p. 649 <strong>Florida</strong> Taxwatch Center for Educational Performance &Accountability. (2005, February). <strong>Florida</strong>’s financial commitmentto K-12 education: How much money <strong>is</strong> enough?;Council for Education Policy, Research and Improvement.(2003, December). Career education: <strong>Florida</strong>’s forgotteneconomic development plans. Insight, 1.2.50 The rate for these counties <strong>is</strong> 65%.51 <strong>Florida</strong> Department of Education. <strong>Florida</strong> Education& Training Placement Information Program. (2004,October). 2002-03 <strong>Florida</strong> public high school graduates’outcomes by ethnicity & gender; See also <strong>Florida</strong> Educationand Training Placement Information Program; In Monroe,<strong>Miami</strong>-Dade, and Broward counties, 65% of high schoolgraduates go on to post-secondary education. In PalmBeach, St. Lucie, and Indian River counties, the rate <strong>is</strong> justbelow 60%, and in Martin County it <strong>is</strong> 68%.52 Ibid.; These numbers do not include students who wentto post-secondary school in another state; Rates amongwhite students ranged from 67% in Palm Beach County to71% in Broward and <strong>Miami</strong>-Dade counties. Among blackstudents, they ranged from 48% in Palm Beach to 56% and58% in Broward and <strong>Miami</strong>-Dade counties. Likew<strong>is</strong>e, ratesamong H<strong>is</strong>panic students were lowest in Palm Beach (55%)and reached 63% and 66% in Broward and <strong>Miami</strong>-Dadecounties.53 These include <strong>Florida</strong> International University, University of<strong>Miami</strong>, St. Thomas University, Nova <strong>South</strong>eastern University,and Barry University. Data was not available by raceand ethnicity for Lynn University and Palm Beach AtlanticUniversity, which account for only 5% of <strong>South</strong> <strong>Florida</strong> collegestudents.54 Individual university factbooks: <strong>Florida</strong> Atlantic University.(2005). Data archives: Factbooks. Data available fromhttp://iea.fau.edu/inst/arch.htm, <strong>Florida</strong> InternationalUniversity. (2004). Planning & institutional effectiveness:Factbooks. Data available from http://www.fiu.edu/~opie/spdi/fbhome.htm, University of <strong>Miami</strong>, Planning andInstitutional Research. (2005). Factbook. Data availablefrom http://www.miami.edu/UMH/CDA/UMH_Main/0,1770,2409-1;42532-3,00.html, Nova <strong>South</strong>easternUniversity, Research Planning and Governmental Affairs.(2006. NSU factbook. Data available from http://www.nova.edu/rpga/factbook/, <strong>Florida</strong> Community College System.(2005). Community college fact book library. Data availablefrom http://www.firn.edu/doe/arm/cctcm<strong>is</strong>/pubs/factbook/factbook_main.htm;Th<strong>is</strong> does vary by university.For instance 60% of <strong>Florida</strong> International Universitystudents were H<strong>is</strong>panic and 21% white. At <strong>Florida</strong> AtlanticUniversity, 59% were white and 17% H<strong>is</strong>panic. Black studentscompr<strong>is</strong>ed about 15% of students at each.55 About 85% of total students at <strong>Florida</strong> Atlantic Universityand <strong>Florida</strong> International University are from the region.56 <strong>Florida</strong> Atlantic University, Office of Institutional Effectiveness& Analys<strong>is</strong>. (2005). Headcount enrollment by stateresidency, Fall 1999-2004. Retrieved July 10, 2005 fromhttp://www.fau.edu/academic/iea//factbk/state04.htm;<strong>Florida</strong> International University, Office of Planning andInstitutional Effectiveness. (2005). Fall 2004 Enrollment63
y <strong>Florida</strong> county. Institutional Research. Retrieved July 10,2005 from http://www.fiu.edu/~opie/fb04_county04.htm;University of <strong>Miami</strong>. (2005). Fact finder 2004-2005. AboutUM. Retrieved July 10, 2005 from http://www.miami.edu/facts/; Within the community colleges, the racial andethnic d<strong>is</strong>tribution was 3% white, 22% black, 38% H<strong>is</strong>panicand 9% other. Within the universities, the d<strong>is</strong>tribution was40% white, 17% black, 30% H<strong>is</strong>panic, and 12% other.57 Almost 9,000 completed their Associate of Arts programs,while just above 3,000 completed their Associate of Scienceprograms. Over two-thousand received vocational ortechnical certificates.58 Department of Education. (2005, February). The factbook:Report for the <strong>Florida</strong> Community College System. RetrievedJuly 5, 2005 from http://www.firn.edu/doe/arm/cctcm<strong>is</strong>/pubs/factbook/fb2005/factbk05.pdf.59 <strong>Florida</strong> Atlantic University, <strong>Florida</strong> International University,University of <strong>Miami</strong>, and Nova <strong>South</strong>eastern.60 Individual university factbooks: See endnote 54.61 Graduation rates are only available for the whole studentbody at the public universities. They are not available forthe private universities or by race and ethnicity.62 <strong>Florida</strong> Department of Education. (2005). Report on stateuniversity system accountability measures, December, 2004.Retrieved July 10, 2005 from http://www.flbog.org/planning/accountreport/2004_UnivAccountReport.pdf;<strong>Florida</strong>Atlantic University’s graduation rate was 35%, <strong>Florida</strong> InternationalUniversity’s graduation rate was 47%. <strong>Florida</strong>’s<strong>is</strong> 58%.63 Bureau of Economic and Business Research. WarringtonCollege of Business Admin<strong>is</strong>tration. (1998-2004). <strong>Florida</strong>stat<strong>is</strong>tical abstract. Gainesville: University of <strong>Florida</strong>; Voters:2004 Data retrieved from individual county electoraldepartments.64 The other core counties, Broward and Palm Beach, declined15% and 8%, respectively.65 650 in 2003/04.66 <strong>Florida</strong> Department of Juvenile Justice. (2005). 2004-2005 Delinquency profile. Retrieved August, 2005. Dataavailable from http://www.djj.state.fl.us/Research/Delinquency_Profile/0405_Profile.html;Broward, Palm Beach,St. Lucie, and Indian River counties all had slight increasesof about one percent. Monroe County had a large increaseof 10%.PLACE1 Comprehensive Everglades restoration plan. 2005 Report toCongress (8-23-05 Draft); <strong>South</strong> <strong>Florida</strong> Water ManagementD<strong>is</strong>trict. (2004, November/December). Water Matters.West Palm Beach: <strong>South</strong> <strong>Florida</strong> Water ManagementD<strong>is</strong>trict.2 Comprehensive Everglades restoration plan. 2005 Report toCongress (8-23-05 Draft).3 King, R.P. (2006, January 26). Environmental<strong>is</strong>ts call Evergladesrestoration lacking. Palm Beach Post. RetrievedJanuary 30, 2006 from http://www.palmbeachpost.com/.4 Land Acqu<strong>is</strong>ition Task Team, <strong>South</strong> <strong>Florida</strong> EcosystemRestoration Task Force. (2004, December 1). <strong>South</strong><strong>Florida</strong> ecosystem restoration land acqu<strong>is</strong>ition strategy;Comprehensive Everglades restoration plan. 2005 Reportto Congress (8-23-05 Draft); As of December 2004, 271,853acres had been acquired for water projects (56%) of whichhave already been acquired, 1,686,844 (99%) had been acquiredfor habitat restoration, and 166,000 (51%) had beenacquired for CERP projects and overlap with land for otherwater and habitat projects.5 <strong>South</strong> <strong>Florida</strong> Ecosystem Restoration Task Force. (2004,September 15). Coordinating success 2004: Strategy forthe restoration of the <strong>South</strong> <strong>Florida</strong> ecosystem and trackingsuccess: Biennial report for August 2002-July 2004 (Draft5). Snowy Egrets and Tri-colored Herons are countedtogether; Call, E., & Cook, M. (Eds.). (2005, September).Wading Bird Report (Vol. 11). West Palm Beach, FL: <strong>South</strong><strong>Florida</strong> Water Management D<strong>is</strong>trict; Cook, M., & Grozier,G. (2004, November). Wading Bird Report (Vol. 10).West Palm Beach, FL: <strong>South</strong> <strong>Florida</strong> Water ManagementD<strong>is</strong>trict.6 <strong>South</strong> <strong>Florida</strong> Water Management D<strong>is</strong>trict. (2004, June).UEC water supply plan; Lou<strong>is</strong> Woehlcke, <strong>South</strong> <strong>Florida</strong>Water Management D<strong>is</strong>trict. (2005, June 13). LEC watersupply plan update: Baseline projections of public watersupply (personal communication, September 7, 2005); Thepopulation projections used in the UEC WSP are 319,426in 2000 and 484,900 in 2025. However, the population <strong>is</strong>growing faster than was expected at the time of the UECPlan, making water demand projections a little lower thanmight now be expected.7 Div<strong>is</strong>ion of Water Resource Management. <strong>Florida</strong> Departmentof Environmental Protection. (2005, June). 2004Reuse Inventory.8 FL. Stat., Ch. 2005 § 290 (2005).9 Dewitt, D. (2005, May 22). Bill plays catch-up with state’sgrowth. Sun-Sentinel, p. 5B; FL. SB 444 (2005); <strong>Florida</strong>Department of Environmental Protection. (2004). PressRelease: Secretaries applaud passage of growth managementreform. (2005, May 12). Retrieved September7, 2005 from http://www.dep.state.fl.us/secretary/news/2005/05/0512_01.htm.10 R. McTear, <strong>Florida</strong> Department of Environmental Protection.(personal communication, February 16, 2005); Oncecontamination <strong>is</strong> identified and TMDLs establ<strong>is</strong>hed, theBasin Management Action Plan will be developed andimplemented to achieve the TMDL. Th<strong>is</strong> information <strong>is</strong> notofficially signed by the Secretary and could change whennew data becomes available.11 Critics argue that constantly rebuilding the shoreline reducesbiological diversity, impacts local f<strong>is</strong>hing, and harmsnear-shore reefs. They advocate for the reassessment ofcoastal development policies.12 Roxanne Dow, <strong>Florida</strong> Department of EnvironmentalProtection. (personal communication, September 21, 2005);<strong>Florida</strong> Department of Environmental Protection. (2004).Beach erosion control program, Bureau of Beaches andCoastal Systems. Retrieved October 21, 2004 from http://www.dep.state.fl.us/beaches/programs/bcherosn.htm;Bureau of Beaches and Coastal Systems. (2005, June).Critically eroded beaches in <strong>Florida</strong>. <strong>Florida</strong> Departmentof Environmental Protection. Div<strong>is</strong>ion of Water ResourceManagement. Over 475 miles of the state’s 825 miles of64
eaches were eroded; 365 were critically eroded. <strong>South</strong><strong>Florida</strong> had 130 miles of erosion, 121 were critically eroded.13 From 724 in 2003 to 904 in 2004.14 <strong>Florida</strong> Department of Health. (2004). <strong>Florida</strong> healthybeaches program. (2004). Data available from http://esetappsdoh.doh.state.fl.us/irm00beachwater/default.aspx;Carney, K., & Hammond, R. (2004, Spring/Summer).Coastal water quality and the public. Coastal Currents.<strong>Florida</strong> Coastal Management Program.15 National Resources Defense Council. (2005, July). Testingthe waters: A guide to water quality at vacation beaches.16 Clean Beaches Council. (2005). Blue wave beaches of<strong>Florida</strong>. Data available from http://www.cleanbeaches.org/bluewave/fl.cfm; Clean Beaches Council honors Broward.(2004, June 25). <strong>South</strong> <strong>Florida</strong> Business Journal.17 Bureau of Business and Economic Research. (2005)<strong>Florida</strong> Stat<strong>is</strong>tical Abstract 2005. Gainesville, FL: Universityof <strong>Florida</strong>; In Monroe County, catches fell from 11million pounds in 2000 to 7 million pounds in 2001, butbegan increasing, reaching 8.1 million in 2003; ExcludingMonroe County, shellf<strong>is</strong>h catches went from 1.2 millionpounds in 1990 to 2.5 million in 2000, but fell to 1.1 millionby 2003.18 F<strong>is</strong>h landings decreased from 23.5 million pounds in 1990to 13.7 million pounds in 2000. They rose slightly to 14.6million by 2003.19 <strong>Florida</strong> Natural Areas Inventory, <strong>Florida</strong> Resources andEnvironmental Analys<strong>is</strong> Center, <strong>Florida</strong> State University.Data. Data available from http://www.fnai.org/data.cfm;National Agricultural Stat<strong>is</strong>tics Service, U.S. Departmentof Agriculture. (2004). 2002 Census of Agriculture. NationalTechnical Information Service. Retrieved February20, 2006 from http://www.nt<strong>is</strong>.gov/products/census_agriculture.asp?loc=4-1-0.20 Broward County Office of Urban Planning and Redevelopment,Planning Services Div<strong>is</strong>ion. (2004, March) “The<strong>South</strong>east <strong>Florida</strong> MSA.” Broward-by-the-Numbers (20).21 Burchell, R., et al. (2005, November). Sprawl costs:Economic impacts of unchecked development. Washington,DC.: Island Press. Th<strong>is</strong> includes Okeechobee, Glades andHendry counties, which are included in the <strong>Miami</strong>-FortLauderdale Economic Area analyzed in Costs of sprawl—2000 and Sprawl costs: Economic impacts of uncheckeddevelopment.22 Burchell, R., et al. (2002). Costs of sprawl—2000. TCRPReport 74 Washington, D.C.: National Academy Press;Palm Beach and Broward counties are numbers three andfive, respectively, on the sprawl index.23 In the Brookings study, <strong>South</strong> <strong>Florida</strong> includes <strong>Miami</strong>-Dade, Broward, and Palm Beach counties.24 The other 12 cities that were studied are Atlanta, Boston,Chicago, Dallas, Detroit, Denver, Houston, Los Angeles,New York, Philadelphia, San Franc<strong>is</strong>co, and Washington,D.C.25 Lang, R. E. (2003, March). Beyond edge city: Office sprawlin south <strong>Florida</strong>. Washington, D.C.: The Brookings InstitutionCenter on Urban and Metropolitan Policy.26 Ibid.; Gorden, P. & Richardson, H. (1994). “Congestiontrends in metropolitan areas.” In Curbing gridlock: Peak periodfees to relieve traffic congestion. Washington: NationalAcademy Press; Crane, R. (1996). Cars and drivers in thenew suburb: Linking access to travel in neo-traditionalplanning. Journal of the American Planning Association, 62:51-65.27 As of now, residents of Indian River County are hopingto avoid overdevelopment. A recent voter opinion surveyidentified the most important problem facing Indian Riveras “limiting growth and development (36%).” Seventy-sixpercent felt that Indian River <strong>is</strong> growing and developingtoo fast, and 68 percent were “very concerned” that IndianRiver would become as developed as Palm Beach withsimilar congestion and growth problems. Trust for PublicLand. (2004, May 26). Strong support for <strong>Florida</strong> countyconservation bond.28 Committee for a Sustainable Treasure Coast. (2005, September).Committee for a sustainable treasure coast- Finalreport. (04-61).29 National Agricultural Stat<strong>is</strong>tics Service, U.S. Departmentof Agriculture. (2004). 2002 Census of Agriculture. NationalTechnical Information Service. Retrieved February20, 2006 from http://www.nt<strong>is</strong>.gov/products/census_agriculture.asp?loc=4-1-0.30 Committee for a Sustainable Treasure Coast. (2005,February). The challenge of growth: Interim report. FortLauderdale, FL: The Center for Urban and EnvironmentalSolutions, <strong>Florida</strong> Atlantic University; Chr<strong>is</strong>zt, M. (2004).Hurricanes ra<strong>is</strong>e questions about <strong>Florida</strong>’s outlook.Econ<strong>South</strong>, 6.4; University of <strong>Florida</strong> Institute of Food andAgricultural Sciences. (2002, April). <strong>Miami</strong>-Dade countyagricultural land retention study: Summary and recommendations(Vol. 1). The <strong>Miami</strong>-Dade County AgriculturalLand Retention Study and the Committee for a SustainableTreasure Coast are exploring ways to realize the retentionof these invaluable lands.31 Ibid.32 Trust for Public Land. (2005). LandVote Database.RetrievedDecember 8, 2004. Data available from http://www.tpl.org/tier3_cdl.cfm?content_item_id=12010&folder_id=2386.33 National Association of Realtors. Quarterly median pricesin the Port St. Lucie-Fort Pierce MSA are not reported bythe National Association of Realtors; West Palm Beach-Boca Raton, <strong>Miami</strong>-Hialeah and Fort Lauderdale-Hollywood-PompanoBeach ranked 3, 5, and 9, respectively withmedian price increases of 36%, 32%, and 28% for ex<strong>is</strong>tingsingle-family homes from first quarter 2004 to first quarter2005.34 Bureau of Business and Economic Research. (2005)<strong>Florida</strong> Stat<strong>is</strong>tical Abstract 2005. Gainesville, FL: Universityof <strong>Florida</strong>; U.S. Census Bureau. (2005). New residentialconstruction (2004). Retrieved September 15, 2005. Dataavailable from http://www.census.gov/const/www/newresconstindex.html;No data <strong>is</strong> available for 2004 forMonroe County. The 12% change <strong>is</strong> from 1994 to 2003;In St. Lucie and Indian River counties, new residentialpermits increased 343% and 249%, respectively, from 1995to 2004, compared to <strong>Miami</strong>-Dade at 102%, Palm Beach at25%, Martin at 22% and Monroe at 12%. In Broward County,permits were down 45% from a high of 15,728 in 1994.35 Nelson, A. (2004, December). Toward a new metropol<strong>is</strong>:The opportunity to rebuild America. Washington, DC:Brookings Institution.65
36 <strong>Florida</strong> Association of Realtors; Median prices were $363,800 in<strong>Miami</strong> MSA, $385,600 in Fort Lauderdale MSA, and $391,600 inWest Palm Beach MSA.37 The market peaked four or five months ago. (2005, December18). Palm Beach Post.38 REALTOR Association of Greater <strong>Miami</strong> & the Beaches. (n.d.).Data available from http://www.miamire.com/.39 <strong>Florida</strong> Housing Data Clearinghouse, University of <strong>Florida</strong>.(n.d.). Regional and local profiles. <strong>Florida</strong> Housing Data Clearinghouse:Improving housing dec<strong>is</strong>ions. Retrieved January 10,2006 from http://www.flhousingdata.shimberg.ufl.edu/; Thepercentage of homeowners paying 30% or more of their incomefor housing <strong>is</strong> 28% in Broward, 27% in <strong>Miami</strong>, 25% in PalmBeach, 23% in Monroe, 21% in St. Lucie, 21% in Indian River, and20% in Martin. <strong>Miami</strong>-Dade has 11% and Broward has 10% ofhomeowner households paying more than 50% of their incomeon housing.40 National Association of Home Builders. Housing OpportunityIndex: 4th Quarter 2005. Retrieved February 23, 2005 fromhttp://www.nahb.org.41 In 2005, police officers salaries were below that needed to purchasea home: <strong>Miami</strong> MSA (38% below), Fort Lauderdale MSA(33% below) and West Palm Beach-Boca Raton MSA (43% below);For elementary school teachers, the difference ranged from 31%to 42% in the region, compared to 16% to 25% in <strong>Florida</strong>’s othermajor MSAs; Lipman, B. (2001, January). Paycheck to paycheck:Working families and the cost of housing in America. Washington,DC: Center for Housing Policy; Fiore, M. & Lipman, B. (2003,May). Paycheck to paycheck: Wages and the cost of housing inAmerica. Washington, DC: National Housing Conference, Centerfor Housing Policy; (2005). Center for Housing Policy. Paycheckto paycheck – 2005 findings. Retrieved January 18. Data availablefrom http://www.centerforhousingpolicy.org/42 National Low Income Housing Coalition. (2005). Up against awall (11/04): Housing affordability for Renters: An analys<strong>is</strong> ofthe 2003 American Community Survey. NLIHC Publications. RetrievedFebruary 9, 2006 from http://www.nlihc.org/pubs/index.htm#uaw;<strong>Florida</strong> Housing Data Clearinghouse, Universityof <strong>Florida</strong>. (n.d.). Regional and local Profiles. <strong>Florida</strong> HousingData Clearinghouse: Improving housing dec<strong>is</strong>ions. RetrievedJanuary 10, 2006 from http://www.flhousingdata.shimberg.ufl.edu/. The percentage of renters who pay 30% or more of theirincome toward rent increased by 23% in <strong>Miami</strong>-Dade, Broward,and Martin counties, by 18% in Palm Beach County, by 39% inSt. Lucie, and by 13% in Indian River from 1998 to 2003. MonroeCounty <strong>is</strong> the only county that had a decline (4%).43 Leslie Warren, Special Programs Analyst, <strong>Florida</strong> HousingFinance Corporation. (personal communication, January 24,2005).44 <strong>Florida</strong> Impact. (2005). Update 2005: A report on leg<strong>is</strong>lative actionon <strong>is</strong>sues of economic justice. Tallahassee, FL: Harvest Printing& Copy Center, Inc.; <strong>Florida</strong> Housing Coalition. (n.d.). Callsfor a return to full funding for housing in FY06-07. RetrievedFebruary 8, 2006 from http://www.flhousing.org/uploadedcontentfiles/talking%20points.pdf.45 Lomax, T., & Schrank, D. (2005). The 2005 urban mobility report.College Station, TX: Texas Transportation Institute, TexasA&M University; The annual delay per peak hour driver was 39hours in 1993 and 11 hours in 1983.46 Monica Zhong, Office of Policy Planning, <strong>Florida</strong> Departmentof Transportation. (personal communication, March 4, 2005);<strong>Florida</strong> Department of Transportation.(2005). Public road mileagereports 1997-2003. Retreived from http://www.dot.state.fl.us/planning/stat<strong>is</strong>tics/mileagereports/default.htm#public.47 Lomax, T., & Schrank, D. (2005). The 2005 urban mobility report.College Station, TX: Texas Transportation Institute, TexasA&M University.48 The largest increases will be in Broward (112%), Palm Beach(140%), St. Lucie (117%), and Indian River (108%) counties.49 Increases in Per Capita VMT: Monroe (36 %), <strong>Miami</strong>-Dade (31%),Broward (29%), Martin (16%), St. Lucie (26%), and Indian River(26%); Monica Zhong, Office of Policy Planning, <strong>Florida</strong> Departmentof Transportation. (personal communication, March 4,2005); <strong>Florida</strong> Department of Transportation.(2005). Public roadmileage reports 1997-2003. Retrieved from http://www.dot.state.fl.us/planning/stat<strong>is</strong>tics/mileagereports/default.htm#public.50 County Transit Departments; Bus ridership increased 60% inBroward and 178% in Palm Beach County from 1994 to 2004.51 <strong>South</strong> <strong>Florida</strong> Regional Transportation Authority marketingdepartment. Tri-rail ridership increased over 300% from 1989 to1994. It declined from 1994 to 1999 but began another upwardtrend, increasing 29% from 1999 to 2004.52 Gibson, W. E. (2005, November 19). A huge boost for south<strong>Florida</strong>. Sun-Sentinel; Shaw secures millions for <strong>South</strong> <strong>Florida</strong> intransportation needs. (2005, November 18). Retrieved December20, 2005 from http://shaw.house.gov/.53 <strong>South</strong> <strong>Florida</strong> Regional Transportation Authority. (n.d.)Retrieved from http://www.tri-rail.com/double_tracking/fact_sheet.htm. The Segment 5 Project <strong>is</strong> the final stage of th<strong>is</strong>project. It cons<strong>is</strong>ts of 45 miles, some of which <strong>is</strong> in the southernpart of Broward County, with the remainder in the southern halfof Palm Beach County. In addition, the SFRTA has initiated theJupiter Corridor Alternatives Analys<strong>is</strong> to evaluate opportunitiesto provide transit in northern Palm Beach County.54 <strong>South</strong> <strong>Florida</strong> Regional Planning Council. (2005, March 1).Funding the future: The case for establ<strong>is</strong>hing dedicated longtermfunding sources for the region’s transit needs. Hollywood,FL: <strong>South</strong> <strong>Florida</strong> Regional Planning Council; Virginia Diaz,External Affairs Director, Citizen’s Independent TransportationTrust. (personal communication, May 11, 2005).55 <strong>South</strong> <strong>Florida</strong> Regional Planning Council. (2005, March 1).Funding the future: The case for establ<strong>is</strong>hing dedicated long-termfunding sources for the region’s transit needs. Hollywood, FL:<strong>South</strong> <strong>Florida</strong> Regional Planning Council.56 Mcginness, C. (2006, January 30). Transportation council targetsregional projects. Palm Beach Post. Retrieved January 30,2006 from http://www.palmbeachpost.com/.57 Chr<strong>is</strong>zt, M. (2004). Hurricanes ra<strong>is</strong>e questions about <strong>Florida</strong>’soutlook. Econ<strong>South</strong>, 6.4.; Avery, D., et al. (2004). <strong>South</strong>east’seconomy on stable course. Econ<strong>South</strong>, 6.4.; Insurance InformationInstitute. (n.d.). Presentations: Hurricane season of 2005:Impacts on US P/C Insurance Markets in 2006 & Beyond.Media. Retrieved February 1, 2006. Presentation available fromhttp://www.iii.org/media/presentations/katrina/.58 Finkl, C., et al. (2002, April 2002 Proposal). <strong>Florida</strong> hurricanemitigation alliance. <strong>Florida</strong> Atlantic University.59 Lunsford, D., & Stabley, S. (2005, September 26). A majorhurricane here could dwarf cost in New Orleans. <strong>South</strong> <strong>Florida</strong>Business Journal.60 Editorial: Can we afford cost of storms? (2005, December20). TCPalm. Retrieved December 22, 2005 from http://www.tcpalm.com.61 Bureau of Beaches and Coastal Systems, Div<strong>is</strong>ion of WaterResource Management, <strong>Florida</strong> Department of EnvironmentalProtection. (2004, November 30). 2004 hurricane recovery planfor <strong>Florida</strong>’s beach and dune system; Individual Counties CoastalManagement Departments.62 Cato, J. (2005, September 29). Hurricanes and tropical storms:66
Higher frequency for the future. <strong>Florida</strong> Sea Grant.63 Two different calculations are given by the Shimberg Center forAffordable Housing, 113,620 and 116,593.64 29,720 homes.65 FEMA data and Affordable Housing Ass<strong>is</strong>tance data compiledby the Shimberg Center for Affordable Housing, December2004. Comparable data <strong>is</strong> not currently available for rentalunits. Statewide, an additional 146,754 households, includingowner and rental, received non-structural housing ass<strong>is</strong>tanceand 663,893 applied but were not eligible for FEMA housingass<strong>is</strong>tance.66 Damaged structures included 31 in Martin County, 140 in St.Lucie, and 288 in Indian River; Bureau of Beaches and CoastalSystems. <strong>Florida</strong> Department of Environmental Protection.(2004, October). Hurricane Frances & Hurricane Jeanne: Poststormbeach conditions and coastal impact Report. RetrievedFebruary 20, 2006 from http://bcs.dep.state.fl.us/reports/franjean/Hurricanes_Frances_&_Jeanne/Full_Report/Full_Report.pdf.67 Haggman, M. (2005, November 3). D<strong>is</strong>placed in ‘cr<strong>is</strong><strong>is</strong>’ ofaffordable housing. <strong>Miami</strong> Herald; McNeal, N., et al. (2005,November 3). Thousands homeless; agencies strapped. <strong>Miami</strong>Herald.68 <strong>Florida</strong> Housing Coalition. (n.d.). Calls for a return to fullfunding for housing in FY06-07. Retrieved February 8, 2006from http://www.flhousing.org/uploadedcontentfiles/talking%20points.pdf.69 National Association of Home Builders. (2005). Housing OpportunityIndex: 4th Quarter 2005. Retrieved February 23, 2006from http://www.nahb.org; Proportion of homes affordable formedian income households in <strong>South</strong> <strong>Florida</strong> metropolitan areas:Ft. Lauderdale 32.2%, WPB 30.4%, Port St. Lucie-Ft. Pierce22.1%, <strong>Miami</strong> 13.7%. In other regional MSAs: Pensacola 57%,Jacksonville 56.8%, Tampa 42.3%, Orlando 34.2%.PROSPERITY1 Burchell, R., et al. (2002) Costs of sprawl – 2000. TCRP Report74. Washington, D.C.: National Academy Press.2 Jeannette Sanchez, Broward County Aviation Department, Ft.Lauderdale-Hollywood Int’l Airport. (personal communication,February 7, 2006).3 Heintz, J., et al. (2005). Decent work in America: The state-by-statework environment index, 2005. Amherst, MA: Political EconomyResearch Institute, University of Massachusetts-Amherst;Wages are adjusted for statewide cost of living in the index.4 Geographic Solutions. (2004). Labor market analys<strong>is</strong>. LaborMarket Stat<strong>is</strong>tics, <strong>Florida</strong> Research and Economic Database. Dataavailable from http://fred.labormarketinfo.com/; See the sectionbelow about employment sectors for additional informationabout job projections to 2012.5 Geographic Solutions. (2004). Labor market analys<strong>is</strong>. LaborMarket Stat<strong>is</strong>tics, <strong>Florida</strong> Research and Economic Database. Dataavailable from http://fred.labormarketinfo.com/.6 Ibid.7 Between 1994 and 2004, national unemployment rates fell from6.1% to 5.5%. Over the same period, <strong>Florida</strong>’s unemployment fellfrom 6.7% to 4.8%, while the rates in <strong>South</strong> <strong>Florida</strong> went from8.1% to 5.2%, both below national levels.8 Geographic Solutions. (2004). Labor market analys<strong>is</strong>. LaborMarket Stat<strong>is</strong>tics, <strong>Florida</strong> Research and Economic Database.Data available from http://fred.labormarketinfo.com/; In 2004,unemployment rates were Monroe County (3.4%), <strong>Miami</strong>-Dade(5.6%), Broward (4.8 %), Palm Beach (5.1%), Martin (4.7%), St.Lucie (6.2%), and Indian River (6.6%).9 DeVol, R., et al. (2004, November). Best performing cities: <strong>Where</strong>America’s jobs are created and sustained. Milken Institute.10 N<strong>is</strong>sen, B. (2004, March). Is <strong>Florida</strong>’s economy underperforming?<strong>Miami</strong>, FL: Center for Labor Research and Studies, <strong>Florida</strong>International University.11 Ibid.; The Economic Policy Institute. (2004). RetrievedMarch 30, 2005. Data available from http://www.jobwatch.org/20050125_state_job_growth_pop_growth_dec_2004.pdf.12 For more information see Brookings Institution Center on Urbanand Metropolitan Policy. (2004). Growing the middle class:Connecting all <strong>Miami</strong>-Dade residents to economic opportunity.Washington, DC: Brookings Institution.13 U.S. Census Bureau. American Community Survey. (2005).2003 Multi-year profiles. Retrieved July 12, 2005 from http://www.census.gov/acs/www/Products/Profiles/Chg/2003/ACS/index.htm; The percent of the population age 25 and olderwith a bachelor’s degree in 2003 was 25.6% in <strong>Miami</strong>-Dade, 28%in Broward, 30.5% in Palm Beach, 25% in <strong>Florida</strong>, and 26.5% inthe United States; The percent of the population age 25 andolder with a graduate degree or higher in 2003 was 10% in <strong>Miami</strong>-Dade,9.6% in Broward, 11.4% in Palm Beach, 9% in <strong>Florida</strong>,and 9.7% in the United States.14 <strong>Miami</strong>-Dade, Broward, and Palm Beach counties add another7.1%, 8.1%, and 6.2%, respectively. <strong>Florida</strong> adds another 7.2% andthe United States adds another 6.5%; There are many retiredprofessionals in Palm Beach County that are reflected in theseeducation stat<strong>is</strong>tics.15 In 2003, average annual wages were Monroe, $29,734; <strong>Miami</strong>-Dade, $36,358; Broward, $35,430; Palm Beach, $36,754; Martin$29,933, St. Lucie, $28,169 and Indian River, $28,971.16 From 1993 to 2003, Monroe County wages increased 42%; <strong>Miami</strong>-Dadewages increased 41%; Broward wages increased 40%;and Palm Beach wages increased 41%.17 U.S. Department of Commerce, Bureau of Economic Analys<strong>is</strong>.Regional economic accounts (CA34). Retrieved March 31, 2005.Data available from http://www.bea.doc.gov/bea/regional/re<strong>is</strong>/.18 Danner, P. (2005, November 7). Wage gap plagues south<strong>Florida</strong>. Sun-Sentinel.19 U.S. Department of Commerce, Bureau of Economic Analys<strong>is</strong>.Regional economic accounts (CA34). Retrieved March 31, 2005.Data available from http://www.bea.doc.gov/bea/regional/re<strong>is</strong>/; National Low Income Housing Coalition. (2003). Out ofreach 2003: America’s housing wage climbs. Retrieved August 3,2005. Data available from http://www.nlihc.org/oor2003/.20 U.S. Department of Commerce. Bureau of Economic Analys<strong>is</strong>.Regional economic accounts (CA34). Retrieved March 31, 2005.Data available from http://www.bea.doc.gov/bea/regional/re<strong>is</strong>/; Enterpr<strong>is</strong>e <strong>Florida</strong>, Inc. (2005). <strong>Florida</strong>’s regions: <strong>South</strong>east<strong>Florida</strong>. Retrieved August 3, 2005 from http://www.eflorida.com/floridasregions/intro.asp?level1=3&level2=109®ion=se;In 2003 per capita incomes by county were Monroe, $37,901; <strong>Miami</strong>-Dade,$27,593; St. Lucie, $23,051; Broward $32,844; PalmBeach, $44,050; Martin, $42,248; and Indian River, $39,953.21 U.S. Department of Commerce, Bureau of Economic Analys<strong>is</strong>.Local Area BEARFACTS. Regional Economic Accounts. Dataavailable from http://www.bea.doc.gov/bea/regional/bearfacts/countybf.cfm;Enterpr<strong>is</strong>e <strong>Florida</strong>, Inc. (2005). Intelligencecenter. Retrieved January 3, 2005. Data available from http://www.eflorida.com/intelligencecenter/.22 U.S. Department of Commerce, Bureau of Economic Analys<strong>is</strong>.Local Area BEARFACTS. Regional Economic Accounts. Data67
available from http://www.bea.doc.gov/bea/regional/bearfacts/countybf.cfm.Per Capita income growth from 1993 to2003 was Monroe: 52%; <strong>Miami</strong>-Dade: 40%; Broward: 36%; PalmBeach: 37%; Martin: 39%; St. Lucie: 41%; and Indian River: 50%.23 U.S. Department of Commerce. Bureau of Economic Analys<strong>is</strong>.Local area personal income. Regional Economic Accounts.Retrieved March 25, 2005. Data available from http://www.bea.doc.gov/bea/regional/re<strong>is</strong>/.24 Geographic Solutions. (2004). 2003 Annual Quarterly Census ofEmployment and Wages. <strong>Florida</strong> Research and Economic Database.Data available from http://fred.labormarketinfo.com/analyzer/session/session.asp?cat=IND.25 Ibid.26 These are identified by Enterpr<strong>is</strong>e <strong>Florida</strong>, Inc., <strong>Florida</strong>’seconomic development agency. Data available from http://www.eflorida.com/keysectors/default.asp?level1=22&tn=&bn.Calculated by the Center for Urban & Environmental Solution,<strong>Florida</strong> Atlantic University.27 Enterpr<strong>is</strong>e <strong>Florida</strong>, Inc.; Geographic Solutions. (2004). 2003 AnnualQuarterly Census of Employment and Wages. <strong>Florida</strong> Researchand Economic Database. Data available from http://fred.labormarketinfo.com/analyzer/session/session.asp?cat=IND.Calculated by the Center for Urban & Environmental Solution,<strong>Florida</strong> Atlantic University.28 Bleyer, J. (2005, October 15) Scripting a bright future. <strong>Florida</strong>Trend.29 Singer, S. (2005, April 17). <strong>Miami</strong> building study center that mirrorsScripps. Sun-Sentinel.30 B.A. Gonzalez. (personal communication, November 15, 2005);Nova <strong>South</strong>eastern University, NSU partnership with USGS, UFand FAU. Math, Science and Technology. Retrieved November17, 2005 from http://www.undergrad.nova.edu/MST/envs/partnership.cfm.31 Broward County <strong>Florida</strong>. (n.d.) FLL at a glance. Fort Lauderdale-HollywoodInternational Airport. Retrieved February 13,2006 from http://www.broward.org/airport/about.htm.32 Enterpr<strong>is</strong>e <strong>Florida</strong>, Inc.; Geographic Solutions. (2004). 2003 AnnualQuarterly Census of Employment and Wages. <strong>Florida</strong> Researchand Economic Database. Data available from http://fred.labormarketinfo.com/analyzer/session/session.asp?cat=IND.Calculated by the Center for Urban & Environmental Solutions,<strong>Florida</strong> Atlantic University.33 Creative Clusters, Ltd. (2005). Key concepts: What are culturalindustries? Creative Clusters. Retrieved February 21, 2006 fromhttp://www.creativeclusters.com/modules/eventsystem/?fct=eventmenus&action=d<strong>is</strong>playpage&id=33.34 <strong>Florida</strong>, R. (2005, June 1). How to build a creative economy.<strong>Miami</strong> Herald.35 <strong>Florida</strong>, R. (2000, January). Competing in the age of talent: Qualityof place and the new economy. Pittsburgh: Carnegie-MellonUniversity.36 <strong>Florida</strong>, R. (2005, June 1). How to build a creative economy.<strong>Miami</strong> Herald.37 <strong>Florida</strong> Department of Agriculture and Consumer Services,Div<strong>is</strong>ion of Marketing and <strong>Development</strong>. (2005). Overview of<strong>Florida</strong> agriculture. <strong>Florida</strong>-Agriculture.com. Retrieved January1, 2005 from http://www.fl-ag.com/agfacts.htm.38 National Agricultural Stat<strong>is</strong>tics Service, U.S. Department ofAgriculture. (2004). 2002 Census of Agriculture. National TechnicalInformation Service. Retrieved February 20, 2006 fromhttp://www.nt<strong>is</strong>.gov/products/census_agriculture.asp?loc=4-1-0.39 Ibid.40 Thomas J. Murray & Associates. (2005, November) EconomicImpact of the Recreational Marine Industry: Broward, Dade andPalm Beach Counties, <strong>Florida</strong>—2005. Fort Lauderdale, FL:Marine Industries Association of <strong>South</strong> <strong>Florida</strong>.41 <strong>Miami</strong> International Airport. (2005, May). Facts at a glance.Retrieved August 4, 2005 from http://www.miami-airport.com/html/fact_at_a_glance.html42 <strong>Miami</strong> International Airport. (2005). Airport Stat<strong>is</strong>tics. Dataavailable fromhttp://www.miami-airport.com/html/airport_stat<strong>is</strong>tics_.html43 Ibid.44 Broward County Aviation Department (2004). Fort Lauderdale/HollywoodInternational Airport Air Cargo Tonnage Reports2000-2004; FLL cargo declined from 260,000 tons in 2000 to justover 172,000 tons in 2003.45 Reynolds, J. (2005). 2004 Traffic Breaks all Records at FortLauderdale International Airport. Broward County Comm<strong>is</strong>sionNews Release, Public Information Officer. Retrieved from www.broward.org/fll; In 2004 alone, total passengers increased 16.1%,including an increase of 25.4% in international traffic over theprevious year.46 <strong>Miami</strong> International Airport. (May, 2005). Facts at a glance.Retrieved August 4, 2005 from http://www.miami-airport.com/html/fact-at-a-glance.html.47 Palm Beach County Department of Airports. (2004). PalmBeach International Airport traffic reports 2000-2004.48 Palm Beach International Airport. (2005). Palm Beach InternationalAirport facts. Data available from http://www.pbia.org/airport/facts.aspx.49 <strong>Florida</strong> Seaport Transportation and Economic <strong>Development</strong>Council. (2005). Executive summary: A five-year plan to achievethe m<strong>is</strong>sion of <strong>Florida</strong>’s seaports 2003/2004-2007/2008.50 <strong>Miami</strong>-Dade County. (2005). Cru<strong>is</strong>e Facts. Port of <strong>Miami</strong>.Retrieved August 5, 2005 from http://www.miamidade.gov/portofmiami/cru<strong>is</strong>e_facts.asp;Broward County <strong>Florida</strong>. (2005).Port Everglades commerce report FY2004. Port Business.Retrieved August 5, 2005 from http://www.broward.org/port/business_annualreport.htm.51 Port of <strong>Miami</strong>. (2003). Port of <strong>Miami</strong> revenue reports, annualgross revenue.52 Broward County <strong>Florida</strong>. (2005). Port Everglades commercereport FY2004. Port Business. Retrieved August 5, 2005 fromhttp://www.broward.org/port/business_annualreport.htm.53 <strong>Florida</strong> Seaport Transportation and Economic <strong>Development</strong>Council. (2005). Executive summary: A five-year plan to achievethe m<strong>is</strong>sion of <strong>Florida</strong>’s seaports 2003/2004-2007/2008; ThePort of Palm Beach has a decrease from 4.5 million tons in 2003to 4.3 million tons in 2004.54 Ibid. The Port of <strong>Miami</strong>’s cargo includes only container cargo.Port Everglade’s cargo includes a significant amount of petroleum;From 2004 to 2009 Port Canaveral and Port of Jacksonvillewill gain share of the state’s waterborne commerce.55 <strong>Florida</strong> Seaport Transportation and Economic <strong>Development</strong>Council. (2005). Executive summary: A five-year plan to achievethe m<strong>is</strong>sion of <strong>Florida</strong>’s seaports 2003/2004-2007/2008.56 Enterpr<strong>is</strong>e <strong>Florida</strong>, Inc. (2005, August). Implications of theU.S.-Dominican Republic-Central America Free Trade Agreementfor the State of <strong>Florida</strong>; <strong>Florida</strong> Seaport Transportation and Economic<strong>Development</strong> Council. (2005). A five-year plan to achievethe m<strong>is</strong>sion of <strong>Florida</strong>’s seaports 2004/2005-2008/2009.57 Enterpr<strong>is</strong>e <strong>Florida</strong>, Inc. (2005). <strong>Florida</strong>’s regions: <strong>South</strong>east<strong>Florida</strong>. Retrieved November 15, 2005 from http://www.eflorida.com/floridasregions/intro.asp?level1=3&level2=109®ion=se.58 The Beacon Council. <strong>Miami</strong>: Business Profile & RelocationGuide 2004/05.59 Enterpr<strong>is</strong>e <strong>Florida</strong>, Inc. (2005, August). Implications of the U.S.-Dominican Republic-Central America Free Trade Agreement for68
Technical EndnotesINTRODUCTIONPage 1 (map): “Megapolitan Regions in the United States.” FromDhavale, D., & Lang, R.E. (2005, July). Beyond megalopol<strong>is</strong>:Exploring America’s new “Megapolitan” geography. MetropolitanInstitute Census Report Series, MetropolitanInstitute at Virginia Tech.Page 2 (map): “<strong>Florida</strong>’s Regions.” Data from Enterpr<strong>is</strong>e <strong>Florida</strong>and <strong>Florida</strong> Geographic Data Library; Created by Centerfor Urban & Environmental Solutions at <strong>Florida</strong> AtlanticUniversity (2006).Page 3 (map): “<strong>South</strong> <strong>Florida</strong> Region.” Data from <strong>Florida</strong> GeographicData Library; Created by Center for Urban & EnvironmentalSolutions at <strong>Florida</strong> Atlantic University (2006).PEOPLEPage 5 (photo): Riverwalk. From John O’Brien, http://www.v<strong>is</strong>plan.com.Page 7 (chart): “<strong>South</strong> <strong>Florida</strong>’s Population by County, 1980-2030.”Data from Bureau of Economic and Business Research.(2004). <strong>Florida</strong> population studies: Bulletin 139, 37.3.Gainesville, FL: University of <strong>Florida</strong>.Page 8 (chart): “Origins of <strong>South</strong> <strong>Florida</strong>’s Population Change,2000-2004.” Data from U.S. Bureau of the Census, CountyPopulation Estimates (2004). Prepared by Richard Ogburn,<strong>South</strong> <strong>Florida</strong> Regional Planning Council.Page 8 (chart): “Origins of Population Change by County, 2000-2004.” Data from U.S. Bureau of the Census, CountyPopulation Estimates (2004). Prepared by Richard Ogburn,<strong>South</strong> <strong>Florida</strong> Regional Planning Council.Page 8 (chart): “H<strong>is</strong>panic Population by County, 2000-2030.” Datafrom Bureau of Economic and Business Research. (2004).<strong>Florida</strong> population studies: Bulletin 139, 37.3. Gainesville,FL: University of <strong>Florida</strong>.Page 9 (photo): Money transfer store, From MaryBeth Burton.Page 9 (chart): “<strong>South</strong> <strong>Florida</strong>’s Popu.ation Projections by Race andEthnicity, 2000-2030.” Data from Bureau of Economic andBusiness Research. (2004). <strong>Florida</strong> population studies: Bulletin139, 37.3. Gainesville, FL: University of <strong>Florida</strong>.Page 9 (chart): “Population Change by Age in <strong>South</strong> <strong>Florida</strong>,2000-2030.” Data from Bureau of Economic and BusinessResearch. (2004). <strong>Florida</strong> population studies: Bulletin 139,37.3. Gainesville, FL: University of <strong>Florida</strong>.Page 10 (photo): Seniors on the beach. From John O’Brien, http://www.v<strong>is</strong>plan.com.Page 10 (chart): “Senior Citizen and Youth Populations in <strong>South</strong><strong>Florida</strong>, 2000 and 2030.” Data from Bureau of Economicand Business Research. (2004). <strong>Florida</strong> population studies:Bulletin 139, 37.3. Gainesville, FL:University of <strong>Florida</strong>.Page 10 (chart): “Age D<strong>is</strong>tribution in <strong>South</strong> <strong>Florida</strong> by Race andEthnicity, 2003-2030.” Data from Bureau of Economic andBusiness Research. (2004). <strong>Florida</strong> population studies: Bulletin139, 37.3. Gainesville, FL: University of <strong>Florida</strong>.Page 11 (chart): “Poverty Rates in <strong>South</strong> <strong>Florida</strong>, 2000-2004.” Datafrom U.S. Census Bureau, American Community Survey.(2005). http://www.census.gov/acs/www/Products/Profiles/Chg/2003/ACS/index.htm.Page 11 (chart): “Poverty Rates among Youths and Seniors, 2004.”Data from U.S. Census Bureau, American CommunitySurvey. (2005). http://www.census.gov/acs/www/Products/Profiles/Chg/2003/ACS/index.htm.Page 11 (chart): “Percent of Students Eligible for Free andReduced Lunch, 2003 and 2004.” Data from EducationInformation & Accountability Services. <strong>Florida</strong> Departmentof Education. (2004, April). <strong>Florida</strong> Information Note,2004-22F: Free/reduced price lunch eligibility.Page 12 (chart): “D<strong>is</strong>tribution of Households by HouseholdIncome, 2003.” Data from U.S. Census Bureau, AmericanCommunity Survey. (2005) http://www.census.gov/acs/www/Products/Profiles/Chg/2003/ACS/index.htm.Page 12 (photo): F<strong>is</strong>her Island. From John O’Brien, http://www.v<strong>is</strong>plan.com.Page 13 (photo): Kids by schoolbus. From John O’Brien, http://www.v<strong>is</strong>plan.com.Page 13 (chart): “<strong>South</strong> <strong>Florida</strong> FCAT Grades by County, 2004-2005.” Data from <strong>Florida</strong> Department of Education. http://schoolgrades.fldoe.org/0405./Page 13 (chart): “<strong>South</strong> <strong>Florida</strong> High School Graduation Rates,1998-2004.” Data from Education Information & AccountabilityServices. Department of Education. (2005, April).Stat<strong>is</strong>tical Brief, 2005-20B: <strong>Florida</strong>’s public high schoolgraduation rates, 2004/05.Page 13 (chart): “<strong>South</strong> <strong>Florida</strong> Graduation Rates by Race andEthnicity, 2003-2004.” Data from Education Information &Accountability Services. Department of Education. (2005,April). Stat<strong>is</strong>tical Brief, 2005-20B: <strong>Florida</strong>’s public highschool graduation rates, 2004/05.Page 14 (map): “2005 FCAT Grades.” Data from Community Infofor Education; Created by Center for Urban & EnvironmentalSolutions at <strong>Florida</strong> Atlantic University.Page 15 (chart): “<strong>South</strong> <strong>Florida</strong> High School Dropout Rates, 1998-2004” Data from Education Information & AccountabilityServices. <strong>Florida</strong> Department of Education (2005, January).<strong>Florida</strong> Information Note, 2005-14: Dropout demographicsin <strong>Florida</strong>’s public schools, and dropout rates.Page 15 (chart): “<strong>South</strong> <strong>Florida</strong> Dropout Rates by Race and Ethnicity,2003-2004.” Data from Education Information &Accountability Services. <strong>Florida</strong> Department of Education(2005 January). <strong>Florida</strong> Information Note, 2005-14: Dropoutdemographics in <strong>Florida</strong>’s public schools, and dropoutrates.Page 15 (chart): “SAT Scores by Race and Ethnicity by County,2004.” Data from <strong>Florida</strong> Department of Education, Officeof Evaluation and Reporting.Page 16 (chart): “<strong>Florida</strong> Secondary Teachers Lacking Major orMinor in Subject Area, 1990-2000.” Date from EducationTrust, Inc. (2004, Spring). Education watch: <strong>Florida</strong> keyeducation facts and figures.Page 17 (chart): “Students Enrolled in <strong>South</strong> <strong>Florida</strong> Colleges,2004-2005.” Data from <strong>Florida</strong> Community College System.(2005). Community college fact book library. http://www.firn.edu/doe/arm/cctcm<strong>is</strong>/pubs/factbook/factbook_main.htm and individual university factbooks: <strong>Florida</strong> AtlanticUniversity, <strong>Florida</strong> International University, Universityof <strong>Miami</strong>, Nova <strong>South</strong>eastern University, St. ThomasUniversity, and Barry University.Page 17 (chart): “Degrees Awarded at Select <strong>South</strong> <strong>Florida</strong>70
Universities, 2000-2004” Data from individual universityfactbooks.Page 17 (chart): “<strong>South</strong> <strong>Florida</strong> Community College Graduates byRace and Ethnicity, 2003-2004.” Data from <strong>Florida</strong> CommunityCollege System. (2005). Community college fact booklibrary. http://www.firn.edu/doe/arm/cctcm<strong>is</strong>/pubs/factbook/factbook_main.htm.Page 18 (chart): “Voter Turnout in Presidential Elections, 1996-2004.” Data from <strong>Florida</strong> Stat<strong>is</strong>tical Abstract except 2004data which <strong>is</strong> from individual County Election Departments.Page 18 (chart): “Youths Referred for Felonies, 2000-2004.” Datafrom <strong>Florida</strong> Department of Juvenile Justice. http://www.djj.state.fl.us/Research/Delinquency_Profile/index.html.Page 18 (photo): Voting booth. From Lenore Alpert.Page 19 (photo): Mickey & friend. From Nicole Zucco.Page 19 (photo): Key West. From VISIT FLORIDA.Page 19 (photo): Space shuttle. From Orlando/Orange CountyConvention & V<strong>is</strong>itors Bureau, Inc.Page 19 (photo): Tarpon Springs boating. From VISIT FLORIDA.Page 19 (photo): Citrus tree. From VISIT FLORIDA.Page 19 (photo): University of Tampa. From VISIT FLORIDA.Page 19 (chart): “Population Projections for <strong>Florida</strong>’s Regions,2000-2030.” Data from Bureau of Economic and BusinessResearch. (2004). <strong>Florida</strong> population studies: Bulletin 139,37.3. Gainesville, FL: University of <strong>Florida</strong>.Page 19 (chart): “H<strong>is</strong>panic Population in <strong>Florida</strong>’s Regions, 2000-2030.” Data from Bureau of Economic and BusinessResearch. (2004). <strong>Florida</strong> population studies: Bulletin 139,37.3. Gainesville, FL: University of <strong>Florida</strong>.Page 20 (chart): “Projected Youth (Ages 0-17) in <strong>Florida</strong>’s Regions,2000-2030.” Data from Bureau of Economic and BusinessResearch. (2004). <strong>Florida</strong> population studies: Bulletin 139,37.3. Gainesville, FL: University of <strong>Florida</strong>.Page 20 (photo): Graduates. From Erin Sanders.Page 20 (chart): “Regional, State, and National SAT Scores, 2002-2003.” <strong>Florida</strong> Department of Education. (2004, August).SAT Trends: <strong>Florida</strong> and the Nation. http://www.firn.edu/doe/evaluation/pdf/sat.pdf; Data calculated by Centerfor Urban & Environmental Solutions at <strong>Florida</strong> AtlanticUniversity.Page 20 (chart): “Projected Senior Citizens in <strong>Florida</strong>’s Region’s,2000-2030.” Data from Bureau of Economic and BusinessResearch. (2004). <strong>Florida</strong> population studies: Bulletin 139,37.3. Gainesville, FL: University of <strong>Florida</strong>.PLACEPage 24 (photo): <strong>Florida</strong> Bay. From <strong>South</strong> <strong>Florida</strong> Water ManagementD<strong>is</strong>trict.Page 25 (map): “Everglades Restoration Acceler8 Projects.” From<strong>South</strong> <strong>Florida</strong> Water Management D<strong>is</strong>trict.Page 26 (chart): “Nesting Wading Birds in <strong>South</strong> <strong>Florida</strong>, 1986-2005.” Data from <strong>South</strong> <strong>Florida</strong> Management D<strong>is</strong>trict.<strong>South</strong> <strong>Florida</strong> Wading Bird Report, (v10, v 11).Page 26 (chart): “Freshwater Withdrawals in <strong>South</strong> <strong>Florida</strong>, 1975-2000.” Data from U.S. Geological Survey.Page 27 (chart): “H<strong>is</strong>toric and Projected Population and Public SupplyWater Demand in <strong>South</strong> <strong>Florida</strong>, 2000-2025.” Data from<strong>South</strong> <strong>Florida</strong> Water Management D<strong>is</strong>trict. (2004, June).UEC water supply plan; <strong>South</strong> <strong>Florida</strong> Water ManagementD<strong>is</strong>trict. (2005, June 13). LEC water supply plan update:Baseline projections of public water supply; Bureau of Economicand Business Research. (2004). <strong>Florida</strong> populationstudies: Bulletin 139, 37.3. Gainesville, FL: University of<strong>Florida</strong>.Page 27 (chart): “Water Reuse in <strong>South</strong> <strong>Florida</strong>, 2004.” Data fromDiv<strong>is</strong>ion of Water Resource Management. <strong>Florida</strong> Departmentof Environmental Protection. (2005, June). 2004Reuse Inventory.Page 27 (chart): “Water Bodies Targeted for Pollution Monitoring,2004.” Data from R. McTear, <strong>Florida</strong> Department of EnvironmentalProtection. (personal communication, February16, 2005): TMDL Program Watershed Assessment Section.Page 28 (chart): “Beach Erosion in <strong>Florida</strong> and <strong>South</strong> <strong>Florida</strong>, 1999-2005.” Data from Bureau of Beaches and Wetland Resources,Department of Environmental Protection. (Updated2003, 2004). Critical beach erosion areas in <strong>Florida</strong> (ReportBC-99-02); Beachwatch, Department of Environment andConservation.Page 28 (photo): Birds at shore. From <strong>South</strong> <strong>Florida</strong> Water ManagementD<strong>is</strong>trict.Page 28 (chart): “Beach Adv<strong>is</strong>ories in <strong>South</strong> <strong>Florida</strong>, 2003-2004.”Data from <strong>Florida</strong> Healthy Beaches Program, <strong>Florida</strong>Department of Health. http://esetappsdoh.doh.state.fl.us/irm00beachwater/default.aspx.Page 29 (chart): “Landings of F<strong>is</strong>h and Shellf<strong>is</strong>h in <strong>South</strong> <strong>Florida</strong>,2000-2003.” Data from Bureau of Business and EconomicResearch. (2005) <strong>Florida</strong> Stat<strong>is</strong>tical Abstract 2005. Gainesville,FL: University of <strong>Florida</strong>.Page 29 (photo): Urban Encroachment, From <strong>South</strong> <strong>Florida</strong> WaterManagement D<strong>is</strong>trict.Page 30 (chart): “<strong>South</strong> <strong>Florida</strong>’s Land Use by County (in acres).”Data from 2002 Census of Agriculture; <strong>Florida</strong> NaturalAreas Inventory, <strong>Florida</strong> Resources and EnvironmentalAnalys<strong>is</strong> Center, <strong>Florida</strong> State University. http://www.fnai.org/data.cfm.Page 30 (map): “Population Growth by Zip Code 1990-2002.” Datafrom Claritas; Created by Center for Urban & EnvironmentalSolutions at <strong>Florida</strong> Atlantic University (2006).Page 31 (chart): “<strong>South</strong> <strong>Florida</strong>’s Agricultural Lands, 1982-2002.”Data from National Agricultural Stat<strong>is</strong>tics Service. UnitedStates Department of Agriculture. (2002, 1997, 1992, 1987,1978, & 1974 Census of Agriculture).Page 31 (photo): Agriculture workers. From <strong>South</strong> <strong>Florida</strong> WaterManagement D<strong>is</strong>trict.Page 32 (chart): “Foreign Real Estate Investment in <strong>South</strong> <strong>Florida</strong>’sCore Counties, 1983-2003.” Data from <strong>South</strong>east <strong>Florida</strong>/Caribbean Urban Land Institute. (2004, February). Presentation:Multifamily market review.Page 32 (map): “Residential Unit Demand.” Created by JohnO’Brien, http://www.v<strong>is</strong>plan.com.Page 33 (chart): “Median Price of Ex<strong>is</strong>ting Single Family Home in<strong>South</strong> <strong>Florida</strong> MSAs, 1994 and 2004.” Data from <strong>Florida</strong>Association of Realtors.Page 33 (chart): “Homes Affordable for Median Income Households,1995-2005.” Data from National Association of HomeBuilders. (2005). http://www.nahb.org./Page 33 (chart): “Housing Affordability for Elementary SchoolTeachers in <strong>South</strong> <strong>Florida</strong>’s MSAs, 2005.” Data fromCenter for Housing Policy. Paycheck to paycheck – 2005Findings. http://www.centerforhousingpolicy.org/.Page 34 (chart): “Traffic Congestion in <strong>South</strong> <strong>Florida</strong>, 1983-2003.”Data from Texas Transportation Institute, Texas A&MUniversity. (n.d.). 2004 Urban Mobility Report.Page 34 (chart): “Vehicle Miles Traveled in <strong>South</strong> <strong>Florida</strong> Region,1990-2030.” Data from Monica Zhong, Office of PolicyPlanning, <strong>Florida</strong> Department of Transportation. (personalcommunication, March 4, 2005); <strong>Florida</strong> Department of71
Transportation.(2005). Public road mileage reports 1997-2003. http://www.dot.state.fl.us/planning/stat<strong>is</strong>tics/mileagereports/default.htm#public.Page 35 (chart): “Public Transit Ridership in <strong>South</strong> <strong>Florida</strong>, 1992-2004.” Data from individual County Transit Departments.Page 35 (photo): Traffic on I-95, From John O’Brien, http://www.v<strong>is</strong>plan.com.Page 36 (map): “2004-2005 Hurricanes in <strong>Florida</strong>.” Created by theCenter for Urban & Environmental Solutions at <strong>Florida</strong>Atlantic University (2006).Page 36 (chart): “Ten Most Costly Hurricanes in U.S. H<strong>is</strong>tory”Data from Insurance Information Institute. (n.d.). Presentations:Hurricane season of 2005: Impacts on US P/CInsurance Markets in 2006 & Beyond. Media. http://www.iii.org/media/presentations/katrina/.Page 37 (photo): Mickey & friend. From Nicole Zucco.Page 37 (photo): Key West. From VISIT FLORIDA.Page 37 (photo): Space shuttle. From Orlando/Orange CountyConvention & V<strong>is</strong>itors Bureau, Inc.Page 37 (photo): Tarpon Springs boating. From VISIT FLORIDAPage 37 (photo): Citrus tree. From VISIT FLORIDA.Page 37 (photo): University of Tampa. From VISIT FLORIDA.Page 37 (chart): “Water Reuse in <strong>Florida</strong> Regions, 2004.” Data fromthe Div<strong>is</strong>ion of Water Resource Management, <strong>Florida</strong>Department of Environmental Protection. 2004 Reuseinventory. (2005, June).Page 37 (map): “Miles of Critical Beach Erosion in <strong>Florida</strong>’s BeachRegions, 2005.” Data from Bureau of Beaches and CoastalSystems, <strong>Florida</strong> Department of Environmental Protection.Created by the Center for Urban & Environmental Solutionsat <strong>Florida</strong> Atlantic UniversityPage 38 (chart): “Median Price of Ex<strong>is</strong>ting Single Family Homes in<strong>Florida</strong> MSAs, 1994-2004.” Data from the <strong>Florida</strong> Associationof Realtors.Page 38 (chart): “Housing Affordability for Elementary SchoolTeachers in <strong>Florida</strong>’s MSAs, 2005.” Data from the <strong>Florida</strong>Association of Realtors.Page 38 (chart): “Annual Traffic Delay per Peak Traveler in<strong>Florida</strong>’s Regions, 1983-2003.” Data from Lomax, T., &Schrank, D. (2005). The 2005 urban mobility report. CollegeStation, TX: Texas Transportation Institute, TexasA&M University.PROSPERITYPage 41 (photo): Coastal <strong>Development</strong>. From John O’Brien,http://www.v<strong>is</strong>plan.comPage 43 (chart): “National, State, and Regional Annual Job GrowthRates, 1994-2004.” Data from Geographic Solutions.(2004). Labor market analys<strong>is</strong>. Labor Market Stat<strong>is</strong>tics,<strong>Florida</strong> Research and Economic Database. http://fred.labormarketinfo.com/.Page 43 (chart): “<strong>South</strong> <strong>Florida</strong> Job Growth by County, 1994-2004.”Data from Geographic Solutions. (2004). Labor marketanalys<strong>is</strong>. Labor Market Stat<strong>is</strong>tics, <strong>Florida</strong> Research andEconomic Database. http://fred.labormarketinfo.com/.Page 44 (chart): “National, State and Regional Annual Labor ForceGrowth Rates, 1994-2004.” Data from Geographic Solutions.(2004). Labor market analys<strong>is</strong>. Labor Market Stat<strong>is</strong>tics,<strong>Florida</strong> Research and Economic Database. http://fred.labormarketinfo.com/.Page 44 (chart): “Annual Labor Force and Job Growth Rates in<strong>South</strong> <strong>Florida</strong>, 1994-2004.” Data from Geographic Solutions.(2004). Labor market analys<strong>is</strong>. Labor Market Stat<strong>is</strong>tics,<strong>Florida</strong> Research and Economic Database. http://fred.labormarketinfo.com/.Page 44 (photo) Office/retail construction. from John O’Brien,http://www.v<strong>is</strong>plan.com.Page 44 (chart): “<strong>South</strong> <strong>Florida</strong> Unemployment Rates by County,1990-2004.” Data from Geographic Solutions. (2004). Labormarket analys<strong>is</strong>. Labor Market Stat<strong>is</strong>tics, <strong>Florida</strong> Researchand Economic Database. http://fred.labormarketinfo.com/.Page 45 (photo): Image Lab. From John O’Brien, http://www.v<strong>is</strong>plan.comPage 45 (chart): “Proportion of Population Age 25 Years and Olderwith a Bachelor’s Degree of Higher, 2000-2004.” Data fromthe American Community Survey, (2005).Page 45 (chart): “Average Annual Wage per Job, 2000-2003.” Datafrom the U. S. Bureau of Economic Analys<strong>is</strong>, RegionalEconomic Accounts. http://www.bea.gov/bea/regional/data.htm.Page 46 (chart): “Average Annual Housing Wage Growth vs.Average Annual Wage Growth, 2000-2003.” Data from theNational Low Income Housing Coalition. http://www.nlihc.org/.Page 46 (chart): “Regional, State, and National Per Capita Income,1993-2003.” Data from the U.S. Bureau of Economic Analys<strong>is</strong>,Local Area Personal Income. http://www.bea.doc.gov/bea/regional/re<strong>is</strong>/action.cfm.Page 46 (chart): “Average Annual per Capita Income Growth, 1993-2003.” Data from the U.S. Bureau of Economic Analys<strong>is</strong>,Local Area Personal Income. http://www.bea.gov/bea/regional/re<strong>is</strong>/.Page 47 (photo): Retirees eating dinner. From John O’Brien,http://www.v<strong>is</strong>plan.com.Page 47 (chart): “Components of Personal Income, 2003.” Datafrom the U.S. Bureau of Economic Analys<strong>is</strong>, Local AreaPersonal Income. http://www.bea.gov/bea/regional/re<strong>is</strong>/.Page 47 (table): “Average Weekly Wages by Industry Sector andSector’s Share of <strong>South</strong> <strong>Florida</strong> Jobs.” Data from the GeographicSolutions. (2004); 2003 Annual Quarterly Censusof Employment and Wages. <strong>Florida</strong> Research and EconomicDatabase. Data available from http://fred.labormarketinfo.com/analyzer/session/session.asp?cat=IND.Page 48 (chart): “Projected Employment Growth by Sector, 2004-2012.” Data from the Geographic Solutions (2004); 2003Annual Quarterly Census of Employment and Wages. <strong>Florida</strong>Research and Economic Database. http://fred.labormarketinfo.com/analyzer/session/session.asp?cat=IND.Page 48 (table): “Occupation Projected to Gain the Most New Jobs,2004-2012” Data from Enterpr<strong>is</strong>e <strong>Florida</strong>, Inc. http://www.eflorida.com/keysectors/default.asp?level1=22&tn=&bn.Calculated by the Center for Urban & Environmental Solutions,<strong>Florida</strong> Atlantic University.Page 49 (chart): “Market Value of Agricultural Production in <strong>South</strong><strong>Florida</strong>, 1974-2002” Data from the <strong>Florida</strong> Department ofAgriculture and Consumer Services, Div<strong>is</strong>ion of Marketingand <strong>Development</strong>. (2005). Overview of <strong>Florida</strong> agriculture,<strong>Florida</strong>-Agriculture.com. http://www.fl-ag.com/agfacts.htm.Page 50 (photo): Boats on the New River. From Greater Fort LauderdaleConvention & V<strong>is</strong>itors Bureau.Page 50 (chart): “Comparative Economic Impacts of Key <strong>Florida</strong>Industries, 2005.” Data from Thomas J. Murray & Associates.(2005, November). Economic Impact of the RecreationalMarine Industry: Broward, Dade and Palm BeachCounties, <strong>Florida</strong>—2005. Fort Lauderdale, FL: Marine72
Industries Association of <strong>South</strong> <strong>Florida</strong>.Page 50 (chart): “Marine Gross Sales in <strong>South</strong> <strong>Florida</strong>, 1994-2005”Data from Thomas J. Murray & Associates. (2005 November)Economic Impact of the Recreational Marine Industry:Broward, Dade and Palm Beach Counties, <strong>Florida</strong>—2005.Fort Lauderdale, FL: Marine Industries Association of<strong>South</strong> <strong>Florida</strong>.Page 51 (chart): “Airport Cargo in <strong>South</strong> <strong>Florida</strong>, 1990-2004” Datafrom <strong>Miami</strong> International Airport. (2005). Airport Stat<strong>is</strong>tics.http://www.miami-airport.com/html/airport_stat<strong>is</strong>tics_.html;Broward County Aviation Department. (2004).Fort Lauderdale/Hollywood International Airport. AirCargo Tonnage Reports 2000-2004.Page 51 (chart): “Air Passengers in <strong>South</strong> <strong>Florida</strong>, 1998-2004.” Datafrom <strong>Miami</strong> International Airport. (2005). Airport Stat<strong>is</strong>tics.http://www.miami-airport.com/html/airport_stat<strong>is</strong>tics_.html;Broward County Aviation Department. (2004).Fort Lauderdale/Hollywood International Airport AirCargo Tonnage Reports 2000-2004.Page 51 (photo): Port of <strong>Miami</strong>. From Lenore Alpert.Page 51 (chart): “Waterborne Commerce at <strong>South</strong> <strong>Florida</strong>’s Ports,2000-2008” Data from <strong>Florida</strong> Seaport Transportation andEconomic <strong>Development</strong> Council. (2005). Executive summary:A five-year plan to achieve the m<strong>is</strong>sion of <strong>Florida</strong>’sseaports 2003/2004-2007/2008. http://www.flaports.org/.Page 52 (photo): Cru<strong>is</strong>e.ship. From John O’Brien, http://www.v<strong>is</strong>plan.comPage 52 (chart): “Cru<strong>is</strong>e Passengers at <strong>South</strong> <strong>Florida</strong>’s Ports, 2000-2008.” Data from <strong>Florida</strong> Seaport Transportation and Economic<strong>Development</strong> Council. (2005). Executive summary:A five-year plan to achieve the m<strong>is</strong>sion of <strong>Florida</strong>’s seaports2003/2004-2007/2008. http://www.flaports.org/.Page 52 (table): “International Companies in <strong>South</strong> <strong>Florida</strong>, 2005.”Data from Enterpr<strong>is</strong>e <strong>Florida</strong>, Inc. (2005). <strong>Florida</strong>’s regions:<strong>South</strong>east <strong>Florida</strong>. http://www.eflorida.com/floridasregions/intro.asp?level1=3&level2=109®ion=se.Page 53 (map): “The Central American Free Trade AgreementParticipating Countries (CAFTA)” Data from ESRI WorldData. Created by Center for Urban & Environmental Solutionsat <strong>Florida</strong> Atlantic University.Page 53 (chart): “Tour<strong>is</strong>ts V<strong>is</strong>iting <strong>South</strong> <strong>Florida</strong>’s Core-CountyArea, 1997-2004.” Data from V<strong>is</strong>it <strong>Florida</strong> Research Department.(2004). 2003 <strong>Florida</strong> V<strong>is</strong>itor Study; Greater <strong>Miami</strong>Convention & V<strong>is</strong>itors Bureau. http://www.miamiandbeaches.com/v<strong>is</strong>itors/localservices_popup.asp; GreaterFort Lauderdale Convention & V<strong>is</strong>itors Bureau. http://www.sunny.org/partners/index.cfm?action=research;Palm Beach Tour<strong>is</strong>t <strong>Development</strong> Council. http://www.pbcgov.com/pubInf/TDC/highlights_stats.htm.Page 54 (photo): Hurricane winds. From <strong>South</strong> <strong>Florida</strong> Water ManagementD<strong>is</strong>trict.Page 54 (chart): “Power outages due to 2005 Hurricanes.” Datafrom the Insurance Information Institute. (n.d.). Presentations:Hurricane season of 2005: Impacts on US P/CInsurance Markets in 2006 & Beyond. Media. http://www.iii.org/media/presentations/katrina/.Page 55 (photo): Mickey & friend. From Nicole Zucco.Page 55 (photo): Key West. From VISIT FLORIDA.Page 55 (photo): Space shuttle. From Orlando/Orange CountyConvention & V<strong>is</strong>itors Bureau, Inc.Page 55 (photo): Tarpon Springs boating. From VISIT FLORIDA.Page 55 (photo): Citrus tree. From VISIT FLORIDA.Page 55 (photo): University of Tampa. From VISIT FLORIDA.Page 55 (chart): “Average Wage Per Job in the Core Counties of<strong>Florida</strong>’s Regions, 1993-2003.” Data from the Bureau ofEconomic Analys<strong>is</strong>, Regional Economic Accounts. http://www.bea.gov/.Page 55 (chart): “Average Annual Housing Wage Growth vs.Average Annual Wage Growth, 2000-2003.” Data from theNational Low Income Housing Coalition. http://www.nlihc.org/.Page 56 (chart): “Economic Impact of Regional Beach Tour<strong>is</strong>m in<strong>Florida</strong>.” Data from Center for Urban & EnvironmentalSolutions, <strong>Florida</strong> Atlantic University. (2004, August). Theeconomics of beach tour<strong>is</strong>m in <strong>Florida</strong>.Page 56 (chart): “Per Capita Income in the Core Counties of<strong>Florida</strong>’s Regions, 1993-2003.” Data from the U.S. Bureauof Economic Analys<strong>is</strong>, Local Area Personal Income. http://www.bea.doc.gov/bea/regional/re<strong>is</strong>/action.cfm.Page 56 (chart): “Sources of Personal Income, 2003” Data from theU.S. Bureau of Economic Analys<strong>is</strong>, Local Area PersonalIncome. http://www.bea.doc.gov/bea/regional/re<strong>is</strong>/action.cfm.Page 56 (photo): Beach. From the Greater Fort Lauderdale Conventionand V<strong>is</strong>itors Bureau.CONCLUSIONPage 59 (graphic): <strong>South</strong> <strong>Florida</strong>’s Wheel. Created by Erin Sanders.73
AcknowledgmentsCUES w<strong>is</strong>hes to recognize the contributions to th<strong>is</strong> report by its partners at the <strong>South</strong> <strong>Florida</strong> Regional PlanningCouncil, the Treasure Coast Regional Planning Council, the Collins Center for Public Policy, Inc., and the MetropolitanCenter at <strong>Florida</strong> International University. These partners provided comments and encouragement oncritical elements of the report.Special thanks are extended to the key regional observers who participated in personal interviews, whichwill be publ<strong>is</strong>hed separately. Select interviews are excerpted in th<strong>is</strong> document to provide guidance from expertson the future direction of the region as it faces a multitude of ongoing policy challenges over the next 25 years.While we were unable to include comments from all the stakeholders, all were useful in providing input forframing the d<strong>is</strong>cussion on the future of the region. We are hoping to publ<strong>is</strong>h separately the full array of commentsfrom those experts in the near future. Those interviewed included Ken Ammon, Linda Brown, MichaelBusha, Michael Cannon, Carolyn Dekle, Mason Jackson, Mike Jones, Niesen Kasdin, Michael Lannon, DaniellaLevine, Ralph Marrinson, Dario Moreno, Bruce N<strong>is</strong>sen, Rod Petry, and Peter Spyke.The project could not have been completed without the commitment and long hours of many members ofCUES’s staff. Dr. Lenore Alpert directed the overall project, managed the project team, and helped design, write,and review the report. Major components of the research, analys<strong>is</strong>, and writing were expertly completed byLindsay Walker, with input from Dr. Alpert and Dr. Wall<strong>is</strong>. Lindsay Walker, Chr<strong>is</strong>tina Bryk, and Matt Kurry allconducted data analyses. Other noteworthy contributions came from MaryBeth Burton and MJ Matthews, whoboth reviewed drafts of the report. Technical support was provided by Erin Sanders, Nicole Zucco, Phil Mancusi,Rachel Kalin, Angela Grooms, and Amanda Breeden. Expert graphic design was provided by John O’Brien ofv<strong>is</strong>plan.com, ass<strong>is</strong>ted by MaryBeth Burton, Erin Sanders, Rhonda Jones, and Lindsay Walker.As always, our consultant, Dr. Allan Wall<strong>is</strong>, was an integral part of the project. He guided and directed thedesign of the project as well as ass<strong>is</strong>ted in writing and reviewing the drafts.CUES Director James F. Murley provided the team with unfaltering support, encouragement, and v<strong>is</strong>ion forthe project as a key part of CUES’s regional initiatives.