Rexam PLC Annual Report 2011
Rexam PLC Annual Report 2011
Rexam PLC Annual Report 2011

Create successful ePaper yourself
Turn your PDF publications into a flip-book with our unique Google optimized e-Paper software.
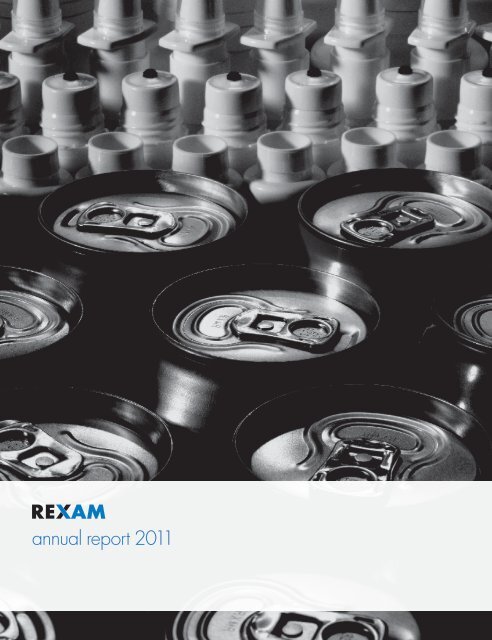
annual report <strong>2011</strong>
Consumer packaging is an integral part of modern day living.It protects, preserves and enables efficient distribution.It also helps brand owners to inform end users and topromote their goods.And, it makes an essential contribution to a sustainablesociety as it helps reduce waste from spoilage.The lifestyle many of us take for granted is predicated, in part,on the availability of a sustainable packaging supply chain.find out more onlineOur website www.rexam.com contains a fullinteractive version of the <strong>2011</strong> annual report.It also contains annual reports from previousyears (back to 1999) as well as investorpresentations, publications and other materialon <strong>Rexam</strong>, its markets and business.The annual report <strong>2011</strong> contains statements which are not based on current or historical fact and which are forward looking in nature. These forward looking statementsreflect knowledge and information available at the date of preparation of this annual report <strong>2011</strong> and the Company undertakes no obligation to update these forwardlooking statements. Such forward looking statements are subject to known and unknown risks and uncertainties facing the Group including, without limitation, those risksdescribed in this annual report <strong>2011</strong>, and other unknown future events and circumstances which can cause results and developments to differ materially from thoseanticipated. Nothing in this annual report <strong>2011</strong> should be construed as a profit forecast.<strong>Rexam</strong> <strong>PLC</strong> is registered and domiciled in England and Wales: company number 191285.
1overviewOur chairman introduces the <strong>2011</strong> annual report and weexplain who we are, what we make and where we operate.You will also find a table of the headline figures for <strong>2011</strong> thatsummarises our performance during the year.business review4 chairman’s statement6 who we are7 what we make8 where we operate9 how we performed in <strong>2011</strong>overviewdirectors’ reportOur chief executive outlines how we performed againstour strategy to deliver value. The operating and financialreviews outline our performance in <strong>2011</strong>. We also givean overview of the markets in which we operate and ofthe risks facing the business and what we are doing tomitigate them.sustainabilityThis section provides a review of our sustainability performance in<strong>2011</strong>. It explains our approach to and progress in this area, anddetails our commitments, measures and targets going forward.governance12 chief executive’s review (including KPIs)16 market review20 operating review26 financial review34 key risks44 products47 operations49 peoplesustainabilitybusiness reviewWe introduce our board and explain why a strong sense ofgovernance and compliance is imperative in every area of ouroperations. We give details of the Company’s remunerationprinciples and policy which complement the Group’sstrategic vision.financial statements54 directors and officers56 corporate governance69 remuneration report81 other disclosuresgovernance86 <strong>Rexam</strong> <strong>PLC</strong> consolidated financial statements <strong>2011</strong>134 five year financial summary136 <strong>Rexam</strong> <strong>PLC</strong> Company financial statements <strong>2011</strong>financial statements144 shareholder information145 addresses
2overviewBeverage cans are used for a wide range of productsincluding beer, carbonated soft drinks, sports, energyand functional drinks, as well as iced tea and wine.
3Our chairman introduces the <strong>2011</strong> annualreport and we explain who we are, whatwe make and where we operate. You willalso find a table of the headline figures for<strong>2011</strong> that summarises our performanceduring the year.4 chairman’s statement6 who we are7 what we make8 where we operate9 how we performed in <strong>2011</strong>financial statements governancesustainabilitybusiness reviewoverview
4 <strong>Rexam</strong> annual report <strong>2011</strong> overviewchairman’s statementA major challenge as we move forward is the fragile globaleconomy in which we have to operate. That said, <strong>Rexam</strong> is wellpositioned to anticipate and react swiftly to changing circumstancesand adverse conditions.It is important that as a board we are fully cognisant of ourresponsibilities to all our stakeholders: to our shareholders, whohave experienced good returns in <strong>2011</strong>; to our customers andsuppliers with whom we have continued to build mutually beneficialrelationships; to our people, in whom we continue to invest; and tothe environment, where we have again reduced our carbonfootprint.<strong>Rexam</strong>’s record results for <strong>2011</strong> extended the strong progress wemade in 2010. We continued to focus on our strategic priorities –controlling costs, optimising cash and improving our return oncapital employed – to deliver another set of excellent results andfurther strengthen our balance sheet. The board is proposing anincreased final dividend of 9.7p per share, making a total dividendof 14.4p for the year. Against a background of increasingly tougheconomic conditions, this performance bears witness to theunderlying strength of the business.Under Graham’s leadership, the executive team and all our peoplehave continued to manage those levers over which we havecontrol. We are driving operational excellence, through relentlesscost control and improved asset utilisation. We are strengtheningour customer and supplier relationships, with our focus on quality,service, value and innovation. We are building a winningorganisation, fostering a culture which enables our people toachieve great results. We are expanding in emerging markets, withdisciplined investment plans announced in Brazil and India, whichwill develop and extend our existing geographic footprint. And weare managing our portfolio of businesses, ensuring all theconstituent parts add value to the whole. As part of our focus onimproving our returns across the Group, we sold our beverage andspecialty Closures businesses in <strong>2011</strong> and have recently started theprocess to market the Personal Care business for divestment.The way the Group manages risk is also vital for our futureprosperity. It was therefore encouraging that, in our review of boardeffectiveness, the management of risk was acknowledged as anarea where we perform particularly effectively. Also coming outof this review were indications that even more needs to be donein the areas of strategy, people development and succession.While more time is spent on these areas than ever before, werightly concluded that in such a turbulent and competitive worldthese issues will continue to be given a strong focus.We have seen a number of board changes.Leo Oosterveer joined the board as a non executive director inSeptember. He leads the global food service division of Unileverand has a proven track record in marketing, sales and strategydevelopment gained both in Europe and Asia. His globalmanagement experience will be a great asset to the boardand to <strong>Rexam</strong>.Carl Symon retired from the board in November, having playedan important part in <strong>Rexam</strong>’s success as senior independent directorand chairman of the remuneration committee. I thank him for hishard work over the past eight years.dividendIn 2009, the board agreed a policy to establish dividend cover in the2–2.5 times underlying earnings range in the medium term, and we aredelivering on that policy for <strong>2011</strong>. The board recommends a <strong>2011</strong> finaldividend of 9.7p per share (2010: 8p), amounting to a total dividendfor the year of 14.4p per share (2010: 12p). Subject to shareholderapproval at <strong>Rexam</strong>’s AGM on 3 May 2012, the final dividend will bepaid on 7 June 2012 to shareholders on the register at close of businesson 11 May 2012.4.7p + 9.7p =14.4p
5During <strong>2011</strong>, I announced my retirement and so this is my laststatement as chairman of <strong>Rexam</strong>. I am delighted that StuartChambers is taking over from me as chairman. His extensivebusiness experience, including his senior executive business tobusiness experience and his broad global expertise, will be oftremendous benefit to the board’s future deliberations and to thesuccess of the Company.I am proud of what, together, we have achieved since I joined theboard. <strong>Rexam</strong> is in a strong position and well prepared to tackle thechallenges ahead. We have clear objectives, strong managementand talented people.It just remains for me to express my appreciation to my fellowboard members for their contribution and support, not just duringthis year but since I have been chairman, and to say how gratefulI am for the confidence of our shareholders, customers andsuppliers. But I should like to save my final words for our people.In the challenging global economic climate of recent yearseveryone within <strong>Rexam</strong> has shown resilience and dedication,and there is so much enthusiasm and commitment for what we dothat it is impossible not to be inspired. I have enjoyed greatly mytime at <strong>Rexam</strong>, and wish the Company and all its people everysuccess in the future.Sir Peter Ellwoodchairman22 February 2012Stuart ChambersI am really pleased to be taking over from Sir Peter.He leaves the Company in a strong position which isa testament to his significant achievements. <strong>Rexam</strong> isconfident of its direction and is well placed to developfurther. I look forward very much to working withGraham and his team to achieve our ambitions forthe Company.Stuart Chamberschairman designate22 February 2012financial statements governancesustainabilitybusiness reviewoverview
6 <strong>Rexam</strong> annual report <strong>2011</strong> overviewwho we are<strong>Rexam</strong> is a leading global consumer packaging companyWe make the packaging for many of the world’s favourite brands. We help to shape the experiencefor all kinds of products that consumers choose, use and depend on every day. We make drinks cansfor some of the most famous names in the world. We also manufacture precision medical devices,from bronchial inhalers to transdermal drug delivery systems, as well as products for personalcare applications.Our job is to make high quality packaging as efficiently, profitably and sustainably as possible. This iswhy, wherever you go in <strong>Rexam</strong>, you will see a common focus on operational excellence through leanenterprise, innovation and safety to meet our customers’ expectations.our visionOur vision is to be the best global consumer packagingcompany. This means balancing profitable revenuegrowth, cash generation and the appropriate riskprofile for the Group to deliver a strong return oncapital employed and a steady increase in profits yearon year.We use the framework below to focus on what isimportant to drive our strategy, to align and mobiliseour organisation and to accelerate time to execution.With a winning organisation, we will generate theoperational excellence in all our processes to deliveron customer expectations which is vital to achievingbest performance.our valuesOur values underpin everything we do. They reflectwho we are and how we want to act and interact witheach other and everyone we deal with.continuous improvementrecognitionteamworktrustBest performanceCustomer expectationsblue chipIn <strong>2011</strong>, we launched a Groupwide recognition scheme knownas the ‘Blue Chip’.Invest for valueDrive operationalexcellenceEnsure our futureThis on the spot scheme, which hasa cash value equivalent to 50 <strong>Rexam</strong>ordinary shares, recognises individualswho visibly demonstrate our valuesand/or leadership practices.Build a winning organisationTo date we have awarded Blue Chipsto more than 220 employees.case studies: icons aligned to vision
7what we makebeverage cans<strong>Rexam</strong> Beverage Cans is a leading global beverage canmaker comprising three regional businesses. We make around57bn beverage cans each year mainly in aluminium, but alsoin steel, in more than 20 countries around the world. Can sizeis an important element of customer marketing efforts and weoffer the broadest range and a wide choice of innovative inksand coatings to add further value. We also make the ends toseal the cans and have a range of printed and coloured endsas well as distinctive features such as cut out or laser coded tabs.plastic packaging<strong>Rexam</strong> Plastic Packaging is a major global player in rigid plasticpackaging. It has two divisions, Healthcare and Personal Care, thatmake a wide range of products. These include dry powder inhalers,pharmaceutical pumps and valves, eye droppers, nasal sprays,medical devices, pill jars and closures for healthcare customers,as well as a range of products for the toiletries, cosmetics, personalcare and food markets. We have recently started the process tomarket Personal Care for sale.customersWe make products for a wide selection of customersacross the globe, but our top 10 account for 60%of sales.AB InBevCoca-ColaHeinekenL’OréalRed Bull60%CarlsbergHansen BeveragesHornellPepsiCoSchincariolEurope & AsiaWe are the largest beverage can and can end maker in Europe.We also have beverage can plants in Egypt, China and India,as well as an associate in South Korea.North AmericaWe are the second largest beverage can and can end makerin the US. We also have a plant in Mexico and a joint venturein Guatemala.South AmericaWe are the largest beverage can and can end maker inSouth America with operations in Argentina, Brazil and Chile.more information in the operating reviewhealthcareWe produce standard and custom packaging solutions forpharmaceutical customers worldwide, as well as complete custompackaging systems for healthcare and prescription packaging.personal careWe are a leading supplier of advanced packaging solutionsfor beauty, personal care and home product customers.We also make high barrier containers for food.more information in the operating reviewcarbon intensityWe are well on our way to achieving our targetof reducing our carbon intensity by 10% in 2013vs 2010.In <strong>2011</strong>, we reduced our carbon intensity by3.5% to 0.83kg carbon/kg of raw materialconverted (2010: 0.86kg).3.5%financial statements governancesustainabilitybusiness reviewoverviewmore information in the sustainability section
8 <strong>Rexam</strong> annual report <strong>2011</strong> overviewwhere we operatewe have 83 manufacturing sites in 25 countries across the globe<strong>Rexam</strong>’s operations are located in Europe, North, South and Central America,North Africa and Asia.In <strong>2011</strong>, we employed on average 19,000 people in our continuing operations.83further details of our employees can be found in the sustainability section as well as note 4 to the consolidated financial statementsour locationsUSThe US is our largestmarket in terms of sales.We have 14 beveragecan and end makingplants and 15 plasticpackaging operations.The can plants are locatedclose to major customersand large metropolitancentres which positionsus well in terms of logisticsand freight.South AmericaWe are the number onebeverage can makerin South America andspecifically Brazil, thelargest market in the region.Our plants are strategicallylocated to capture growthand optimise assetutilisation.Beverage CansPlastic Packaginghead officeregional officesEuropeEurope is our secondlargest market in termsof sales. Our corporatehead office is in Londonwhile the headquartersfor our EuropeanBeverage Can andHealthcare and PersonalCare businesses are inLuton, UK, and Paris,France, respectively.ChinaWe have hadoperations in Chinasince 1998 where ourfocus is on plasticpackaging. The businesswas originally set up forexport, but is nowmainly focused onlocal markets.sales 1 by customer location (£m)<strong>2011</strong> 2010 <strong>2011</strong> 2010● US 1,576 1,586 ● UK 203 200● Brazil 747 700 ● France 188 178● Austria 327 288 ● Germany 136 131● Russia 281 267 ● Other countries 1,050 1,051● Spain 226 218+8%In <strong>2011</strong>, <strong>Rexam</strong>’s emerging marketssales grew by 8%. Over 30% of<strong>Rexam</strong>’s sales come from these fastgrowing markets, driven largely byour Beverage Cans businesses inBrazil and Russia.1 Continuing operations.
9how we performed in <strong>2011</strong><strong>2011</strong> results summary<strong>2011</strong> 2010 changeUnderlying business performance 1Sales £m 4,734 4,619 2%Underlying operating profit £m 549 513 7%Underlying profit before tax £m 450 390 15%Underlying earnings per share p 36.1 31.4 15%Total dividend per share p 14.4 12.0 20%Statutory resultsSales 2 £m 4,734 4,619Operating profit 2,3 £m 507 473Profit before tax 3 £m 431 338Total profit for the financial year 3,4 £m 376 124Total basic earnings per share 3,4 p 43.1 14.2sales (£m) <strong>2011</strong> 2010● Beverage Cans 3,786 3,677● Plastic Packaging 948 942Continuing operations 4,734 4,619underlying operating profit 1 (£m) <strong>2011</strong> 2010● Beverage Cans 447 394● Plastic Packaging 102 119Continuing operations 549 513sales 2 (£m)<strong>2011</strong> 4,7342010 4,6192009 4,5332008 4,2542007 3,423underlying operating profit 1 (£m)<strong>2011</strong> 5492010 5132009 4182008 4232007 326financial statements governancesustainabilitybusiness reviewoverview1 Underlying business performance from continuing operations before exceptional items, the amortisation of certain acquired intangible assets and fair value changes onfinancing derivatives.2 Continuing operations. 3 Includes exceptional items, the amortisation of certain acquired intangible assets and fair value changes on financing derivatives.4 Includes discontinued operations.more information in the operating and financial reviews
10directors’ reportbusiness reviewCan making is a high speed, high precision manufacturingprocess with line speeds of up to 2,200 cans per minute.
12 <strong>Rexam</strong> annual report <strong>2011</strong> directors’ reportchief executive’s reviewprogress on all frontsIn 2010, we set out our plans for creatingvalue and improving returns going forward.At the same time, we established the metricswe would use to measure our progress.In short, we said that while laying thefoundations for the future, we wouldcontinue to focus on the management ofthree main areas of our business – cash, costand return on capital. We also said that wewould continue to focus on reducing debt.During <strong>2011</strong>, we made considerableprogress on all of these fronts.Graham Chipchasechief executiveIn <strong>2011</strong>, against a tough economic backdrop, I am proud to reportthat we have delivered on our commitments for the year. As you willsee from the detail in the operating and financial results on pages20 to 33, we delivered strong profit growth. It was particularlypleasing to see that, despite a deteriorating economic climate anda disappointing performance from a number of businesses withinPlastic Packaging, the Group managed to maintain its momentumthroughout the year.In terms of cash, we continued to focus on tight management ofworking capital and a disciplined approach to investing capital.We increased capital expenditure in continuing operations to£227m (2010: £189m), 1.2 times depreciation. Projects includedthe reopening of the plant in Pouso Alegre, Brazil, a new specialtycan line in Mexico, the investment to lightweight can ends in NorthAmerica and the conversion from steel to aluminium of can makinglines in Egypt and Spain. While we have seen no signs of weaknessin can volumes, we are monitoring the situation closely to allowus to defer spend should market conditions deteriorate. Free cashflow from continuing operations was £277m before dividends(2010: £298m).Our relentless focus on operational excellence helped to achievegood cost savings, improve returns and offset input cost inflation.Three main areas have generated the £35m of savings andefficiencies delivered this year: reduction in material usage,especially downgauging and lightweighting of our aluminium cansand can ends; lean manufacturing, which includes investing in newequipment and optimising processes to improve productivity andreduce scrap; and strengthening the organisation and practices ofour Group supply chain which has enabled us to capitalise betteron our global footprint and manage our metal, resin and otherdirect material costs more efficiently. Early in 2012, we weredelighted when our Águas Claras beverage can plant in Brazil wasawarded The Shingo Prize, generally considered the pinnacle ofachievement in operational excellence (see case study on page 23).Return on capital employed (ROCE) improved to 13.7%(2010: 12.3%) thanks to good profit growth and disciplinedcapital management. We are on track to reach the top end of the12% to 15% ROCE target range by the end of 2013. We expectthe most significant uplift towards that target to occur in 2013 asthe contracts signed in North America to recover the beveragecan volume lost in <strong>2011</strong> come into force. In addition, we continueto manage actively the portfolio to improve returns.Our net debt reduced to £1.3bn and our balance sheet is stronger.<strong>Report</strong>ed net debt/EBITDA was 1.8 times compared with 2.4 timesat the end of 2010. Our credit rating is investment grade withstable outlook with both Moody’s and Standard & Poor’s.We have no significant debt maturities until 2013.In the annual report 2010 we highlighted a number of priorities,in addition to efficiencies, to improve our returns going forward.These were maximising asset utilisation, focusing on productinnovation, managing our business portfolio and capitalising onorganic growth opportunities in emerging markets, all the whilemaintaining strict capital discipline.
14 <strong>Rexam</strong> annual report <strong>2011</strong> directors’ reportchief executive’s reviewgrowth in emerging marketsIn <strong>2011</strong>, our sales in emerging markets grew 8% as we continuedto support our customers, and we see further potential for both ourBeverage Cans and Healthcare businesses.In Beverage Cans, we are seeking further opportunities forinvestment as well as bolt on acquisitions or joint venturepartnerships. We announced in August that we were expandingour existing plant outside Mumbai to increase our manufacturingcapacity in India. We were the first to manufacture two piecebeverage cans in India and this latest investment will help secureour foothold and develop the market further. India offers significantgrowth potential as a result of increasing GDP per capita as wellas the presence of major global and regional customers, especiallyfrom the brewing industry.There are a number of regions where we see good opportunitiesto develop new positions or expand the operations thatwe currently have. In the Middle East and Africa, for example,strong GDP growth and the relatively low penetration of beveragecans make these attractive growth markets. There is also afavourable movement in the pack mix towards cans supported bya youthful population more disposed towards this type of beveragecontainer. In addition, the resilience of the can is well suited to theoften tough conditions that exist in the supply chain. The MiddleEast market is fragmented with a high degree of vertical integrationand we are confident that opportunities for consolidation willemerge as markets mature and customers seek credibleindependent supply sources.Asia also has attractive beverage can growth rates. Beveragecan suppliers are already investing to meet that increased demand.We do not directly own any can making facilities in South East Asiabut we are exploring opportunities in the region continually. Theincreased internationalisation of our global customers is anadvantage and we are pursuing opportunities arising from existingrelationships and are in regular talks about their expansion plansinto these regions. We have decided that China, which is currentlya highly fragmented market, is not a priority at this time. Havingsaid that, we shall monitor the market to ensure that we are in aposition to act on any favourable opportunities should they arise.We continue to invest in South and Central American marketsbut, as demonstrated by the deferral of the opening of our Belémbeverage can plant in Brazil until the second half of 2012, we willensure we match capacity with market demand. We have oneplant in Mexico where we make both standard and specialty cansand where the demand for specialty cans is growing strongly.Mexico has a high per capita consumption of drinks sold in cans.Around half of the can making market is vertically integrated withthe beverage producers and we believe that there is potential forconsolidation over time. In Guatemala we have a successful 50/50joint venture with a well established and respected regionalpackaging company in this high growth region. We haveincreased production in recent years and we see further potentialfor consolidation in the market and for bolt on acquisitions.In Healthcare, we are in the process of doubling the capacity of ourplant in Bangalore to meet continued growth in the region. At thesame time we are finalising a contract to manufacture generic drugdelivery devices for a customer in India which will, in time, requireus to build a plant in Western India.sustainable thinkingLast year we highlighted the importance of securing <strong>Rexam</strong>’s longterm future around a sustainability framework based on the threemain areas of products, operations and people. We have madegood progress in developing this model during the year, furtherrefining and adding specific measures and targets to thecommitments we set out last year. You can read more aboutthis on pages 44 to 51.Building a winning organisation is critical to our success.Making sure that our people work in a safe, fair and enjoyableenvironment is core to our values. Our safety statistics remainstrong, as you will see below, but, although there were a numberof outstanding performances by some of our businesses andindividual plants, I am concerned that, as a Group, we did not hitour 10% year on year improvement goal. We are determined todeliver a better performance. We will be learning from theexperiences of our best performing plants and redoubling ourefforts to ensure that in 2012 we make further progress towardsour ‘zero accidents’ target.During the year, we also implemented a number of action plansto address the feedback of our 2010 employee survey. Areassuch as training and development, as well as communication andrecognition, were recurrent themes across the Group in the focusgroups that we held and many of the plans have been targetedat these areas. In response, we have made a concerted andsuccessful effort to prioritise the visibility of our leadership teams.On training and development, one of our objectives is to enableperformance that will differentiate our business. We saw thesuccessful deployment of the <strong>Rexam</strong> Business School and a gooduptake of the courses and training on offer, which range from halfhour online courses delivered via the company intranet in a rangeof languages, to comprehensive, residential courses focusing onspecific skills and areas of leadership. On recognition, weintroduced the ‘Blue Chip’ programme, a cash award equivalentto the value of 50 <strong>Rexam</strong> ordinary shares, which helps deliverimmediate recognition and reward to people who showoutstanding performance and excellence. To date, more than220 Blue Chips have been awarded and the programme hasproved to be a great success.
15key performance indicatorsThese key performance indicators (KPIs) are used by management to measure and track performance. Each KPI relates directly to our longterm strategy and additional information on each of them is contained in the various sections of this annual report.As discussed last year, <strong>2011</strong> was a year for collecting base data for a number of the KPIs. There are therefore some KPIs where there is nocomparable data.overviewtargets <strong>2011</strong> 2010 2009 2008 2007best performanceOrganic sales growth 1 % GDP+ 4 3 (7) 7 11Underlying operating profit growth 1 % GDP++ 8 22 (17) 3 (7)Free cash flow £m Note 2 245 316 290 (128) 24Return on capital employed 3 % 15% by 2013 13.7 12.3 9.5 11.0 11.9customer expectationsCustomer satisfaction score 4 1–10 To be set 7.8 n/a n/a n/a n/aEmerging market sales as percentage of sales % Continuous improvement 32 31 27 27 23Research and new product development 5 £m Note 2 17 19 20 19 14operational excellence<strong>Annual</strong> cost savings and efficiencies 6 £m c £30m 35 34 42 35 32Lost time accident rate 7 LTAR Zero accidents pa 0.28 0.30 0.63 0.76 1.13Carbon intensity 8 ratio –10% by 2013 vs 2010 0.83 0.86 0.91 n/a n/awinning organisationEmployee engagement index favourable score 9 % Continuous improvement n/a 62 n/a n/a n/aValues and leadership practices favourable score 9 % Continuous improvement n/a 53 n/a n/a n/a1 Underlying business performance is continuing and discontinued operations (excluding Glass which was sold in 2007 and Closures in 2010 and <strong>2011</strong>) before exceptional items,the amortisation of certain acquired intangibles and fair value changes in financing derivations. Organic sales growth and underlying operating profit growth are as reported inthe financial review for the relevant years and represent the organic change after adjusting for acquisitions, disposals and currency fluctuations.2 Will depend on investment plans (including capital) going forward.3 Underlying operating profit plus share of associates profit after tax from total operations divided by the average of opening and closing shareholders’ equity after adding backretirement benefit obligations (net of tax) and net borrowings.4 Customer referral score out of 10 from externally conducted survey. This survey was piloted in Europe in <strong>2011</strong> and, from 2012, will be rolled out across the Group’s operations.The Group target will be set once we have the Group wide data.5 R&D spend on a statutory accounting basis, which includes design, construction and testing of preproduction prototypes, models and processes. Our operations also invest in newproduct and process initiatives which are not captured in the statutory figure. Includes spend by discontinued operations prior to <strong>2011</strong>.6 Assuming current Group structure.7 LTAR is the number of lost time accidents times 200,000/total hours worked. Our long term target is zero accidents pa with a near term target of 10% reduction pa.8 Kilogram of carbon per kilogram of raw materials converted (continuing operations).9 Scores from the Group global employee engagement survey conducted around every 18 months (first one conducted in 2010). The next survey is scheduled for the first quarter of 2012.financial statements governancesustainabilitybusiness review
16<strong>Rexam</strong> annual report <strong>2011</strong>directors’ reportmarket reviewThis summary review is based on a numberof external packaging industry sourcessuch as PIRA International, Canadeanand The Freedonia Group, as well as ourown in-house market intelligence team.It highlights the state of the global consumerpackaging market with a brief summaryof trends for the two packaging types that<strong>Rexam</strong> manufactures, beverage cans andrigid plastic packaging. For the first time,we also include a summary of statistics forsome of our key markets which providesa comprehensive overview of their maincharacteristics and drivers.In <strong>2011</strong> the packaging industry faced rising input costs, inflation andsofter trading conditions in many of the larger developed markets.According to the latest economic data, the global economy grew by3.8% in <strong>2011</strong> (2010: 5.2%). The global consumer packaging industrygrew 4.2% and was valued at US$409bn. This compares with a 9%increase in 2009/10, when the market played catch up following theglobal economic downturn.The outlook for 2012 is cautious and there is still uncertainty as to howmarkets will evolve over the next few years. Emerging economies areexpected to represent the driving force of global growth with strongdomestic demand (see table on pages 18 and 19 for individualcountry real GDP growth). In <strong>2011</strong>, for example, the Asia and Rest ofWorld (ROW) region increased its value share of the total packagingmarket to 35%, overtaking Europe. PIRA forecasts that the value ofconsumer packaging industry global sales will continue to grow in thenext five years at an average annual rate of 3.1% to reach US$477bnby 2016.Packaging for food was the largest end use market in <strong>2011</strong> accountingfor just over half the market. Packaging for beverages accounted for18% and packaging for healthcare and personal care for 11% ofsales. The industry saw increased demand for packaging in all enduse markets, led by healthcare.Over the period <strong>2011</strong> to 2016, healthcare packaging is forecastto register the highest value growth (4.5% pa). Food and beveragepackaging is expected to grow by around 3% pa to 2016 in linewith overall packaging.materialsconsumer packaging market valueby pack material <strong>2011</strong> 1● Paper and board 35%● Rigid plastics 27%● Glass 12%● Flexible plastics 10%● Other metal 9%● Beverage cans 5%● Others 2%1 Excludes secondary/bulk and industrial packaging.source: PIRA International <strong>2011</strong> <strong>2011</strong>beverage cansOn a global basis, beverage cans accounted for 5% of theconsumer packaging market value in <strong>2011</strong> with North Americabeing the largest regional market. Overall, the value of globalbeverage can packaging sales showed positive growth of justover 2% driven largely by emerging markets.Beverage can consumption remained healthy in Europe in <strong>2011</strong>growing 3% while fillings grew 5%. Consumption of carbonated softdrinks (CSDs) and energy drinks in cans in Europe increased by 3%.The table on pages 18 and 19 shows the beverage can share for beerand soft drinks and where there are opportunities for beverage cansto grow share.In the US, beer and energy drinks performed better than CSDs in cans.Beer in cans was helped by some brewers of craft beers switching tocans from the traditional glass bottle.The emerging economies offer the greatest potential for beveragecan growth. The strongest growth in value terms is expected inSouth America at 3.5%, followed closely by Asia and ROW at 3.1%.Overall global beverage can sales are expected to grow by around3% pa until 2016 driven by general GDP growth, gains in marketshare over other container types (mainly refillable glass) and, inthe more mature markets, the increase in innovative applications.
17Cans are expanding into new segments like wine, creating newoccasions for drinking from cans. The environmental credentials ofthe can are now better understood (see pages 44 and 45) and thefact that cans are infinitely recyclable should support an increasein demand.plastic packagingPlastic accounted for 37% of all global packaging sales ona material basis in <strong>2011</strong>. Within this category, rigid plasticpackaging accounted for 27% of the consumer packaging marketvalue and dominated healthcare and cosmetics packaging.The total healthcare packaging market grew 6.6% in value in <strong>2011</strong>(2010: 10.6%). Rigid plastics accounted for 52% of the total valueand is expected to grow annually by 4.4%. The healthcare industryhas been impacted by a combination of external factors such asproducts coming off patent and tighter healthcare cost control.Although drug consumption is increasing globally due to greaterprevalence of chronic diseases, an ageing population and higherincomes in emerging countries, there is pricing pressure on theindustry, and regulatory standards are also becoming stricter.A new era is opening up for the pharmaceutical industry, however,with a new mix of growth drivers, such as the rise of generics andbiotech medicines, the over the counter (OTC) segment and growthin emerging markets. Expenditure per capita on OTC medicinevaries widely with Ireland topping the list in Europe at US$116 percapita vs US$21 in Brazil and US$8 in China.Growth in the healthcare packaging market will be supportedby continued improvements in packaging materials leadingto pharmaceutical containers with better aesthetics, barrierprotection, security, ease of use and compliance features. Trendsin the level and mix of worldwide drug consumption will alsocreate favourable growth opportunities. The introduction of new,advanced biotechnology and nanotechnology based medicineswill boost demand for high value added packaging systems.High value added healthcare packaging will also be employedincreasingly to differentiate brand products from generic drugs.The cosmetics packaging market grew by 4.5% in value in <strong>2011</strong>compared with 11% in 2010. Difficult trading conditions continue inmany of the more developed markets. Growth is being driven byemerging markets and the need for basic/medium range products,particularly in skin and hair care. The overall cosmetics packagingmarket is forecast to grow in value by 4.2% a year.Given global recessionary pressures, mass and so called‘masstige’ cosmetics are growing faster than premium cosmetics.Premium make up brands are now competing in an ‘era ofconsequences,’ characterised by more careful considerationof the risks associated with consumption. However, it seemsthat consumers are still willing to pay a premium for cosmeticpackaging that provides practical and functional benefits. In thedeveloping markets, where the premium share for personal careand cosmetics products is very low, creating packaging that cangive mass/masstige a more premium look and feel can be usedto differentiate a product and create growth opportunities.consumer packaging market valueby geographical region <strong>2011</strong> 1● Asia and Rest of World 35%● Europe 33%● North America 28%● South America 4%1 Excludes secondary/bulk and industrial packaging.source: PIRA International <strong>2011</strong> <strong>2011</strong>consumer packaging market valueby end use <strong>2011</strong> 1● Food 51%● Beverages 18%● Healthcare 6%● Cosmetics 5%● Other 20%1 Excludes secondary/bulk and industrial packaging.source:source:PIRAPIRAInternationalInternational<strong>2011</strong><strong>2011</strong>beverage cans only market valueby geographic region <strong>2011</strong>● North America 43%● Europe 26%● Asia and Rest of World 25%● South America 6%source: PIRA International <strong>2011</strong>financial statements governancesustainabilitybusiness reviewoverview
18 <strong>Rexam</strong> annual report <strong>2011</strong> directors’ reportmarket reviewmarket characteristics by numbersThis section looks at some of the important market characteristicsand factors that are acknowledged growth drivers for theconsumer packaging market across a number of our end markets.These drivers include GDP per capita and age demographics,as well as specific ones such as off trade or at home consumption,which is pertinent to our beverage cans business, and averagelife expectancy which has an impact on the healthcare productmarket. A fuller description of global market trends and influencescan be found in ‘packaging unwrapped’, a detailed reporton global trends in consumer packaging which we publishedin mid <strong>2011</strong>.Europe<strong>Rexam</strong> on the map Austria Czech R Denmark France Germany Ireland Italy Netherlands Poland RussiaOur plants – beverage cans 2 1 1 1 3 1 2 – – 3Our plants – plastic packaging – – – 6 1 – – 1 1 –macro facts in our marketsPopulation (millions) 8.4 10.5 5.5 63.2 81.4 4.6 60.6 16.7 38.1 142.4Population over the age of 65 (%) 18 16 17 17 21 12 20 16 14 13GDP per capita (US$’000) 41.8 25.9 37.7 35.0 37.9 39.5 30.2 42.3 20.1 16.7Real GDP growth <strong>2011</strong>/12E (%) 0.9 0.7 1.4 0.2 0.3 1.1 -2.2 0.5 2.5 3.3beveragesCan consumption per capita (cans) 97 19 221** 62 13 91 39 104 102 32Can share (unit volume) – soft drinks (%) 16 4 25 18 2 19 9 22 8 6Can share (unit volume) – beer (%) 26 7 61 22 2 49 22 25 48 25Off trade beer consumption 2010 (%) 63 52 78 78 78 34 61 71 72 91Beverage can recycling share 2009 (%) 50 47 87 40 91 50 53 85 67 75healthcareAverage life expectancy (years) 80 77 79 81 80 80 82 81 76 66Total exp. on health per capita 2008/9 (US$’000) 4.3 2.1 4.3 4.0 4.2 3.8 3.1 4.9 1.4 1.0OTC medicine expenditure per capita (US$) 106 98 63 81 110 116 71 67 80 n/apersonal care and household careTotal exp. on colour cosmetics per capita (US$) 36.9 17.7 34.1 30.1 23.7 28.2 24.2 28.0 10.6 11.3Beauty and personal care – premium share (%) 14 6 35 41 22 25 33 29 10 14Rigid plastic share – PC/HC packaging (%) 63 52 63 63 63 64 72 66 59 50All figures based on <strong>2011</strong>, except where indicated.Financial data uses average currency exchange rates, except for GDP per capita which uses purchasing power parities sourced from the IMF Economic Indicators in September <strong>2011</strong>.* Associate or joint venture. ** Includes cross border trade.
19packaging unwrappedUnder the title ‘packaging unwrapped’, this <strong>Rexam</strong> reportpublished in <strong>2011</strong> looks at the global trends in consumerpackaging and the key growth drivers in mature anddeveloping markets around the world. The report can beviewed and downloaded on www.rexam.com or orderedfrom our corporate affairs department.overviewAmericasAsia/Middle East &AfricaSpain Sweden Turkey UK Argentina Brazil Chile Guatemala Mexico US China India Indonesia S. Korea Egypt2 1 1 2 1 9 1 1* 1 15 1 1 – 1* 1– – – – – 1 – – 2 13 4 1 1 – –46.1 9.4 72.2 62.6 40.9 194.9 17.4 14.7 109.7 312.9 1,348.1 1,206.9 240.5 49.0 79.417 20 6 17 11 7 10 4 7 13 9 6 6 11 530.6 40.6 14.6 36.0 17.4 11.8 16.2 5.0 15.1 48.1 8.4 3.7 4.7 31.8 6.5-1.7 1.4 3.0 0.6 4.6 3.0 4.7 3.0 3.5 1.8 8.2 7.0 6.3 4.4 1.8153 119 23 124 13 109 55 40 86 337 19 1 4 119 1026 23 11 25 1 20 5 20 9 43 18 1 2 44 740 80 31 53 20 52 58 15 38 57 8 17 25 43 5052 81 71 48 85 47 74 n/a 79 79 79 69 44 53 4057 91 75 52 91 97 65 n/a 50 54 99 n/a n/a n/a n/a81 81 73 80 77 73 78 71 77 78 75 67 72 79 733.1 3.7 0.9 3.5 1.1 0.9 1.2 0.3 0.9 8.0 0.3 0.1 0.1 1.9 0.353 53 22 78 9 21 14 n/a 18 94 8 2 7 56 9financial statements governancesustainabilitybusiness review18.8 49.8 4.4 31.9 4.0 10.9 8.1 n/a 7.4 20.1 1.0 0.2 0.4 16.5 1.330 25 7 31 10 2 9 7 8 33 18 5 n/a n/a n/a72 70 63 59 40 46 51 n/a 45 67 40 16 n/a n/a n/a
20<strong>Rexam</strong> annual report <strong>2011</strong> directors’ reportoperating reviewgroup resultsIn <strong>2011</strong>, <strong>Rexam</strong> as a Group delivered astrong performance. Sales overall increased2% to £4,734m in line with our GDP+ goalas volume growth in Beverage Cans offseta mixed performance in Plastic Packaging.Group underlying operating profit rose 7%to £549m mainly due to improved volumesin standard cans in Europe and in specialtycans in all our regions, supported by ourcontinued focus on cost reduction andefficiencies. Underlying profit before taxincreased 15% to £450m chiefly due tothe improvement in operating profit andalso to a lower total underlying net financecost. Underlying earnings per share rose15% to 36.1p.André Balbi Cerviño group director,beverage can AmericasTomas Sjölin group director,beverage can Europe & AsiaMalcolm Harrison group director,plastic packagingOn an organic basis, which excludes the impact of disposals andcurrency translation, sales grew 4%, mainly due to the strongperformance in Beverage Cans. Organic underlying operatingprofit increased 8%.statutory resultsOn a statutory basis, which includes the effect of currencytranslation and exceptional and other items, profit before tax fromcontinuing operations was £431m (2010: £338m). Exceptionaland other items totalled £19m before tax comprising restructuring,amortisation of certain acquired intangible assets and fair valuechanges on financing derivatives. Total profit for the financialperiod, which includes discontinued operations, was £376m(2010: £124m) and total basic earnings per share was 43.1p(2010: 14.2p). The financial review on pages 26 and 27 containsa reconciliation between statutory and underlying results.beverage cans<strong>2011</strong> 2010Sales £3,786m £3,677mUnderlying operating profit £447m £394mReturn on sales 11.8% 10.7%Return on net assets 31.6% 27.6%Beverage Cans is a high speed, high precision manufacturingbusiness. Excellence in manufacturing and engineering,along with innovation, quality and customer service, are keyto delivering value to our customers. <strong>Rexam</strong> Beverage Cans isa global business centred on three main regions: Europe, NorthAmerica and South America. It also has operations in Russia,the Middle East, India, China and Central America. This mix givesus a healthy exposure to both developed and emerging markets.Our businesses collaborate on a global basis in areas such assupply chain, innovation, engineering, research and developmentand marketing intelligence. In all, Beverage Cans accounted for81% of <strong>Rexam</strong>’s underlying operating profit from continuingoperations (2010: 77%).In <strong>2011</strong>, Beverage Cans outperformed our expectations. Organicsales, which adjusts for the impact of currency translation, were up 4%including the expected market share loss in North America. Excludingstandard cans in North America, our beverage cans volumes grewclose to 5% bolstered by good volume growth in Europe and inspecialty cans across all regions. Excluding the cost of aluminiumpassed through to customers, organic sales growth was 1%. Organicunderlying operating profit was better than expected, improving by15% to £447m driven predominantly by volume growth but also goodpricing and an excellent performance on cost savings and efficienciesmainly related to downgauging and lightweighting. Our underlyingoperating profit margin improved to 11.8% (2010: 10.7%).In 2012, our cost saving efforts will be very much in focus as weface the specific challenge of absorbing an additional £20m ofmetal conversion costs in our European beverage can business,increases in energy and freight charges as well as start up costs.
21beverage can Europe & AsiaThe European can market currently comprises some 57bn cans.It is our largest beverage can market and we are the leading canmaker with a more than 40% share. In <strong>2011</strong>, the market grew 5%as cans continued to gain share of the beverage packaging mixsupported by a continued shift towards home consumption wherebeverage cans are the single serve package of choice. Our ownvolumes increased 6% following good growth in standard andspecialty cans and growth in Russia. Specialty cans continuedto grow across Europe in general and now represent almost 30%of all cans sold. Our own specialty volumes increased 10% drivenby the continued success of energy drinks in Europe and those filledin Europe for export.A strong first half in Russia was followed, as expected, by a slowersecond half but, for the year as a whole, our volumes were up6% in line with our expectations. Returns on our Russian business(including the acquisition of Rostar in 2008) remain consistentlywell above our regional weighted average cost of capital.The introduction of Europe’s first 75cl can was another milestonefor <strong>Rexam</strong> in the Russian market. Can size is often a key elementin our customers’ marketing strategies and they now have an evenbroader range from which to select. Whilst we will be disciplinedin terms of capital expenditure given the focus on returns, weare currently evaluating options to invest in Eastern Russia to meetgrowing demand and the need to reduce the cost of shippingproducts such as SLEEK cans which are growing in popularity.Our can plant network across Western Europe ran at 95%utilisation during the year and given that we expect the market tocontinue to grow, we announced the construction of a new two linecan making plant in Finland for £68m to open at the start of 2013.We are making further investments in India, installing a high speedaluminium beverage can manufacturing line at the current site inTaloja close to Mumbai. The new line will represent a capitalinvestment of c £30m over two years. It will initially produce 33cl,50cl and SLEEK TM cans and increase capacity from under 400mcans to c 950m per year. Production start up is planned for thefourth quarter of 2012.At the start of 2012, a decision was taken to invest in a fourthproduction line at our can making plant in Ludesch, Austria tosupport the growth of the energy drinks market. The investmentof some £20m will increase our specialty can capacity by around0.7bn cans per year. Start up is planned for the third quarterof 2013.investing in growthFinland has enjoyed a steady transition from refillableglass bottles to cans in recent years, as has theScandinavian and Baltic region in general. The cansshare of the beer pack mix in Finland has risen to morethan 60%, assisted by favourable legislation, but stilllags behind Sweden at 82%. We currently serve this1.2bn can market from our plants in Swedenand Denmark.With our can making network close to full utilisation,additional capacity is required in order to manageplant efficiency across Europe so that we can capturefuture growth in the market. Long distance imports arenot viable in the long run.During <strong>2011</strong> we announced that we would be investingin a new two line can making plant in Finland for £68m.It is planned to open at the start of 2013. The majorityof our customers in Finland and the Baltic countriesare contracted to 2015.financial statements governancesustainabilitybusiness reviewoverview
22 <strong>Rexam</strong> annual report <strong>2011</strong> directors’ reportoperating reviewmetal efficiency mattersImproving resource efficiency in our operations is at the coreof our manufacturing processes, not least because of thecost benefit it brings to us and the packaging supply chain.In beverage can production, approximately 90% of our rawmaterial cost is metal. Metal efficiency is therefore a key areaof priority throughout our can business and we are focused onthe twin processes of lightweighting and downgauging.The gauge of the metal determines the thickness of the dome atthe base of the can. Downgauging – reducing the thickness ofthe metal used – means that more cans can be produced fromthe same amount of metal, whether it is aluminium or steel.Reducing the thickness of the can wall is called lightweighting.Using finite element analysis we can evaluate any proposedrefinements to can design before we set up a line. This hasreduced the risk and the associated cost of tooling development.Another significant advance resulting from the metal efficiencyprogramme in Europe is the adoption of the 'non round cutedge'. A complex modification to the shape of the blankspressed from the coil means less metal is wasted and lessexcess is trimmed from the top of the can body.beverage can North AmericaNorth America remains the largest single can market in the worldat around 95bn cans and we are the second largest can makerwith a c 20% share. In <strong>2011</strong>, our overall volumes declined 14%impacted by the contract losses announced last year. As previouslystated, we have signed contracts to recover most of the volumeloss by 2013, which will help improve asset utilisation.Encouragingly, specialty cans, which now account for some 23%of our overall volume, grew 16% driven mainly by increasedconsumption of energy drinks, beer and iced teas as well as newinnovative beverage categories. Standard cans were down 20% ofwhich 15% related to the loss of contracts and the remaining 5% toweakness in the US soft drinks market.Overall profit in the business, which at the start of the year weexpected to be comparable to that in 2010, was significantlyhigher. The faster than expected growth in specialty cans and therelentless pursuit of efficiencies and cost reduction across ourentire product and manufacturing platform, combined with theimprovement in margins on retained as well as newly securedvolumes, helped drive this strong performance.Our good cash conversion continued and we maintained the strongreturn on net assets that characterises this part of the business.beverage can South AmericaSouth America is a c 25bn beverage can market dominated byBrazil. <strong>Rexam</strong> is the leading can maker in the region. Following avery strong performance in 2010 when the main market, Brazil,grew 18%, our volumes in <strong>2011</strong> were flat as the beverage canmarket in Brazil faced a number of challenges. These included aslowdown in Brazilian GDP growth (from 7% to 3% pa), priceincreases by our customers and particularly unfavourable winterweather conditions. Volumes were also affected by the directimport of cans by our customers. In addition, we lost some volumeshare as customers reallocated their volume requirements closer totheir filling locations to optimise freight costs as new capacity cameon line.Growth in <strong>Rexam</strong>’s specialty cans remained strong at 16%driven primarily by beer producers seeking new formats for theirproducts. Specialty cans now account for 21% of our sales.
23<strong>Rexam</strong> has around 60% of the Brazilian beverage can market andwe are conscious that growth will not always be linear in emergingmarkets. Consistent with our disciplined approach to capitalexpenditure, our planned investment in the new can making plantin Belém (initially announced in April <strong>2011</strong>) will be timed to matchcustomer volume expectations, and is now planned to open in thesecond half of 2012. As stated last year, we have a long termcontract with our largest customer in Brazil which underpins thereturns on existing and future investments in the region.We remain confident of the medium and long term prospects forthe Brazilian market. In the short term, disposable incomes are setto rise in 2012 following legislation on increasing minimum wagelevels and, with customers already preparing for events suchas the FIFA Confederations Cup in 2013, the FIFA World Cup in2014 and the Olympic Games in 2016, we expect to see furthereconomic growth.global recognition of excellenceAt the start of 2012, our beverage can plant in Águas Claras,Brazil, was awarded The Shingo Prize – acknowledged as thehighest global recognition for operational excellence. Two other<strong>Rexam</strong> plants in Brazil, Recife (beverage can ends) and Jundiaí(personal care products) were awarded the Shingo Silver medaland Bronze medal respectively.Improving operational efficiency is at the core ofour manufacturing processes. Plants are regularly assessedunder <strong>Rexam</strong>’s own audit programme but, in the quest forcontinuous improvement, <strong>Rexam</strong> wanted to benchmark itsperformance against the best in the world.plastic packaging<strong>2011</strong> 2010Sales £948m £942mUnderlying operating profit £102m £119mReturn on sales 10.8% 12.6%Return on net assets 23.3% 29.1%Our Plastic Packaging business consists of Healthcare and PersonalCare (which includes High Barrier food containers). It producesstandard and customised rigid plastic packaging solutions fora variety of end markets including pharmaceutical and healthcareapplications, cosmetics, toiletries, household care and food.Many of our products are the leading choice in their markets forcustomers worldwide. In <strong>2011</strong>, Plastic Packaging accounted for19% of <strong>Rexam</strong>’s underlying operating profit from continuingoperations (2010: 23%).Plastic Packaging has a wide variety of products at varying stagesof maturity. Our priority is to improve consistently the returns fromthis portfolio of businesses. The keys to success are innovation inmarkets where there are relatively short life cycles, for example,cosmetics, and the ability to remain entrepreneurial whileleveraging a global network of production and technicalcapabilities. Operational excellence, including the use of leadingedge technology, and the understanding of end market trendsare also essential to maintain stature in these markets.In <strong>2011</strong>, trading in Plastic Packaging was mixed. Organic salesgrew 2% but, excluding resin pass through, sales were flat.Underlying operating profit was 13% down on an organic basis.There were good efficiencies from increased process automationand lower resin usage from lightweighting and savings fromreduced working hours and the elimination of shared costsfollowing the sale of Closures. These were, however, not sufficientto offset the effects of reduced pricing and increased costs andthe impact of lower volumes in Personal Care in North America,particularly in Home and Personal Care, and overall weaker salesin the Healthcare business.financial statements governancesustainabilitybusiness reviewoverviewÁguas Claras was recognised as outstanding in all areasof operation, demonstrating a culture where principles ofoperational excellence are deeply embedded into the thinkingand behaviour of all leaders, managers and employees.With only a small number of organisations awardedThe Shingo Prize each year, <strong>Rexam</strong> now joins an elite group.
24 <strong>Rexam</strong> annual report <strong>2011</strong> directors’ reportoperating reviewhealthcareWith over 3,000 employees and 14 factories across three continents,<strong>Rexam</strong> Healthcare is the global leader in rigid plastic packagingand devices for healthcare applications. It is a well investedbusiness with an experienced management team. It designs,develops and manufactures innovative packaging, includingcontainers and healthcare closures, drug delivery devices,metering pumps and valves and medical components. Its coreexpertise lies in injection moulding and blow mouldingtechnologies and high speed automated assembly in compliancewith Good Manufacturing Practice to meet the quality, safety andconsistency demanded by customers. It also has broad regulatoryknowledge to provide value added support to customers.In <strong>2011</strong>, Healthcare volumes (sales excluding pass through of resincost) were flat. There was weak demand in North America and ouroverall performance reflects our strategy to focus on price andincrease returns.In Pharmaceutical Packaging, strong growth in insulin penswas offset by weakness in inhalers following a quiet flu season.In Prescription, there were some pricing benefits, despite increasedcompetitiveness, but these were offset by lower volumes, againdue to the absence of major flu outbreaks. Primary Packaginghad lower volumes due to pricing pressures.One of the main devices we manufacture for drug delivery is inthe process of coming off patent and this will impact the results ofthe Healthcare business in 2012. This is part of the normal cyclewithin the pharmaceutical industry which is why we continue todevelop a strong product pipeline to fuel future growth.Looking ahead, we expect that there will be more opportunities todevelop or codevelop solutions with pharmaceutical companies asthey focus increasingly on their core business. We have a range ofnew products including insulin pens and the next generationof sophisticated drug delivery devices to replace those comingoff patent.personal careIn Personal Care, overall trading was disappointing despitepockets of good performance. High Barrier Food volumes wereup strongly due to share gains but results in the rest of PersonalCare varied significantly by region. In Europe volumes were flat.We saw some growth in dispensing systems for fragrances andmake up and some weakness in foam pumps. In North America,the consumer remained cautious which led to lower volumes,particularly in Home and Personal Care. In emerging markets,good growth in Brazil was more than offset by weakness of makeup in Asia due to high input costs and competitive pricing.As stated on page 13 we have started the process to activelymarket the Personal Care business for divestment.going forwardWe are targeting revenue growth slightly above GDP, by whichwe mean the aggregate GDP of the major markets in which weoperate, primarily in North and South America and Europe. InEurope, pack mix changes and increased at home consumptionare driving faster than GDP growth. In North America, standardcans are flat to marginally declining but specialty cans continueto grow; overall, however, the US is a gently declining marketregardless of GDP. Finally in South America and other emergingmarkets, we consistently see faster than GDP growth in beveragecans due to increased can penetration as the pack mix changesaway from returnable glass.We expect operating profit to grow faster than sales as increasedvolumes and better utilisation provide good drop through and,over time, efficiencies and pricing offset cost inflation.<strong>Rexam</strong> is a highly cash generative company. Over the last twoyears, we have succeeded in strengthening the balance sheetand protecting our credit rating. We will maintain an appropriatefinancial position but will shift our focus to a combination ofreinvestment in the business and cash returns to shareholders.safe’n’sound ®In <strong>2011</strong>, <strong>Rexam</strong> Healthcare received 510(k) approval from the Food and Drug Administration (FDA) for Safe’n’Sound ® , a passive safety device forprefilled syringes.The approval is the crowning achievement of significant investment and efforts in terms of design by the <strong>Rexam</strong> teams. The aim of the project was todesign a safety device that meets the current regulations in North America and in Europe. These regulations are aimed at protecting workers in thehealth sector from needle injuries and contamination from blood borne pathogens.The fully passive Safe’n’Sound ® device provides effective protection against the risks of being pricked by a soiled needle, thanks to the protectivesheath which activates automatically once the medicine has been administered.This FDA approval shows <strong>Rexam</strong>’s commitment to innovation, safety and quality.
25balancing returns and growthSales growth GDP +Pack mix changes in EuropeGrowth in specialty cans inNorth AmericaGrowth in emerging marketsoverviewSurplus cashReturned to shareholdersInvestmentOrganic investmentc 1.0–1.5 timesdepreciationunderpinsGDP + growthBolt on acquisitionsIt is important to reinvest in the business so as to deliver our growthtarget on a sustainable basis. We recognise the need for disciplineand will invest only in projects with good growth and returnprofiles. We aim to keep investment in the range of 1.0–1.5 timesdepreciation. In 2012 there are several large projects happeningat the same time and we will be at the high end of the range thisyear. We will be similarly disciplined with regard to any bolton acquisitions to strengthen our market positions or increaseour capabilities.In terms of cash returns to shareholders, our dividend policy is tohave a dividend cover in the range of 2.0–2.5 times underlyingearnings. With a strengthened balance sheet and the good <strong>2011</strong>trading performance, we are now in the range. Surplus cashwhich is not reinvested in the business over time will be returnedto shareholders.Since 2009 we have generated close to £550m of free cashflow, reduced costs by more than £120m and improved returnon capital employed from 9.5% to 13.7%.Maximise longterm shareholdervalue aiming toreach 15% ROCEby 2013Cash generationStrong balance sheetInvestment gradecredit ratingDividendDividend cover 2.0–2.5 timesOperating profitgrowth GDP ++Efficiencies andpricing offset costinflation over timeGood drop throughfrom increasedvolume andutilisationNet debt has reduced from £1.8bn at the end of 2009 to £1.3bnat the end of <strong>2011</strong> aided by good profits and the proceeds fromClosures, but also largely through our own managementof working capital and capital discipline.2012 outlookIn closing, we are delighted with the continued progress of thebusiness in <strong>2011</strong>. Our strong profit growth was achieved by abetter than expected performance in our Beverage Cans business,primarily in Europe, and continued focus on cost management.Looking ahead, we remain cautious about the global economyand, as indicated, we face certain cost challenges in 2012 togetherwith the impact of a key Healthcare product coming off patent. Thevolume environment for Beverage Cans remains robust, althoughwe do not anticipate any turnaround in the performance of PlasticPackaging in the near term. Overall, we expect 2012 to be anotheryear of progress as we continue to focus on cash, costs and returnon capital employed.financial statements governancesustainabilitybusiness review
26 <strong>Rexam</strong> annual report <strong>2011</strong> directors’ reportfinancial reviewgroup overviewIn <strong>2011</strong> we delivered record profits,reported a robust cash flow and furtherstrengthened our balance sheet. With goodprofit growth and our continued disciplineregarding investment and use of capital,we have made significant progress towardsour ROCE target for 2013.David Robbiefinance directorThis financial review of our results is principally based on what weterm the underlying business performance, as shown in the tablesbelow. This excludes exceptional items, the amortisation of certainacquired intangible assets and fair value changes on financingderivatives (together ‘exceptional and other items’). We feel thatthe underlying figures aid comparison and understanding of theGroup’s financial performance.Discontinued operations comprise the Closures business whichmanufactured beverage and specialty closures. Further detailsof the trading results of Closures and the accounting impact ofits disposal are set out on page 30.Underlyingbusinessperformance¹£mExceptionaland otheritems£mTotal£m<strong>2011</strong>Continuing operations:Sales 4,734 – 4,734Operating profit/(loss) 549 (42) 507Share of associates and jointventures profit after tax 9 – 9Total net finance cost 2 (108) 23 (85)Profit/(loss) before tax 450 (19) 431Profit/(loss) after tax 315 (12) 303Discontinued operations:Profit for the year 73Total profit for the year 376Total basic earnings per share (p) 43.1Underlying earnings per share (p) 36.1Interim dividend per share (p) 4.7Proposed 3 final dividendper share (p) 9.7
27Underlyingbusinessperformance¹£mExceptionaland otheritems£mTotal£m2010Continuing operations:Sales 4,619 – 4,619Operating profit/(loss) 513 (40) 473Share of associates and jointventures profit after tax 5 – 5Total net finance cost 2 (128) (12) (140)Profit/(loss) before tax 390 (52) 338Profit/(loss) after tax 274 (38) 236Discontinued operations:Loss for the year (112)Total profit for the year 124Total basic earnings per share (p) 14.2Underlying earnings per share (p) 31.4Interim dividend per share (p) 4.0Final dividend per share (p) 8.01 Underlying business performance is the primary performance measure usedby management, who believe that the exclusion of exceptional and other items aidcomparison of underlying performance of continuing operations. Exceptional items includethe gains and losses on disposal of businesses, the restructuring and integration ofbusinesses, major asset impairments and disposals, significant litigation and tax relatedclaims and significant gains arising on reduction of retiree medical and pension liabilities.Other items include the amortisation of certain acquired intangible assets (customercontracts and relationships and technology and patents) and fair value changes onfinancing derivative financial instruments.2 Total underlying net finance cost comprises net interest of £92m (2010: £113m) andretirement benefit obligations net finance cost of £16m (2010: £15m).3 Subject to approval at the AGM 2012 and payable on 7 June 2012.Results on a statutory basis include disposed businesses, currencytranslation and exceptional and other items and discontinuedoperations. The exceptional and other items and the results ofdiscontinued operations are described in more detail on pages102 and 106. Sales for continuing operations were £4,734m(2010: £4,619m) and profit before tax including exceptional andother items was £431m (2010: £338m). Total profit after tax for theyear, including the results of discontinued operations, was £376m(2010: £124m) and total basic earnings per share was 43.1p(2010: 14.2p).The following tables, showing sales and underlying operatingprofit, compare the continuing operations on a consistent basisto demonstrate ‘like for like’ trading performance. This basisexcludes discontinued operations. Organic change is the yearon year change arising on continuing operations at constantexchange rates.analysis of sales movementTotal£mBeverageCans£mPlasticPackaging£mSales reported 2010 4,619 3,677 942Currency fluctuations (53) (43) (10)Sales 2010 pro forma basis 4,566 3,634 932Organic change in sales 168 152 16Sales reported <strong>2011</strong> 4,734 3,786 948Organic sales, which exclude the impact of discontinuedoperations, disposals and currency, increased by £168mor 4%. The increase in Beverage Cans includes £113m relating tothe increase in aluminium cost pass through together with volumegains in Europe and in specialty cans globally and good pricing inEurope and South America partly offset by previously announcedreductions in standard can volume in North America. For PlasticPackaging, the growth was attributable to the pass through ofhigher resin costs and some volume recovery in High BarrierFood containers offset by volume reductions in Personal Careand Healthcare.analysis of underlying operating profit movementTotal£mBeverageCans£mPlasticPackaging£mUnderlying operating profitreported 2010 513 394 119Currency fluctuations (6) (4) (2)Underlying operating profit 2010pro forma basis 507 390 117Organic change in underlyingoperating profit 42 57 (15)Underlying operating profitreported <strong>2011</strong> 549 447 102financial statements governancesustainabilitybusiness reviewoverview
28 <strong>Rexam</strong> annual report <strong>2011</strong> directors’ reportfinancial reviewA further analysis of the organic change in underlying operatingprofit from continuing operations is set out below.Total£mBeverageCans£mPlasticPackaging£mSales price and cost changes 7 18 (11)Volume and mix changes – 17 (17)Efficiency and other savings 35 22 13Organic change in underlyingoperating profit 42 57 (15)Underlying operating profit, after adjusting for the impactof discontinued operations, disposals and currency, rose by£42m or 8% reflecting an improvement in pricing and efficiencysavings across the Group partly offset by lower volumes andless favourable mix in Plastic Packaging. Efficiency savings of£35m came from the application of six sigma and lean enterprisemethodologies across the Group. In Beverage Cans, major savingsarose from lightweighting, spoilage reduction, downgauging andreduced utility usage. In Plastic Packaging, the major contributorswere lower material usage and improved operating efficiency.exchange ratesThe main exchange rates used to translate the consolidated incomestatement and balance sheet are set out below:<strong>2011</strong> 2010Average:Euro 1.15 1.17US dollar 1.60 1.55Russian rouble 47.12 46.96Closing:Euro 1.19 1.17US dollar 1.54 1.54Russian rouble 49.59 46.77consolidated income statementThe principal currencies that impact our results are the US dollar,the euro and the Russian rouble. The US dollar and the Russianrouble weakened against sterling in the year while the eurostrengthened. The net effect of currency translation caused salesand underlying operating profit from ongoing operations toreduce by £53m and £6m respectively compared with 2010as shown below.Sales£mUnderlyingoperatingprofit£mUS dollar (81) (9)Russian rouble (1) –Euro 20 3Other currencies 9 –(53) (6)In addition to the translation exposure, the Group is also exposedto movements in exchange rates on certain of its transactions.These exposures are largely hedged and principally include theUS dollar/euro/Russian rouble and the US dollar/Brazilian realmovement for the European and South American beverage canoperations respectively.consolidated balance sheetMost of the Group’s borrowings and net assets are denominatedin US dollars and euros. Currency movements reduced netborrowings by £29m and net equity by £16m.total underlying net finance cost<strong>2011</strong>£m2010£mNet interest (92) (113)Retirement benefit obligations net finance cost (16) (15)Total underlying net finance cost (108) (128)The total underlying net finance cost fell by £20m compared withthe prior year. The reduction in total net interest is primarily dueto lower average net borrowings following strong cash inflowstogether with lower bank facility fees offset by foreign exchangetransaction losses on financing items. The overall average interestrate for the year was around 5.8% compared with 5.7% in 2010.Based on underlying operating profit, interest cover was 6.0 times(2010: 4.5 times). Interest cover is based on underlying operatingprofit from continuing operations and underlying net interest expenseexcluding charges in respect of retirement benefit obligations.
29taxThe tax charge for the year on continuing operations was£135m (30%) on profit before exceptional and other items(2010: £116m (30%)). The rate reflects the mix of territoriesin which we operate offset in part by the availability of taxincentives in certain jurisdictions and the management of taxrisks. We anticipate the rate to remain around the same levelin 2012.Cash tax payments by continuing operations in the year were£81m (2010: £67m) with an additional £5m (2010: £8m) beingborne by discontinued operations. Cash tax is lower than thecharge to the income statement due to the utilisation of deferredtax assets and the timing of tax payments. It is expected that thecash tax paid in future years will remain below the underlying taxcharge in the consolidated income statement, in the range of 65%to 75% of that charge.exceptional and other itemsThe exceptional and other items arising in <strong>2011</strong> in respect ofcontinuing operations were as follows:£mRestructuring of businesses, including impairments (16)Amortisation of certain acquired intangible assets (26)Total exceptional and other items includedin operating profit (42)Financing derivative market value changes 23Total exceptional and other items before tax (19)Tax on:Restructuring of businesses, including impairments 4Amortisation of certain acquired intangible assets 9Financing derivative market value changes (6)Total tax on exceptional and other items 7Total exceptional and other items after tax (12)exceptional itemsrestructuring of businessesThe restructuring charge of £16m on continuing operationscomprises £11m in Plastic Packaging (including £2m relatedto asset impairments) and £5m in Beverage Cans. We havepreviously stated that following the disposal of Closures it would benecessary to reorganise the remaining Plastic Packaging businessto address the level of shared service administration support andto rationalise those retained plants which were co production siteswith the Closures businesses. Overall, this restructuring is expectedto cost £24m: in <strong>2011</strong>, £11m was charged in respect of continuingoperations and a further £11m reported under discontinuedoperations. The remainder will be charged in future periods.The Beverage Cans cost was in respect of the previouslyannounced plant closures. The total cash cost of restructuringin continuing operations in the year was £19m.other itemsamortisation of certain acquired intangible assetsIntangible assets, such as technology patents and customercontracts, are required to be recognised on the acquisition ofbusinesses and amortised over their useful life. The directorsconsider that separate disclosure, within exceptional and otheritems, of the amortisation of such acquired intangibles relatingto total operations amounting to £26m (2010: £32m) aidscomparison of organic change in underlying profit.fair value changes on financing derivativesThe fair value of the derivatives arising on financing activitiesdirectly relates to changes in interest rates and foreign exchangerates. The fair value will change as the transactions to which theyrelate mature, as new derivatives are transacted and due to thepassage of time. The fair value change on financing derivativesfor the year was a net gain of £23m (2010: net loss £12m). Theimpact of derivatives arising on trading items such as commoditiesand forward foreign exchange contracts is included withinunderlying operating profit.financial statements governancesustainabilitybusiness reviewoverview
30 <strong>Rexam</strong> annual report <strong>2011</strong> directors’ reportfinancial reviewdiscontinued operations – closuresA summary of the performance of discontinued operations is setout below.<strong>2011</strong>£m2010£mSales 205 343Underlying operating profit 13 22Underlying profit before tax 13 22Underlying profit after tax before exceptionaland other items 8 13Exceptional and other items includedin operating profit:Profit on disposal 91 –Impairment of goodwill and other assets (34) (179)Restructuring (5) (6)Amortisation of certain acquiredintangible assets – (14)Tax on exceptional and other items 13 74Exceptional and other items after tax 65 (125)Profit/(loss) for financial year after tax 73 (112)The underlying performance reflected the decline in beverageclosures, with sales down by some 10% for the period to disposal,offset partly by efficiency and other savings.The disposal of the Closures business was completed on1 September <strong>2011</strong> giving rise to an overall profit in <strong>2011</strong> of £91m.This profit included foreign exchange translation differencesarising on Closures net assets since the date of their acquisition,some £89m, which have been recognised in the income statement.In <strong>2011</strong>, the assets of Closures were impaired by £28m and furtherimpairments of £6m, together with £5m of related costs, wereincurred under the restructuring programme initiated followingits disposal as described under ‘exceptional items’ above.earnings per share<strong>2011</strong> 2010Underlying earnings per share – continuingoperations (p) 36.1 31.4Basic earnings per share – total operations (p) 43.1 14.2Average number of shares in issue (millions) 872.6 875.6Year end number of shares in issue (millions) 877.0 876.9Underlying earnings per share from continuing operationsincreased by 15% to 36.1p (2010: 31.4p). This is due to theimprovement in underlying operating profit together with thereduction in total underlying net finance cost.The basic earnings per share, which includes exceptional andother items and discontinued operations, was 43.1p per share(2010: 14.2p). The increase reflects the improvement in underlyingprofit, the reduced impact of exceptional items and the gainrealised on completion of the disposal of Closures.retirement benefitsRetirement benefit obligations (net of tax) as at 31 December <strong>2011</strong>were £371m, an increase of £54m compared with £317m reportedat 31 December 2010. This was principally due to changes inactuarial values amounting to £76m (after tax) as set out below.£mDefined benefit pension plans:Plan liabilities – lower discount rates (280)Plan assets – higher than expected returns,principally on bonds 139Demographic changes 35Actuarial losses before tax (106)Tax 30Actuarial losses after tax (76)Changes to the actuarial value of retirement benefits at thebalance sheet date are reported in the consolidated statementof comprehensive income.A detailed analysis of retirement benefits is set out in note 27 to theconsolidated financial statements.
31The retirement benefit obligations net finance cost is analysedas follows:<strong>2011</strong>£m2010£mDefined benefit pension plans:Expected return on plan assets 142 144Interest on plan liabilities (148) (152)(6) (8)Retiree medical – interest on liabilities (6) (7)(12) (15)Cost recognised in the income statement onannuitisation of certain US retirement obligations (4) –Retirement benefit obligations net finance cost (16) (15)The retirement benefit obligations net finance cost, which is anon cash accounting charge, increased marginally to £16m from£15m in the prior year. A charge in respect of historic fair valuemovements recognised in the income statement following theannuitisation of certain US pension obligations was offset by alower net finance cost. It is estimated that the overall net financecost in 2012 will remain at a similar level.The total cash payments in respect of retirement benefits areas follows:<strong>2011</strong>£m2010£mDefined benefit pension plans 46 27Other pension plans 10 12Retiree medical 9 12Total cash payments 65 51Cash payments to defined benefit pension plans were higher thanin 2010 mainly as a result of increases in the deficit funding to theUK and US plans. Based on current actuarial projections, it isexpected that cash contributions to defined benefit pension plansin 2012 will be at a similar level to <strong>2011</strong>. A triennial valuationof the UK defined benefit plan was undertaken as at 31 March<strong>2011</strong>. It is expected, when the valuation is complete, that the planwill be fully funded at that date. Future funding arrangements arecurrently being discussed with the plan trustees.cash flowTotal free cash flow for the year from continuing operations resultedin an inflow of £277m compared with £298m for 2010. This lowerinflow primarily reflects an increase in capital expenditure, higherretirement benefit cash contributions offset by a significantimprovement in underlying operating profit and lower restructuringcharges. Net cash flow was £337m (2010: £212m), including freecash flow from discontinued businesses, net proceeds from thedisposal of Closures and after paying dividends.<strong>2011</strong>£m2010£mContinuing operations:Underlying operating profit 549 513Depreciation and amortisation 1 191 197Retirement benefit obligations (41) (27)Change in working capital (19) (20)Restructuring costs (19) (41)Other movements 3 25Cash generated 664 647Capital expenditure (net) (226) (181)Net interest and tax paid (165) (173)Loan from joint venture 4 5Free cash flow from continuing operations 277 298Free cash flow from discontinued operations (32) 18Free cash flow 245 316Dividends paid to non controlling interests (1) –Equity dividends (111) (105)Business cash flow 133 211Disposals 2 204 1Cash flow including borrowings acquiredand disposed 337 212Share capital changes (18) (6)Exchange differences 29 (38)Other non cash movements 24 (24)Net borrowings at the beginning of the year (1,684) (1,828)Net borrowings at the end of the year 3 (1,312) (1,684)1 Excludes amortisation of certain acquired intangibles amounting to £26m (2010: £32m).2 Disposal proceeds offset by £1m (2010: £nil) in respect of a capital injection in ajoint venture.3 Net borrowings comprises borrowings £1,838m (2010: £1,881m) less cash and cashequivalents £412m (2010: £114m) and financing derivatives £114m (2010: £83m).financial statements governancesustainabilitybusiness reviewoverview
32 <strong>Rexam</strong> annual report <strong>2011</strong> directors’ reportfinancial reviewcapital expenditure – continuing operations<strong>2011</strong> 2010Capital expenditure (gross) 1 (£m) 227 189Depreciation and amortisation 2 (£m) 191 197Ratio (times) 1.19 0.961 Capital expenditure is on a cash basis and includes computer software that has beencapitalised.2 Amortisation excludes £26m (2010: £32m) amortised on patents, customer contracts andintangibles other than computer software.Gross capital expenditure by continuing operations was £227m,c 1.2 times depreciation and amortisation, of which approximately70% was attributable to strategic and growth projects. Theprincipal projects in Beverage Cans were to support growthin South America, the development of specialty can products,a new plant in Finland, the conversion of three lines from steelto aluminium in Spain, Egypt and India and the introduction ofa lightweight end in response to market developments andcustomer requirements. Plastic Packaging investment continuedto be focused on new product development.It is expected that capital expenditure from continuing operationsin 2012 will be around £300m, 1.5 times depreciation andamortisation.balance sheet and borrowingsAs at31.12.11£mAs at31.12.10£mGoodwill and other intangible assets 2,177 2,231Property, plant and equipment 1,590 1,571Retirement benefits (net of tax) (371) (317)Net assets classified as held for sale 2 232Other net assets 233 2923,631 4,009Total equity, including non controlling interests 2,319 2,325Net borrowings 1 1,312 1,6843,631 4,009Return on capital employed 2 (%) 13.7 12.3Net borrowings/EBITDA 3 (times) 1.8 2.4Interest cover 4 (times) 6.0 4.5Gearing 5 (%) 57 721 Net borrowings comprise borrowings, cash and cash equivalents and certain derivativefinancial instruments.2 Underlying operating profit plus share of associates and joint ventures profit after tax ofcontinuing and discontinued operations divided by the average of opening and closingof shareholders’ equity after adding back retirement benefit obligations (net of tax) andnet borrowings.3 Based on net borrowings divided by underlying operating profit plus depreciation andamortisation from continuing operations, excluding amortisation of certain acquiredintangible assets.4 Based on underlying operating profit of continuing operations divided by underlying netinterest expense.5 Based on net borrowings divided by total equity including non controlling interests.The level of net borrowings at 31 December <strong>2011</strong>, down by £372mcompared with the previous year, primarily reflects strong cashflow and favourable impact of currency translation and othernon cash movements. The currency denomination of our netborrowings, including financing derivatives, is as follows:As at31.12.11£mAs at31.12.10£mUS dollar 1,051 1,424Euro 439 299Sterling and other (178) (39)Net borrowings 1,312 1,684For the management of foreign currency asset matching andinterest rate risk, the profile of gross borrowings is 68%(2010: 75%) in US dollars, 32% (2010: 22%) in euros and nil%(2010: 3%) in other currencies.Our net borrowings/EBITDA based on continuing operationshas strengthened from 2.4 times in 2010 to 1.8 times followingthe reduction in net borrowings and improvement in underlyingoperating profit. Interest cover is at 6 times and we remaincomfortably within our debt covenants. Our liquidity is strongwith committed debt headroom of over £1.2bn at the year end.At 31 December <strong>2011</strong>, the Group’s principal committed loan andbank facilities totalled some £2.6bn in varying currencies andmaturities, as detailed below:Currency MaturityFacility£mSubordinated bond Euro swapped to US$ 2067 654Revolving credit facility Multi currency 2016 602Bilateral credit facilities Multi currency 2016 207US private placementand bond US$ 2013 503Medium term note Euro 2013 536Bilateral credit facilities Multi currency 2012 50Total committed loanand bank facilities 2,552Following the disposal of Closures, and to take advantage ofprevailing market conditions, the revolving credit facility andcertain bilateral credit facilities were amended during the year.Their maturity was extended to November 2016 with options toextend by a further two years, the level of facilities was reducedby £219m and ongoing commitment fees were lowered.
33Net borrowings include interest accruals and certain financialderivatives as set out below:As at31.12.11£mAs at31.12.10£mNet borrowings excluding derivativefinancial instruments 1,426 1,767Derivative financial instruments (114) (83)Net borrowings 1,312 1,684Derivative financial instruments comprise instruments relating tonet borrowings (cross currency and interest rate swaps) and thoserelated to other business transactions (forward commodity andforward foreign exchange deals). Total derivative financialinstruments are set out below:As at31.12.11£mAs at31.12.10£mCross currency swaps 110 82Interest rate swaps 4 3Foreign exchange forward contracts – (2)Derivative financial instruments includedin net borrowings 114 83Other derivative financial instruments (55) 47Total derivative financial instruments 59 130The increase in the value of cross currency swaps can be mainlyattributed to a decrease in the longer term forward interest ratesand to a decline in the liquidity of the euro. The reduction in valueof other derivatives was due mainly to the fall in aluminium prices.financial statements governancesustainabilitybusiness reviewoverview
34 <strong>Rexam</strong> annual report <strong>2011</strong> directors’ reportkey risksenterprise risk managementEffective management of risk is essential tothe achievement of our business objectivesand to the protection of our people, assetsand reputation. Identifying, assessingand managing risks is integral to the waywe run our business. It is part of our focuson operational excellence and bestperformance which are key priorities forthe Group. The various risks attached to ouractivities are consistently assessed, recordedand reported in a visible, structured andcontinuous manner to ensure necessarycontrols are in place.<strong>Rexam</strong> risk management process<strong>Rexam</strong> objectives<strong>Rexam</strong> risk management processThe enterprise risk management function reports directly tothe chief executive. The function serves to further improve theintegration and efficiency of our risk management framework and,in doing so, to address the increased demands and requirementsfrom external and internal stakeholders. It draws together our riskbased responsibilities and enhances the good risk managementprocess and practices already in place across the Group.This section describes our well established risk managementprocess including the enhancements made during <strong>2011</strong>,and outlines the main factors that may affect the implementationand execution of our strategy.<strong>Rexam</strong> objectivesThe purpose of the <strong>Rexam</strong> risk management process (knowninternally as the ARC process) is to support achievement of <strong>Rexam</strong>’soverall objective to deliver shareholder value. Although risk cannever be eliminated, the process aims to identify and setappropriate mitigation responses for the key risks faced by <strong>Rexam</strong>.The approach is based around the ISO 31000 risk managementprocess and on both the bottom up and top down assessmentsof strategic, financial and operational risks.risk identificationThe first stage of our risk management process is to identify therisks faced by <strong>Rexam</strong>. This is initially a bottom up process withbusiness units and functions undertaking a biannual process ofrisk identification. Risk workshop sessions, current risk registers,intelligence on risks identified by other companies and a riskcategorisation check list are used to structure and support theprocess. The enterprise risk management function leads andsupports the process but is also there to challenge the findings.Executive directors and other senior leaders are closely involvedat critical stages in the process. They review, challenge and debatethe risks identified from a top down perspective. The resultantoutput is a list of risks faced by <strong>Rexam</strong> for each business unit andfunction – the risk register.risk identificationrisk assessmentrisk mitigationrisk reportingrisk monitoringdevelopment
35risk assessmentThe next stage involves the assessment of each identified risk onthe register in terms of its likelihood of occurring, and the impacton <strong>Rexam</strong> if the risk does occur. Performing an assessment oflikelihood and impact at both a gross and net level (before andafter the effect of mitigation) enables us to identify the key materialrisks for each business and function and consider the effect of currentmitigations on reducing risk. To aid assessment we use specific tools,such as the Heat Map Matrix and Radar, to illustrate the impactand likelihood of different risks, and to show their trend over time.Images of these tools are shown below for illustrative purposes<strong>Rexam</strong> risk management tool – heat map matriximpactof riskMajorSignificantoverview<strong>Rexam</strong> risk management tool – radarRisk 1Risk 10Risk 9Risk 8Risk 7Risk 6■ Year 1 ■ Year 0Risk 2Risk 5Risk 3Risk 4ModerateMinorInsignificantRare Unlikely Moderate Likely Almostcertainlikelihood of risk occurring■ Very high■ High■ Medium ■ Lowrisk mitigation responseOnce risks have been assessed an appropriate mitigation responseis determined for each risk identified. The mitigation response willdepend upon the impact and likelihood assessment and, forexample, may consist of a control action or insurance. The riskmitigation response reduces either the likelihood of the riskoccurring or the impact on <strong>Rexam</strong> if the risk does occur or both.risk reportingWhen we have assessed the risks and the responses have beendetermined, each business unit and function provides a risk reportto the enterprise risk management function. These reports areconsidered together and a Group level risk register is producedshowing the key risks to <strong>Rexam</strong> and key mitigation responses.Ownership of each key Group risk is allocated to a member ofthe executive leadership team.financial statements governancesustainabilitybusiness review
36 <strong>Rexam</strong> annual report <strong>2011</strong> directors’ reportkey risksrisk monitoringThe Group level risk register is monitored by the board througha monthly report which updates on the trend of the key risk andmitigations. During <strong>2011</strong> this monthly report was enhanced bythe addition of ‘key risk indicators’ to support the monitoring of risktrends. The executive leadership team, the audit and risk committeeand the board all review the output from the risk managementprocess on a periodic basis. The audit and risk committee alsoreviews the overall risk management process itself. The mainmitigation activities for key identified risks are used as an inputto determine coverage under the annual internal audit plan.developmentWe are looking continually to improve our risk managementprocess. During <strong>2011</strong>, a project to determine future developmentopportunities considered external best practices and the followingwere implemented:heat map matrixThis tool was developed along best practice lines into a 5 by 5impact and likelihood matrix. The risk assessment process groupsrisks into four areas of ‘very high’, ‘high’, ‘medium’ and ‘low’ andthe matrix uses a colour coding to illustrate this at both a gross andnet assessment level. The new matrix also considers risks with nonfinancial impact, such as reputational and health and safety,to avoid solely focusing on the financial impact of risks.risk descriptionsThe way risks are described within the process was madeconsistent and a requirement to describe risk drivers andconsequences was added. This aids analysis and also the creationof mitigation plans by considering the factors driving risks.risk mitigations actions formThe risk mitigation section of the process was developed tosupport improved tracking and follow up of mitigations bybusiness units and functions to ensure they are in place andhaving the required effect.behaviour based safety programmeThe behaviour based safety programme (BBS) was devised toencourage <strong>Rexam</strong>’s plant employees to focus on safety duringtheir daily activities. During <strong>2011</strong> we enhanced the ‘safetybingo’ initiative which was designed to recognise employeesand plants that were actively participating in the ‘goodbehaviour’ programme. Its main objective was to reinforce<strong>Rexam</strong>’s commitment to its employees’ safety, and highlighthow important each person’s behaviour is in preventingaccidents. <strong>2011</strong> was the year when the plants that use it reallygot to see the results of a well implemented BBS programme.The employees’ level of engagement and safety awarenesswas higher than ever, which enabled some plants to achieveoutstanding performance. In total more than 70% of our sitesdid not have a lost time accident in <strong>2011</strong>.“In the Jacareí beverage can plant in South America, BBS is atool that promotes a change in culture and motivates employeesto protect themselves and their peers. Pointing out unsafebehaviour is important, but recognising safe behaviourstrengthens our vision of safety,” said Rui Cesar Silva,Production Manager, Jacareí.The overall BBS programme has ambitious targets andinnovations for 2012 and will be strengthened across <strong>Rexam</strong>.legislative risk monitoring toolThe legislative framework of the countries in which we operateand sell products is evolving constantly as new governmentsare elected and the profiles of different issues are raised.From experience, we know that a small percentage of anynew legislation could have an impact on our business, throughincreased costs or changes to markets. The main risk to thebusiness is legislation that is primarily focused on our products(ie packaging), but legislation that is designed to address otherissues can have an indirect effect on our markets (eg taxes oncertain food and drink products).In <strong>2011</strong> our Beverage Can Europe & Asia sector establisheda team from across our European operations which monitorsproposed changes to existing legislation and proposed newlegislation to assess its impact on our business. This enablesus to understand and reduce the risks associated with anyproposed changes to legislation and focus resources to mitigatethese potential risks where appropriate. In 2012 this approachwill be rolled out across <strong>Rexam</strong>.
37summary of key Group risksSet out in the tables below (in no particular order) is a summaryof the key risks for the Group as a whole. Although the globalfinancial and economic situation has heightened many risks andexposed new ones, the challenge remains the same in terms ofidentifying the most relevant risks, assessing their impact andimportance and developing appropriate methods to eliminateor mitigate them.The tables provide brief descriptions of the key types of risk towhich the Group is exposed and identifies, in each case, theirpotential impact on the Group and the principal processes in placerisk description key mitigationEconomic downturnAluminium and otherinput cost increasesThe risk of economic downturn in <strong>Rexam</strong>’skey markets and its impact upon demandfor consumer packaging. This risk hastrended higher through <strong>2011</strong> followingconcerns over growth and debt levels inWestern economies leading to reducedGDP growth forecasts.Aluminium is our most significant raw materialcost. Resin is also important to us and wepurchase steel for our European beveragecan operation. High volatility in input pricesmay have a material impact on our results.One consequence of a substantial rise couldbe a change in demand for our products ascustomers adjust their packaging mix and thematerials they use. This risk has trended higherthrough <strong>2011</strong> as, despite easing somewhat inthe final quarter, commodity prices have beenhigher overall in <strong>2011</strong>, thus flowing throughinto inflationary pressure.to manage and mitigate the risk. Each risk is specifically ownedby a member of the executive leadership team. The tables do notprovide an exhaustive analysis of all risks affecting the Group.Not all of the factors listed are within the control of the Group andother factors besides those listed may affect the performance ofits businesses. Some risks may be unknown at present and otherrisks, currently regarded as immaterial, could turn out to bematerial in the future. Further information on the process by whichrisk is managed and reported is covered in the risk managementand internal control section in the corporate governance report(pages 64 and 65).In line with the strategic priority of best performance,<strong>Rexam</strong> closely manages capital investment andis focused on maximising utilisation of its assets.Furthermore, in response to the increasing trendof this risk, we use scenario planning within ourbudgeting and planning processes to help identifymitigation actions which would be implemented shouldthis risk increase further.In beverage cans, almost all of our aluminium ingotneeds are on a pass through basis or hedged. In theAmericas businesses, we charge the majority of ourcustomers on a pass through basis while in Europe 75%of our supply costs are on this basis. To mitigate the riskon the remaining aluminium ingot exposure, we hedgethe aluminium cost and associated currencyrequirements. The pass through and hedge riskmanagement applies to metal ingot but not the can sheetwhich is covered by long term supply contracts.We purchase aluminium and steel from a small numberof regional and global suppliers with whom we havelong term relationships and contracts.In plastic packaging, over 80% of the resin costs areon a pass through basis which includes resin escalator/de‐escalator provisions that allow change in our sellingprice as resin prices change. Where possible, we alsohedge some of our resin exposure.financial statements governancesustainabilitybusiness reviewoverview
38 <strong>Rexam</strong> annual report <strong>2011</strong> directors’ reportkey risksrisk description key mitigationNational political andeconomic stabilityCompetitiveenvironment trendsChanges in packaginglegislation and regulatoryenvironmentThe risk of political or economic instabilitywithin a region that <strong>Rexam</strong> operates in andits impact on performance. <strong>Rexam</strong> operatesin countries and regions with diverseeconomic and political conditions andsensitivities. Our expansion in emergingmarkets, as well as the regional politicalinstability and civil unrest seen through<strong>2011</strong>, means that the trend of this riskis increasing.The risk of adverse commercial impact upon<strong>Rexam</strong> from customer and competitor activities.This risk can be driven by dependency on keycustomers, competitor activity, price pressureor contract negotiations.The risk of changing legislation impactingthe markets in which <strong>Rexam</strong> operates.Packaging will continue to be a focus forgovernment legislators working withinthe sustainability agenda. Changes inpackaging legislation and regulationaffecting producer responsibility forrecycling, recycled content, carbonfootprint and landfill taxation representan increasing trend risk.Emerging market risks are assessed in detailby management when considering investmentopportunities and setting financial policies andprocedures. These risks are then regularly reviewedas part of the ongoing management of our business.We also take external advice on specific matters anduse local external advisors. We will continue to carryout reviews of key risk areas both internally and withexternal expert support.Many of our largest customers have traded with us formany years, during which time we have built up a stronginterdependency and sense of partnership and addedproduction capacity to strengthen our footprint. Theserelationships and investments increase the likelihood ofretaining customers. We continue to focus on providingvalue adding service and innovation as well as competitiveperformance which are key parts of our strategic focusof strengthening our customer relationships.<strong>Rexam</strong> continually monitors changes or proposedchanges in laws or regulations that may adverselyaffect our business if implemented arbitrarily. This isdone through established and effective membership ofrelevant trade associations, by direct collaboration withgovernmental and non governmental organisations andthrough our own efforts which include a new legislativerisk monitoring tool that was introduced in <strong>2011</strong> asdescribed on page 36. This ensures the best possiblechance of shaping a constructive outcome whichis not detrimental to <strong>Rexam</strong> or our stakeholders.the risk councilA key development action in <strong>2011</strong> was the creation of the Risk Council. The team meets quarterly and consists of a senior managementrepresentative from each of <strong>Rexam</strong>’s business units along with key people from the enterprise risk management and internal audit functions.The team is responsible for supporting the development and implementation across the Group of agreed enhancements in enterprise riskmanagement and to facilitate best practice sharing and implementation of processes, tools, mitigation plans and controls. The team also overseesand supports the <strong>Rexam</strong> risk management process with the representative from each of the business units leading the risk management work in theirrespective area. This enhanced governance structure has helped us to integrate and develop risk management across the business, for exampleby supporting and implementing the developments in the risk management process and sharing best practice mitigations such as the legislative riskmonitoring tool (see page 36).
39risk description key mitigationCounterparty failureChanges in consumertastes, nutritionalpreferences, healthrelated concerns andenvironment relatedconcernsPension deficitRisk of counterparty failure (for examplebank, insurer, customer or supplier) resultingin financial exposure for <strong>Rexam</strong>. The currentmore challenging macroeconomicenvironment increases the risk ofcounterparty failure.The risk of changing consumer trends resultingin a shift in demand away from productsfor which <strong>Rexam</strong> manufactures packaging.Drivers of this risk can include lifestyleand taste change, nutrition and healthconsiderations or environmental concerns.Risks relate to cash contributions, chargesto the income statement and balancesheet volatility.A range of financial counterparties are used andwe have strict limits on our exposure to each of them.These limits are determined by a range of qualitativeand quantitative measures that are embedded into ourtreasury system such that any breaches are automaticallyreported. The limits are automatically updated by factorssuch as credit rating change and also reviewed regularlyfor any qualitative changes. The risk of insurer failureis monitored by our insurance broker and reportedregularly. Customer credit limits are imposed andtheir credit risk, as well as that of suppliers, is reviewedand monitored. In addition, we have procedures acrossthe business to manage working capital tightly.We continue to monitor market and consumer trendsas well as political developments through our own andexternal business intelligence services and through ourinvolvement in national and international packagingassociations in the countries and regions wherewe operate.<strong>Rexam</strong>’s retirement benefit risk management is overseenby the retirement benefits committee (RBC) whichis chaired by the finance director. The RBC reviewsall proposed new promises for and improvements toretirement benefits. Managing pension deficit volatilityon the balance sheet and general de‐risking of fundedplans, which includes equity, interest rate and inflationrisk are undertaken by pension plan fiduciaries inconsultation with the RBC. Cash contributions are paidhaving regard for regulatory requirements in thecountries in which the respective plans operate.financial statements governancesustainabilitybusiness reviewoverview
40 <strong>Rexam</strong> annual report <strong>2011</strong> directors’ reportkey risksrisk description key mitigationBusiness interruptionEnvironmental, fire,health and safetyEvery business faces the potential risk ofits operations being impacted by disruptiondue to loss of supply, industrial disputes,failures with technology, physical damageas a result of fire, flood or other such event.The risk of a significant environmentalcontamination, fire or health and safetyissue at one of our locations which canhave an impact on the safety of ouremployees, or on our financial situation orour reputation.As part of our strategic focus on operational excellence,<strong>Rexam</strong> has established protocols and procedures acrossthe Group as a whole such that plans are in place toensure business continuity in our operations. Strongrelationships with customers and suppliers mean that,where possible, there are arrangements in place toensure alternative sources of supply or production forcritical product lines. <strong>Rexam</strong> also has insurance in placeto cover losses associated with interruption to businessfor a limited period as a result of property damageor supply failure.We carry out regular environment, health and safety(EHS) audits in cooperation with internal and externalspecialists to drive the plants to best practice. The auditapproach was developed through <strong>2011</strong> to provide thebasis for delivering a more sustainable and robustimprovement of EHS management systems andperformance at all sites.In addition we introduced a high standard fire safetyand property protection audit supported and performedby AXA Matrix, an independent provider of suchservices.
41risk description key mitigationSupply of faulty orcontaminated products<strong>Rexam</strong>’s reputation as a business partner reliesheavily on its ability to supply quality productson time and in full. The consequences of notbeing able to do so could be severe. Suchconsequences might include adverse effectson consumer health, loss of market share,financial costs and loss of turnover.Within our strategic focus on operational excellence wehave strict control measures and externally accreditedsystems in place to ensure that the safety and quality ofour products are maintained. <strong>Rexam</strong> also has insurancein place to cover legal liabilities to third partiesassociated with product liability.overviewTax risksFraud, bribery, internalcontrol failureFundingIn an increasingly complex international taxenvironment, some uncertainty is inevitablein estimating our tax liabilities.The risk of an internal control failure suchas a <strong>Rexam</strong> employee committing fraudor bribery.Risks related to the cost and availability of fundsto meet our business needs, movements ininterest rates, foreign currency exchange ratesas well as commodity prices. Improvement inbalance sheet metrics through <strong>2011</strong> means thisrisk has a reducing trend, but it remains a keyrisk for <strong>Rexam</strong>.We seek to plan and manage our tax affairs efficientlyin the jurisdictions in which we operate. Tax planningwill complement and be based around the needs of ouroperating businesses. We exercise our judgement inassessing the required level of provision for tax risk andallocate resources appropriately to protect our position.The <strong>Rexam</strong> Code of Conduct provides a frameworkfor all of our policies at Group, sector and individualbusiness level. Training is also carried out in key areassuch as the antibribery policy, to ensure that employeesare aware of their responsibilities. A Group controlframework, setting out key financial controls to beapplied across the Group, is being developed forimplementation in 2012 in order to ensure consistencyand further enhance the control environment.<strong>Rexam</strong>’s Raise Your Concern helpline also allowsemployees to raise anonymously any concernsregarding behaviour that does not conform with<strong>Rexam</strong> policies.<strong>Rexam</strong>’s financial risk management is based upon soundeconomic objectives and good corporate practice. <strong>Rexam</strong>negotiates funding requirements in a timely manner ensuringappropriate headroom is secured to mitigate availability risk.Derivative and other financial instruments are used tomanage exposures under conditions identified by the boardand monitored by its finance committee. In response to thecurrent instability in Europe a ‘euro crisis committee’ has beenestablished to monitor risks, create contingency plans andtake actions as appropriate. Further details of our financialrisks and the way in which we mitigate them are set out innote 26 to the consolidated financial statements.financial statements governancesustainabilitybusiness review
42 <strong>Rexam</strong> annual report 2010directors’ reportsustainability<strong>Rexam</strong> Healthcare’s core expertise lies in injectionmoulding and high speed automated assemblyin compliance with Good Manufacturing Practice.
43This section provides a review of oursustainability performance in <strong>2011</strong>.It explains our approach to and progressin this area, and details our commitments,measures and targets going forward.44 products47 operations49 peoplefinancial statements governancesustainabilitybusiness reviewoverview
44 <strong>Rexam</strong> annual report <strong>2011</strong> directors’ reportsustainabilityWe believe that running our businesssustainably is essential to near term successand long term prosperity. Our Group visionis to be the best global consumer packagingcompany and this includes our actions inand around sustainability, encompassingproducts, operations and people.Our customers look for partners who taketheir corporate responsibilities seriously.Our approach has been to identify realisticgoals that our customers can depend uponas they seek to reduce the environmentalimpacts of the products they commercialiseand to assure an ethical supply chain.products: enhanced valueoperations: efficient use of resources<strong>Rexam</strong> remains an established member of the London Stock ExchangeFTSE4Good index, an international responsibility performancebenchmark. The index’s expectations mirror the way we believebusiness should be conducted to deliver sustainable successthrough environmental management, upholding human and labourrights, ethical business practices and supply chain labour standards.Line management responsibility for sustainability sits in theGroup’s executive leadership team, and at the start of 2012 weappointed a director of group sustainability within the corporateaffairs function.Following earlier work to determine the main issues relevant to usand our stakeholders, in <strong>2011</strong> we further developed oursustainability framework, built around our 12 specific commitmentson products, operations and people, identifying the mostappropriate quantifiable measures and objectives for thesecommitments and agreeing stretching targets for each measure.products: enhanced valuePrimary packaging is designed to prevent waste and to getcustomers’ products efficiently and safely into consumers’ hands.It is an essential component of a modern and sustainable society,where consumers place a high priority on convenience.By its very nature, however, packaging is highly visible and in aworld of scarce resources it is something that can attract negativeattention from some consumers, media and environmentalists.<strong>Rexam</strong> is aware of the need to review and optimise theenvironmental performance of its packaging with respect to allrelevant life cycle stages. But this analysis of environmental impactsmust include the effects of product losses that might result from theuse of too little packaging as well as that of using too much.Working across the complete supply chain, finding the balancebetween under‐packaging and over‐packaging, is at the heart ofour approach and is the key to ensuring packaging continues tomake a positive contribution to a sustainable society.The availability of raw materials is vital to <strong>Rexam</strong>’s future and weare taking more ownership for their sustainability. The strategy forour different raw materials is similar in terms of conservation andefficiency but is different in terms of end of life recycling/recoveryor substitution.Beverage cans are made entirely from metal, principally aluminiumand some steel. Both materials are permanent, ie the metal is bothfully recoverable and recyclable as an infinitely reusable material.Independent life cycle studies confirm that promoting and supportingan increase in recycling rates is the most valuable contribution tosustainability that beverage can manufacturers can make.people: engaged employees
‘In <strong>2011</strong>, we reduced our total carbon intensity perkilogramme of raw material converted by 3.5% to0.83 CO2 equivalent (2010: 0.86 CO2 equivalent)underpinned by further reductions in our electricityand gas consumption.’Graham Chipchase chief executive45For plastics, we recognise that fossil fuels are a finite resource andwe design for recycling and use recycled products as raw materialswherever feasible. As plastic has a high energy content, and itsCO2 emissions are some 25% less than coal, we also supportthe use of energy recovery from waste as a means to providingan environmentally beneficial solution to managing plasticpackaging waste.we will promote and support the most relevant recyclingand value recovery system for our productsAcross our beverage can sectors our vision is to keep the metalin a closed material loop: our aim is for zero cans ending up inlandfill following consumers’ use of the product. This makes goodeconomic sense due to the high value of the materials, more thancovering the cost of their collection, as well as environmental sensewith up to 95% of the energy needed for primary productionsaved. As metal can be continually reused, every tonne of recycledmaterial offsets the need to use a tonne of virgin raw material.Many countries in which we operate have well establishedrecycling infrastructures that function efficiently. In those marketsthat require long term support to establish and enhance collectionmechanisms and build a recycling culture with consumers we arecommitted to providing this support.the consumer goods forumIn <strong>2011</strong> the Consumer Goods Forum released the GlobalProtocol on Packaging Sustainability to enable the consumergoods industry to better assess the relative sustainability ofpackaging. This endorsed the Innventia AB model which showsthat the environmental consequences of product losses causedby excessive packaging reduction are far greater thanguaranteeing adequate protection through an incrementalexcess of packaging.NegativeenvironmentalimpactUnder-packagingOver-packagingOptimum pack designMinimumenvironmentalimpactThe Every Can Counts (ECC) programme, which <strong>Rexam</strong> funds andhelps manage, has continued to expand in Europe. Its goal is toencourage the recycling of beverage cans used outside the home,in the workplace and on the go. For example, in <strong>2011</strong>, 10 UK musicfestivals actively supported ECC with over 1,000,000 cansrecycled after c 500,000 young people participated. ECC nowoperates in four countries with low recycling rates and furtherexpansion is planned for 2012.As detailed on page 51, our businesses in Europe, North andSouth America cooperated with local organisations and charitiesto promote recycling within their sites’ local communities.In Plastic Packaging we have initiated a taskforce to createan eco design scorecard that recognises the importance ofrecyclability and the use of recycled materials. Any new productthat we introduce in the future will be measured against thisscorecard in order to determine its sustainability credentials.key measures and targetsThe key measures for this commitment are the average canrecycling rates in our major markets and, going forward, howour new plastic packaging products measure up against oureco design scorecard.Recycling rates for beverage cans vary across countries, due todifferent operating environments, culture and lifestyles. We reportthese together with the targets set by industry associations of whichwe are a member.Beveragecan averagerecyclingrates (%)2015 targets 2010 2009 2008 2007Europe 75 n/a 1 68 68 66USA 63 58 57 54 54Brazil 98 98 98 91 961 European 2010 recycling rates will be published mid 2012.We intend to incorporate the eco design scorecard into thenew product development process within Healthcare and tohave 100% of potential new products being evaluated by theend of 2012.overviewfinancial statements governancesustainabilitybusiness reviewMinimummaterialIncreasing packagingmaterial weight or volume1 Derived from ‘Environmental Impact of Packaging: Performance in theHousehold’ report by Dr Jan Kooijman, Food Technology Consulting.source: source: The The Consumer Consumer Goods Goods Forum Forum
46 <strong>Rexam</strong> annual report <strong>2011</strong> directors’ reportsustainabilitywe will work with policymakers to ensure packagingmakes a positive contribution to sustainability<strong>Rexam</strong> is an active member of various national and internationalindustry and research associations as well as trade bodies,encompassing our beverage cans and plastic packagingoperations, who engage with policymakers on our behalf.These often draw their membership from the whole supplychain so that they have a cohesive constructive approachto policy issues at national, regional and local levels.<strong>2011</strong> saw the launch of Metal Packaging Europe (MPE),established by senior executives from the major aluminium, steeland packaging converter companies. MPE brings together metalpackaging manufacturers, metal producers and their existing tradeassociations to promote the unique strengths of metal packagingto help address the social, environmental and policy challengesfaced by the industry.In our beverage can business in Europe, we piloted a legislativeand environmental risk assessment and mitigation managementsystem. This ensures that policy issues impacting our business areidentified, their potential impact assessed and appropriate riskmitigation strategies put into place. This highlighted a number ofpolicy risks which together with mitigation strategies were sharedwith senior executives in the business as part of the overall riskmanagement process. We aim to expand this system across thewhole Group in 2012.key measure and targetOur key measure is the percentage of mitigation plans in placeagainst identified risks with regard to legislative, regulatory andenvironmental issues across all of our regions. Our target is 100%.metal is foreverMetal offers infinite recyclingpossibilities while preservingvirgin metal qualities andproviding unlimited availabilityfor future generations.we will engage with our customers and the supply chainto minimise the environmental impact of packaging andpackaged goodsPackaging cannot be taken in isolation. The best way to achievelasting improvements in environmental performance is to engageconstructively with our customers and suppliers, seeking solutionsin a partnership approach although priorities may differ. Thisprovides opportunities for <strong>Rexam</strong> to take a leadership positionthrough the promotion and application of best practice across theGroup, whether in employee health and safety, lightweighting,logistics efficiency or packaging optimisation.Priorities for customers vary from how we treat our employees tothe delivery of lower carbon products where step changes inmaterials and closed loop material cycles are sought. Many of ourcustomers work in partnership with us to progress their corporateresponsibility and sustainability objectives.Part of our commitment to being a responsible and sustainableorganisation is our membership of the Carbon Disclosure Project(CDP) as detailed on page 48. A large proportion of thegreenhouse gas emissions related to our packaging comes fromthe raw materials we convert. In <strong>2011</strong>, we asked our key suppliersto participate in the CDP to give us an understanding of ourcombined carbon footprint and also to understand where,together, we can make improvements and drive out cost.During the second half of <strong>2011</strong> <strong>Rexam</strong> engaged with a third partyto audit our European businesses required to comply with REACH.A subsequent best practice road map was developed for reviewand implementation through 2012.key measures and targetsFrom 2012, we will report the customer feedback survey resultsfrom sustainability professionals within our client base. We aimto achieve a consistently ‘good’ score (ie above 7/10).In <strong>2011</strong>, 50% of our major suppliers signed up to the CDP, and ourtarget is to increase our supplier response rate to 80% by 2015.source: Metal Packaging Europe
47we will meet long term environmental and regulatorytrends with innovative new productsInnovation is critical to our success both commercially and interms of underpinning our long term prosperity.In <strong>2011</strong> we introduced a Global Innovation Council to promoteinnovation ideas relating to our products and processes across theGroup’s beverage cans operations. This increased focus and firmprocess for sharing ideas will drive future product and processdevelopment. In Plastic Packaging, we launched various newproducts, including the Panache TM spray mechanism, the R shapedlipstick case and the Advancia TM nasal spray.We continue to research and evaluate the viability of non fossil resins.key measureDuring <strong>2011</strong>, on a statutory accounting basis, we invested £17m inR&D in continuing operations. This includes design, constructionand testing of preproduction protoypes, models and processes.Our operations also invested in related new product and processinitiatives which are not reported in this statutory figure. In 2010 weinvested £19m (including £3m in discontinued operations). Goingforward, we shall continue to ensure that our total investment inR&D remains appropriate to ensure our long term future.operations: efficient use of resources<strong>Rexam</strong> has a good record of increasing material efficiency andreducing energy consumption. In <strong>2011</strong>, we demonstrated our highstandards of operational excellence by nominating severalexemplar plants to be externally verified against the Shingoassessment, an internationally recognised evaluation of worldclass operational excellence. One plant was awarded therenowned Shingo Prize (see page 23). Underpinning this externalverification, we have an established internal process measuringlean enterprise progress, with an internal award system of Bronze,Silver, Gold and Beyond Gold. Ongoing training in lean tools iswell established and integrated into all levels of our plant operatingstructure. In <strong>2011</strong>, 70% of our plants (2010: 50%) achieved Goldor Beyond Gold.we will improve our material efficiencyWe believe that by continuing to share operational best practice,and applying six sigma and other continuous improvementmethods across the Group, we will be able to achieve <strong>Rexam</strong>’svision of best performance both in terms of our financial resultsand our environmental record.This year we have continued to improve on our raw materialefficiency by cutting the tonnes of raw material per tonne ofproduction to 1.14 (2010: 1.15).The beverage can is infinitely recyclable and our raw materialincludes metal that has been reprocessed many times over.We have been committed to driving further reductions in termsof the amount of metal used per can this year, and our persistencehas paid off. We pride ourselves on bringing innovative productsto market, and this year we began to adopt a new lightweightinnovation in HealthcareNovelia TM is the unique preservative free multidose eye dropsystem designed by <strong>Rexam</strong>. Compared with traditional unitdose solutions, it also significantly reduces the amount of plasticrequired, reduces drug wastage by over 90% and also reducesvolume by nearly 90% due to its space efficient design.90%supporting beverage customersin BrazilWe enhanced a customer’s range of 11 juice drinks by printingfruit images with high quality definition inks which dramaticallyincrease consumer attractiveness of the brand.We used tactile inks to help relaunch a major beer brand witha unique touch effect. This can was recently highlighted ina case study by a packaging magazine in Brazil.can end technology which uses 10% less metal compared withthe standard beverage can ends. Across our can making businessour global lightweighting programmes in <strong>2011</strong> resulted in a metalsaving of 10,000 tonnes vs 2010.Our plastic packaging operations maintained their strongperformance on material efficiency. We also promote activelythe recycling of plastic waste.key measuresThe key measures to monitor our improved material efficiencyare the conversion efficiencies across the Group and the totalannual lightweighting savings for beverage cans. In line withone of our four core values, we target continuous improvementin material efficiency.Tonnes of rawmaterial pertonne ofproduction<strong>2011</strong> 2010 2009Group 1.14 1.15 1.24Beverage Cans 1.16 1.17 1.30Plastic Packaging 1.07 1.07 1.08Lightweightingsavings (‘000 tonnes) Beverage Cans 10.0 11.7 12.0overviewfinancial statements governancesustainabilitybusiness review
48 <strong>Rexam</strong> annual report <strong>2011</strong> directors’ reportsustainabilityroad to railOur North American beverage can business is spearheadinga new intermodal freight system that prioritises trains over trucks.In <strong>2011</strong>, nearly 1,500 truck loads were moved to rail, representinga 1,700 tonnes saving of CO2.1,700 tonneswe will improve our carbon efficiency and reduce theenergy and water we useWe use resources every day, whether it is electricity, natural gasor water to make our products or fuel to transport them to customers(sea, road, rail). With this frequent consumption <strong>Rexam</strong> is extremelyconscious of, and committed to, reducing usage.By focusing on energy consumption reduction and more efficientsupply chain management, we reduced our total CO2 footprintto 1.00m equivalent tonnes (2010: 1.06m equivalent tonnes).We are members of the CDP, an international referenceorganisation dedicated to reducing industry’s carbon impacton the environment, and we provided energy consumption andmanagement data for the <strong>2011</strong> survey (which is the full yearinformation for 2010).In <strong>2011</strong>, we set up a project to establish a comprehensive carbonmanagement system, including emissions which cover indirectemissions from sources not directly controlled by the organisation.In the UK, we are registered with two energy/CO2 schemes: theClimate Change Agreement (CCA) to ensure our compliance withthe Climate Change Levy; and the CRC Energy Efficiency Schemewhich will seek to capture energy usage from non CCA sites. Themajority of our energy usage in the UK is covered by thelongstanding CCA at our UK manufacturing sites and we continueto comply with the requirements of this scheme.Although we do not use a large amount of water in our operations,we recognise the value of this increasingly scarce resource which isbecoming more central to the sustainability strategies of many ofour beverage customers. In our beverage can plants, we reuse thewater needed for washing the cans during the manufacturingprocess via closed loop recovery systems. In our plastic packagingbusinesses, the water needed for the manufacturing process isalmost negligible.In <strong>2011</strong> we provided water consumption and management data forthe CDP (Water) survey.key measures and targetsThe key measures we use to monitor our performance in reducingour use of energy and water, and in improving our carbonefficiency, are our consumption of resources and carbon intensitynormalised against production.For Beverage Cans, we measure the reduction in energy used pertonne of production. In <strong>2011</strong>, we achieved a 3% reduction versus2010. Our target is to achieve a total reduction of 10% in theperiod between 2010 and 2013.In Plastic Packaging, the amount of energy used per tonne ofproduction increased by 2% in <strong>2011</strong> driven by lower overallproduction volumes. Our target is to achieve a total reduction of8% in the period between 2010 and 2013.With regard to our carbon efficiency, we are targeting a reductionin carbon intensity per kilogramme of raw material converted of10% between 2010 and 2013.MWh of gas/electricityused per tonne of canproduction2013 targets <strong>2011</strong> 2010 2009–10%(vs 2010) 2.72 2.80 3.30MWh of gas/electricityused per tonne of plasticproduction 1 –8%(vs 2010) 2.92 2.85 3.12Total Group carbonintensity (kg carbon perkg of raw materialconverted) 1 –10%(vs 2010) 0.83 0.86 0.911 Excludes discontinued operationsIn 2012, we will establish the baseline for our water consumptionand then develop targets going forward.reducing waste in AustriaOur two beverage can plants in Austria have installed a newfiltration system that avoids the creation of filter cake, ourlargest waste stream by weight, and which normally goes tolandfill. In <strong>2011</strong> this innovative process avoided approximately500 tonnes of filter cake waste and prevented the use of48 tonnes of waste water chemicals.500 tonnes
49we will reduce our waste to landfillWe use lean six sigma tools to drive out waste from ourmanufacturing processes. A specific KPI based on the reductionof waste to landfill is being implemented across the Group toensure we are sharing strategies to reduce this towards zero.In Beverage Cans, the single largest component of our waste tolandfill is a side product from the manufacturing process calledfilter cake. There are a number of different approaches dependingon local conditions. In some locations we are able to eliminate filtercake (see page 48) whereas in others we are diverting this wastefrom landfill to an alternative use. An internal project team isworking to roll out the appropriate solutions across the business.key measure and targetIn the short term, we aim to establish a consistent measure of wasteto landfill at all our sites with the immediate objective of reducingfurther waste to landfill. Our long term objective is to achieve zerowaste to landfill.we will improve the environmental performanceof our sitesAll our sites have robust Environmental Management Systems (EMS)in place, and we encourage external verification where appropriate.Even when external verification is not sought, we adopt EMS, whichare internally verified, that include key elements of ISO 14001.In <strong>2011</strong>, 100% of our 83 plants were verified against ISO 14001or equivalent standard (2010: 58%/48 plants).We target zero significant uncontrolled or abnormal releases,and delivered this again in <strong>2011</strong>.In addition to our focus on improving the environmentalperformance of our manufacturing plants, we are also actingto reduce the environmental impact of our office sites. In <strong>2011</strong>,our North American beverage can headquarters moved intonew offices which we designed and refurbished to exactingenvironmental standards. This office has received Leadership inEnergy and Environmental Design (LEED) status, which certifiesthat the construction of the new space was completed withina recommended framework of leading environmental‐friendlydesign, construction, operations and maintenance solutions.key measures and targetsOur measures for <strong>Rexam</strong> sites’ environmental performance arethe amount of uncontrolled or abnormal releases we have, whatpercentage of our plants are ISO 14001 certified (or equivalent),as well how many of our regional/Group offices areenvironmentally accredited.Our long term targets are to continue having zero uncontrolled orabnormal releases, to continue to have 100% of our plants ISO14001 certified (or equivalent) and for 100% of our regional/Groupoffices to be environmentally accredited.people: engaged employeesWe realise that we can only achieve our vision to be the best globalconsumer packaging company with committed, engaged and wellsupported employees. We base our approach to, and expectationof, our employees around our four <strong>Rexam</strong> values of continuousimprovement, recognition, teamwork and trust.We are committed to ensuring our employees work in a safe, fairand enjoyable environment. We also encourage our people to beactive members of their local communities. Furthermore, we believeinvesting in our people: providing the resources, environment andopportunity for them to develop their skills and capabilities isintegral to our vision.we will make sure our people work in a safe andhealthy environment<strong>Rexam</strong> is dedicated to implementing world-class environmental,health and safety processes and culture across the Company.In <strong>2011</strong>, our health and safety performance showed continuedimprovement with a 7% reduction in Lost Time Accident Rates(LTAR) 1 compared with 2010. In excess of 70% of our sites did nothave a lost time accident in <strong>2011</strong>. We believe in the importance ofcontinually engaging with our employees and for this reason ourBehaviour Based Safety (BBS) initiative continued into <strong>2011</strong>.We record all incidents relating to health and safety. Metrics suchas LTAR and Days Away Restricted Time allow us to investigate andshare best practice across the Group. We use the number of workdays and/or restricted time incidents to track the severity of injuries.In <strong>2011</strong>, we had 14 significant injuries (which exceed 30 lost orrestricted days), consisting of fractures, strains and cut injuries. Wealso introduced a new environmental health and safety audit,which over 40% of our sites have completed to date.During the year, we established a central operational technicalstandard to ensure a consistent approach to safe workingpractices. We also created a global operational risk managementpolicy which will be launched in 2012. The policy covers fire safetyand property protection, site and travel security, business continuitymanagement and environmental health and safety. Each of theseis measured through proactive input and KPIs. We believe theseapproaches to health and safety will drive benchmarking and bestpractice sharing across the Group to achieve world classoperational risk status.In <strong>2011</strong> we had no significant property loss incidents (2010: nil).We support employees’ wellbeing by offering employee wellnessprogrammes (eg subsidised gym memberships, health checks orexercise regimes).overviewfinancial statements governancesustainabilitybusiness review1 LTAR is the number of lost time accidents times 200,000/total hours worked.
50 <strong>Rexam</strong> annual report <strong>2011</strong> directors’ reportsustainabilitykey measures and targetsThe key quantitative measures for this commitment are LTARand the percentage of sites offering some form of employeewellness programme.We target a 10% reduction per annum in LTAR with an ultimateLTAR of zero and we aim to have 100% of our sites offeringemployee wellness programmes by the end of 2012.long termtargets2012targets <strong>2011</strong> 2010 2009LTAR Zero 0.25 0.28 0.30 0.63Sites offering anemployee wellnessprogramme (%) 100 85 75 n/a n/awe will continue to build a winning organisationOur employees are crucial to the delivery of <strong>Rexam</strong>’s goals. Duringthe year, we used the feedback from 2010’s global employeeengagement survey to implement a range of improvement actions.With an 87% response rate and in depth focus groups conductedsubsequently, we were able to identify key areas of opportunity atlocal, sector and global levels. Both our executive leadership teamand all sector leadership teams are committed to improving theirvisibility, fostering trust in leadership, through personally visiting asmany plants as possible, and holding face to face meetings to buildon the dialogue with our employees.Training and development was another key theme. The <strong>Rexam</strong>Business School was launched globally in <strong>2011</strong>, offering a rangeof learning opportunities for our employees. Our course offeringis diverse, from half hour online courses (in a range of languages)through to comprehensive residential courses which focus onleadership and specific skill building. In <strong>2011</strong>, we had around620 employees participate in classroom courses and 592 learnerslogged into CrossKnowledge, our online option. We also had over110 registrations to our ‘Improve your English’ online programme.<strong>Rexam</strong> recognises that communication is key to employeeunderstanding and engagement and we use a variety of tools andchannels. From newsletters and team briefings to intranet updatesand news bulletins, communication is thought of as a two wayprocess between management and employees.12 months without a lost time accidentAfter a huge amount of commitment to engage and shape safebehaviour, our entire South American beverage can operationreached an unprecedented milestone during <strong>2011</strong>– one yearwithout a lost time accident. This exceptional accomplishmentin safety was achieved through the introduction of variousinnovative safety programmes and embedment of them withthe aid of various communication channels.Our South American beverage can business explored new methodsof communication and invited employees to share comments,praise or suggestions through an online ‘Open Channel’.To strengthen everybody’s understanding of our leadershippractices and core values we have introduced a 360 degreefeedback tool for leaders across <strong>Rexam</strong>. The tool helps providea detailed overview of leaders’ strengths and areas of opportunity,as well as self assessment and reflection. The 360 degreefeedback is now available in a range of different languages andhas been well received by the nearly 900 leaders who haveparticipated to date.In 2010, with the implementation of a global SAP HR platform,<strong>Rexam</strong> started a worldwide programme aimed at achievingexcellence in HR service delivery, based on improved peopleprocesses and on an integrated HR information system platform.The expected business benefits are providing consistent and timelyHR transactional services and generating greater employeesatisfaction with basic HR processes.During <strong>2011</strong>, a new global Manager Self Service Portal (MSSP) wasrolled out across the North America and Europe regions. This toolprovides line managers with direct access to information about his/her team and enables them to carry out basic people managementactivities directly via the web based portal.The first activity facilitated through the MSSP was the <strong>2011</strong> salary/merit review process, and <strong>Rexam</strong> line managers now receivereal‐time access to online organisation charts and employeedirectory listings.The <strong>Rexam</strong> European Forum is a joint employee representative andmanagement body created for the exchange of information anddialogue concerning issues which may impact <strong>Rexam</strong>’s employeeswithin the European Economic Area.Communication with employees is considered a key responsibilityfor all managers, and employees are encouraged to participateand give their views on any aspect of the Group’s businessincluding the annual and half year financial results and theeconomic factors affecting the Group’s performance.<strong>Rexam</strong> also has a well established employee share scheme topromote share ownership.key measuresThe key measures for this commitment are sourced from the Groupemployee engagement survey, which will be conducted aroundevery 18 months. The next survey is scheduled for early 2012.We aim to continually improve these scores over time.<strong>2011</strong> 2010Employee engagement index favourablescore (%) n/a 62Values and leadership practicesfavourable score (%) n/a 53
51sources: Associação Brasileira dos Fabricantes de Latas de AltaReciclabilidade, Association of European Producers of Steel for Packaging,Beverage Can Makers Europe, Can Manufacturers Institute, Consumer GoodsForum, European Aluminium Association and Metal Packaging Europe.we will ensure our actions/interactions are guidedby fairness, respect, integrity and honestyTo achieve our vision it is critical that our employees behave withintegrity, fairness and honesty at all times.We are committed to providing a work environment which is freeof discrimination and/or harassment on any level, whether basedon race, sex, disability or any other basis.<strong>Rexam</strong> has equal opportunity policies ranging from selection andrecruitment to training and development to meet the needs of itsoperations around the world. Disabled people are given fullconsideration for employment and subsequent training (including,if needed, retraining for alternative work where employees havebecome disabled), career development and promotion on the basisof their aptitudes and abilities.Our Raise Your Concern (RYC) programme offers the opportunityfor employees to report anonymously any behaviour or activitythey believe is in contravention of the Code of Conduct (CoC)and/or of any of our policies (see pages 66 and 67 for moreinformation on CoC and RYC).key measures and targetsThe key measures for this commitment are the percentageof successfully completed CoC training modules and theresponse rate to allegations made via RYC.For CoC training, we target achievement of 100% completionof training modules.Regarding RYC response rates, historically we have consistentlyachieved an initial response to the concern raised within five days,however, going forward we are targeting an initial response withinfour days.we will encourage all teams to be constructive membersof our local communities<strong>Rexam</strong> is a committed partner in the communities in which weoperate, and as part of this commitment many of our plantsand sites work closely with local charities and groups to makea positive impact.In January <strong>2011</strong>, Rio de Janeiro suffered from a series of destructivefloods and mudslides. Our employees raised almost US$60,000within 15 days, and we provided a lorry to help clear up andreconstruct the area.We also pride ourselves on being an ambassador for recycling,dedicating a large amount of effort in promoting and encouragingit. Our North American beverage can operations’ involvement inthe annual ‘America Recycles Day’ included a six week recyclingcontest. They collected a total of 1,836 metric tonnes of aluminiumcans; this great result saw <strong>Rexam</strong> win first place for the fifth year ina row. Our ‘Community Can Challenge’ was launched in <strong>2011</strong> andinvolved 12 plants across nine European countries. It raised over£15,000 for the plants’ chosen charities and helped promoterecycling and can collection. Over the 10 weeks, employeescollected nearly 400,000 cans (over 6.5 tonnes of metal), equatingto 58 tonnes of CO2. In Brazil, through Abralatas, we sponsoredand supported can collection activities during the Carnival season.The <strong>Rexam</strong> Academy is a leadership training programme that isrun by the <strong>Rexam</strong> Business School. Each year around 25 of ouremployees are selected from across our global operations toparticipate in this investment in our people. As part of theprogramme, participants are involved in a leadership challenge,and this year the group hosted a charity dinner for UNICEF’s EastAfrica Children’s Crisis Appeal. Our employees also donatedmoney to the fund and our South American beverage canoperations carried out local fundraising. In total, the event raisedover £41,000 for UNICEF.<strong>Rexam</strong>’s total charitable cash donations and community activities(including in kind community and charitable support in the formof time, facilities and products but excluding employees’ dedicatedfundraising such as the Academy dinner) during <strong>2011</strong> amounted tosome £497,000 (2010: £480,000).cash donationsWe increased charitable cash donations by the Group in <strong>2011</strong>to £458,000 as shown in the table (2010: £442,000):<strong>2011</strong> 2010UK £55,000 £52,000Rest of World (excluding UK) £403,000 £390,000The Group has not made any EU political donations during theyear and does not intend to do so in the future in respect of whichshareholder authority is required, or for which disclosure isrequired under the Companies Act 2006.key measure and targetWe monitor how many of our sites are involved in some form ofcommunity programme, and in the long term we are targeting that100% of our sites will be involved in at least one local communityprogramme (<strong>2011</strong>: 59%).community investment inNorth AmericaSince 2010 our plastic packaging facility in Perrysburg,Ohio has raised and donated more than US$5,000 andvolunteered over 150 hours in area classrooms for JuniorAchievement (JA). JA is an organisation that teaches theeconomics of life through entrepreneurship, financialliteracy and work readiness education programmes tomore than 24,000 students annually.150 hoursoverviewfinancial statements governancesustainabilitybusiness review
52directors’ reportgovernanceCans are made from coils of aluminium or steel.Over the past three years <strong>Rexam</strong> has saved34,000 tonnes of metal through lightweighting.
53We introduce our board and explain why astrong sense of governance and complianceis imperative in every area of our operations.We give details of the Company’sremuneration principles and policy whichcomplement the Group’s strategic vision.54 directors and officers56 corporate governance69 remuneration report81 other disclosuresfinancial statements governancesustainabilitybusiness reviewoverview
54 <strong>Rexam</strong> annual report <strong>2011</strong> directors’ reportdirectors and officerschairmanchairman designateSir Peter Ellwood (68)appointed Chairman on 1 May 2008(non executive director on 1 February2008) and retiring on 22 February 2012.committees Nomination (chairman).strengths An experienced chairmanwith an international business andleadership focus.previous business experience Chairmanof ICI <strong>PLC</strong> until its acquisition by AkzoNobel NV in 2008. Group chiefexecutive of Lloyds TSB Group plc.other directorships Member of thesupervisory board of Akzo Nobel NV.executive directorsGraham Chipchase (49)chief executiveappointed 1 January 2010 as chiefexecutive. Joined the board as financedirector on 10 February 2003 andwas group director plastic packagingfrom 2005.committees Finance.strengths Extensive financial andoperational knowledge, proven leadershipskills and a comprehensive understandingof <strong>Rexam</strong>’s businesses and markets.previous business experience Financedirector of GKN plc’s aerospace servicesbusiness and held various positions withinthe European and US subsidiaries ofBOC Group plc. Operational experienceas group director of <strong>Rexam</strong>’s plasticpackaging business.Stuart Chambers (55)appointed 1 February 2012 as anon executive director and chairmandesignate to succeed Sir Peter Ellwoodon 23 February 2012.committees Nomination.strengths Extensive breadth of businessexperience, including experience ofglobal business to business markets.previous business experience Groupchief executive of NSG Group, the Tokyobased global glass company, until 2009.Chief executive of Pilkington <strong>PLC</strong> until itsacquisition by NSG Group in 2006.Senior positions at Mars Inc. and a varietyof European roles at Royal Dutch Shell plc.other directorships Non executivedirector of Smiths Group plc, Tesco <strong>PLC</strong>and The Manchester Airport Group <strong>PLC</strong>.David Robbie (48)finance directorappointed 3 October 2005.committees Finance.strengths Strong financial, accounting,strategic and corporate financeexperience and skills.previous business experience Chieffinancial officer of Royal P&O NedlloydNV and finance director of CMG plc.other directorships Trustee of AldeburghMusic.executive leadership teamJon Atchuehuman resourcesAndré Balbi Cerviñobeverage can AmericasGraham Chipchasechief executiveDavid GibsonlegalMalcolm Harrisonplastic packagingClaire Jenkinscorporate affairsIain Percivalenterprise riskDavid Robbiefinance directorTomas Sjölinbeverage can Europe & Asia
55non executive directorsoverviewNoreen Doyle (62)John Langston (62)Wolfgang Meusburger (58)appointed 22 March 2006.committees Finance (chairman), auditand risk, nomination.strengths A diverse business backgroundwith experience and knowledge offinancial markets.previous business experience Senioroperational positions at Bankers TrustCompany and at the European Bank forReconstruction & Development.other directorships Non executivedirector of Credit Suisse, NewmontMining Corporation and QinetiQ Group<strong>PLC</strong>, and a member of the advisorypanels for the Macquarie EuropeanInfrastructure Fund and the MacquarieRenaissance Infrastructure Fund.Leo Oosterveer (52)appointed 1 September <strong>2011</strong>.committees Nomination.strengths Strong operational leader withglobal management experience and atrack record in marketing, sales andstrategy development gained bothin Europe and Asia.business experience Leads the globalfood service division of Unilever. From2002 to 2006 chairman/CEO ofUnilever in Thailand and Indochina whoseoperations are mainly focused on homeand personal care products.appointed 30 October 2008. Becamethe acting senior independent director on24 November <strong>2011</strong>.committees Audit and risk (chairman),finance, nomination, remuneration.strengths A chartered accountant withinternational, commercial and corporatefinance experience.previous business experience Joined theboard of Smiths Group plc in 2000holding operational roles untilappointment as finance director from2006 to his retirement in May 2010.A director of TI Group plc prior toits acquisition by Smiths Group.other directorships Non executivedirector of Cross Match Technologies Inc.Jean‐Pierre Rodier (64)appointed 7 June 2006.committees Remuneration (chairman),audit and risk, nomination.strengths Significant internationalbusiness experience and an extensiveknowledge of the packaging andaluminium industries.previous business experience Chairmanand chief executive of Pechiney untilPechiney merged with Alcan in 2003.Chief executive of Union Minière andchairman and chief executive ofMetalEurop France.other directorships Advisor to CorporateValue Associates and an associate withMediobanca Banca di Credito Finanziariountil his resignation on 1 January <strong>2011</strong>.appointed 1 December 2006.committees Nomination, remuneration.strengths Experience in the fast movingconsumer goods (FMCG) industry and anin depth understanding of businessdevelopment.previous business experience Held seniorinternational positions in the FMCG industryand was chief executive of Tchibo until 2001.other directorships Sits on the board ofseveral international FMCG companiesin Europe and an educational facility inSwitzerland. Chairman of Kägi Söhne AGand Kaffee Partner GmbH, and of the nonexecutive board of Schoellershammer. Nonexecutive directorships include BS Group,CCT Reig Group and Chiquita Fruit Bar.company secretaryDavid Gibson (49)changes to the boardCarl Symon, the non executive seniorindependent director, retired from theboard on 23 November <strong>2011</strong>.Apart from the appointments ofStuart Chambers and Leo Oosterveerdisclosed in this section, there were noother changes to the board during <strong>2011</strong>and up until the date of this annual report.financial statements governancesustainabilitybusiness review
56 <strong>Rexam</strong> annual report <strong>2011</strong> directors’ reportcorporate governancegood governanceDuring <strong>2011</strong> we focused on executing ourstrategy to deliver value to our shareholders andstakeholders. In doing so, we realise that it isimperative that the Company promotes a strongsense of meaningful and relevant governance ineach area of our operations. Our policies andprocedures ensure that the Company is directedand guided to follow good governance practices.We have an experienced board of directorswho are responsible to all our stakeholders for thelong term strategy and sustainable success of theCompany. During the year there were changesto the board that were carefully considered toensure that the Company and its shareholdersbenefit from a board with a depth of experience,a diversity of influences, an independentviewpoint and a varied skill set.I am retiring as chairman of the board and thiswill be my last report as chairman. With clearobjectives, strong management and talentedpeople, together with a board committed togood governance practices, <strong>Rexam</strong> is in astrong position for the future.Sir Peter EllwoodchairmancomplianceThis corporate governance report has been prepared inaccordance with the UK Corporate Governance Code of June2010 (the Code). The Code is published by the Financial <strong>Report</strong>ingCouncil (FRC) and can be viewed on the www.frc.org.uk website.This report, being part of the directors’ report which includes thebusiness review and the remuneration report, provides a summaryof the Group’s procedures for applying the principles of the Codeand the extent to which such principles have been applied. It is theboard’s view that throughout the period 1 January to 31 December<strong>2011</strong> the Company has complied with the Code.leadershipthe role of the boardThe board’s primary role is to ensure the sustainable long termsuccess of the Group. This it does through the development, reviewand implementation of the Group’s strategy and the leadershipof the executive directors to whom the board delegates the day today management of the business.The role of the board is to:• ensure the sustained long term success of the Group;• ensure that the board’s obligations to its shareholdersare understood and met;• ensure that the strategy takes into account the interestsof the Group’s customers, suppliers, employees and thelocal communities in which <strong>Rexam</strong> operates;• maintain control over the Group’s assets;• monitor changes to the Group’s management andcontrol structures;• develop robust corporate governance and riskmanagement practices and procedures; and• establish high ethical standards of behaviour.The Company operates through the board and its main boardcommittees, namely the audit and risk, the nomination and theremuneration committees. The board also has a finance committeewhich oversees the financial risk management strategy, policy andtreasury transactional matters delegated to it, and reviews andapproves major financial transactions on behalf of the board.The board evaluates the membership of its individual boardcommittees on an annual basis and aims to ensure that itsprincipal committees have different non executive directors astheir chairman. The board committees are governed by termsof reference which detail the matters delegated to the committeeand for which they have authority to make decisions. The termsof reference for the main committees can be found on the<strong>Rexam</strong> website.
57schedule of matters reserved for the boardBoard appointments and removalsThe Group’s strategy, including the acquisition and disposal of businessesMaterial financial decisions relating to equity, marketable securities, borrowingfacilities, guarantees or indemnities and changes in accounting policiesor practiceAll capital expenditure projects over £10m or any capital expenditure projectwhich, regardless of the amount, does not meet the Group’s financial criteriaChanges to the Group’s management and control structuresMatters relating to the Company’s share listingThe appointment and removal of principal advisors and external auditorsThe board does not routinely involve itself in day to day businessmatters but there is a formal schedule of matters that require theboard’s specific approval, as well as those which can be delegatedto committees of the board or senior management. Matters referredto the board are considered by the board as a whole and no oneindividual has unrestricted powers of decision.the main areas dealt with by the board during <strong>2011</strong>bestperformancecustomerexpectationsoperationalexcellencewinningorganisationStrategy planning, implementation and monitoringStrategy for each business sector and focus on emerging markets<strong>Report</strong>s on the key issues affecting the businessSale of the Closures businessFinancial position of the Group and its performance against budget and forecastBank facility refinancing proposalsThe Group’s budget for 2012 and long range plan to 2014<strong>Report</strong>s on matters discussed at audit and risk committee meetingsReview of the effectiveness of the system of internal controlThe Group’s full year and half year results2010 final dividend and <strong>2011</strong> interim dividend<strong>Annual</strong> general meeting<strong>Report</strong>s on meetings with customers and suppliersMajor customer and supplier contractsResearch, development and innovation in relation to the strategic agendaBoard visit to a supplier operation in South Americaboard membership <strong>2011</strong> meetings <strong>2011</strong> 1Sir Peter Ellwood (chairman of the board) 9/9Graham Chipchase 9/9Noreen Doyle 9/9John Langston 9/9Wolfgang Meusburger 9/9Leo Oosterveer (appointed 1 September <strong>2011</strong>) 3/3David Robbie 9/9Jean‐Pierre Rodier 9/9Carl Symon (retired 23 November <strong>2011</strong>) 2 7/81 Number of scheduled meetings attended/maximum number of meetings that thedirector could have attended.2 Carl Symon was unable to attend one meeting of the board. He received the agendaand the papers for that meeting and commented in advance of it.Capital expenditure requests including new manufacturing start ups, additional lines and line conversions in Brazil,Egypt, Finland, France and India<strong>Rexam</strong>’s sustainability programmes (incorporating all aspects of corporate social responsibility)The Group and business procedures and controlsThe Group risk management process, risk tracking and mitigationPresentations from business sectorsLegal compliance, code of conduct and anti bribery and corruption policiesInformation management strategyHealth and safety matters<strong>Report</strong>s on matters discussed at nomination committee and remuneration committee meetingsAppointment of a chairman designate and a non executive directorBoard composition, diversity, development and succession planningEffectiveness of the board following the board evaluationOrganisation and talent reviewEmployee engagement surveyInvestor audit and feedbackBoard meeting and plant visits with the South American beverage can and plastic packaging management teamsoverviewfinancial statements governancesustainabilitybusiness review
58 <strong>Rexam</strong> annual report <strong>2011</strong> directors’ reportcorporate governancechairman and chief executiveThe roles of the chairman and chief executive are separate witheach having clearly defined responsibilities. Nonetheless, theyretain a close working relationship to ensure the integrity of theboard’s decision making process and the successful delivery ofthe Group’s strategy.Sir Peter Ellwood was chairman of the Company throughout theperiod 1 January to 31 December <strong>2011</strong>. The chairman creates andmanages a constructive dialogue between the executive and nonexecutive directors. He works with the company secretary to ensurethat appropriate matters are discussed during board meetings.The main duties of the chairman are to:• lead the board;• promote a culture of openness, challenge and debate;• review the effectiveness of the board;• ensure that the board has the appropriate balance ofskills and experience and to give consideration tosuccession planning;• ensure compliance with Group policies concerning theconduct of the business;• provide guidance to the executive directors and seniormanagement; and• safeguard the interests of shareholders.Sir Peter advised the board that he wished to retire from officewith effect from close of business on 22 February 2012. StuartChambers was appointed as non executive director and chairmandesignate on 1 February 2012, and will succeed Sir Peter aschairman. The board considers that Stuart Chambers wasindependent on his appointment as non executive director andwill be independent on his appointment as chairman.Graham Chipchase’s primary objective as chief executive isto enhance long term shareholder value.The main duties of the chief executive are to:• develop and manage the Group and its tradingperformance within the authorities delegated bythe board;• deliver the Group’s strategic plan;• lead the executive management and ensure thatmanagement has the appropriate balance of skillsand experience;• oversee the Group’s performance in safety, healthand environmental matters;• be the primary interface with shareholders; and• promote high standards of ethical business conduct.non executive directorsAt the date of this report, <strong>Rexam</strong> has seven non executive directors,including the chairman, whose role is to understand the businessand its markets, consider proposals on strategy and constructivelychallenge the management. Collectively they hold or have heldsenior positions in industry and contribute a wide range ofinternational experience and objective perspective to the board.Through the board committees, the non executive directors bringfocus on governance and succession planning, internal controls,risk management and remuneration policies.Non executive directors serve the Company under letters ofappointment which are generally for an initial three year term.On appointment, an undertaking is requested confirming thatthe non executive director has sufficient time to fulfil his or herrole on the board.Carl Symon, <strong>Rexam</strong>’s senior independent director, retired fromthe board on 23 November <strong>2011</strong>. Carl Symon had served on theboard since 2003 and, having successfully led and completed thesearch for the new chairman, felt that this was an appropriate timeto step down from the board. The board approved the appointmentof John Langston as acting senior independent director with effectfrom 24 November <strong>2011</strong> and until such time as the nominationcommittee can consult with the new chairman of the board andmake a recommendation for a permanent appointment.The senior independent director, when necessary, supports thechairman and the other non executive directors on Companyrelated matters. He is available to talk to shareholders if they haveany issues or concerns or if there are any unresolved matters thatshareholders believe should be brought to his attention. There is awritten job specification for this role and it is reviewed annually bythe nomination committee.The non executive directors met several times during the yearwith the chairman to discuss, on a less formal basis, the Group’sperformance, governance, strategy and succession planning.The executive directors were not in attendance at these meetings.directors’ indemnities and insurance coverThe Company granted indemnities to Leo Oosterveer and StuartChambers on their appointments to the board in <strong>2011</strong> and 2012respectively. The indemnities relate to certain losses and liabilitieswhich they may incur in the course of their duties and are in forceas at the date of this report. Insurance cover also remains in placeto protect all directors and senior management in the event ofa claim being brought against them in their capacity as directorsor officers of the Company and its subsidiaries. Similar indemnitieswill be offered to other directors.The written job specifications for the roles of chairman and chiefexecutive are reviewed annually by the nomination committee.
59length of service of non executive directors as at22 February 2012board balance as at 22 February 2012● 0–2 years 2● 3–4 years 2● 5–6 years 3● 7 non executive directorsincluding the chairman● 2 executive directorsovervieweffectivenesscomposition of the board<strong>Rexam</strong> has a board of directors with international businessbackgrounds and a range of diverse skills, experience andnationalities. This diversity is invaluable in challenging anddeveloping the Group’s strategy and enables the board to governeffectively a global business. The board works as a team butindependence of thought and approach as well as constructivedebate is encouraged.Throughout <strong>2011</strong> and up to the date of this annual report theCompany had a majority of independent non executive directorson the board.The board is aware of the other commitments of the directors andconsiders that these commitments do not conflict with their nonexecutive duties as directors of the Company. A biography of eachmember of the board, including details of their business experienceand other directorships, is given on pages 54 and 55.appointments to the boardThe appointment and replacement of directors is governedby the Company’s articles of association, which may onlybe amended with shareholders’ approval in accordance withrelevant legislation. Recommendations for appointments to theboard are the responsibility of the nomination committee whichacts in accordance with its terms of reference and the articlesof association.the nomination committeeAll of the members of this committee are independentnon executive directors.committee membership <strong>2011</strong> meetings <strong>2011</strong> 1Sir Peter Ellwood (committee chairman) 2 6/6Noreen Doyle 3 5/6John Langston 6/6Wolfgang Meusburger 6/6Leo Oosterveer (appointed 6 December <strong>2011</strong>) 4 –Jean‐Pierre Rodier 6/6Carl Symon (retired 23 November <strong>2011</strong>) 5/51 Number of scheduled meetings attended/maximum number of meetings that thedirector could have attended.2 Sir Peter Ellwood will retire as committee chairman on 22 February 2012.Stuart Chambers was appointed as a member of the committee on 20 February 2012and will succeed Sir Peter as committee chairman with effect from 23 February 2012.3 Noreen Doyle was unable to attend one meeting of the committee. She received theagenda and the papers for that meeting and was able to comment in advance of it.4 No meetings were held in <strong>2011</strong> after Leo Oosterveer’s appointment date.financial statements governancesustainabilitybusiness review
60 <strong>Rexam</strong> annual report <strong>2011</strong> directors’ reportcorporate governanceThe main responsibilities of the committee are to:• review the structure, size and composition of the board(including the skills, knowledge, experience and diversity,including gender diversity);• give full consideration to succession planning and ensurethat processes and planning are in place with regardto both the board and senior executive appointments;• identify and consider candidates on merit againstobjective criteria and to make recommendations tothe board on appointments to the board and boardcommittees, and on the appointment of the companysecretary;• assess the time needed to fulfil the roles of chairman,senior independent director and non executive directors;• keep up to date about strategic issues and commercialchanges affecting the Company and its markets; and• assist the chairman with the annual board performanceevaluation process to assess the overall performanceand effectiveness of the board and each boardcommittee, and the individual performanceof directors.The performance and effectiveness of the committee are reviewedas part of the main performance evaluation of the board and allits committees.All board appointments are conducted through a formal, rigorousand transparent procedure between the nomination committeeand the board. The committee identifies through the managementreview process any internal people whose skills, experience andcontribution to the Group would add value to the board. Thecommittee also works alongside executive recruitment consultantsto evaluate and consider prospective external candidates andreview internal candidates. Following an evaluation of candidates,the committee meets with prospective candidates who are thenconsidered and, if appropriate, recommendations are made to theboard for approval.During <strong>2011</strong> the committee identified the requirement to appointa new non executive director and, on Sir Peter Ellwood’s intendedretirement, a new chairman. The processes leading to theappointments of Leo Oosterveer and Stuart Chambers wereconducted through external recruitment consultants who adhereto a voluntary code of conduct to ensure that at least 30% ofthe candidates on their initial list of candidates are women(the Voluntary Code of Conduct). The committee considered thecandidates against the board’s requirements and recommendationsfor the appointment of Leo Oosterveer and Stuart Chambers weremade to the board for approval.Lord Davies’ February <strong>2011</strong> report into ‘Women on Boards’ andthe amendments to the Code subsequently proposed by the FRChave highlighted the importance of effective diversity policies incompanies. The <strong>Rexam</strong> board is aware of the benefits of all formsof diversity, including gender diversity, when seeking newcandidates for the board. It is the board’s aspiration that by 2015at least 25% of the board will be women. Diversity is one of theimportant factors in the specification given by the committee torecruitment consultants when appointing new directors and thecommittee ensures that, with the assistance of executive recruitmentconsultants who adhere to the Voluntary Code of Conduct, it hasvisibility of a range of suitable candidates, including women.The Group’s gender balance in senior management roles iscurrently 86% male and 14% female and, throughout the Group,76% male and 24% female. The board reviews how diversity, in allforms, can be enhanced through the senior management team andacross the Group with the overriding objective that the mostappropriate candidates are employed and the most effectiveemployees are retained and promoted.succession planningThe board’s responsibility for succession planning means that it isactively involved in the Group’s talent processes to identify internalcandidates for promotion and develop senior managers to givethem every opportunity to progress their careers. During <strong>2011</strong>, theboard discussed the current senior management positions withinthe organisational structure and, led by the chief executive,considered potential successors to meet the Group’s leadershipneeds over time.development, information and supportFormal board meetings are held during the year and the chairmanand the company secretary ensure that, prior to each meeting,the directors receive accurate, clear and timely informationwhich helps them to discharge their duties. In the months with noscheduled board meeting, the directors receive the prior monthand cumulative financial and operating information relating tothe Group and its businesses.All newly appointed directors participate in an internal inductionprogramme that introduces the director to the Group and includesvisiting Group businesses. This programme is tailored to eachdirector’s needs, taking into account individual qualifications andexperience. If required, an overview of the role and responsibilitiesof a director can be facilitated by an external consultant.The company secretary gives guidance on board proceduresand corporate governance.
61Leo Oosterveer joined the board as a non executivedirector on 1 September <strong>2011</strong> and is participating in aninduction programme. Leo has met with functional headsfor an overview of the Group. He has participated in aone to one external course on the role and responsibilitiesof a director, and has discussed areas of governancerelevant to board membership with the companysecretary. Leo is scheduled to visit some of <strong>Rexam</strong>’smanufacturing plants and meet with operationalmanagement. Stuart Chambers, who joined the board aschairman designate on 1 February 2012, has started aninduction programme and is meeting with functionalheads and representatives from the Group’s advisors priorto commencing a tour of the Group’s businesses.The chairman is responsible for and regularly reviews and agreeswith each director their training and development needs andmembers of the committees receive specific updates on mattersthat are relevant to their role. The chairman arranges for the boardto visit at least one of the Group’s business locations each year toensure that the directors’ knowledge and familiarity with theGroup’s businesses are updated and maintained.During <strong>2011</strong>, the board held a meeting at the SouthAmerican beverage can headquarters in Brazil andvisited the beverage can plant in Jacareí and the plasticpackaging plant in Jundiaí. The board also visited themain aluminium supplier to the South Americanbeverage can business.Members of the senior management team with responsibility forthe Group’s businesses and those with corporate and service centrefunctional responsibilities make periodic presentations at boardmeetings about their businesses, functions, performance, suppliers,customers, markets and strategy.The company secretary, who is appointed by the board, isresponsible for ensuring compliance with board procedures.This includes taking minutes of the board meetings and therecording of any concerns relating to the running of the Companyor proposed actions arising therefrom that are expressed by adirector in a board meeting. The company secretary is alsosecretary to the audit and risk, nomination and remunerationcommittees. Under the direction of the chairman, he is responsiblefor the communication of relevant information between the board,its committees and the senior management team. He also advisesthe board, through the chairman, on all governance and regulatorycompliance matters.Should a director reasonably request independent professionaladvice to carry out their duties, such advice is made available atthe Company’s expense.board performance evaluationAll directors, including the chairman, receive a formal performanceevaluation to which all other members of the board have theopportunity to contribute. The board’s 2010 performance evaluationwas led by an external independent consultant. In <strong>2011</strong> the annualevaluations of the non executive directors, senior independentdirector and chief executive were led by the chairman andsupported by the company secretary. In view of the announcedchange in the chairmanship of the Company, a formal evaluationof the chairman’s performance was not undertaken. The chiefexecutive led the evaluation of the finance director. The chairmenof the respective committees reviewed the performance of theirown committees.The chairman met with the non executive directors during <strong>2011</strong>to discuss the evaluation of the board and succession plans.Achievement in <strong>2011</strong> of actions identified through the board performanceevaluation in 2010strategic planning Focus on regular reporting to theboard on the progress of strategicissues and actionsrisk management Enterprise risk management functionprovided regular updates to the board;Finance director provided regularupdates to the board on key risks andmitigation measuresfinancial and nonfinancial monitoringtalent management andsuccession planningboard developmentNew format of financial report;Development and understandingof the Group’s balanced scorecardChairman designate and non executivedirector appointed in accordance withsuccession plans;Review of executive leadership teamParticipation in board updates focusingon gender diversity in the boardroom,the UK Bribery Act and changes to theTakeover Codeoverviewfinancial statements governancesustainabilitybusiness review
62 <strong>Rexam</strong> annual report <strong>2011</strong> directors’ reportcorporate governanceIn <strong>2011</strong> each director completed a questionnaire scoring his or herresponse to statements focusing on the areas identified below andcommenting more specifically as appropriate.board performance evaluation <strong>2011</strong>Board structureBoard meetings and administrationTalent management and successionplanningRisk managementStrategyCustomers and suppliersFinancial and non financialmonitoringThe results of the <strong>2011</strong> board performance evaluation werepresented to the board. The evaluation focused on the effectivenessof the board and its main committees.The directors shared the view that, following this comprehensivereview, the board and its committees continue to operateeffectively. However, the board has agreed that during 2012the following processes will be further developed and improved:process2012 actions following <strong>2011</strong> evaluationstrategic planning To further refine the strategic reviewprocessrisk management To maintain a clear focus on riskanticipation, risk management and crisismanagement aligned to the challengesof the global economic climatenon financial monitoring To progress non financial monitoringand reporting through the Group’sbalanced scorecardtalent management and To continue to review and contributesuccession planning towards succession planning,consideration of the talent pool andpeople developmentboard development To further develop the way in which theboard works together as a unitcustomers and suppliers To continue to develop knowledgeof and focus on the Group’s customersand suppliersA full performance evaluation of the board and its committeeswill continue to be conducted annually and an independentexternal assessment will take place at least every three yearsas recommended by the Code.election and re‐election of directorsThe Company’s articles of association require that any directorappointed to the board since the date of the last annual generalmeeting (AGM) should be proposed for election at the first AGMafter such appointment. Thereafter a director must be proposedfor re‐election at the third AGM following the AGM at which thedirector was last elected or re‐elected. However, to promotegood governance and in accordance with the Code, the boardhas recommended that all directors should submit themselvesfor election or re‐election on an annual basis.directors in office as at the date of this report to be proposed for electionor re-election at the AGM 2012Stuart Chambersnon executive director andchairman designateGraham Chipchasechief executiveDavid Robbiefinance directorNoreen Doylenon executive directorJohn Langstonnon executive directorWolfgang Meusburgernon executive directorLeo Oosterveernon executive directorJean‐Pierre Rodiernon executive directorFollowing a rigorous evaluation of the performance of eachdirector and on the recommendation of the nomination committeethe board is proposing that Stuart Chambers and Leo Oosterveer,who were appointed non executive directors since the date of thelast AGM, stand for election and that the other directors namedabove stand for re‐election at the AGM 2012.The board considers that Stuart Chambers was independent onappointment as a non executive director and chairman designate.Stuart Chambers is being recommended for election as the boardbelieves that he has an extensive breadth of business experience,especially within the business to business markets, and his globalexpertise will be of benefit to the board’s deliberations.Leo Oosterveer is considered by the board to be independent.He is being recommended for election as the board believes thathis global management experience and skills in marketing, salesand strategy development will be an asset to the Company.Graham Chipchase is being recommended for re‐election as theboard believes his leadership and insight into the Group and itsmarkets will help to develop <strong>Rexam</strong> and create shareholder value.David Robbie is being recommended for re‐election as the boardbelieves his strong financial and corporate finance experience andhis financial and strategic skills are important to the board and tothe maintenance of tight financial controls.Noreen Doyle, John Langston, Wolfgang Meusburger andJean‐Pierre Rodier are being recommended for re‐election as,in the board’s view, they remain independent and, followingtheir formal performance evaluation, the chairman of the boardhas confirmed that they continue to be effective and demonstratetheir commitment to the board. A biography of each member ofthe board can be found on pages 54 and 55.
63accountabilityDuring <strong>2011</strong> the audit and risk committee focusedon a number of activities associated with andcomplementary to its core internal financialcontrol responsibilities.As well as reviewing the half year and full yearresults, the committee carried out a detailedassessment of the Group’s risk profile along withthe process and management of the Group’senterprise risk management function. It reviewedthe effectiveness of the external auditors and theactions taken by internal audit following theindependent review of its effectiveness in 2010.John Langstonaudit and risk committee chairmanThe board recognises its responsibility for ensuring theimplementation and maintenance of effective systems of riskmanagement and internal control, and presenting a balancedand understandable assessment of the Group’s position andprospects. The systems and controls in place include policiesand procedures which provide reasonable assurance thattransactions are recorded as necessary to facilitate the financialreporting process and the preparation of consolidated financialstatements in accordance with International Financial <strong>Report</strong>ingStandards (IFRS). Representatives of the businesses are requiredto certify that their reported information gives a true and fair viewof the state of affairs of the business and its results for the year.To discharge these duties and responsibilities the board worksclosely with the audit and risk committee.After taking account of the detailed work of the audit and riskcommittee, the board confirms that it carried out a review of theeffectiveness of the system of internal control which operatedwithin the Group during <strong>2011</strong> and up to the date of this annualreport in accordance with the requirements of the revised TurnbullGuidance on Internal Control published by the FRC. This reviewcovered the effectiveness of all internal controls, namely financial,operational, compliance and risk management.No significant failings or weaknesses were identified in the reviewfor <strong>2011</strong>. The board is satisfied that, where areas for improvementwere identified, processes are in place to ensure that the necessaryaction is taken and that progress is monitored. The board willcontinue to carry out such reviews on an annual basis. Detailsof the specific actions taken during <strong>2011</strong> to review the controlenvironment and continue to improve controls are set out in thetable under risk management and internal control in this section.the audit and risk committeeThe committee members comprise independent non executivedirectors. John Langston is the chairman of the committee. As aqualified chartered accountant and former finance director he iswell placed to provide the committee with the relevant financialexperience to enable it to carry out its responsibilities.committee membership <strong>2011</strong> meetings <strong>2011</strong> 1John Langston (committee chairman) 4/4Jean‐Pierre Rodier (appointed 6 December <strong>2011</strong>) 2 –Noreen Doyle 4/4Carl Symon (retired 23 November <strong>2011</strong>) 2 4/41 Number of scheduled meetings attended/maximum number of meetings thatthe director could have attended.2 No meetings were held in <strong>2011</strong> after Jean-Pierre Rodier’s appointment date.The committee membership comprised three independent non executive directorsat the date of each meeting.The main responsibilities of the committee are to:• oversee and review the financial and operational risks,policies and management;• assist the board in meeting its responsibilities byensuring an effective system of internal control andcompliance and accurate external financial reporting;• assist the board in managing the relationship with theCompany’s external auditors, to review and monitortheir independence, and in particular the provision ofnon audit services provided by them to the Group;• keep under review the effectiveness of the processfor the identification, assessment, mitigation, reportingand monitoring of risks facing the business; and• approve the appointment of the director internal auditand review and approve the annual programme ofinternal audit assignments.The committee meets at least four times a year. At the request ofthe committee chairman, the chairman of the board, the chiefexecutive, the finance director, the group director enterpriserisk, the director group finance, the director internal audit andthe external auditors are invited to attend each meeting.overviewfinancial statements governancesustainabilitybusiness review
64 <strong>Rexam</strong> annual report <strong>2011</strong> directors’ reportcorporate governanceShould it be requested, the committee has access to independentexpert advice at the Company’s expense. The performance andeffectiveness of the committee are reviewed as part of the mainperformance evaluation of the board and all its committees.financial and business reportingThe audit and risk committee shares responsibility with theboard for reviewing in detail the annual report and half yearresults announcement, which provide a clear assessment of theperformance and prospects of the Group through the businessmodel, strategy and a review of strategic risks and financial andnon financial performance. Also included in the annual reportis the external auditors’ report to the members providing anindependent view of the state of the Group’s affairs. The halfyear results announcement includes the external auditors’ reviewreport to the Company.Other published financial information is reviewed by the committeefor statutory and regulatory compliance and is submitted to theboard with a recommendation for approval.risk management and internal controlThe Group has well established risk management and internal controlsystems. While all elements of risk cannot be eliminated, theprocesses and systems aim to identify, assess, prioritise and, wherepossible, mitigate the Group’s risks. Although no system can provideabsolute assurance against material misstatement or loss, the Group’ssystems are designed to provide the board with reasonableassurance that assets are safeguarded, transactions are properlyauthorised and recorded and that material errors and irregularitiesare either prevented or detected within a timely period.A separate enterprise risk function was established in 2010 led bya senior executive who is a member of the executive leadershipteam. The enterprise risk management function has brought anincreased focus and emphasis on global risk management,providing leadership and co-ordination across the Group’s businessand operational risk activities. Other responsibilities include healthand safety, environment, fire and property protection, security,insurance, business continuity and crisis management.There is an ongoing process for identifying, assessing, mitigating,reporting and monitoring the risks faced by the Group with aformal audit and risk process (known as the ARC process) led bythe group director enterprise risk together with the finance director,the director internal audit and other senior managementrepresentatives. Meetings are held with businesses and functionalmanagers who present their risk registers, enabling discussionof the risks identified, the management of those risks and themitigation measures as well as the effectiveness of the systemsof internal control. The process ensures that risks are not just theproduct of a bottom up approach but are also examined from a topdown perspective and closely aligned with the Group’s strategy.Through the risk council, chaired by the group directorenterprise risk, and comprising representatives fromeach of the sectors and the director internal audit,improvements to the ARC process were made during<strong>2011</strong> with an increased focus on risk mitigation actions.The results of the ARC process are reported to the audit and riskcommittee and provide an opportunity for the committee to discussand analyse the risks reported. In addition to reviewing the risks,as presented by management, the committee also receivespresentations from the Group’s businesses or functional managersto assess first hand the effectiveness of the process, and whetherthe risks identified are being managed successfully, and tochallenge management on the mitigation measures in place.The committee then reports its conclusions to the board for review.Details of the key risks to which the Group is exposed and additionalinformation on risk processes and management are included in thebusiness review and can be found on pages 34 to 41.The framework which the board has established to provide effectiveinternal control for both the Group and its associates and jointventures is supported by the key areas set out in the table below.key areas of the internal control framework activity in <strong>2011</strong>financial reporting The Group has a comprehensive system for reportingfinancial results to the board. An annual budget andstrategic review are prepared for each business andare consolidated for review by the board before beingformally adopted. During the year, monthly managementaccounts, including cash flow and capital expenditurereporting, are prepared with a comparison againstbudget and prior year. Forecasts are revised in light ofthis comparison and are also reviewed by the board.delegated authorityThere are clearly defined lines of responsibility andlevels of authority in operation throughout the Group,with specific matters reserved to the board. Businessesare decentralised with operating autonomy andfinancial responsibility delegated to corporate andlocal management to the extent that they have approvalto operate within defined levels of authority and risk.Regular reviews took place to ensure businesseswere performing in line with budget and strategy.The chief executive and the finance director metregularly with operational management to ensurebusinesses were performing as expected andreporting in accordance with the Group’s standards.Following those meetings the chief executive and thefinance director reported back to the board. A newfinancial report format was introduced for the board.The Group authority levels and related financial limits,which include information on those matters that arespecifically reserved for the board’s consideration,were reviewed and updated.
65procedures and controls There are formal written Group financial proceduresand controls in operation, including specificprocedures for treasury matters, capital investmentand the approval of significant contracts. Corporateand local management are required to completebi‐annual representation letters formally confirmingthat their businesses comply with the Group’s financialreporting policies and other Group policiesand procedures.internal auditoperational riskmanagementThe internal audit function monitors financial andother risks faced throughout the Group and thecontrol systems in operation to manage those risks.All significant internal audit findings are reportedto the audit and risk committee.Operational risk management, part of the enterpriserisk function, provides the leadership to develop andmonitor processes which identify, assess and managerisks associated with health and safety, environment,business continuity and crisis management, fire andloss prevention, security and asset protection. Purposebuilt audit programmes allow for businesses to beevaluated against <strong>Rexam</strong>’s and external best practicestandards in these areas, and provide the basis forcontinuous improvement action plans. In addition,many <strong>Rexam</strong> businesses are accredited to externalinternationally recognised standards. The functionalso manages <strong>Rexam</strong>’s global insurance programme.Periodic updates including any significant findings andissues are reported to the audit and risk committee.Group authority levels were updated.Improvements were made to access and securitycontrols along with a detailed review of theconsistency of the Group’s computerised managementsystems and controls operating around the Group.A Group control framework is being developed whichwill be rolled out across the Group in 2012 to ensurethat controls are operated consistently and in line withbest practice.The online legal compliance training developed toensure employees’ familiarity and compliance withthe Code of Conduct was further extended to includespecific training on Financial Integrity, CombatingBribery in Business and Competition and Anti TrustLaw, and was completed by all levels of seniormanagement.The annual internal audit plan was produced froman assessment of the risks following the ARC processreviews and was presented to the audit and riskcommittee for approval.Meetings were held regularly between internal auditmanagement and the finance director, togetherwith business management, to review progress onimplementing audit recommendations and to ensureany significant issues identified were addressed.Updates on performance were provided to the auditand risk committee by the director internal audit.In <strong>2011</strong>, following the independent effectivenessreview of internal audit, the director internal auditpresented to the audit and risk committee a road mapfor the internal audit function. This addressed thestructure and the remit of internal audit to ensure it wasfocused and delivering the necessary assurance to thecommittee and management, and was operating inline with best practice.In line with the <strong>Rexam</strong> values a system of awards wasintroduced to recognise businesses receiving highscores based on the audits.An enhanced global Environment, Health and Safety(EHS) audit approach was developed to provide thebasis of challenge for a more sustainable and robustimprovement of EHS management systems andperformance at all sites. In addition we introduced ahigh standard fire safety and property protection auditsupported and performed by AXA Matrix. Furtherdetails can be found in the key risks section of thisannual report on page 40.overviewfinancial statements governancesustainabilitybusiness review
66 <strong>Rexam</strong> annual report <strong>2011</strong> directors’ reportcorporate governanceinternal auditThe internal audit function plans and undertakes audits of thebusinesses to ensure that the controls operating in the businessesconform with Group controls and procedures, and reviews theeffectiveness of the risk management process.The director internal audit provides regular updates to the auditand risk committee and reports on all significant audit findings.He also has separate meetings with the chairman of the auditand risk committee without any other member of managementbeing present.In <strong>2011</strong> the committee reviewed and approved the annual internalaudit plan including the proposed audit approach, coverage andallocation of resources. It also reviewed the results of the auditsundertaken, with particular emphasis on the recommendationsmade and management’s response to the matters raised. A changein the audit ratings used by internal audit in its reports to betterevaluate the control environment was also approved.external auditorsThe committee has primary responsibility for and advises the boardon the appointment, reappointment and the remuneration of theCompany’s external auditors. PricewaterhouseCoopers LLP (PwC)have been the Company’s external auditors since 2003 with thelead audit partner changing by rotation in 2008. During <strong>2011</strong>, thecommittee reviewed the effectiveness of the external auditors andrecommended to the board that a resolution to reappoint PwC beproposed at the AGM 2012. A further review of PwC’seffectiveness will be undertaken in 2012 following completion ofthe <strong>2011</strong> year end audit. The committee will continue to keep underreview the independence and objectivity of the external auditors.The external auditors attend all audit and risk committee meetings.The committee chairman also has separate meetings with theexternal auditors to discuss relevant matters.The first meeting within the Group’s annual audit cycle is toconsider the nature and scope of the audit and to consider anyadditional special reviews that may be necessary. Further meetingsare held prior to the approval of the half year and full year resultsto consider, as relevant, the audit conclusions, the results of anyspecial reviews undertaken, the business risks facing the Groupand the reports from the ARC process meetings. The committeereports its findings on the audit process and on the wider aspectsof internal control to the board.Non audit services are provided by PwC to the Group only inaccordance with <strong>Rexam</strong>’s policy on the provision of non auditservices, which assesses the type of service to be provided and theassociated fees. Any request for non audit services above a feethreshold of £25,000 is presented to the finance director forapproval prior to commencement of the work. The finance directorwill, depending on the nature of and fee for the service, obtain theprior authorisation of the chairman of the audit and risk committee.This committee reviews the level of non audit fees to ensure that theprovision of non audit services does not impair PwC’sindependence or objectivity. Non audit fees in <strong>2011</strong> relate mainlyto assurance reporting on historic financial information required forbusiness disposals, assurance in relation to IT projects, including anew treasury system, and global tax advisory services. The fees fornon audit services are disclosed in note 5 to the consolidatedfinancial statements. Other audit firms were engaged to provideexpatriate and specialist tax advisory services as well as to adviseon disposal transactions.PwC are prohibited from providing services to the Group thatwould be considered to jeopardise their independence, such asfinancial systems design and implementation, actuarial services,internal audit outsourcing services and investment services.The policy on non audit services has been reviewed during <strong>2011</strong>to ensure it is in line with best practice.directors’ conflicts of interestThe board has a formal system in place for directors to reviewregularly their interests and to deal with situations where a directorreports any conflicts of interest. Any conflict situation reported tothe chairman and the company secretary is considered by theboard based on its particular facts. Any authorisations given to adirector who has a conflict situation are recorded in the boardminutes and in a register of directors’ conflicts which is reviewedannually by the board. No conflict situations were reported to theboard during <strong>2011</strong> and up to the date of this annual report.code of conductA worldwide Code of Conduct, which applies to all the Company’semployees, has been approved by the board and provides a clearstatement for the benefit of stakeholders involved with or impactedby <strong>Rexam</strong>’s activities. It is communicated through an inductionprocess for new employees, as part of the team briefings in theGroup’s businesses, and on the Group’s intranet and website.The board is kept informed regarding the maintenance of the Codeof Conduct and any breaches of it. An online training system hasbeen introduced to ensure all management are aware of theirresponsibilities and are in compliance with the Code of Conduct.In addition, with the introduction of the UK Bribery Act, all policiesand procedures relating to bribery and corruption were reviewedto ensure they are in line with best practice and that thereare adequate procedures to prevent bribery or corruptiontaking place.
67whistle blowing policy<strong>Rexam</strong> has an open door policy on communication wherebyemployees are encouraged to share concerns, raise issues,provide ideas for improvement, with all levels of managementin the business. It is recognised, however, that there will be timeswhen an employee might be uncomfortable raising concernsdirectly with local management and, in such cases, communicationwith business and Group management is encouraged.<strong>Rexam</strong> operates a whistle blowing policy which is supportedby an external confidential telephone helpline, available to allemployees for the raising of any concerns, including those of afinancial nature. The Raise Your Concern policy is highlighted inteam meetings to ensure the policy is understood and availableto all employees.The Raise Your Concern telephone helpline has been beneficial asan independent point of contact for employees where, if requested,the anonymity of the employee is maintained. During <strong>2011</strong> therewere 41 concerns logged (2010: 45 concerns) raising matters,in the majority of cases, related to human resource issues andpractices. All concerns reported are investigated at the earliestopportunity by the director internal audit, in conjunction with thecompany secretary and, if appropriate, by management of therespective business. The director internal audit provides an updateon all calls received, and the actions taken to respond to andresolve them, to Group management and the audit and riskcommittee on a regular basis. Any significant concerns arereported directly to the chairman of the audit and risk committeeas well as to Group management.The committee reviews the whistle blowing policy and the RaiseYour Concern process annually.In <strong>2011</strong> an external benchmark review was undertakenof the nature and volume of calls received under RaiseYour Concern to ensure that the process was workingeffectively and was comparable with the experience ofother organisations. The nature of the calls logged wasfound to be broadly in line with benchmark data and thecommittee was satisfied that concerns are investigatedthoroughly and that the callers receive appropriateresponses through the helpline.going concernThe Group’s business activities, together with the factors likelyto affect its future development, performance and position areset out in the business review on pages 10 to 41. The financialposition of the Group, its cash flows, liquidity position andborrowing facilities are detailed in the financial review on pages31 to 33. In addition, notes 24, 25 and 26 to the consolidatedfinancial statements include the Group’s objectives and policiesfor managing its capital, its financial risk management objectives,details of its financial instruments and hedging activities, and itsexposures to credit risk and liquidity risk.The Group has considerable financial resources together withestablished agreements with a number of key customers andsuppliers across different geographic areas and markets. Thefinancial resources include £2.6bn of debt facilities with the nextsignificant maturities due in March 2013 (£0.5bn) and June 2013(£0.5bn). The directors believe that the Group is well placed tomanage its business despite the economic environment whichincreases risks and uncertainties.The directors, having made appropriate enquiries, are satisfiedthat the Company and the Group have adequate resourcesto continue in operational existence for the foreseeable future.For this reason, they continue to adopt the going concern basis inpreparing the consolidated and Company financial statements.remunerationremuneration policy for directorsThe remuneration committee is responsible for makingrecommendations to the board on the Group’s remunerationpolicy and setting the remuneration levels and specific packagesappropriate for the chairman and the executive directorstaking into account the Group’s annual salary negotiations.The remuneration report is on pages 69 to 80 of this annual report.overviewfinancial statements governancesustainabilitybusiness review
68 <strong>Rexam</strong> annual report <strong>2011</strong> directors’ reportcorporate governanceshareholder relationsdialogue with shareholdersThe board believes that it is a priority to communicate withshareholders and uses various methods to reach as manyshareholders as possible. There are programmes for the chiefexecutive, finance director and the head of investor relationsto meet with the Company’s major institutional investors in theUK, the US and Europe. Presentations are made on the operatingand financial performance of the Group, including corporategovernance related matters, and the Group’s longer term strategy.The presentation slides shown to representatives of the investmentcommunity following the announcement of the half and full yearresults are available on the Company’s website, as is a livewebcast of the related results presentation. Roadshows are heldin the UK, the US and Europe following the announcement of thehalf and full year results. Where it is not possible to meet faceto face, meetings are held by video or telephone conference.The Company also hosts plant visits and annual seminars forinstitutional shareholders and representatives of the investmentcommunity. The seminars are webcast live and replays, togetherwith presentation slides, are available online.During <strong>2011</strong> investors were invited to attend a seminar inperson or by telephone focusing on the global beveragecan market. The seminar was well attended and investorscommented that it had improved their understanding ofthe beverage can industry and its growth drivers, as wellas <strong>Rexam</strong>’s position within the industry.Institutional shareholders can request an opportunity to meetwith any of the executive and non executive directors. The nonexecutive directors have an opportunity to meet with shareholdersat the AGM and may attend analyst presentations made by thechief executive and finance director. The board fully supports theprinciple of the Code which seeks to encourage more activeinterest and contribution from institutional shareholders.The non executive directors are given regular updates as to theviews of institutional shareholders. After the investor meetingsheld following the announcement of the half and full year results,a summary report on investor responses is prepared for the board,normally by the Company’s corporate brokers. The board alsocommissions an annual presentation of major investors’ views onCompany management and performance, based on results of surveysand extensive interviews. This survey also helps to plan the investorrelations programme for the following year.annual general meetingCommunication with private shareholders is largely through theAGM, which is held at a central London location. The notice of theAGM is posted to shareholders with, if requested, the annual reportand any related papers at least 20 working days before the date ofthe AGM to ensure that shareholders have sufficient time in whichto consider the items of business to be voted upon. The majority ofshareholders have elected to access the annual report and othershareholder documents online via the <strong>Rexam</strong> website rather thanreceiving a copy by post.A presentation is made at the AGM to update shareholders on theGroup’s activities. Shareholders are given the opportunity to askquestions of the board and the chairman of each board committeeduring the AGM and to meet all the directors informally at theAGM. Separate resolutions are proposed at the AGM on a poll foreach item of business and shareholders are asked to vote ‘for’,‘against’ or ‘vote withheld’ on each resolution. Votes are countedand an announcement confirming whether each resolution waspassed at the AGM is made through the London Stock Exchangeand can be viewed on the <strong>Rexam</strong> website, together with asummary of the number of votes cast in respect of each resolution.<strong>Rexam</strong>’s ADR investors receive details of the AGM and are entitledto instruct the depositary, The Bank of New York Mellon, to voteon the resolutions to be proposed at the AGM.Shareholders can ask questions of the Company at anytime through the <strong>Rexam</strong> website or by contacting thecompany secretary’s department at the Company’sheadquarters.
69remuneration reportstrategy and focusOur focus has always been to define aremuneration strategy that clearly aligns withthe Company’s business strategy and aims toincentivise people to deliver sustainable long termshareholder value.The Company’s remuneration policy allocates asignificant proportion of executive compensationto performance related remuneration which isbalanced between annual and long term incentiveswhich are linked to these objectives. A proportionof the annual incentive for executive directorsis awarded in shares and thus, ultimately, theirfuture value is tied to the long term success of theCompany. Executive directors are also expectedto acquire and retain over time a significantshareholding.We have seen policies and practices evolve toalign the interests of senior management with thoseof the shareholders. The remuneration committeeensures that the objectives and targets set forperformance related compensation are stretchingand have an acceptable degree of risk. Successover an annual period is judged againstachievement of operating profit and cash flowgeneration targets and individual objectives. Overthe longer term, the performance is based on threemeasures that reflect a balance between capitalreturns and earnings growth through a mixture ofrelative total shareholder return, return on capitalemployed and earnings per share growth.In reaching its decisions, the committee is verysensitive to the fact that delivering sustainableshareholder value requires all employees aroundthe world to be appropriately paid and rewarded.the remuneration committeeThe members of the committee are independent non executivedirectors.committee membership <strong>2011</strong> meetings <strong>2011</strong> 1Jean-Pierre Rodier 2(committee chairman from 6 December <strong>2011</strong>) 4/4Carl Symon 3(retired 23 November <strong>2011</strong>) 4/4John Langston 4(appointed 6 December <strong>2011</strong>) –Wolfgang Meusburger 4/41 Number of scheduled meetings attended/maximum number of meetings that thedirector could have attended.2 Jean-Pierre Rodier has been a member of the committee since July 2006.3 Carl Symon retired from the committee and as committee chairman on23 November <strong>2011</strong>.4 No meetings were held in <strong>2011</strong> after 6 December <strong>2011</strong>.The committee invites the chairman of the Company to attend itsmeetings and normally also invites the chief executive and groupdirector human resources. The company secretary attends in hiscapacity as secretary to the committee and as group general counsel.None of the above attend the part of the meeting where their ownremuneration is being discussed. Other directors and seniormanagers are invited to attend meetings where their expertise isrequested by the committee.Kepler Associates were appointed by the Company and actedas remuneration consultants to the committee and the Company.Representatives from Kepler Associates have attended committeemeetings when requested to do so. The external advisors whoprovided services to the committee during the year are detailedbelow. In addition to their services to the committee, Aon Hewittand Mercer provide pension consultancy and retirement benefitsaccounting advice to the Group, while Allen & Overy is theGroup’s principal UK legal advisor.advisorKepler AssociatesAon Hewitt Limited andMercer LimitedAllen & Overy LLPservicesExecutive remuneration advice andprovision of market data for salariesand incentive programmesRetirement benefits adviceLegal advice on cash and shareincentive schemes, employmentand retirement benefits matters1 Addleshaw Goddard LLP advised on share incentive arrangements until August <strong>2011</strong>.overviewfinancial statements governancesustainabilitybusiness reviewJean-Pierre Rodierremuneration committee chairman
70 <strong>Rexam</strong> annual report <strong>2011</strong> directors’ reportremuneration reportrole of the remuneration committeeThe board has approved the terms of reference delegating certainresponsibilities to the committee. The terms of reference arereviewed annually and are available on the Company’s website.The main responsibilities of the committee are to:• determine the ongoing appropriateness of theremuneration principles and the remuneration andbenefits policy, including retirement benefits, for theexecutive directors and band 1 executives who arethe Group’s most senior management;• approve the terms and conditions for service contractsfor the executive directors and band 1 executivesincluding, when necessary, termination andcompensation payments, and to approve the individualremuneration packages for the chairman of theCompany, the executive directors and band 1executives;• supervise the Group’s remuneration practices andprocedures;• approve and recommend to the board the design ofany new executive or employee cash or share incentivearrangements and, for existing cash or shares incentivearrangements, annual awards and grants, the settingof performance conditions and parameters and anysignificant rule changes; and• approve the achievement of any performance targetsfor cash or share incentive arrangements.The committee holds a strategy meeting once a year to reviewmarket comparisons and discuss specifically the appropriatenessof the Company’s remuneration principles and the policy for thefollowing financial year.The performance and effectiveness of the committee are reviewedas part of the main performance evaluation of the board and allits committees. The committee chairman discusses the results of theevaluation with the committee and, where appropriate, areas forimprovement are identified.remuneration principles, policy and packageThe Group’s aim is to increase shareholder value. It is key thatthe remuneration principles underpin this and that the committeeis focused on facilitating the achievement of the corporatestrategy through ensuring that achievement of the corporatestrategy is reinforced through appropriate performance andmanagement incentives.Rewards are aligned with the Company’s performance so thatexecutive directors are incentivised to achieve demanding resultsbut within an appropriate risk profile for the Group.The board believes that the remuneration principles and policyshould ensure that the Company is focused on the social, ethical,environmental and governance issues that are relevant to thebusiness. The board and the committee aim to have processesthat reward all employees fairly according to their responsibilities,their performance and market practice in their country ofemployment. The committee is made aware of comparativedata relating to the pay and employment conditions for otherGroup employees which is taken into consideration when theremuneration package for executive directors and band 1executives is being reviewed.remuneration principles for the GroupTo become an employer of choice by attracting, retaining andmotivating highly qualified and talented people and to providecompetitive remuneration to all employees appropriate to thecountries in which we are basedTo create an integrated Group wide reward strategy, particularlyin the area of long term incentives, providing a balance betweenannual and long term incentives and fixed and variable payTo ensure that a significant portion of the remuneration package isweighted towards variable, performance related pay to align theinterests of the executive directors with those of the shareholdersTo promote a consistent, clear and transparent link betweenbusiness performance and shareholder valueTo reward stretching and sustained financial and personalperformance focused on profitable growth, sustainable marginsand cash flow with an earnings opportunity in the upper quartileof market comparative dataTo ensure remuneration packages are market competitiveTo reinforce the <strong>Rexam</strong> values and leadership practicesTo provide transparency and simplicity in the reward strategyThe committee considers the remuneration principles indetermining the remuneration policy. To maintain a consistentglobal approach to reward, the remuneration policy isimplemented not only for the executive directors, GrahamChipchase and David Robbie, but also for the band 1 executiveswho are charged with delivering long term shareholder valueand sustained business performance improvement.
71Following the annual remuneration review in November <strong>2011</strong>,the committee concluded that the basis on which the remunerationpackage is formulated remains relevant and that executivedirectors’ remuneration remains appropriate and closely alignedwith the Company’s strategy. A summary of the main elements ofthe remuneration package as they apply to executive directors isshown below and further details are included in the respectivesections of this report.remuneration policy <strong>2011</strong> and 2012The focus of the remuneration policy is to set base salaries, benefitsand retirement benefits at or around the market median takingaccount of the job description, experience and personalperformance, and reward exceptional achievement of stretchingfinancial and personal performance.base Set at or around the market mediansalaryannualincentiveslong termincentivesclawbackpolicyretirementbenefits(UK)90% of base salary at target and maximum bonusopportunity of 180% of base salary with 25% of anyearned bonus to be deferred into <strong>Rexam</strong> sharesPerformance conditions linked to compound annualunderlying earnings per share growth (33.3%), relativetotal shareholder return (33.3%) and return on capitalemployed growth (33.3%)Provides for unvested shares or awards to beforfeited in whole or in part in the event of conductdetrimental to the Group or a material restatementof the Group’s resultsCareer average revalued earnings defined benefitplan for current executive directorsExecutive directors appointed after 6 April <strong>2011</strong> willbe entitled to membership of a defined contributionpension arrangementBased on achievement of targets for the annual cash incentivesand the expected value of share awards vesting, the estimatedpercentage value of an annual remuneration package isillustrated below:2012 annual remuneration packageTarget/expected valueMaximumGraham Chipchase and David Robbie32%14% 27% 27%18% 8% 33% 41%0%100%● Salary ● Retirement benefit ● <strong>Annual</strong> incentive ● LTIPsource: Kepler AssociatesThe value placed on performance related incentives is an estimateof the expected value. It cannot be accurately quantified untilthe extent to which performance targets are met is known andthe incentives crystallise. If the respective minimum performancetargets are not achieved, then the incentive has no value. If sharebased incentives vest, the Company’s share price at the timeof the vesting of the awards determines the value of theincentives received.base salarySalary reviews take effect in May each year and are based onthe personal performance of the individual as well as reference tothe market median for the position and experience of the executivedirector. The base salary for executive directors takes account ofprevailing market and economic conditions and the levels of basesalary provided for the broader employee base. All benchmarkingdata is reviewed carefully and in context and the committee doesnot accept unquestioningly benchmarking data but considers otherrelevant criteria when base salaries are reviewed.base salary <strong>2011</strong> base salary 2010Graham Chipchase £715,000 £675,000David Robbie £440,000 £418,200For 2012, salaries will be reviewed taking account of theremuneration policy, benchmark data as referred to aboveand the salary review parameters set for the Group as a whole.The committee is also sensitive to the levels of the remunerationpackages of other employees within the Group. <strong>Rexam</strong> operatesin many countries and has an employee base with a diverse rangeof skills. Employee remuneration packages are therefore determinedlocally to meet local needs, while respecting <strong>Rexam</strong>’s values.overviewfinancial statements governancesustainabilitybusiness review
72 <strong>Rexam</strong> annual report <strong>2011</strong> directors’ reportremuneration reportannual incentivesannual incentives for executive directors <strong>2011</strong>To incentivise management to achieve profitable growth and tosustain the Group’s cash programme, the annual cash incentivefinancial targets in <strong>2011</strong> depended upon the realisation of targetsfor Group underlying profit before tax and free cash flow as well aspersonal performance. At target, the annual incentive achievementwas 90% of base salary and the maximum incentive opportunitywas 180% of base salary for achieving demanding financialtargets and exceeding personal performance objectives. Personalperformance was measured against personal objectives and<strong>Rexam</strong> specific leadership practices.The executive directors will receive 25% of any annual incentiveawarded in 2012, in respect of <strong>2011</strong> annual incentives, asa deferred award over <strong>Rexam</strong> shares, with no additionalperformance conditions save that such shares must be held fora period of not less than three years and are subject to clawback.The policy relating to clawback is described in the long termincentives section of this report.annual incentive achievement for executive directors <strong>2011</strong>The financial targets for <strong>2011</strong> were achieved and resulted inthe executive directors being entitled to an annual incentiveequivalent to 100.7% of base salary. In addition, the committeeassessed the achievement by each executive director of theirpersonal performance objectives set at the beginning of <strong>2011</strong>.The total annual incentive entitlement approved by the committee,including achievement of personal objectives, was 128.6% and125.9% of base salary for Graham Chipchase and David Robbierespectively. Executive directors will receive 75% of their annualincentive as cash and 25% as a deferred award over <strong>Rexam</strong>shares which will vest in three years.performance conditions <strong>2011</strong> % of base salary <strong>2011</strong>target maximum actualUnderlying profit before tax 43.2 86.4 52.7Free cash flow 28.8 57.6 48.0Personal performance objectives 18.0 36.0 25.2–27.9annual incentives for executive directors 2012The performance conditions for 2012 continue to build onachieving improved profit before tax and generating free cashflow, together with achieving personal performance objectives.The basis of performance measures for 2012, therefore, remainsunchanged to those in <strong>2011</strong>. In its assessment of personalperformance, the committee will continue to ensure that there is anappropriate balance between payments for personal performanceand the achievement of financial objectives. The target incentiveopportunity is 90% of base salary with an opportunity to achieve180% of base salary for achieving demanding financial targetsand exceeding personal performance objectives.The weighting of the performance targets for 2012 is shown belowand remains unchanged to those in <strong>2011</strong>.performance conditions 2012 % of base salary 2012target maximumUnderlying profit before tax 43.2 86.4Free cash flow 28.8 57.6Personal performance objectives 18.0 36.0Total 90.0 180.0As in <strong>2011</strong>, executive directors will receive in 2013, subject toachievement of 2012 performance targets, 75% of their annualincentive as cash and 25% as a deferred award over <strong>Rexam</strong> shareswhich will vest in three years.The band 1 executives participate in the annual incentivearrangements on the same basis as the executive directorsbut at a lower annual incentive opportunity and without anydeferral into shares.long term incentivesLong Term Incentive Plan 2009 (2009 LTIP)The 2009 LTIP is the primary long term incentive for executivedirectors, band 1 executives and other senior management.Awards to be granted in 2012In 2012 the committee intends that individual awards to theexecutive directors will be the same as in <strong>2011</strong> at 220% of basesalary. As in <strong>2011</strong>, awards will be measured against improvementin compound annual growth in underlying earnings per share,relative total shareholder return, and return on capital employed.performance measureCompound annualgrowth in underlyingearnings per share(EPS)Return on capitalemployed (ROCE)Relative totalshareholder return(TSR)award % reason for performance condition33.3 Business performanceA visible and recognisedindicator of the Company’sfinancial returns33.3 Business performanceProfitable use of assets33.3 Shareholder valueAn external, verifiablemeasurement that providesa robust and comparativeindicator of the Company’sperformance against othercompanies listed in the FTSEAll three performance measures demonstrate the success of theCompany’s strategy. A combined EPS, ROCE and TSR approachmaximises alignment with shareholder interests and provides aclear link between management action and sustained businessperformance. The committee believes that the performancetargets closely align executive director compensation with theCompany’s strategy.
73EPS performance will be measured by compound annual growthin earnings per share adjusted to exclude retirement benefitobligations net finance cost. For the awards to be granted in 2012,the committee has targeted EPS growth performance in a rangebetween 3% pa and 12% pa (<strong>2011</strong>: 3% pa and 12% pa).vesting of total awardEPS performancesubject to EPS %Below minimum 3% paNoneBetween minimum and maximum 8.3–33.3Above maximum 12% pa 33.3ROCE performance will be measured by averaging the annual returnon capital employed over the measurement period. The committeehas targeted ROCE performance in a range between 12% paand 16% pa for the 2012 awards (<strong>2011</strong>: 11% pa and 15% pa).These targets reflect the commitment of the management to furtherincrease the ROCE of the Group.vesting of total awardROCE performancesubject to ROCE %Below minimum 12% paNoneBetween minimum and maximum 8.3–33.3Above maximum 16% pa 33.3<strong>Rexam</strong>’s TSR will be compared with the TSRs of a comparator groupcomprising the largest 150 companies (excluding investment trusts)by market capitalisation within the FTSE All Share index on1 January 2012.vesting of total awardTSR performance percentile within comparator group subject to TSR %Below medianNoneBetween median and 25th 8.3–33.3Above 25th 33.3The 2012 awards will include a dividend equivalent wherebyexecutive directors will be entitled to receive in shares or cash thedividends notionally paid during the measurement period on anyshares that vest.The awards will also be granted subject to a clawback provisionwhereby unvested shares or awards can be forfeited in whole or inpart in the event of conduct detrimental to the Group; specificallyconduct which results in material reputational damage, significantfinancial loss or a restatement of results other than pursuant to achange of the accounting rules.Under the rules of the 2009 LTIP, awards granted under this planwill vest to the extent that certain performance conditions havebeen achieved over a three year measurement period. In certainearly leaver situations, the committee has discretion as to whetherawards can be exercised and, if so, to determine the achievementof performance targets. Participants who leave the Group with aright to retain their awards under the rules of the 2009 LTIP mustnormally wait until the end of the measurement period. If the awardvests, the participant will receive an entitlement which will be timeapportioned for the period from the start of the performanceperiod to the date on which employment ended.Similarly, on takeover or change of control of the Company, thecommittee will determine vesting according to the achievementof performance targets and time apportionment of the resultingentitlement.In 2012, band 1 executives will receive awards at a lowerpercentage level of base salary but with the same performanceconditions and targets as the executive directors.other share incentive schemesThe Company also operates the Savings Related Share OptionScheme 2007 in the United Kingdom in which eligible executivedirectors are permitted to participate.dilution limitsDuring the year, the Company remained within the issued sharecapital headroom limits as set out in the rules of its share incentivearrangements for the issue of new shares.headroom limits5% in 10 years for discretionaryshare option schemes10% in 10 years for all shareoption schemes% of issuedshare capitalas at 31.12.<strong>2011</strong>% of issuedshare capitalas at 31.12.20100.9 1.31.3 1.6Awards granted under the 2009 LTIP will be settled by the <strong>Rexam</strong>Employee Share Trust from shares it purchases in the market.retirement benefitsCurrent executive directors employed in the UK are membersof the career average revalued earnings defined benefit <strong>Rexam</strong>Pension Plan (the Plan). The maximum pensionable pay forexecutive directors who are members of the Plan is their basesalary less an offset in accordance with the rules of the Plan.Each year they individually earn a pension entitlement equal to1/30th of their pensionable pay in that year which is then revaluedto age 60, which is their expected retirement age under the Plan.Current executive directors are able to fully or partially opt out ofthe Plan for accrual of their individual retirement pension andreceive a cash supplement instead. The value of this cashsupplement is 44% of any eligible base salary not pensionedunder the Plan. In the event of the death in service of a memberof the Plan, and if the member has dependants, an age relatedamount of between 11 and 15 times salary is provided, with anyamount not paid as a lump sum to beneficiaries being convertedinto dependants’ pensions.The benefits provided to executive directors are set out in the rulesof the Plan and as such are valued and funded as part of the Plan’snormal actuarial valuation cycle. Any surplus and deficit in respectof executive directors are aggregated, and funded with that of allother Plan members. Discretionary benefits for executive directorsare also dealt with in the same way as discretionary benefits forother Plan members. There are no allowances for discretionaryincreases in cash equivalent transfer value calculations. Thefunding position of the Plan on an accounting basis is reportedin note 27 to the consolidated financial statements.overviewfinancial statements governancesustainabilitybusiness review
74 <strong>Rexam</strong> annual report <strong>2011</strong> directors’ reportremuneration reportWith the agreement of the employer and the Plan Trustee, earlyretirement benefits can be taken on cessation of employment afterattainment of age 55 with accrued benefits for executive directorsreduced by 3% pa before age 60. On retirement, a membercan elect to convert some of the pension into a tax free lumpsum payment and, accordingly, take a smaller monthly pension.Pensions in payment are increased annually in line with the retailprices index, subject to various minimum and maximum increases(according to periods of service) as set out in the rules of the Plan.Graham Chipchase and David Robbie are members of the Planand their retirement benefit arrangements are on the basissummarised above. Each selected a pensionable salary for theyear which was below the maximum and received a salarysupplement on pension eligible basic salary. Details of theirentitlements and transfer values under the Plan during <strong>2011</strong> areshown in the table on page 78 and their salary supplements areshown in the table on page 77.retirement benefits in 2012Any new executive director appointment, who is not currently acontributing member of the Plan, will be eligible to join a definedcontribution pension arrangement with a Company contributionof 25% of base salary or alternatively elect for a cash supplementequivalent to 22% of base salary. Death in service life cover of4 times basic salary and a Group income replacement plan,providing continuing income for two years at 50% of base salaryafter short term sickness benefit expires, with a lump sum of 2 timesbase salary payable on cessation of service if there is no return towork, are also provided.shareholding requirementIn order to forge a closer community of interest with shareholders,executive directors are required to accumulate a shareholding overtime from shares acquired on the vesting of their share incentives.The minimum shareholding requirement was increased with effectfrom 1 January <strong>2011</strong>. The committee has reviewed the shareownership guidelines for the chief executive and the executivedirectors and consider that the current minimum shareholdingrequirement remains relevant.<strong>2011</strong>shareholding requirementnumber of shares2010shareholding requirementnumber of sharesexecutiveChief executive 320,000 125,000Executive directors 130,000 75,000No shares have been acquired through the exercise of shareincentives as no share awards vested in the year. Each of theexecutive directors can purchase ordinary shares where thereis an opportunity to do so. During <strong>2011</strong>, David Robbie acquiredshares through the reinvestment of cash dividends.The band 1 executives have a shareholding requirement of50,000 shares.The shareholdings of directors are shown on page 80.share performanceThe graphs below illustrate the Company’s share performancein terms of total shareholder return compared with that of theFTSE 100 index of which the Company is a constituent member.This index has been selected as it is considered to be the mostappropriate broad equity market index against which the Group’sperformance should be measured as it provides a cross section ofother leading UK listed companies. The first graph shows the valueat each year end to 31 December <strong>2011</strong>, on a total shareholderreturn basis, of £100 invested in <strong>Rexam</strong> shares on 31 December2006 compared with the value of £100 invested over the sameperiods in the FTSE 100 share index.The <strong>Rexam</strong> share price for the period preceding the rights issuein 2009 has been adjusted for the bonus element inherent in thatrights issue.comparison of five year cumulative totalshareholder return120100806002006 2007 2008 2009 2010 <strong>2011</strong><strong>Rexam</strong>FTSE 100 indexsource: Alithos LimitedPoints on this graph show the value of aninvestment on the last trading day of each year.The graph below measures TSR since 2010 reflecting the period oftime since the Company began its significant focus on the strategicpriorities of controlling costs, optimising cash and improving thereturn on capital employed.comparison of two year cumulative totalshareholder return1401201008002009 2010 <strong>2011</strong><strong>Rexam</strong>FTSE 100 indexsource: Alithos LimitedPoints on this graph show the value of aninvestment on the last trading day of each year.Total shareholder return reflected in the graphs above is not anindication of the likely vesting of awards granted under the LTIP2009, which is based on a different comparator group, asexplained on page 79.
75executive directors’ contracts of employmentdate ofappointmentdate ofcurrent contractnotice period(company)notice period(director)compensation onearly terminationexecutive directornotesGraham Chipchase 1 10 February 2003 30 November 2009 12 months 12 months As policyDavid Robbie 2 3 October 2005 20 October 2010 12 months 12 months As policy1 Graham Chipchase had a contract of employment dated 1 October 2002 that was effective from his commencement of employment with <strong>Rexam</strong> in February 2003. On his appointment aschief executive, Graham Chipchase signed a new contract of employment on 30 November 2009 that was effective from 16 November 2009 and which acknowledged his continuousemployment from February 2003.2 David Robbie had a contract of employment dated 24 August 2005 that was effective from his commencement of employment with <strong>Rexam</strong> in October 2005. Following the update of theCompany’s policy for executive director contracts, David Robbie signed a new contract of employment on 20 October 2010 which acknowledged his continuous employment from October 2005.duration of contractsThe Company’s current policy is that all executive directors serve under contracts terminable on one year’s notice. However, in exceptionalcircumstances, the policy allows for an externally recruited executive director to be offered a contract terminable by the Company on twoyears’ notice if terminated in the first year of appointment. Thereafter, the contract would become terminable on one year’s notice.Executive directors’ contracts continue until such date as agreed between the executive director and the Company. The contract can alsobe terminated by either party subject to required notice.termination of contractsThe Company has the right to terminate a contract immediately, even where termination is without cause. In such circumstances, thecontract provides for a payment in lieu of notice to be made and calculated by reference to base salary, retirement benefits and otherbenefits. There is no provision for payment of any annual incentive in respect of the termination notice period. The Company will makeany termination payment in monthly instalments over what would have been the notice period until the earlier of the director commencingin a new position or the notice period expiring. The executive has a duty to mitigate his or her loss of office and actively seek alternativecomparable employment at the earliest opportunity, thereby reducing the need for compensation.share based entitlementsAny share based rights granted to an executive director will be determined at the discretion of the committee, as permitted by the rulesof the relevant scheme. If an executive director resigns from employment or is dismissed for gross misconduct, he or she will not retain hisor her right to acquire shares under awards or options granted to him or her.overviewfinancial statements governancesustainabilitybusiness review
76 <strong>Rexam</strong> annual report <strong>2011</strong> directors’ reportremuneration reportexternal directorshipsThe Company’s policy on executive directors having non executive directorships with other companies is that such appointments arepermitted, subject to the approval of the chairman of the board. Any fees payable will be retained by the executive director unlessotherwise agreed.non executive directorsdate ofappointmentdate of originalletter of appointmenteffective date ofcurrent letter ofappointmentnon executive directorexpiry of termStuart Chambers 1 February 2012 15 November <strong>2011</strong> 1 February 2012 31 January 2015Noreen Doyle 22 March 2006 20 March 2006 22 March 2012 21 March 2015Sir Peter Ellwood 1 February 2008 17 January 2008 1 February <strong>2011</strong> 31 January 2014John Langston 30 October 2008 30 October 2008 30 October <strong>2011</strong> 29 October 2014Wolfgang Meusburger 1 December 2006 26 October 2006 1 December 2009 30 November 2012Leo Oosterveer 1 September <strong>2011</strong> 10 August <strong>2011</strong> 1 September <strong>2011</strong> 31 August 2014Jean-Pierre Rodier 7 June 2006 6 June 2006 7 June 2009 6 June 2012Non executive directors serve under letters of appointment and are generally appointed for an initial three year term renewable thereafter,at the discretion of the board, for a maximum of two further three year terms, subject to election or re-election by shareholders at the AGM.Appointments of non executive directors are terminable without compensation by either the Company or the director giving written notice.The remuneration of the chairman is determined by the committee (the chairman absenting himself from the discussions if present atthe meeting) and non executive directors’ fees are recommended by the chairman and chief executive and approved by the executivedirectors. The fees of the chairman, the senior independent director and the other non executive directors are reviewed annually in linewith current market practice.non executive directors current feesper annumBasic fees £55,000Additional fees for:Chairs of board committees £10,000Senior independent director £10,000Sir Peter Ellwood, as chairman of the Company, received fees of £320,000 during <strong>2011</strong>. Stuart Chambers will receive the basic nonexecutive director fees for the period from 1 February to 22 February 2012. From the date of his appointment as chairman of the Companyon 23 February 2012, he will receive annual fees of £320,000. The fees of the non executive directors will remain at the current levelfor 2012.The executive directors’ contracts of employment and the non executive directors’ letters of appointment are available for inspectionby any shareholder of the Company during normal business hours at the registered office of the Company on Monday to Friday(public holidays excepted), and will be available at the AGM 2012.
77directors’ remuneration (audited information)<strong>2011</strong>fees/base salary£000<strong>2011</strong>pensionsupplement£000<strong>2011</strong>annualincentivecash 1£000<strong>2011</strong>annualincentivedeferredshares 1£000<strong>2011</strong>benefits£000chairmanSir Peter Ellwood 320 11 331 300<strong>2011</strong>total£0002010total£000overviewnon executive directorsNoreen Doyle 65 5 70 60John Langston 65 5 70 60Wolfgang Meusburger 55 1 56 50Leo Oosterveer (appointed 1 September <strong>2011</strong>) 18 – 18 –Jean-Pierre Rodier 56 3 59 50Carl Symon (retired 23 November <strong>2011</strong>) 69 2 71 70648 – – – 27 675 590executive directorsGraham Chipchase 702 254 690 229 36 1,911 1,703David Robbie 433 128 415 139 4 1,119 1,0431,135 382 1,105 368 40 3,030 2,746<strong>2011</strong> total 1,783 382 1,105 368 67 3,7052010 total 1,680 – 1,640 – 16 – 3,336 21 The underlying profit before tax and free cash flow targets for <strong>2011</strong> were exceeded which, including the achievement of personal performance objectives, resulted in an annual incentive of 128.6%(2010: 150%) of base salary due to Graham Chipchase and 125.9% (2010: 150%) of base salary due to David Robbie. Details of the financial and personal performance targets are explained onpage 72. Executive directors will receive 75% of their annual incentive as cash and 25% as a deferred share award which will vest in three years.2 The total remuneration reported in the annual report 2010 was £3,346,000. The amount of £3,336,000 shown above excludes amounts received in 2010 by Leslie Van de Walle, the former chiefexecutive. Leslie Van de Walle did not receive any payments in <strong>2011</strong>.The benefits in kind provided to directors comprise one or more of healthcare, accommodation, subsistence and the payment of certainprofessional fees. Executive directors are offered membership of a Group pension scheme, which includes life assurance protection.No amounts were paid to third parties in respect of any executive director’s services to the Company and no termination payments weremade to any past director during the year.Details of each director’s share incentives can be found on pages 79 and 80.financial statements governancesustainabilitybusiness review
78 <strong>Rexam</strong> annual report <strong>2011</strong> directors’ reportremuneration reportretirement benefits (audited information)The following directors were members of defined benefit arrangements provided by the Company during the year. Entitlements andcorresponding transfer values are shown in the table below. The values at 31.12.11 reflect the decision taken by both executive directorsto pension a lower amount of their eligible basic salary in <strong>2011</strong>. Their eligible basic salary in 2010 was fully pensioned.<strong>2011</strong>(a)gross increasein accruedpensionper annum£000<strong>2011</strong>(b)increase inaccrued pensionexcludinginflationper annum£000<strong>2011</strong>(c)total accruedpension31.12.11per annum£000<strong>2011</strong>(d)transfer valueof net increasein accrual overperiod£000<strong>2011</strong>(e)change intransfervalue duringperiod£000<strong>2011</strong>(f)transfer valueof accruedpension at31.12.11£0002010(g)transfer valueof accruedpension at31.12.10£000Graham Chipchase 13 8 101 126 583 1,886 1,294David Robbie 9 5 78 62 418 1,427 9931 Pension accruals shown are the amounts which would be paid annually on retirement based on service to 31 December <strong>2011</strong>.2 Transfer values (columns d, f and g) have been calculated in accordance with or consistent with the Occupational Pension Schemes (Transfer Values) Regulations 1996.3 The value of net increase in accrual (column d) represents the incremental value to the director of the benefit accrued. It is based on the increase in accrued pension (column b) after deductingcontributions made by the director.4 The change in the transfer value (column e) includes the effect of fluctuations due to factors beyond the control of the Company or the director, such as market conditions which include long terminterest rate movements. It is calculated after deducting contributions made by the director.There were no pension contributions paid by any Group employer for any executive director in respect of defined contribution schemesin <strong>2011</strong> or 2010.long term incentives (audited information)The interests of the directors in the shares of the Company through the Company’s share incentive arrangements are disclosed in thefollowing tables. There is no requirement for an executive director to make a payment on the grant of an award or an option under anyof the arrangements. No variations were made during the year to the terms and conditions of any awards or options.The vesting of awards granted under the 2009 LTIP will be satisfied from <strong>Rexam</strong> shares that the <strong>Rexam</strong> Employee Share Trust, adiscretionary trust resident in Jersey, Channel Islands, has purchased or will purchase in the market and the cost will normally be metby the participant’s employing company. The exercise of options granted under the Company’s savings related share option schemewill be satisfied from the allotment of new ordinary shares.The market price of the Company’s shares at 31 December <strong>2011</strong> was £3.528 per share. The lowest and highest daily closing shareprices during <strong>2011</strong> were £2.998 and £4.00 respectively. There were no gains from the exercise of directors’ share options during <strong>2011</strong>through all share incentive arrangements (2010: £159,811).
79Long Term Incentive Plan 2007 (2007 LTIP)The maximum number of shares to which the participant is entitled is reflected in the ‘outstanding’ columns of the table. Directors held thefollowing options over shares.exerciseprice perholding£firstexercisedatenote 1expirydatenote 1outstanding01.01.11numberlapsedduringthe yearnumberoutstanding31.12.11numbernotegrant dateGraham Chipchase 2 26.03.08 1 01.01.11 25.02.15 250,295 250,295 –David Robbie 2 26.03.08 1 01.01.11 25.02.15 244,346 244,346 –1 The first exercise date and the expiry date are dependent upon the options vesting but the final expiry date must be no later than six years and 11 months from the grant date for the 2007 LTIP .2 Options lapsed on 1 January <strong>2011</strong> as the TSR performance target had not been achieved. <strong>Rexam</strong> ranked 33rd which fell below the median percentile of its comparator group of 42 companies.3 No options were granted, vested, were exercised or lapsed during the year.Long Term Incentive Plan 2009 (2009 LTIP)The maximum number of shares to which the participant is entitled is reflected in the ‘outstanding’ columns of the table. Directors held thefollowing awards over shares.market valueper share ondate of grant£ grant dateexerciseprice perholding£vestingdatenote 1expirydatenote 1outstanding01.01.11numbergrantedduringthe yearnumberoutstanding31.12.11numbernoteGraham Chipchase 2 2.911 11.03.10 – 11.03.13 11.03.13 519,230 – 519,2303 3.700 08.03.11 – 08.03.14 08.03.14 – 406,715 406,715Total 519,230 406,715 925,945David Robbie 2 2.911 11.03.10 – 11.03.13 11.03.13 315,384 – 315,3843 3.700 08.03.11 – 08.03.14 08.03.14 – 251,982 251,982Total 315,384 251,982 567,3661 The vesting date and the expiry date are dependent upon the awards vesting. The final expiry date is the close of business on the vesting date.2 The award is subject to the performance conditions shown below, measured over a three year period which commenced on 1 January 2010.3 The award is subject to the performance conditions shown below, measured over a three year period which commenced on 1 January <strong>2011</strong>.4 No awards vested, were exercised or lapsed during the year.performance measurescompound earnings per share growth (EPS)This measure has been chosen as it is a visible and recognised indicator by bothemployees and shareholders of the Company’s financial returns. EPS performancewill be measured by compound annual growth in underlying earnings per share.relative total shareholder return performance (TSR)This measure has been chosen as it is an external, verifiable measurement targetthat provides a robust and comparative indicator of the Company’s performanceagainst other UK listed companies. <strong>Rexam</strong>’s TSR will be compared with the TSR ofa comparator group comprising the largest 150 companies by market capitalisationwithin the FTSE All Share index on the 1 January of the year of grant. Investment trustsare excluded from this comparator group.return on capital employed (ROCE)This measure was introduced in <strong>2011</strong> to align more closely the performancemeasures with the Company’s strategy.<strong>2011</strong>granttarget<strong>2011</strong> grantvesting oftotal awardnote 12010granttarget2010 grantvesting oftotal awardnote 1min 3% 8.3% 3% 15%max 12% 33.3% 12% 60%min median 8.3% median 10%max 25 th 33.3% 25 th 40%min 11% 8.3% – –max 15% 33.3% – –overviewfinancial statements governancesustainabilitybusiness review1 Between the minimum and maximum targets, vesting will be calculated on a straight line basis.
80 <strong>Rexam</strong> annual report <strong>2011</strong> directors’ reportremuneration reportSavings Related Share Option Scheme (2007 SAYE)Directors held the following options over shares through the 2007 SAYE.grantdateexercisepriceper share£exerciseperiodcommencesexpirydateoutstanding01.01.11numberoutstanding31.12.11numberGraham Chipchase 15.10.09 2.12 01.12.14 31.05.15 7,334 7,334David Robbie 15.10.09 2.12 01.12.14 31.05.15 7,334 7,3341 No options were granted to executive directors, were exercised by or lapsed during the year.directors’ interests in shares (audited information)sharesat 31.12.11sharesat 01.01.11 1Graham Chipchase 168,441 168,441Noreen Doyle 8,636 8,466Sir Peter Ellwood 61,785 59,645John Langston 4,090 4,090Wolfgang Meusburger 13,198 12,742Leo Oosterveer (appointed 1 September <strong>2011</strong>) – –David Robbie 71,907 69,416Jean-Pierre Rodier 8,181 8,1811 Or date of appointment, if later.2 Stuart Chambers was appointed a non executive director on 1 February 2012. At the date of appointment and at the date of this report he held 30,000 shares.3 The above interests in shares, and awards and options over shares at 31 December <strong>2011</strong> remain unchanged at the date of this report.complianceThe remuneration report for the year ended 31 December <strong>2011</strong> is presented by the remuneration committee on behalf of the board.The report covers the main responsibilities of the committee, the current remuneration policy for directors, together with details of directors’remuneration, annual and long term incentives and provision of retirement benefits for the year ended 31 December <strong>2011</strong>.The report has been prepared in accordance with the Companies Act and schedule 8 of the Large and Medium sized Companies andGroups (Accounts and <strong>Report</strong>s) Regulations 2008. In addition, the committee has followed the principles of good governance set out inthe UK Corporate Governance Code and complied with the requirements of the Listing Rules.The sections of the report that have been referenced in PricewaterhouseCoopers LLP’s auditors’ report have been marked as auditedinformation in this report.On behalf of the boardJean-Pierre Rodierremuneration committee chairman22 February 2012
81other disclosuresThe annual report <strong>2011</strong> has been prepared for, and only for,the members of the Company, as a body, and no other persons.The Company, its directors, employees, agents and advisers donot accept or assume responsibility to any other person to whomthis document is shown or into whose hands it may come and anysuch responsibility or liability is expressly disclaimed. This annualreport may contain statements which are not based on current orhistorical fact and which are forward looking in nature. Theseforward looking statements reflect knowledge and informationavailable at the date of preparation of this annual report and theCompany undertakes no obligation to update these forwardlooking statements. Such forward looking statements are subjectto known and unknown risks and uncertainties facing the Groupincluding, without limitation, those risks described in this annualreport, and other unknown future events and circumstances whichcan cause results and developments to differ materially from thoseanticipated. Nothing in this annual report should be construedas a profit forecast.statement of directors’ responsibilitiesThe directors are responsible for preparing the annual report, theremuneration report and the financial statements in accordancewith applicable law and regulations.Company law requires the directors to prepare financial statementsfor each financial year. Under that law the directors have preparedthe consolidated financial statements in accordance withInternational Financial <strong>Report</strong>ing Standards (IFRSs) as adopted bythe European Union and the parent company financial statementsin accordance with UK Generally Accepted Accounting Practice(UK Accounting Standards and applicable law). Under companylaw the directors must not approve the financial statements unlessthey are satisfied that they give a true and fair view of the state ofaffairs of the Group and the Company and of the profit or loss ofthe Group for that year. In preparing these financial statements,the directors are required to:• select suitable accounting policies and then apply themconsistently;• make judgements and accounting estimates that are reasonableand prudent;• state whether IFRSs as adopted by the European Union andapplicable UK Accounting Standards have been followed,subject to any material departures disclosed and explainedin the consolidated and parent company financial statementsrespectively; and• prepare the financial statements on the going concern basisunless it is inappropriate to presume that the Group and theCompany will continue in business.The directors are responsible for keeping adequate accountingrecords that are sufficient to show and explain the Group’s and theCompany’s transactions and disclose with reasonable accuracyat any time the financial position of the Company and the Groupand enable them to ensure that the financial statements and theremuneration report comply with the Companies Act 2006 and,as regards the consolidated financial statements, Article 4 of theIAS Regulation. They are also responsible for safeguarding theassets of the Company and the Group and hence for takingreasonable steps for the prevention and detection of fraudand other irregularities.The directors are responsible for the maintenance and integrityof the Group’s website. Legislation in the UK governing thepreparation and dissemination of financial statements may differfrom legislation in other jurisdictions.Each of the current directors, whose names are listed on pages 54and 55 of the annual report, confirms that, to the best of his orher knowledge:• the consolidated financial statements, which have been preparedin accordance with IFRSs as adopted by the EU, give a true andfair view of the assets, liabilities, financial position and profit ofthe Group; and• the business review includes a fair review of the developmentand performance of the business and the position of the Group,together with a description of the principal risks and uncertaintiesthat it faces.dividendsSubject to shareholder approval, the directors have proposeda <strong>2011</strong> final dividend of 9.7p per share. The total dividend for theyear ended 31 December <strong>2011</strong> is 14.4p per share (2010: 12.0p).dividendper share (p)ex dividenddaterecorddatepaymentdate<strong>2011</strong> interim 4.7 07.09.11 09.09.11 04.10.11<strong>2011</strong> final 9.7 09.05.12 11.05.12 07.06.12principal acquisitions and disposalsThe disposal of the Group’s beverage and speciality closuresbusiness to Berry Plastics Inc for a cash consideration (net of costs)of £207m was announced on 20 June <strong>2011</strong> and was completedon 1 September <strong>2011</strong>.directors and directors’ interestsThe board of directors during the year ended 31 December <strong>2011</strong>and at the date of this annual report is set out on pages 54 and 55.Leo Oosterveer was appointed a non executive director on1 September <strong>2011</strong> and Carl Symon retired as senior independentdirector on 23 November <strong>2011</strong>. The chairman of the Company,Sir Peter Ellwood, is to retire from office at the close of businesson 22 February 2012. Sir Peter is succeeded as chairman byStuart Chambers who was appointed a non executive directorand chairman designate on 1 February 2012.overviewfinancial statements governancesustainabilitybusiness review
82 <strong>Rexam</strong> annual report <strong>2011</strong> directors’ reportother disclosuresNone of the directors had any interest during or at the end ofthe year in any contract of significance in relation to the businessof the Company or its subsidiary undertakings.Full details of the interests in the share capital of the Company ofthose directors holding office on 31 December <strong>2011</strong>, including anyinterest of a connected person, are set out in the remuneration report.share capitalAt 31 December <strong>2011</strong>, the Company had 877,030,922 sharesin issue as shown, together with details of the rights and restrictionsattaching to the shares, in note 29 to the consolidated financialstatements.powers given to directorsThe powers given to the directors are contained in the articlesof association (the Articles) and are subject to relevant legislationand, in certain circumstances, (including in relation to the issuingor buying back by the Company of its shares), subject to authoritybeing given to the directors by shareholders in general meeting.The Articles also govern the appointment and replacementof directors. The Articles, which may only be amended withshareholders’ approval in accordance with relevant legislation,can be found on the Company’s website.purchase of own sharesAt the AGM <strong>2011</strong>, shareholders passed a special resolutionrenewing the authority granted to the Company, in accordancewith the Companies Act 2006 and relevant institutional guidelines,to purchase a limited number of its own shares in the market.No shares have been purchased in the market, nor has anycontract been made to purchase shares under the previous orexisting authorities from 1 January <strong>2011</strong> to the date of this report.The directors are seeking an annual renewal of the authority atthe AGM 2012. Further details can be found in the notice ofAGM 2012.AGM 2012 AGM <strong>2011</strong>share purchase authorityproposed approved10% of issued share capital 87.70m 87.68msubstantial shareholdingsAt the date of this report, the Company had been advised of thefollowing significant direct and indirect interests in the issuedordinary share capital of the Company, in accordance withthe Disclosure and Transparency Rules (DTR) of the FinancialServices Authority.name of shareholdernumber of sharesdisclosed% interest in issuedshare capitalBlackRock Inc 44,138,256 5.03Legal & General Group Plc 34,660,260 3.95Information provided to <strong>Rexam</strong> pursuant to the DTR is publiclyavailable via the regulatory information services and on theCompany’s website.research and developmentThe Group’s expenditure on research and development duringthe year amounted to £17m from continuing operations and £2mfrom discontinued operations (2010: £16m and £3m).significant agreements<strong>Rexam</strong> has a number of commercial agreements which areessential to the Group’s business, as discussed in the key riskssection of the business review on pages 34 to 41. Mitigationarrangements are in place to safeguard, as far as possible,the Group’s business in the event of the unexpected terminationor amendment of such agreements.The Company is also required to disclose any significantagreements that take effect, alter or terminate on a changeof control of the Company following a takeover bid. Somecommercial agreements allow the counterparties to alter orterminate the arrangements in these circumstances. The Companyalso has committed debt facilities all of which are directly orindirectly subject to change of control provisions, albeit thefacilities do not necessarily require mandatory prepayment ona change of control.
83At 31 December <strong>2011</strong> the debt facilities subject to theseprovisions were:debt facilities amount maturitySubordinated bond €750m June 2067US public bond US$550m June 2013US private placement US$225m June 2013Medium term note €638m March 2013Bilateral credit facility £50m December 2012Revolving credit facility £602m November 2016Bilateral credit facility £45m November 2016Bilateral credit facility £20m November 2016Bilateral credit facility £20m November 2016Bilateral credit facility £20m November 2016Bilateral credit facility £20m November 2016Bilateral credit facility £20m November 2016Bilateral credit facility £20m November 2016Bilateral credit facility £20m November 2016Bilateral credit facility £20m November 20161 All of the above bilateral credit facilities and the revolving credit facility are multi currency.2 The revolving credit facility and certain of the bilateral credit facilities include options toextend the final maturity from November 2016 to November 2018, subject to the agreementof the banks.The service contracts of the executive directors do not containa change of control provision.The trustee of the <strong>Rexam</strong> Employee Share Trust (the Trust) holdsshares in order to satisfy awards under the <strong>Rexam</strong> employee shareincentive plans. If an offer is made to acquire the Company’sshares, the trustee is not obliged to accept or reject any such offerin respect of any shares which are intended to satisfy awardswhich are outstanding. However, the trustee shall have regard tothe interests of the beneficiaries and shall have the power to consultthem to obtain their views on such offer and, subject to theforegoing, may consider any recommendations made to it by theCompany but shall not be obliged to comply with suchrecommendations.The Company has granted a qualifying pension scheme indemnityin the form permitted by the Companies Act 2006 to the directorsof <strong>Rexam</strong> Pension Trustees Limited, the Trustee to the <strong>Rexam</strong> PensionPlan. The indemnity remains in force at the date of this report.payments to suppliersThe Group’s operating businesses are responsible for the termsand conditions under which they conduct business transactionswith their suppliers. It is Group policy to agree the terms of paymentand make payments to suppliers in accordance with those terms,provided that suppliers have complied with all relevant termsand conditions.The Company had 14 days (2010: 13 days) purchases outstandingat 31 December <strong>2011</strong> based on the average daily amount invoicedby suppliers.corporate governance statementThe information that fulfils the requirements of the corporategovernance statement in accordance with rule 7.2 of the DTRcan be found in this directors’ report within pages 10 to 83.auditorsdisclosure of information to the auditorsEach person who is a director of the Company at the date ofapproval of this annual report confirms that:• so far as the director is aware, there is no relevant auditinformation of which the Company’s auditors are unaware; and• each director individually has taken all the steps that he or sheought to have taken as a director to make him or herself awareof any relevant audit information and to establish that theCompany’s auditors are aware of that information.reappointment of auditorsPricewaterhouseCoopers LLP will be proposed for reappointmentas the Company’s auditors at the AGM 2012 as recommended bythe audit and risk committee.annual general meeting 2012The AGM of the Company, details of which can be found in thenotice of AGM 2012, will be held at 11.00am on 3 May 2012 atOne Great George Street, London SW1.On behalf of the boardDavid Gibsoncompany secretary22 February 2012overviewfinancial statements governancesustainabilitybusiness review
84<strong>Rexam</strong> annual report <strong>2011</strong>consolidated financialstatementsThese caps are for <strong>Rexam</strong>’s innovative Advancia TM ,the world’s first all in one nasal spray pump.
8586 independent auditors’ report to the members of <strong>Rexam</strong> <strong>PLC</strong>87 consolidated income statement88 consolidated statement of comprehensive income89 consolidated balance sheet90 consolidated cash flow statement91 consolidated statement of changes in equitynotes to the consolidated financial statements:92 note 1 – principal accounting policies98 note 2 – segment analysis100 note 3 – operating expenses101 note 4 – employee costs and numbers102 note 5 – auditors’ remunerationconsolidated financialstatements102 note 6 – exceptional items – continuing operations102 note 7 – interest103 note 8 – tax105 note 9 – earnings/(loss) per share106 note 10 – discontinued operations107 note 11 – equity dividends107 note 12 – goodwill109 note 13 – other intangible assets110 note 14 – property, plant and equipment111 note 15 – investments in subsidiaries111 note 16 – investments in associates and joint ventures112 note 17 – available for sale financial assets112 note 18 – insurance backed assets113 note 19 – inventories113 note 20 – trade and other receivables114 note 21 – cash and cash equivalents115 note 22 – assets and liabilities classified as held for sale115 note 23 – trade and other payables116 note 24 – borrowings117 note 25 – net borrowings118 note 26 – financial instruments125 note 27 – retirement benefit obligations129 note 28 – provisions130 note 29 – share capital130 note 30 – other reserves131 note 31 – share based payment133 note 32 – reconciliation of profit/(loss) before taxto cash generated/(used) from operations133 note 33 – contingent liabilities133 note 34 – commitmentsfinancial statementsgovernancesustainabilitybusiness reviewoverview
86 <strong>Rexam</strong> annual report <strong>2011</strong>independent auditors’ report to the members of <strong>Rexam</strong> <strong>PLC</strong>We have audited the consolidated financial statements of <strong>Rexam</strong> <strong>PLC</strong> for the year ended 31 December <strong>2011</strong> which comprise theconsolidated income statement, the consolidated statement of comprehensive income, the consolidated balance sheet, the consolidatedcash flow statement, the consolidated statement of changes in equity and the related notes. The financial reporting framework thathas been applied in their preparation is applicable law and International Financial <strong>Report</strong>ing Standards (IFRSs) as adopted by theEuropean Union.respective responsibilities of directors and auditorsAs explained more fully in the statement of directors’ responsibilities set out on page 81, the directors are responsible for the preparationof the consolidated financial statements and for being satisfied that they give a true and fair view. Our responsibility is to audit and expressan opinion on the consolidated financial statements in accordance with applicable law and International Standards on Auditing (UK andIreland). Those standards require us to comply with the Auditing Practices Board’s Ethical Standards for Auditors.This report, including the opinions, has been prepared for and only for the Company’s members as a body in accordance with Chapter 3of Part 16 of the Companies Act 2006 and for no other purpose. We do not, in giving these opinions, accept or assume responsibility forany other purpose or to any other person to whom this report is shown or into whose hands it may come save where expressly agreed byour prior consent in writing.scope of the audit of the financial statementsAn audit involves obtaining evidence about the amounts and disclosures in the financial statements sufficient to give reasonable assurancethat the financial statements are free from material misstatement, whether caused by fraud or error. This includes an assessment of: whetherthe accounting policies are appropriate to the Group’s circumstances and have been consistently applied and adequately disclosed;the reasonableness of significant accounting estimates made by the directors; and the overall presentation of the financial statements.In addition, we read all the financial and non financial information in the <strong>Rexam</strong> annual report <strong>2011</strong> to identify material inconsistencieswith the audited financial statements. If we become aware of any apparent material misstatements or inconsistencies we consider theimplications for our report.opinion on financial statementsIn our opinion the consolidated financial statements:• give a true and fair view of the state of the Group’s affairs as at 31 December <strong>2011</strong> and of its profit and cash flows for the yearthen ended;• have been properly prepared in accordance with IFRSs as adopted by the European Union; and• have been prepared in accordance with the requirements of the Companies Act 2006 and Article 4 of the lAS Regulation.opinion on other matter prescribed by the Companies Act 2006In our opinion the information given in the directors’ report for the financial year for which the consolidated financial statements areprepared is consistent with the consolidated financial statements.matters on which we are required to report by exceptionWe have nothing to report in respect of the following:Under the Companies Act 2006 we are required to report to you if, in our opinion:• certain disclosures of directors’ remuneration specified by law are not made; or• we have not received all the information and explanations we require for our audit.Under the Listing Rules we are required to review:• the directors’ statement, set out on page 67, in relation to going concern;• the part of the Corporate Governance Statement relating to the Company’s compliance with the nine provisions of the UK CorporateGovernance Code specified for our review; and• certain elements of the report to shareholders by the board on directors’ remuneration.other matterWe have reported separately on the parent Company financial statements of <strong>Rexam</strong> <strong>PLC</strong> for the year ended 31 December <strong>2011</strong> and onthe information in the remuneration report that is described as having been audited.Robert Milburn (Senior Statutory Auditor)for and on behalf of PricewaterhouseCoopers LLPChartered Accountants and Statutory AuditorsLondon22 February 2012
87consolidated income statementFor the year ended 31 DecembernotesContinuing operationsSales 2 4,734 4,619Operating expenses 3 (4,227) (4,146)Underlying operating profit 2 549 513Exceptional items 6 (16) (8)Amortisation of certain acquired intangible assets (26) (32)Operating profit 507 473Share of post tax profits of associates and joint ventures 16 9 5Retirement benefit obligations net finance cost 27 (16) (15)Underlying interest expense 7 (99) (117)Fair value changes on financing derivatives 7 23 (12)Interest expense 7 (76) (129)Interest income 7 7 4Underlying profit before tax 450 390Exceptional items 6 (16) (8)Amortisation of certain acquired intangible assets (26) (32)Fair value changes on financing derivatives 7 23 (12)Profit before tax 431 338Tax on underlying profit 8 (135) (116)Tax on exceptional items 6 4 1Tax on amortisation of certain acquired intangible assets 9 10Tax on fair value changes on financing derivatives (6) 3Tax 8 (128) (102)Profit for the financial year from continuing operations 303 236Discontinued operationsProfit/(loss) for the financial year from discontinued operations 10 73 (112)Total profit for the financial year attributable to equity shareholders of <strong>Rexam</strong> <strong>PLC</strong> 376 124Underlying earnings per share (pence) 9Continuing operations 36.1 31.4Discontinued operations 0.9 1.4Total 37.0 32.8Basic earnings/(loss) per share (pence) 9Continuing operations 34.7 27.1Discontinued operations 8.4 (12.9)Total 43.1 14.2Diluted earnings/(loss) per share (pence) 9Continuing operations 34.5 27.0Discontinued operations 8.3 (12.9)Total 42.8 14.1For details of equity dividends paid and proposed see note 11 to the consolidated financial statements.The notes on pages 92 to 133 form part of these consolidated financial statements.<strong>2011</strong>£m2010£mfinancial statements governancesustainabilitybusiness reviewoverview
88 <strong>Rexam</strong> annual report <strong>2011</strong>consolidated statement of comprehensive incomeFor the year ended 31 DecembernotesProfit for the financial year 376 124Actuarial losses 18, 27 (104) (64)Tax on actuarial losses 8 30 24Premium paid on annuitisation of certain pension obligations 17, 18 (2) –Cost recognised in the income statement on annuitisation of certainpension obligations (net of tax) 30 3 –Exchange differences before recognition of net investment hedges 30 (30) (12)Net investment hedges recognised 30 14 22Exchange differences recognised in the income statement on disposal of Closures 30 (89) –Cash flow hedges recognised 30 (92) 40Cash flow hedges transferred to inventory 30 (16) (25)Cash flow hedges recognised in the income statement 30 – 2Tax on cash flow hedges 8, 30 28 (4)Disposal of non controlling interests (2) –Change in market value of available for sale financial assets 30 – 1Other comprehensive loss for the year (260) (16)Total comprehensive income for the year attributable to equity shareholders of <strong>Rexam</strong> <strong>PLC</strong> 116 108<strong>2011</strong>£m2010£m
89consolidated balance sheetAs at 31 DecembernotesAssetsNon current assetsGoodwill 12 1,834 1,848Other intangible assets 13 343 383Property, plant and equipment 14 1,590 1,571Investments in associates and joint ventures 16 70 61Pension assets 27 – 19Insurance backed assets 18 23 –Deferred tax assets 8 294 252Trade and other receivables 20 106 120Available for sale financial assets 17 1 27Derivative financial instruments 26 265 2564,526 4,537Current assetsInventories 19 517 415Insurance backed assets 18 2 –Trade and other receivables 20 626 648Available for sale financial assets 17 1 1Derivative financial instruments 26 38 70Cash and cash equivalents 21 412 1141,596 1,248Assets classified as held for sale 22 2 2821,598 1,530Total assets 6,124 6,067LiabilitiesCurrent liabilitiesBorrowings 24 (53) (81)Derivative financial instruments 26 (63) (10)Current tax (13) (20)Trade and other payables 23 (861) (768)Provisions 28 (36) (39)(1,026) (918)Liabilities classified as held for sale 22 – (50)(1,026) (968)Non current liabilitiesBorrowings 24 (1,785) (1,800)Derivative financial instruments 26 (181) (186)Retirement benefit obligations 27 (540) (482)Deferred tax liabilities 8 (63) (77)Non current tax (87) (85)Other payables 23 (53) (81)Provisions 28 (70) (63)(2,779) (2,774)Total liabilities (3,805) (3,742)Net assets 2,319 2,325EquityOrdinary share capital 564 564Share premium account 989 989Capital redemption reserve 351 351Retained earnings 211 32Other reserves 30 204 386Shareholders’ equity 2,319 2,322Non controlling interests – 3Total equity 2,319 2,325Approved by the board on 22 February 2012Graham Chipchase, chief executiveDavid Robbie, finance director<strong>2011</strong>£m2010£mfinancial statements governancesustainabilitybusiness reviewoverview
90 <strong>Rexam</strong> annual report <strong>2011</strong>consolidated cash flow statementFor the year ended 31 DecembernotesCash flows from operating activitiesCash generated from operations 32 650 685Interest paid (91) (110)Tax paid (86) (75)Net cash flows from operating activities 473 500<strong>2011</strong>£m2010£mCash flows from investing activitiesCapital expenditure (240) (206)Proceeds from sale of property, plant and equipment 1 8Disposal of Closures (net of cash and cash equivalents disposed) 10 205 –Loan from joint venture 4 5Interest received 7 4Other investing items (1) 6Net cash flows from investing activities (24) (183)Cash flows from financing activitiesProceeds from borrowings 7 21Repayment of borrowings (36) (159)Purchase of <strong>Rexam</strong> <strong>PLC</strong> shares by Employee Share Trust 31 (18) (6)Dividends paid to equity shareholders 11 (111) (105)Dividends paid to non controlling interests (1) –Other financing items 10 (13)Net cash flows from financing activities (149) (262)Net increase in cash and cash equivalents 300 55Cash and cash equivalents at the beginning of the year 99 62Exchange differences and other non cash adjustments 3 (18)Net increase in cash and cash equivalents 300 55Cash and cash equivalents at the end of the year 402 99Cash and cash equivalents comprise:Cash at bank and in hand 21 83 46Short term bank deposits 21 329 68Bank overdrafts 25 (10) (15)402 99
91consolidated statement of changes in equityOrdinarysharecapital£mSharepremiumaccount£mCapitalredemptionreserve£mRetainedearnings£mOtherreserves£mShareholders’equity£mNoncontrollinginterests£mAt 1 January <strong>2011</strong> 564 989 351 32 386 2,322 3 2,325Profit for the financial year – – – 376 – 376 – 376Actuarial losses – – – (104) – (104) – (104)Tax on actuarial losses – – – 30 – 30 – 30Premium paid on annuitisation of certain pensionrelated liabilities – – – (2) – (2) – (2)Cost recognised in the income statement onannuitisation of certain pension related liabilities(net of tax) – – – – 3 3 – 3Exchange differences before recognition of netinvestment hedges – – – – (30) (30) – (30)Net investment hedges recognised – – – – 14 14 – 14Exchange differences recognised in the incomestatement on the disposal of Closures – – – – (89) (89) – (89)Cash flow hedges recognised – – – – (92) (92) – (92)Cash flow hedges transferred to inventory – – – – (16) (16) – (16)Tax on cash flow hedges – – – – 28 28 – 28Disposal of non controlling interests – – – – – – (2) (2)Other comprehensive loss for the year – – – (76) (182) (258) (2) (260)Total comprehensive income/(loss) for the year – – – 300 (182) 118 (2) 116Share options: value of services provided – – – 8 – 8 – 8Purchase of <strong>Rexam</strong> <strong>PLC</strong> shares by Employee Share Trust – – – (18) – (18) – (18)Dividends paid – – – (111) – (111) (1) (112)At 31 December <strong>2011</strong> 564 989 351 211 204 2,319 – 2,319At 1 January 2010 563 989 351 55 362 2,320 2 2,322Profit for the financial year – – – 124 – 124 – 124Actuarial losses – – – (64) – (64) – (64)Tax on actuarial losses – – – 24 – 24 – 24Exchange differences before recognition of netinvestment hedges – – – – (12) (12) – (12)Net investment hedges recognised – – – – 22 22 – 22Cash flow hedges transferred to inventory – – – – (25) (25) – (25)Cash flow hedges transferred to the income statement – – – – 2 2 – 2Cash flow hedges recognised – – – – 40 40 – 40Tax on cash flow hedges – – – – (4) (4) – (4)Changes in market value of available for salefinancial assets – – – – 1 1 – 1Other comprehensive (loss)/income for the year – – – (40) 24 (16) – (16)Total comprehensive income for the year – – – 84 24 108 – 108Share options: value of services provided – – – 5 – 5 – 5Share option schemes: proceeds from shares issued 1 – – – – 1 – 1Purchase of <strong>Rexam</strong> <strong>PLC</strong> shares by Employee Share Trust – – – (6) – (6) – (6)Change in non controlling interests – – – (1) – (1) 1 –Dividends paid – – – (105) – (105) – (105)At 31 December 2010 564 989 351 32 386 2,322 3 2,325Totalequity£mfinancial statements governancesustainabilitybusiness reviewoverview
92 <strong>Rexam</strong> annual report <strong>2011</strong>notes to the consolidated financial statements1 principal accounting policiesThe consolidated financial statements have been prepared in accordance with International Financial <strong>Report</strong>ing Standards (IFRS)and International Financial <strong>Report</strong>ing Interpretations Committee (IFRIC) interpretations as adopted by the European Union (EU) and withthose parts of the Companies Act 2006 applicable to companies reporting under IFRS. The consolidated financial statements have beenprepared under the historical cost convention as modified by the revaluation of certain financial instruments, share based payments andretirement benefit obligations.The Group adopted IAS24 (Revised) ‘Related Party Disclosures’ from 1 January <strong>2011</strong>. This revision to an existing accounting standardclarifies the definition of a related party and the disclosure of transactions between the Group and its subsidiaries, associates andjoint ventures.The following accounting standards are not yet effective and have not been early adopted by the Group. The Group has yet to assess thefull impact of these accounting standards. Intended adoption dates are subject to endorsement by the EU.(i) IAS19 (Revised) ‘Employee Benefits’, issued in June <strong>2011</strong>, requires the immediate recognition of all changes to the funded position ofretirement benefit plans and changes the basis upon which income and expense is calculated for recognition in the income statementand the statement of comprehensive income. The Group intends to adopt IAS19 (Revised) for the accounting period beginning on1 January 2013.(ii) IFRS9 ‘Financial Instruments’, issued in November 2009, is the first step in the process to replace IAS39 ‘Financial Instruments:Recognition and Measurement’. The standard introduces new requirements for classifying and measuring financial assets.The Group intends to adopt IFRS9 no later than the accounting period beginning on 1 January 2015.There are no other IFRS or IFRIC interpretations that are not yet effective that are expected to have a material impact on the Group.key estimates and assumptionsThe preparation of consolidated financial statements in accordance with IFRS requires the use of estimates and assumptions that affect thereported amounts of assets and liabilities at the date of the consolidated financial statements and the reported amounts of revenues andexpenses during the reporting period. Although these estimates are based on management’s best knowledge of the amount, events oractions, actual results may ultimately differ from those estimates. The key estimates and assumptions used in these consolidated financialstatements are set out below.goodwill impairment testingGoodwill is tested at least annually for impairment in accordance with the accounting policy for goodwill. The recoverable amounts ofcash generating units relating to continuing operations are determined based on value in use calculations. These calculations require theuse of estimates which include cash flow projections for each cash generating unit and discount rates based on the Group’s weightedaverage cost of capital, adjusted for specific risks associated with particular cash generating units. For details of impairment testing seenote 12 to the consolidated financial statements. The accounting policies for goodwill and impairment testing are set out below.retirement benefitsThe consolidated financial statements include costs in relation to, and provision for, retirement benefit obligations. There are two principalfunded defined benefit pension plans, in the UK and US, and an unfunded retiree medical plan in the US. The costs and the present valueof any related pension assets and liabilities depend on factors such as life expectancy of the members, the salary progression of currentemployees, the returns that plan assets generate and the discount rate used to calculate the present value of the liabilities. The Groupuses estimates based on previous experience and external actuarial advice in determining these future cash flows and in determining thediscount rate. If the discount rates were to fall by 0.5%, the net liabilities of the plans at 31 December <strong>2011</strong> would rise by approximately£105m (2010: £110m). If equity values were to fall by 10%, then the plan assets at 31 December <strong>2011</strong> would fall by approximately £90m(2010: £100m). The accounting policy for retirement benefit obligations is set out below and details of the assumptions used for the twoprincipal pension plans and the retiree medical plan are set out in note 27 to the consolidated financial statements.
931 principal accounting policies continuedincome taxesJudgement is required in determining the provision for income taxes. There are many transactions and calculations whose ultimatetax treatment is uncertain. The Group recognises liabilities for anticipated tax issues based on estimates of whether additional taxes arelikely to be due. The Group recognises deferred tax assets and liabilities based on estimates of future taxable income and recoverability.Where a change in circumstance occurs, or the final tax outcome of these matters is different from the amounts that were initially recorded,such differences will impact the income tax and deferred tax balances in the year in which that change or outcome is known. Theaccounting policy for income taxes is set out below.basis of consolidationThe consolidated financial statements comprise <strong>Rexam</strong> <strong>PLC</strong> and all its subsidiaries, together with the Group’s share of the results of itsassociates and joint ventures. The financial statements of subsidiaries, associates and joint ventures are prepared at the same reportingdate using consistent accounting policies. Intercompany balances and transactions, including any unrealised profits arising fromintercompany transactions, are eliminated in full.Subsidiaries are entities where the Group has the power to govern the financial and operating policies, generally accompanied by a shareof more than 50% of the voting rights. Subsidiaries are consolidated from the date on which control is transferred to the Group and areincluded until the date on which the Group ceases to control them. Associates are entities over which the Group has significant influencebut not control, generally accompanied by a share of between 20% and 50% of the voting rights. Joint ventures are entities over which theGroup has joint control, whereby the strategic, financial and operating decisions relating to the venture require the unanimous consent ofthe parties sharing control and are generally accompanied by a 50% share of voting rights. Investments in associates and joint venturesare accounted for using the equity method. If the Group’s share of losses in an associate or joint venture equals or exceeds its investmentin the associate or joint venture, the Group does not recognise further losses unless it has incurred obligations or made payments on behalfof the associate or joint venture.All acquisitions are accounted for by applying the purchase method. The cost of an acquisition is measured as the aggregate of thefair values, at the acquisition date, of the assets given, liabilities incurred or assumed, and equity instruments issued by the Group.The identifiable assets, liabilities and contingent liabilities of the acquiree are measured initially at fair value at the acquisition date,irrespective of the extent of any non controlling interests. The excess of the cost of the acquisition over the Group’s interest in the net fairvalue of the identifiable assets, liabilities and contingent liabilities is recognised as goodwill.foreign currenciesThe financial statements for each of the Group’s subsidiaries, associates and joint ventures are prepared using their functional currency.The functional currency is the currency of the primary economic environment in which an entity operates. Foreign currency transactions aretranslated into the functional currency using exchange rates prevailing at the dates of the transactions. Exchange differences resulting fromthe settlement of such transactions and from the translation at exchange rates ruling at the balance sheet date of monetary assets andliabilities denominated in currencies other than the functional currency are recognised directly in the consolidated income statement.Exceptions to this are where the monetary items form part of the net investment in a foreign operation or designated as hedges of a netinvestment, or designated as cash flow hedges. Such exchange differences are initially recognised in equity.The presentation currency of the Group is sterling. The balance sheets of foreign operations are translated into sterling using the exchangerate at the balance sheet date and the income statements are translated into sterling using the average exchange rate for the year. Wherethis average is not a reasonable approximation of the cumulative effect of the rate prevailing on the transaction date, the exchange rate onthe transaction date is used. Exchange differences on translation into sterling arising since 1 January 2004 are recognised as a separatecomponent of equity. On disposal of a subsidiary, any cumulative exchange differences held in equity are transferred to the consolidatedincome statement.On the repayment of a quasi equity loan, the proportionate share of the cumulative amount of the exchange differences on the loanrecognised in other comprehensive income is not reclassified to the consolidated income statement unless the Group loses control overthe entity to which the quasi equity loan related.The principal exchange rates against sterling used in these consolidated financial statements are as follows:Euro 1.15 1.19 1.17 1.17US dollar 1.60 1.54 1.55 1.54Average<strong>2011</strong>Closing<strong>2011</strong>Average2010Closing2010financial statements governancesustainabilitybusiness reviewoverview
94<strong>Rexam</strong> annual report <strong>2011</strong>notes to the consolidated financial statements1 principal accounting policies continuedrevenue recognition and other incomeRevenue from the sale of goods is measured at the fair value of the consideration, net of rebates and trade discounts. Revenue from thesale of goods is recognised when the Group has transferred the significant risks and rewards of ownership of the goods to the buyer,when the amount of revenue can be measured reliably and when it is probable that the economic benefits associated with the transactionwill flow to the Group, typically on delivery of goods. The Group makes certain advance payments to customers in relation to contractswhich are charged against sales in the consolidated income statement over their useful economic lives, typically being the contract term.Other income includes licence income and project management fees for the construction of manufacturing lines and equipmenton behalf of customers.exceptional itemsItems which are exceptional, being material in terms of size and/or nature, are presented separately from underlying businessperformance in the consolidated income statement. The separate reporting of exceptional items helps provide an indication of the Group’sunderlying business performance. The principal events which may give rise to exceptional items include the restructuring and integrationof businesses, significant changes to retirement benefit obligations, gains or losses on the disposal of businesses, goodwill impairments,major asset impairments and disposals and significant litigation and tax claims.retirement benefit obligationsThe Group operates defined benefit pension plans and defined contribution pension plans.A defined benefit pension plan is one that specifies the amount of pension benefit that an employee will receive on retirement. The Groupoperates both funded defined benefit pension plans, where actuarially determined payments are made to trustee administered funds, andunfunded defined benefit pension plans, where no such payments are made. The asset or liability recognised in the consolidated balancesheet in respect of defined benefit pension plans is the present value of the defined benefit obligation less, for funded schemes, the fairvalue of plan assets at the balance sheet date. The defined benefit obligation is calculated, at least triennially, by independent actuariesusing the projected unit credit method and is determined by discounting the estimated future cash outflows using interest rates of highquality corporate bonds that are denominated in the currency in which the benefits will be paid, and that have terms to maturityapproximating to the terms of the related pension liability. The current service cost and gains and losses on settlements and curtailmentsare included in operating expenses in the consolidated income statement. Past service costs are similarly included where the benefitshave vested, otherwise they are amortised on a straight line basis over the vesting period. The pension element of the net finance cost inthe consolidated income statement comprises the expected return on assets of funded defined benefit pension plans, less administrationexpenses of pension plans, and the interest on pension plan liabilities. Differences between the actual and expected return on assets,experience gains and losses and changes in actuarial assumptions are included in the consolidated statement of comprehensive income.A defined contribution plan is one under which fixed contributions are paid to a third party. The Group has no further payment obligationsonce these contributions have been paid. The contributions are recognised in the consolidated income statement when they are due.Prepaid contributions are recognised in the consolidated balance sheet as an asset to the extent that a cash refund or a reduction in futurepayments is likely.The Group also provides post retirement healthcare benefits (retiree medical) to certain of its current and former employees. The entitlementto these benefits is usually conditional on an employee remaining in service up to retirement age and the completion of a minimum serviceperiod. The consolidated income statement and consolidated balance sheet accounting treatment with respect to retiree medical is similarto that for defined benefit pension plans. These obligations are valued by independent actuaries, usually on an annual basis.share based paymentThe Group operates equity and cash settled share option schemes. For equity settled share options, the services received from employeesare measured by reference to the fair value of the share options. The fair value is calculated at grant date and recognised in theconsolidated income statement, together with a corresponding increase in equity, on a straight line basis over the vesting period, basedon an estimate of the number of options that will eventually vest. Vesting conditions, which comprise service conditions and performanceconditions, are not taken into account when estimating the fair value. All non vesting conditions are included in the fair value. For cashsettled share options, the services received from employees are measured at the fair value of the liability and recognised in theconsolidated income statement on a straight line basis over the vesting period. The fair value of the liability is measured at each balancesheet date and at the date of settlement with changes in fair value recognised in the consolidated income statement. IFRS2 ‘Share basedPayment’ has been applied to equity settled share options granted after 7 November 2002 and to all cash settled share options.The <strong>Rexam</strong> Employee Share Trust holds ordinary shares in <strong>Rexam</strong> <strong>PLC</strong> which are presented in the consolidated balance sheetas a deduction from equity.
951 principal accounting policies continuedinterestInterest on cash and cash equivalents and borrowings held at amortised cost is recognised in the consolidated income statement usingthe effective interest method. Interest includes exchange differences arising on cash and cash equivalents and borrowings, where suchexchange differences are recognised in the consolidated income statement. Interest includes all fair value gains and losses on derivativefinancial instruments, and corresponding adjustments to hedged items under designated fair value hedging relationships, wherethey relate to financing activities and are recognised in the consolidated income statement. Interest relating to payments made overan extended period of development of large capital projects is added to the capital cost and amortised over the expected livesof those projects.Non hedge accounted financing derivative financial instruments fair value changes and hedge ineffectiveness on financing derivativefinancial instruments are separately disclosed, within interest, on the face of the consolidated income statement.segment reportingOperating segments are reported in a manner consistent with internal reporting provided to the chief operating decision maker. The chiefoperating decision maker has been identified as the executive leadership team, which comprises the executive directors and certain seniorexecutives. The executive leadership team is responsible for assessing the performance of the operating segments for the purpose ofmaking decisions about resources to be allocated. Operating segments are combined for external reporting purposes where they havesimilar economic characteristics, and the nature of products and production processes, the type and class of customers and the methodsto distribute products are all similar.goodwillGoodwill represents the excess of the cost of an acquisition over the Group’s interest in the fair value of the identifiable assets andliabilities of the acquiree at the date of acquisition. Goodwill is tested for impairment at 31 December each year and at any time wherethere is any indication that goodwill may be impaired. Goodwill is carried at cost less accumulated impairment losses. At the date ofacquisition, goodwill is allocated to cash generating units for the purpose of impairment testing. Goodwill arising on acquisitions on orbefore 31 December 1997 has been deducted from equity. Gains and losses on the disposal of a business include the carrying amountof goodwill relating to the business sold except for any goodwill deducted from equity. Goodwill arising on the acquisition of subsidiariesis presented in goodwill and goodwill arising on the acquisition of associates and joint ventures is presented in investments in associatesand joint ventures. Internally generated goodwill is not recognised as an asset.other intangible assetsOther intangible assets are carried at cost less accumulated amortisation and accumulated impairment losses. Amortisation begins whenan asset is available for use and is calculated on a straight line basis to allocate the cost of the asset over its estimated useful life as follows:Computer software acquired2 to 3 yearsComputer software developedUp to 7 yearsCustomer contracts and relationships acquired5 to 20 yearsTechnology and patents acquired5 to 20 yearsOther development projectsUp to 5 yearsThe cost of intangible assets acquired in an acquisition is the fair value at acquisition date. The cost of separately acquired intangibleassets, including computer software, comprises the purchase price and any directly attributable costs of preparing the asset for use.Computer software development costs that are directly associated with the implementation of major business systems are capitalised asintangible assets. Expenditure on research is recognised as an expense in the consolidated income statement as incurred. Expenditureincurred on other development projects is capitalised as an intangible asset if it is probable that the expenditure will generate futureeconomic benefits and can be measured reliably.The amortisation of certain acquired intangible assets, comprising acquired customer contracts and relationships and technology andpatents, is separately disclosed within operating profit on the face of the consolidated income statement.financial statements governancesustainabilitybusiness reviewoverview
96<strong>Rexam</strong> annual report <strong>2011</strong>notes to the consolidated financial statements1 principal accounting policies continuedproperty, plant and equipmentProperty, plant and equipment is carried at cost less accumulated depreciation and accumulated impairment losses. Cost comprisespurchase price and directly attributable costs. Freehold land and assets under construction are not depreciated. For all other property,plant and equipment, depreciation is calculated on a straight line basis to allocate cost, less residual value of the assets, over theirestimated useful lives as follows:Freehold buildingsLeasehold buildingsManufacturing machineryComputer hardwareFixtures, fittings and vehiclesResidual values and useful lives are reviewed at least at each financial year end.Up to 50 yearsShorter of 50 years or lease term7 to 17 yearsUp to 8 years4 to 10 yearsimpairment of assetsThis policy applies to all assets except inventories, deferred tax assets, financial assets and non current assets classified as held for sale.At each balance sheet date, the Group assesses whether there is any indication that an asset may be impaired. Where an indicator ofimpairment exists, the Group makes an estimate of recoverable amount. Where the carrying amount of an asset exceeds its recoverableamount the asset is written down to its recoverable amount. Recoverable amount is the higher of fair value less costs to sell and valuein use and is determined for an individual asset (see also accounting policy for assets and liabilities classified as held for sale anddiscontinued operations below). If the asset does not generate cash inflows that are largely independent of those from other assets orgroups of assets, the recoverable amount of the cash generating unit to which the asset belongs is determined. Discount rates reflecting theasset specific risks and the time value of money are used for the value in use calculation. When an asset is written down to its recoverableamount the impairment loss is recognised in the consolidated income statement in the year in which it is incurred. Impairment lossesincurred in a cash generating unit or group of cash generating units are applied against the carrying amount of any goodwill allocatedto the units. Where no goodwill exists, the impairment losses reduce the other non current assets of the cash generating units. Shouldcircumstances change which result in a reversal of a previous impairment, the value of the asset is increased and the reversal is recognisedin the consolidated income statement in the year in which it occurs. The increase in the carrying amount of the asset is limited to theamount which would have been recorded had no impairment been recognised in prior years. Impairment losses applied to goodwillare not reversed.inventoriesInventories are measured at the lower of cost and net realisable value. Cost is determined on a first in first out or a weighted average costbasis. Cost comprises directly attributable purchase and conversion costs and an allocation of production overheads based on normaloperating capacity. Net realisable value is the estimated selling price less estimated costs to completion and selling costs.cash and cash equivalentsCash and cash equivalents for the purposes of the consolidated cash flow statement comprise cash at bank and in hand, bank and moneymarket deposits and other short term highly liquid investments generally with original maturities of three months or less and bankoverdrafts. Bank overdrafts are presented in borrowings within current liabilities in the consolidated balance sheet.assets and liabilities classified as held for sale and discontinued operationsAssets and liabilities are classified as held for sale when their carrying amount is to be recovered principally through a sale transactionand the sale is highly probable. Assets and liabilities classified as held for sale are stated at the lower of carrying amount and fair valueless costs to sell. They are not depreciated or amortised. Operations are classified as discontinued when they are either disposed orare part of a single coordinated plan to dispose, and represent a major line of business or geographical area of operation.grantsGrants received in respect of property, plant and equipment are capitalised and released to the consolidated income statement in equalinstalments over the estimated useful lives of the related assets.leasesLeases are classified as finance leases where substantially all the risks and rewards of ownership are transferred to the Group. Financeleases are capitalised at the inception of the lease at the lower of the fair value of the leased asset and the present value of the minimumlease payments. Lease payments are apportioned between the liability and finance charge to produce a constant rate of interest on thefinance lease balance outstanding. Assets capitalised under finance leases are depreciated over the shorter of the useful life of theasset and the lease term. Leases other than finance leases are classified as operating leases. Payments made under operating leasesare recognised as an expense in the consolidated income statement on a straight line basis over the lease term. Any incentives to enterinto operating leases are recognised as a reduction of rental expense over the lease term on a straight line basis.
971 principal accounting policies continuedincome taxesThe tax expense represents the sum of current tax, non current tax and deferred tax.Current tax and non current tax are based on taxable profit for the year. Taxable profit differs from net profit as reported in theconsolidated income statement because it excludes items of income or expense that are taxable or deductible in other years andit further excludes items that are never taxable or deductible.Deferred tax is recognised in full, using the liability method, on temporary differences arising between the tax base of assets and liabilitiesand their carrying amounts in the consolidated financial statements. Deferred tax arising from initial recognition of an asset or liabilityin a transaction, other than an acquisition, that at the time of the transaction affects neither accounting nor taxable profit or loss, is notrecognised. Deferred tax is measured using tax rates that have been enacted or substantively enacted at the balance sheet date and areexpected to apply when the asset is realised or the liability is settled. Deferred tax assets are recognised to the extent that it is probablethat future taxable profit will be available against which the temporary differences can be utilised. Deferred tax is provided on temporarydifferences arising on investments in subsidiaries, associates and joint ventures, except where the Group is able to control the timingof the reversal of the temporary difference and it is probable that the temporary difference will not reverse in the foreseeable future.Tax is recognised in the consolidated income statement, unless the tax relates to items recognised directly in equity, in which case thetax is recognised directly in equity through the consolidated statement of comprehensive income.provisionsProvisions are recognised when a present obligation exists in respect of a past event and where the amount can be reliably estimated.Provisions for restructuring are recognised for direct expenditure on business reorganisations where plans are sufficiently detailed andwell advanced, and where appropriate communication to those affected has been undertaken on or before the balance sheet date.Provisions are discounted where the time value of money is considered to be material.dividendsFinal equity dividends to the shareholders of <strong>Rexam</strong> <strong>PLC</strong> are recognised in the period that they are approved by the shareholders.Interim equity dividends are recognised in the period that they are paid.financial instrumentsFinancial instruments that are measured at fair value are disclosed in the consolidated financial statements in accordance with thefollowing fair value measurement hierarchy:(i) Quoted prices (unadjusted) in active markets for identical assets or liabilities (level 1).(ii) Inputs other than quoted prices included within level 1 that are observable for the asset or liability, either directly (that is, as prices)or indirectly (that is, derived from prices) (level 2).(iii) Inputs for the asset or liability that are not based on observable market data (that is, unobservable inputs) (level 3).The fair value of financial instruments that are not traded in an active market is determined by using valuation techniques. These valuationtechniques maximise the use of observable market data where it is available and rely as little as possible on entity specific estimates.If all significant inputs required to fair value an instrument are observable, the instrument is included in level 2.Derivative financial instruments are measured at fair value. Derivative financial instruments utilised by the Group include interest rateswaps, cross currency swaps, forward foreign exchange contracts and forward aluminium, resin and energy commodity contracts.Certain derivative financial instruments are designated as hedges in line with the Group’s risk management policies. Hedges are classifiedas follows:(i) Fair value hedges where they hedge the exposure to changes in the fair value of a recognised asset or liability.(ii) Cash flow hedges where they hedge exposure to variability in cash flows that is attributable to a particular risk associatedwith a recognised asset or liability or a forecasted transaction.(iii) Net investment hedges where they hedge exposure to changes in the value of the Group’s interests in the net assets offoreign operations.For fair value hedges, any gain or loss from remeasuring the hedging instrument at fair value is recognised in the consolidated incomestatement. Any gain or loss on the hedged item attributable to the hedged risk is adjusted against the carrying amount of the hedged itemand similarly recognised in the consolidated income statement.For cash flow hedges and net investment hedges, the portion of the gain or loss on the hedging instrument that is determined to be aneffective hedge is recognised in equity, with any ineffective portion recognised in the consolidated income statement. When hedgedcash flows result in the recognition of a non financial asset or liability, the associated gains or losses previously recognised in equityare included in the initial measurement of the asset or liability. For all other cash flow hedges, the gains or losses that are recognised inequity are transferred to the consolidated income statement in the same period in which the hedged cash flows affect the consolidatedincome statement.Any gains or losses arising from changes in fair value of derivative financial instruments not designated as hedges are recognisedimmediately in the consolidated income statement.financial statements governancesustainabilitybusiness reviewoverview
98<strong>Rexam</strong> annual report <strong>2011</strong>notes to the consolidated financial statements1 principal accounting policies continuedGains and losses on derivative financial instruments related to operating activities are included in operating profit when recognised in theconsolidated income statement. Gains and losses on derivative financial instruments related to financing activities are included in interestwhen recognised in the consolidated income statement.Borrowings are measured at amortised cost except where they are hedged by an effective fair value hedge, in which case the carryingvalue is adjusted to reflect the fair value movements associated with the hedged risk. Where borrowings are used to hedge the Group’sinterests in the net assets of foreign operations, the portion of the exchange gain or loss on the borrowings that is determined to be aneffective hedge is recognised in equity.Upfront fees paid on the establishment of loan facilities are initially capitalised as transaction costs of the loan and amortised in interestover the expected term of the loan. Ongoing commitment fees are expensed in interest as incurred.Available for sale financial assets are measured at fair value. Unrealised gains and losses are recognised in equity except for impairmentlosses, interest and dividends arising from those assets which are recognised in the consolidated income statement.Trade and other receivables are initially measured at fair value and subsequently measured at amortised cost less any provision forimpairment. They are discounted when the time value of money is considered material. Trade and other payables are measured at cost.2 segment analysisFor internal reporting, <strong>Rexam</strong> is organised into three operating segments for Beverage Cans based on the geographical locations ofEurope and Asia, North America and South America, and into one operating segment for Plastic Packaging. For external reporting,the three operating segments for Beverage Cans are combined into one reportable segment.Beverage Cans comprise aluminium and steel cans for a wide variety of beverages including carbonated soft drinks, energy drinks andbeer. Plastic Packaging comprises rigid plastic products for customers in the healthcare and personal care markets.The Closures division has been reported as discontinued operations in the segment information set out below.(i) segment information <strong>2011</strong>Sales£mUnderlyingoperatingprofit£mUnderlyingreturn onsales%Underlyingreturn onnet assets%Exceptionaland otheritems 1£mContinuing operationsBeverage Cans 3,786 447 11.8 31.6 (7) 440Plastic Packaging 948 102 10.8 23.3 (35) 67Total reportable segments 4,734 549 11.6 29.7 (42) 507Share of post tax profits of associates and joint ventures 9Retirement benefit obligations net finance cost (16)Net interest expense (69)Profit before tax 431Tax (128)Profit for the financial year from continuing operations 303Discontinued operationsProfit for the financial year from discontinued operations (note 10) 73Total profit for the financial year 376Profit£mAssets£mLiabilities£mCapitalexpenditure£mDepreciation andamortisation£mImpairment:intangibleassets£mImpairment:property, plantand equipment 2£mContinuing operationsBeverage Cans 3,488 (771) 174 134 – 4Plastic Packaging 1,532 (249) 65 83 – 2Total reportable segments 5,020 (1,020) 239 217 – 6Associates and joint ventures 70 – – – – –Unallocated assets and liabilities 1,034 (2,785) – – – –Total continuing operations 6,124 (3,805) 239 217 – 6Discontinued operations (note 10) – – 10 – 20 146,124 (3,805) 249 217 20 201 Other items comprise the amortisation of certain acquired intangible assets.2 Net of impairment reversals.
992 segment analysis continuedShare of post tax profits of associates and joint ventures are wholly attributable to Beverage Cans. Segment assets are disclosed afterdeducting inter segment assets of £3m for Beverage Cans and £1m for Plastic Packaging. Segment liabilities are disclosed after deductinginter segment liabilities of £3m for Beverage Cans and £1m for Plastic Packaging. The assets of associates and joint ventures are whollyattributable to Beverage Cans.Underlying operating profit comprises operating profit from continuing operations before exceptional items and the amortisation of certainacquired intangible assets. Underlying operating profit from continuing operations is included as it is felt that adjusting operating profitfor exceptional items and the amortisation of certain acquired intangible assets provides a better indication of the Group’s performance.Underlying return on sales comprises underlying operating profit from continuing operations divided by sales from continuing operations.Underlying return on net assets is based on underlying operating profit plus share of associates and joint ventures after tax divided by theaverage of opening and closing net assets after adding back retirement benefit obligations (net of tax) and net borrowings and excludinggoodwill and certain acquired intangible assets.Non specific central costs are allocated on the basis of underlying operating profit.Unallocated assets comprise derivative financial instrument assets, deferred tax assets, pension assets, insurance backed assets and cashand cash equivalents which are used as part of the Group’s financing offset arrangements. Unallocated liabilities comprise borrowings,derivative financial instrument liabilities, current and non current tax, deferred tax liabilities and retirement benefit obligations.(ii) segment information 2010Sales£mUnderlyingoperatingprofit£mUnderlyingreturn onsales%Underlyingreturn onnet assets%Exceptionaland otheritems 1£mContinuing operationsBeverage Cans 3,677 394 10.7 27.6 (11) 383Plastic Packaging 942 119 12.6 29.1 (29) 90Total reportable segments 4,619 513 11.1 27.9 (40) 473Share of post tax profits of associates and joint ventures 5Retirement benefit obligations net finance cost (15)Net interest expense (125)Profit before tax 338Tax (102)Profit for the financial year from continuing operations 236Discontinued operationsLoss for the financial year from discontinued operations (note 10) (112)Total profit for the financial year 124Assets£mLiabilities£mCapitalexpenditure£mDepreciation andamortisation£mImpairment:goodwill£mImpairment:intangibleassets£mProfit/(loss)£mImpairment:property, plantand equipment 2£mContinuing operationsBeverage Cans 3,449 (683) 141 142 – – 6Plastic Packaging 1,566 (268) 51 87 – – (3)Total reportable segments 5,015 (951) 192 229 – – 3Associates and joint ventures 61 – – – – – –Unallocated assets and liabilities 711 (2,741) – – – – –Total continuing operations 5,787 (3,692) 192 229 – – 3Discontinued operations (notes 10, 22) 280 (50) 19 36 59 65 556,067 (3,742) 211 265 59 65 581 Other items comprise the amortisation of certain acquired intangible assets.2 Net of impairment reversals.financial statements governancesustainabilitybusiness reviewoverviewShare of post tax profits of associates and joint ventures from continuing operations are wholly attributable to Beverage Cans. Segmentassets are disclosed after deducting inter segment assets of £2m for Beverage Cans and £1m for Plastic Packaging. Segment liabilities aredisclosed after deducting inter segment liabilities of £1m for Beverage Cans and £2m for Plastic Packaging. The assets of associates andjoint ventures are wholly attributable to Beverage Cans.
100<strong>Rexam</strong> annual report <strong>2011</strong>notes to the consolidated financial statements2 segment analysis continued(iii) geographic and other information<strong>2011</strong>Sales£m<strong>2011</strong>Non currentassets£m2010Sales£m2010Non currentassets£mContinuing operationsUS 1,576 1,398 1,586 1,470Brazil 747 482 700 432Austria 327 86 288 91Russia 281 191 267 208Spain 226 93 218 102UK 203 210 200 200France 188 349 178 339Germany 136 288 131 327Other countries 1,050 847 1,051 8414,734 3,944 4,619 4,010Unallocated non current assets – 582 – 527Total continuing operations 4,734 4,526 4,619 4,537Discontinued operations 205 – 343 –4,939 4,526 4,962 4,537Sales are stated by external customer location. One customer, principally in Beverage Cans, contributed sales of £1,171m(2010: £1,394m), and another Beverage Cans customer contributed sales of £507m (2010: £610m).Unallocated non current assets comprise derivative financial instrument assets, pension assets, insurance backed assets and deferredtax assets.3 operating expenses<strong>2011</strong>Continuingoperationsunderlying£m<strong>2011</strong>Continuingoperationsexceptionaland otheritems 1£m<strong>2011</strong>Continuingoperationstotal£m<strong>2011</strong>Discontinuedoperationstotal£m2010Continuingoperationsunderlying£m2010Continuingoperationsexceptionaland otheritems 1£m2010Continuingoperationstotal£m2010Discontinuedoperationstotal£mRaw materials used (2,520) – (2,520) (107) (2,371) – (2,371) (169)Changes in inventories of WIP and finished goods (7) – (7) 1 (10) – (10) (5)Employee benefit expense (731) (8) (739) (43) (730) – (730) (80)Depreciation of property, plant and equipment (179) – (179) – (183) – (183) (21)Amortisation of intangible assets (12) (26) (38) – (14) (32) (46) (15)Impairment of goodwill – – – – – – – (59)Impairment of intangible assets – – – (20) – – – (65)Impairment of property, plant and equipment (5) (2) (7) (14) (6) – (6) (55)Reversal of impairment of property,plant and equipment 1 – 1 – – 3 3 –Freight costs (222) – (222) (6) (224) – (224) (10)Operating lease rental expense (33) – (33) (3) (33) – (33) (6)Operating lease rental income 2 – 2 – 2 – 2 –Other operating expenses (500) (6) (506) (39) (552) (11) (563) (37)Other operating income 21 – 21 – 15 – 15 2(4,185) (42) (4,227) (231) (4,106) (40) (4,146) (520)1 Other items comprise the amortisation of certain acquired intangible assets.Operating expenses include research and development expenditure of £17m from continuing operations and £2m from discontinuedoperations (2010: £16m and £3m); and fair value gains on forward foreign exchange contracts not hedge accounted of £2m fromcontinuing operations (2010: £3m).
1014 employee costs and numbers(i) employee benefit expenseContinuing operationsWages and salaries (611) (615)Social security (85) (80)Share based payment (19) (11)Retirement benefit obligations (24) (24)Total continuing operations (739) (730)Discontinued operations (43) (80)(782) (810)(ii) key management compensation (including directors of <strong>Rexam</strong> <strong>PLC</strong>)Salaries and short term employee benefits (10) (10)Post employment benefits (1) (1)Share based payment (4) (2)(15) (13)Key management comprises all directors of <strong>Rexam</strong> <strong>PLC</strong> and band 1 executives. For details of directors’ remuneration see theremuneration report.A member of key management has an outstanding loan of £0.5m at 31 December <strong>2011</strong> (2010: £0.5m). The remaining term of the loanis 13 years (2010: 14 years) and is on a secured arms length basis. Interest charged on the loan during the year was £26,000(2010: £26,000).(iii) average number of employees<strong>2011</strong>£m<strong>2011</strong>£m<strong>2011</strong>Number2010£m2010£m2010NumberContinuing operationsBeverage Cans 7,600 7,500Plastic Packaging 11,400 12,100Total continuing operations 19,000 19,600Discontinued operations 1,200 2,10020,200 21,700<strong>2011</strong>Number2010NumberContinuing operationsUS 4,500 4,600China 4,300 4,900France 2,300 2,300Brazil 2,000 1,800Germany 1,100 1,100Russia 700 700UK 600 600Other countries 3,500 3,600Total continuing operations 19,000 19,600Discontinued operations 1,200 2,10020,200 21,700financial statements governancesustainabilitybusiness reviewoverview
102<strong>Rexam</strong> annual report <strong>2011</strong>notes to the consolidated financial statements5 auditors’ remunerationFees payable to PricewaterhouseCoopers LLP for the audit of the consolidated financial statements 0.9 0.8Statutory audit fees payable to associate members of PricewaterhouseCoopers LLP 2.5 2.5Total audit fees 3.4 3.3Audit related assurance services 0.2 0.2Other assurance services 2.2 –Tax advisory services 0.3 0.4Tax compliance services – 0.1All other non audit services 0.5 0.6<strong>2011</strong>£m2010£m6.6 4.6Included in total audit fees are amounts payable to associate members of PricewaterhouseCoopers LLP of £0.1m in relation to discontinuedoperations (2010: £0.2m). Other assurance services comprise assurance reporting on historic financial information required for businessdisposals.6 exceptional items – continuing operationsRestructuring (14) (11)Impairment of property, plant and equipment (net of reversals) (2) 3Exceptional items before tax (16) (8)Tax on exceptional items 4 1Total exceptional items after tax (12) (7)Exceptional items before tax include £9m (2010: £6m) for restructuring costs and £2m for impairment of property, plant and equipment(2010: £3m reversal of impairment) in Plastic Packaging in respect of previously announced plant closures and restructuring of some of theremaining continuing businesses following the disposal of the Closures division. They also include £5m (2010: £5m) of restructuring costsin Beverage Cans in respect of previously announced plant closures.7 interestInterest expenseBank overdrafts (9) (8)Bank loans (8) (26)US public bond (24) (25)US private placement (9) (9)Subordinated bond (45) (41)Medium term notes (25) (31)Interest on financing derivatives 24 21Foreign exchange (losses)/gains (3) 2Underlying interest expense (99) (117)Fair value gains/(losses) on financing derivatives 23 (12)(76) (129)Interest incomeCash and cash equivalents 7 4Bank loans in 2010 included £10m of capitalised facility fees written off on the cancellation of related bank facilities.<strong>2011</strong>£m<strong>2011</strong>£m2010£m2010£m
1037 interest continuedAn analysis of fair value gains/(losses) on financing derivatives is set out below.Fair value hedgesInterest rate swaps (3) (1)Cross currency swaps 30 11Fair value adjustment to borrowings (18) (5)9 5Not hedge accountedInterest rate swaps 5 (7)Cross currency swaps 9 (10)14 (17)<strong>2011</strong>£m2010£moverviewFair value gains/(losses) on financing derivatives 23 (12)The net gain on fair value hedges of £9m (2010: £5m) represents the total hedge ineffectiveness for the year.8 tax(i) tax included in the consolidated income statement<strong>2011</strong>Underlyingprofit£m<strong>2011</strong>Exceptionaland otheritems 1£m<strong>2011</strong>Total£m2010Underlyingprofit£m2010Exceptionaland otheritems 1£mContinuing operationsCurrent and non current tax (82) (5) (87) (82) 6 (76)Adjustment in respect of prior years 2 – 2 7 – 7Current and non current tax (80) (5) (85) (75) 6 (69)Origination and reversal of temporary differences (55) 12 (43) (38) 8 (30)Adjustment in respect of prior years – – – (3) – (3)Deferred tax (55) 12 (43) (41) 8 (33)Total continuing operations (135) 7 (128) (116) 14 (102)Discontinued operations (5) 39 34 (9) 74 65(140) 46 (94) (125) 88 (37)1 Other items comprise the amortisation of certain acquired intangible assets and fair value changes on financing derivatives.(ii) tax credited/(charged) in equityActuarial losses 30 24Cash flow hedges 28 (4)Annuitisation of certain pension obligations (1) –Tax included in equity 57 20<strong>2011</strong>£m2010Total£m2010£mfinancial statements governancesustainabilitybusiness review
104<strong>Rexam</strong> annual report <strong>2011</strong>notes to the consolidated financial statements8 tax continued(iii) tax reconciliationA reconciliation of the tax charge applicable to the Group’s profit/(loss) before tax on continuing operations at the UK statutory rate of26.5% (2010: 28%) with the tax charge on continuing operations based on the Group’s effective rate is set out below.<strong>2011</strong>Underlyingprofit/tax£m<strong>2011</strong>Exceptionaland otheritems 1£m<strong>2011</strong>Total£m2010Underlyingprofit/tax£m2010Exceptionaland otheritems 1£m2010Total£mProfit/(loss) before tax on continuing operations 450 (19) 431 390 (52) 338Tax on continuing operations at the UK statutory rate (119) 5 (114) (109) 14 (95)Non deductible and non taxable items (2) (1) (3) 6 (2) 4(Higher)/lower domestic tax rates on overseas earnings (16) 3 (13) (17) 2 (15)Tax overprovided in prior years 2 – 2 4 – 4Tax in the consolidated income statement (135) 7 (128) (116) 14 (102)Effective rate of tax on continuing operations 30% 30% 30% 30%1 Other items comprise the amortisation of certain acquired intangible assets and fair value changes on financing derivatives.(iv) analysis of deferred taxDeferred tax assets 294 252Deferred tax liabilities (63) (77)Net deferred tax assets 231 175<strong>2011</strong>£m2010£mRetirementbenefitobligations£mTaxlosses£mAcceleratedtaxdepreciation£mGoodwilland otherintangible assets£mOthertemporarydifferences£mAt 1 January <strong>2011</strong> 146 59 (90) 50 10 175Exchange differences – – (1) 2 1 2(Charge)/credit for the year (7) (22) (15) 25 15 (4)Credit to equity 30 – – – 28 58At 31 December <strong>2011</strong> 169 37 (106) 77 54 231Total£mAt 1 January 2010 117 61 (106) 12 18 102Exchange differences 4 2 (1) 1 1 7Credit/(charge) for the year 1 (4) 13 37 (6) 41Credit/(charge) to equity 24 – – – (4) 20Transfer to liabilities classified as held for sale – – 4 – 1 5At 31 December 2010 146 59 (90) 50 10 175Deferred tax assets and liabilities are presented as non current in the consolidated balance sheet. Of the total deferred tax assets,£36m (2010: £29m) are recoverable within one year. Deferred tax assets and liabilities are only offset where there is a legally enforceableright of offset and there is an intention to settle the balance net.Deferred tax assets have been recognised where it is probable that they will be recovered. In recognising deferred tax assets, theGroup has considered if it is more likely than not that sufficient future profits will be available to absorb tax losses and other temporarydifferences. Deferred tax assets of £80m (2010: £61m) have not been recognised in respect of losses and other temporary differences dueto the uncertainty of the availability of suitable profits in the foreseeable future. The principal items on which no deferred tax assets havebeen recognised are tax losses, including capital losses, of £288m (2010: £227m) of which £57m (2010: £nil) expire within five years.No deferred tax has been recognised on the unremitted earnings of overseas subsidiaries except where it is probable that the temporarydifference will reverse in the forseeable future. If the earnings were remitted in full, tax of £20m (2010: £25m) would be payable.
1059 earnings/(loss) per share(i) basic and diluted earnings/(loss) per shareContinuing operations 34.7 34.5 27.1 27.0Discontinued operations 8.4 8.3 (12.9) (12.9)Total 43.1 42.8 14.2 14.1Basic<strong>2011</strong>PenceDiluted<strong>2011</strong>PenceBasic2010PenceDiluted2010PenceProfit/(loss) for the financial year attributable to equity shareholders of <strong>Rexam</strong> <strong>PLC</strong>Continuing operations 303 237Discontinued operations 73 (113)Total 376 124<strong>2011</strong>£m2010£moverviewWeighted average number of shares in issue 872.6 875.6Dilution on conversion of outstanding share options 6.2 2.6Weighted average number of shares in issue on a diluted basis 878.8 878.2(ii) underlying earnings per shareContinuing operations 36.1 31.4Discontinued operations 0.9 1.4Total 37.0 32.8<strong>2011</strong>Continuingoperations£m<strong>2011</strong>Discontinuedoperations£m<strong>2011</strong>Millions<strong>2011</strong>Pence2010Continuingoperations£m2010Millions2010Pence2010Discontinuedoperations£mUnderlying profit before tax 450 13 390 22Tax on underlying profit (135) (5) (116) (9)Underlying profit for the financial year 315 8 274 13Attributable to:Shareholders of <strong>Rexam</strong> <strong>PLC</strong> 315 8 275 12Non controlling interests – – (1) 1315 8 274 13Underlying earnings per share is based on underlying profit for the financial year attributable to shareholders of <strong>Rexam</strong> <strong>PLC</strong> divided by theweighted average number of shares in issue. Underlying profit for the financial year is profit before exceptional items, the amortisation ofcertain acquired intangible assets and fair value changes on financing derivatives. Underlying earnings per share is included as it is feltthat adjusting basic earnings per share for exceptional items, the amortisation of certain acquired intangible assets and fair value changeson financing derivatives provides a better indication of the Group’s performance.financial statements governancesustainabilitybusiness review
106<strong>Rexam</strong> annual report <strong>2011</strong>notes to the consolidated financial statements10 discontinued operationsThe sale of the discontinued Closures division completed on 1 September <strong>2011</strong>. In 2010 the division was reported in the consolidatedbalance sheet within assets and liabilities classified as held for sale.A summary of results, exceptional items, profit on disposal, cash flows and other comprehensive loss are set out below.(i) summary of resultsSales 205 343Operating expenses (231) (520)Underlying operating profit 13 22Exceptional items (note ii) (39) (185)Amortisation of certain acquired intangible assets – (14)Loss before tax (26) (177)Tax on underlying profit (5) (9)Tax on exceptional items (note ii) 13 68Tax on amortisation of certain acquired intangible assets – 6Tax 8 65Loss after tax (18) (112)Profit on disposal (note iii) 91 –Net profit/(loss) 73 (112)<strong>2011</strong>£m2010£m(ii) exceptional itemsImpairment of Closures (28) (171)Other impairment (6) (8)Restructuring (5) (6)Exceptional items before tax (39) (185)Tax on impairment of Closures 10 63Tax on other impairment and restructuring 3 5Exceptional items after tax (26) (117)Impairment of Closures comprises goodwill of £nil (2010: £59m), intangible assets of £16m (2010: £65m) and property, plant andequipment of £12m (2010: £47m). Other impairment in <strong>2011</strong> comprises £4m related to the write off of certain software licenses and £2mrelated to the write down of a plastic packaging plant in Poland. Other impairment in 2010 of £8m comprised the closure of a facility inConstantine, US.(iii) profit on disposal<strong>2011</strong>£mGross proceeds (net of costs of £10m) 207Cash and cash equivalents disposed (2)Net cash inflow in the cash flow statement 205Net assets disposed (net of tax) (197)Accrued costs (6)Exchange differences recognised in the income statement on disposal 89Profit on disposal 91(iv) cash flowsNet cash flows from operating activities (19) 30Net cash flows from investing activities (14) (12)Net cash flows from financing activities (1) –Net cash (outflow)/inflow (34) 18<strong>2011</strong>£m<strong>2011</strong>£m2010£m2010£m
10710 discontinued operations continued(v) other comprehensive lossExchange differences recognised in the income statement on disposal (89) –Disposal of non controlling interests (2) –Total other comprehensive loss (91) –<strong>2011</strong>£m2010£m11 equity dividendsInterim dividend for <strong>2011</strong> of 4.7p paid on 4 October <strong>2011</strong> 41 –Final dividend for 2010 of 8.0p paid on 7 June <strong>2011</strong> 70 –Interim dividend for 2010 of 4.0p paid on 5 October 2010 – 35Final dividend for 2009 of 8.0p paid on 3 June 2010 – 70<strong>2011</strong>£m2010£m111 105A final dividend per equity share of 9.7p has been proposed for <strong>2011</strong> and, subject to shareholder approval, is payable on 7 June 2012.The proposed final dividend has not been accrued in these consolidated financial statements.12 goodwill(i) summaryCostAt 1 January 1,852 2,085Exchange differences (15) 30Transfer to assets classified as held for sale – (263)At 31 December 1,837 1,852ImpairmentAt 1 January (4) (199)Exchange differences 1 (9)Impairment of Closures – (59)Transfer to assets classified as held for sale – 263At 31 December (3) (4)Carrying value at 31 December 1,834 1,848The carrying value of goodwill at 31 December is allocated to cash generating units or groups of cash generating units (CGUs) as set outbelow.Europe 639 647US 367 367Brazil 197 197Russia 42 44Egypt 33 35Mexico 7 7Beverage Cans 1,285 1,297<strong>2011</strong>£m<strong>2011</strong>£m2010£m2010£mfinancial statements governancesustainabilitybusiness reviewoverviewHealthcare 327 330Personal Care 222 221Plastic Packaging 549 551Carrying value at 31 December 1,834 1,848
108<strong>Rexam</strong> annual report <strong>2011</strong>notes to the consolidated financial statements12 goodwill continued(ii) impairment testingThe recoverable amounts of CGUs or groups of CGUs were determined based on value in use calculations at 31 December <strong>2011</strong>.The cash flow projections used in these calculations are based on the Group’s financial budget for 2012, as approved by the board inDecember <strong>2011</strong>, and the Group’s financial plans in respect of 2013 and 2014. As highlighted in the principal accounting policies, thecalculation of value in use requires the use of estimates which, although based on management’s best knowledge, may ultimately differfrom actual results.Key assumptionsThe key assumptions for the value in use calculations are:(a) Discount rates. The pre tax discount rates used in the value in use calculations are set out in the table below. These discount rates arederived from the Group’s pre tax weighted average cost of capital (WACC), as adjusted for the specific risks relating to each region inwhich the CGUs operate. The Group’s pre tax WACC fell by 1% due primarily to a fall in the underlying risk free rate.Europe 10 11US 10 11Brazil 13 15Russia 15 18China 13 14Egypt 20 21Mexico 14 16(b) Growth rates. Cash flows beyond the three year planning horizon have been extrapolated using growth rates ranging between1.6% and 7.5%. The growth rates used do not exceed the medium to long term GDP growth rates relating to each region in whichthe CGUs operate.(c) Operating profit. Forecasts for sales and margins are based on analyses of sales, markets, costs and competitors. Consideration isgiven to past experience and knowledge of future contracts. Forecasts for aluminium and resin are based on forward prices and timeprojections after taking into account pass through of costs and hedging. Forecasts for other raw materials and energy are based oninflation forecasts and supply and demand factors.SensitivitiesThe recoverable amount of the goodwill allocated to the Personal Care CGUs was calculated using discount rates between 10% and 13%and growth rates between 1.6% and 7.5% to reflect the different regions in which the CGUs operate. A comparison of the recoverableamount with carrying value gave rise to minimal goodwill headroom. A 1% increase in discount rates would reduce the recoverableamount by approximately £60m. Similarly, a 1% decrease in either growth rates or operating profit would reduce the recoverable amountby approximately £70m and £10m, respectively.With respect to all other CGUs or groups of CGUs, management considers that no reasonably possible change in any of the keyassumptions would cause the recoverable amount of goodwill to fall below carrying value.<strong>2011</strong>%2010%
10913 other intangible assetsComputersoftwareacquired£mComputersoftwaredeveloped£mCustomercontracts andrelationshipsacquired£mTechnologyand patentsacquired£mOtherdevelopmentprojects£mCostAt 1 January <strong>2011</strong> 98 24 346 127 16 611Exchange differences (1) – (3) (1) – (5)Additions 4 – – – 1 5Disposals (5) (4) – – (1) (10)At 31 December <strong>2011</strong> 96 20 343 126 16 601Accumulated amortisationAt 1 January <strong>2011</strong> (71) (18) (86) (46) (7) (228)Exchange differences 1 1 1 – – 3Amortisation for the year (9) (2) (18) (8) (1) (38)Disposals 5 4 – – – 9Impairment (2) (2) – – – (4)At 31 December <strong>2011</strong> (76) (17) (103) (54) (8) (258)Carrying value at 31 December <strong>2011</strong> 20 3 240 72 8 343CostAt 1 January 2010 95 26 498 188 13 820Exchange differences (1) 1 19 6 – 25Additions 9 – – – 2 11Disposals (2) (1) – – – (3)Transfers 1 – – – 2 3Transfer to assets classified as held for sale (4) (2) (171) (67) (1) (245)At 31 December 2010 98 24 346 127 16 611Accumulated amortisationAt 1 January 2010 (65) (17) (91) (46) (6) (225)Exchange differences 1 (1) (2) (1) – (3)Amortisation for the year (11) (3) (32) (14) (1) (61)Disposals 1 1 – – – 2Impairment – – (65) – – (65)Transfer to assets classified as held for sale 3 2 104 15 – 124At 31 December 2010 (71) (18) (86) (46) (7) (228)Carrying value at 31 December 2010 27 6 260 81 9 383The impairment of £4m in <strong>2011</strong> comprises the write off of certain software licenses. The impairment of £65m in 2010 related to thediscontinued Closures division.Total£mfinancial statements governancesustainabilitybusiness reviewoverview
110<strong>Rexam</strong> annual report <strong>2011</strong>notes to the consolidated financial statements14 property, plant and equipmentProperty£mPlant andequipment£mAssets underconstruction£mCostAt 1 January <strong>2011</strong> 579 2,289 127 2,995Exchange differences (7) (23) (4) (34)Additions 5 61 168 234Disposals (2) (37) (2) (41)Reclassifications 19 117 (136) –At 31 December <strong>2011</strong> 594 2,407 153 3,154Accumulated depreciationAt 1 January <strong>2011</strong> (160) (1,264) – (1,424)Exchange differences 1 12 – 13Disposals – 34 – 34Depreciation for the year (21) (158) – (179)Impairment – (9) – (9)Reversal of impairment – 1 – 1At 31 December <strong>2011</strong> (180) (1,384) – (1,564)Total£mCarrying value at 31 December <strong>2011</strong> 414 1,023 153 1,590CostAt 1 January 2010 602 2,389 113 3,104Exchange differences 4 13 2 19Additions 3 43 154 200Disposals (9) (48) (1) (58)Transfers – 2 (3) (1)Reclassifications 23 95 (118) –Transfer to assets classified as held for sale (44) (205) (20) (269)At 31 December 2010 579 2,289 127 2,995Accumulated depreciationAt 1 January 2010 (150) (1,231) – (1,381)Exchange differences (2) (5) – (7)Disposals 3 43 – 46Depreciation for the year (22) (182) – (204)Impairment – (61) – (61)Reversal of impairment – 3 – 3Transfer to assets classified as held for sale 11 169 – 180At 31 December 2010 (160) (1,264) – (1,424)Carrying value at 31 December 2010 419 1,025 127 1,571The carrying value of property, plant and equipment includes finance leased assets of £33m (2010: £34m) in respect of propertyand £nil (2010: £1m) in respect of plant and equipment.Of the impairment of £9m in <strong>2011</strong>, £5m relates to the write down of assets on conversion from steel to aluminium in the Indian beveragecans business and £4m relates to write downs of assets in Plastic Packaging in respect of previously announced plant closures andrestructuring in some of the remaining continuing businesses following disposal of the Closures division. In 2010 the impairment of £61mcomprised £6m on continuing operations and £55m in respect of the discontinued Closures division. Of the £6m from continuingoperations, £5m related to the write down of assets on conversion of plants from steel to aluminium in the European beverage cansbusiness and £1m related to over capacity in the Mexican beverage cans business.The reversal of impairment of £1m in <strong>2011</strong> is an over provision relating to the write down of assets on conversion from steel to aluminium ina Spanish beverage cans plant. The reversal of impairment in 2010 of £3m related to the North American plastic packaging businesswhereby the proceeds from the sale of assets were higher than previously expected.
11115 investments in subsidiariesThe principal subsidiaries, all of which are wholly owned, are shown below. An asterisk indicates that the capital is directly owned by<strong>Rexam</strong> <strong>PLC</strong>. Subsidiaries incorporated in the UK are registered in England and Wales. All subsidiaries are included in the consolidatedfinancial statements.Country ofincorporationPrincipal areaof operationIdentity ofcapital heldNature ofbusiness activities<strong>Rexam</strong> Beverage Can Company US US Common stock Consumer packaging<strong>Rexam</strong> Beverage Can Naro Fominsk LLC Russia Russia Capital stock Consumer packaging<strong>Rexam</strong> Beverage Can South America SA Brazil South America Common stock Consumer packaging<strong>Rexam</strong> do Brazil Ltda Brazil South America Quotas Consumer packaging<strong>Rexam</strong> European Holdings Limited UK UK Ordinary shares Holding company<strong>Rexam</strong> France SA France France Ordinary shares Consumer packaging<strong>Rexam</strong> Group Holdings Limited UK UK Ordinary shares Holding company<strong>Rexam</strong> Holdings AB Sweden Continental Europe Ordinary shares Holding company<strong>Rexam</strong> Inc US US Common stock Holding company<strong>Rexam</strong> Overseas Holdings Limited UK UK Ordinary shares Holding company<strong>Rexam</strong> Plastic Packaging Inc US US Common stock Holding company16 investments in associates and joint venturesThe principal associate and joint venture are set out below.Country ofincorporation andarea of operation Issued capital Group shareHanil Can Company Limited – associate South Korea 1.7m shares of 5,000 won each 40%Controladora Envases Universales <strong>Rexam</strong> SA – joint venture Guatemala 334.5m shares of 1 quetzal each 50%Associates£mJoint ventures£mAt 1 January <strong>2011</strong> 35 26 61Share of post tax profits 4 5 9At 31 December <strong>2011</strong> 39 31 70At 1 January 2010 31 23 54Exchange differences 2 1 3Share of post tax profits 2 3 5Transfer to assets classified as held for sale – (1) (1)At 31 December 2010 35 26 61There is £3m of goodwill allocated to the joint venture in Guatemala (2010: £3m).The following table sets out summary information on all associates and joint ventures on a 100% basis.<strong>2011</strong>Associates£m<strong>2011</strong>Joint ventures£m2010Associates£mTotal£m2010Joint ventures£mSales 187 70 153 56Profit after tax 11 9 5 5Assets 161 73 150 62Liabilities (64) (11) (63) (10)financial statements governancesustainabilitybusiness reviewoverview
112<strong>Rexam</strong> annual report <strong>2011</strong>notes to the consolidated financial statements17 available for sale financial assetsAt 1 January 28 23Exchange differences (1) 1Income for the year 2 2Changes in market value – 1Cash injection – 3Payments in respect of pension obligations (2) (2)Disposals (25) –At 31 December 2 28<strong>2011</strong>£m2010£mNon current assets 1 27Current assets 1 1At 31 December 2 28Available for sale financial assets at 31 December <strong>2011</strong> include £1m (2010: £27m) of investments used to satisfy certain US retirementobligations, of which £nil (2010: £27m) comprises fixed rate listed investments, the fair values of which were determined directly byreference to published price quotations in an active market, and £1m (2010: £nil) comprises cash and cash equivalents. Also included inavailable for sale financial assets at 31 December <strong>2011</strong> are unlisted investments of £1m (2010: £1m).Disposals comprise £23m of assets transferred to insurance backed assets and a £2m loss on the ‘buy in’ of insurance policies on thetransfer, as set out in note 18. The £2m is recognised in the consolidated statement of comprehensive income.The carrying amounts of available for sale financial assets are denominated in the following currencies, which are the functional currenciesof the relevant subsidiaries.US dollar 1 27Euro 1 118 insurance backed assets<strong>2011</strong>£m<strong>2011</strong>£m2010£m2 28At 1 January – –Exchange differences 1 –Additions 23 –Payments in respect of pension obligations (1) –Actuarial gains 2 –2010£m25 –Non current assets 23 –Current assets 2 –At 31 December 25 –The Group, through its subsidiary <strong>Rexam</strong> Inc, has a number of non qualified defined benefit pension plans in the US, some of which arestructured as Rabbi Trusts, whereby investments held by the Group are linked to the obligations in the plans.Historically the Group was required to maintain its defined benefit Rabbi Trust assets at 100% of the value of the related US defined benefitpension obligations and this gave rise to volatile cash funding requirements. To eliminate this investment and demographic relatedvolatility, the Group purchased a number of non qualifying insurance policies in July <strong>2011</strong> at a cost of £25m, including a £2m ‘buy in’insurance premium, recognised in the consolidated statement of comprehensive income. The insurance policies pay the benefits to theGroup as they fall due, and the Group in turn makes the payments to the eligible beneficiaries.Although eligible beneficiaries have no vested rights in the insurance policies, the policies remain under the Rabbi Trust structure and assuch they cannot be used by the Group, but they would revert to the benefit of general creditors in the event of <strong>Rexam</strong> Inc’s bankruptcy.The insurance backed assets are recognised in the consolidated balance sheet at the present value of the matching defined benefit pensionobligations and are accounted for in accordance with the Group’s accounting policy for retirement benefit obligations.
11319 inventoriesRaw materials, stores and consumables 211 176Work in progress 17 15Finished goods 289 224An analysis of provisions against inventories is set out below.<strong>2011</strong>£m2010£m517 415At 1 January (29) (32)Charge for the year (22) (13)Released in the year 6 3Utilised 5 4Transfer to assets classified as held for sale – 9At 31 December (40) (29)<strong>2011</strong>£m2010£moverview20 trade and other receivablesNon current assetsTrade receivables 4 4Provision for impairment (4) (4)Net trade receivables – –Prepayments 62 68Taxes 11 9Other receivables 33 43106 120Current assetsTrade receivables 527 509Provision for impairment (9) (17)Net trade receivables 518 492Prepayments 36 55Taxes 33 37Other receivables 39 64626 648Total trade and other receivables 732 768An analysis of provisions for impairment of trade and other receivables is set out below.At 1 January (21) (16)Impairment in the year (7) (7)Released in the year 14 1Utilised 1 1At 31 December (13) (21)<strong>2011</strong>£m<strong>2011</strong>£m2010£m2010£mfinancial statements governancesustainabilitybusiness review
114<strong>Rexam</strong> annual report <strong>2011</strong>notes to the consolidated financial statements20 trade and other receivables continuedAn analysis of total trade and other receivables including those which are past due but not impaired is set out below.Not yet due 691 715Past due less than 1 month 31 21Between 1 and 2 months 7 4Between 2 and 3 months 2 1Between 3 and 6 months – 2Between 6 and 12 months 1 5In more than 12 months – 20<strong>2011</strong>£m2010£m732 768The maximum amount of credit risk with respect to customers is represented by the carrying amount on the balance sheet. Customer creditfacilities for new customers must be approved by designated managers at business level or by senior sector management. Credit limits areset with reference to trading history and reports from credit rating agencies. Customer credit facilities are reviewed at the sales order entrystage and at the time of shipment so as not to exceed customer limits. Overdue accounts are regularly reviewed and impairment provisionsare created where necessary. As a matter of policy, all outstanding trade balances greater than three months are fully provided except asapproved by senior sector management and with due regard to the historical risk profile of the customer. The Group has extremely lowhistorical levels of customer credit defaults, due in part to the large multinational nature of many of its customers and the long termrelationships it has with them. There were no major new customers in <strong>2011</strong> where the Group considered there was a risk of significantcredit default. There are no trade and other receivables that would otherwise be past due or impaired whose terms have beenrenegotiated.The carrying amounts of total trade and other receivables are denominated in the following currencies which, in most instances, are thefunctional currencies of the relevant subsidiaries.Euro 259 259US dollar 204 242Brazilian real 154 154Other 115 11321 cash and cash equivalents<strong>2011</strong>£m2010£m732 768Cash at bank and in hand 83 46Short term bank deposits 329 68The Group has provided letters of credit, secured by short term bank deposits, totalling £1m (2010: £1m) as part of its insurancearrangements.The carrying amounts of cash and cash equivalents are denominated in the following currencies.<strong>2011</strong>£m2010£m412 114US dollar 184 72Sterling 166 2Euro 22 20Other 40 20<strong>2011</strong>£m2010£m412 114
11522 assets and liabilities classified as held for saleAssets 2 282Liabilities – (50)<strong>2011</strong>£m2010£m2 232Assets classified as held for sale in <strong>2011</strong> comprise properties in the US deemed surplus to requirements (2010: £2m). In 2010 assets andliabilities classified as held for sale included £230m relating to the discontinued Closures division.23 trade and other payablesCurrent liabilitiesTrade payables (510) (438)Social security and other taxes (66) (60)Accrued expenses (198) (202)Loan from joint venture (9) (5)Other payables (78) (63)(861) (768)Non current liabilitiesAccrued expenses (21) (30)Other payables (32) (51)(53) (81)Total trade and other payables (914) (849)The carrying amounts of total trade and other payables are denominated in the following currencies, which in most instances are thefunctional currencies of the relevant subsidiaries.US dollar (464) (398)Euro (255) (259)Brazilian real (80) (92)Sterling (43) (41)Other (72) (59)(914) (849)<strong>2011</strong>£m<strong>2011</strong>£m2010£m2010£mfinancial statements governancesustainabilitybusiness reviewoverview
116<strong>Rexam</strong> annual report <strong>2011</strong>notes to the consolidated financial statements24 borrowingsCurrent liabilitiesBank overdrafts (10) (15)Bank loans (4) (25)US public bond (1) (1)US private placement (1) (1)Subordinated bond (21) (21)Medium term notes (16) (17)Finance leases – (1)(53) (81)Non current liabilitiesBank loans (28) (43)US public bond (356) (356)US private placement (146) (146)Subordinated bond (715) (706)Medium term notes (540) (549)(1,785) (1,800)<strong>2011</strong>£m2010£mTotal borrowings (1,838) (1,881)The Group has a range of bank facilities maturing between 2012 and 2016. These facilities may generally be drawn in a range of freelyavailable currencies and are at floating rates of interest. In addition, the Group has a US public bond, a US private placement,a subordinated bond and medium term notes in issue. The US public bond and US private placement totalling US$775m were issued ata fixed price and mature in 2013. The subordinated bond is denominated in euros with a maturity in 2067. It was issued at a fixed rateof interest but has been swapped into US dollar floating rates of interest through the use of cross currency and interest rate derivatives.The medium term notes are denominated in euros and mature in 2013. They were issued at fixed rates of interest although some havebeen swapped to floating rates of interest in euro through the use of interest rate derivatives. The bulk of the Group’s drawn debt is currentlyrepresented by various bond issues with significant headroom available under its committed bank facilities.Total minimum lease payments at 31 December <strong>2011</strong> are £nil (2010: £1m).Included within borrowings are secured loans of £1m (2010: £15m), the security for which is principally property.The carrying amounts of total borrowings are denominated in the following currencies.Euro (1,291) (1,296)US dollar (509) (529)Other (38) (56)(1,838) (1,881)<strong>2011</strong>£m2010£m
11725 net borrowingsNet borrowings at 31 December by instrument.Cash and cash equivalents 412 114Bank overdrafts (10) (15)Bank loans (32) (68)US public bond (357) (357)US private placement (147) (147)Subordinated bond (736) (727)Medium term notes (556) (566)Finance leases – (1)Financing derivatives 114 83<strong>2011</strong>£m2010£m(1,312) (1,684)overviewMovement in net borrowings.At 1 January (1,684) (1,828)Exchange differences 29 (38)Increase in cash and cash equivalents 300 55Proceeds from borrowings (7) (21)Repayment of borrowings 36 159Fair value and other changes 14 (11)At 31 December (1,312) (1,684)Reconciliation of net borrowings to the consolidated balance sheet.Total derivative financial instruments (net) 59 130Derivatives not included in net borrowings 55 (47)Financing derivatives included in net borrowings 114 83Cash and cash equivalents 412 114Borrowings included in current liabilities (53) (81)Borrowings included in non current liabilities (1,785) (1,800)<strong>2011</strong>£m<strong>2011</strong>£m2010£m2010£m(1,312) (1,684)financial statements governancesustainabilitybusiness review
118<strong>Rexam</strong> annual report <strong>2011</strong>notes to the consolidated financial statements26 financial instruments(i) carrying amount and fair value of financial assets and liabilitiesAnalysis of the carrying values and fair values at 31 December, by category and by class, of financial assets and liabilities.Derivativesused forhedging£mDerivativesused fortrading£mLoansandreceivables£mAvailablefor saleassets£mOtherfinancialliabilities£mTotalcarryingamount£mTotalfair value£mAt 31 December <strong>2011</strong>Financial assetsCash and cash equivalents – – 412 – – 412 412Trade and other receivables 1 – – 590 – – 590 590Available for sale financial assets – – – 2 – 2 2Derivative financial instruments 300 3 – – – 303 303Financial liabilitiesTrade and other payables 2 – – – – (848) (848) (848)Bank overdrafts – – – – (10) (10) (10)Bank loans – – – – (32) (32) (32)US public bond – – – – (357) (357) (381)US private placement – – – – (147) (147) (156)Subordinated bond – – – – (736) (736) (595)Medium term notes – – – – (556) (556) (569)Derivative financial instruments (72) (172) – – – (244) (244)228 (169) 1,002 2 (2,686) (1,623) (1,528)At 31 December 2010Financial assetsCash and cash equivalents – – 114 – – 114 114Trade and other receivables 1 – – 599 – – 599 599Available for sale financial assets – – – 28 – 28 28Derivative financial instruments 324 2 – – – 326 326Financial liabilitiesTrade and other payables 2 – – – – (789) (789) (789)Bank overdrafts – – – – (15) (15) (15)Bank loans – – – – (68) (68) (68)US public bond – – – – (357) (357) (392)US private placement – – – – (147) (147) (160)Subordinated bond – – – – (727) (727) (642)Medium term notes – – – – (566) (566) (585)Finance leases – – – – (1) (1) (1)Derivative financial instruments (6) (190) – – – (196) (196)318 (188) 713 28 (2,670) (1,799) (1,781)1 Excludes prepayments and taxes.2 Excludes social security and other taxes.Market values have been used to determine the fair values of available for sale financial assets, bank overdrafts and floating rate bankloans. The carrying values of trade and other receivables and trade and other payables are assumed to approximate their fair valuesdue to their short term nature. The fair values of the US public bond, subordinated bond and medium term notes have been determined byreference to quoted market prices at the close of business on 31 December. The US private placement is not a publicly traded instrumentand its fair value has been approximated using the market value of the US public bond, which has a similar maturity date. The fair valuesof interest rate swaps, cross currency swaps, fixed rate loans and finance leases have been determined by discounting cash flows atprevailing interest rates. The fair value of forward foreign exchange contracts has been determined by marking those contracts to marketagainst prevailing forward foreign exchange rates. The fair value of forward commodity contracts has been determined by marking thosecontracts to market at prevailing forward prices.In both <strong>2011</strong> and 2010, all financial instruments measured at fair value are categorised as level 2 in the fair value measurement hierarchy,whereby the fair value is determined by using valuation techniques. In 2010 there were £27m of fixed rate listed investments included inavailable for sale financial assets that were classified as level 1. The valuation techniques for level 2 instruments use observable marketdata where it is available, for example quoted market prices, and rely less on estimates.
11926 financial instruments continued(ii) financial risk managementThe Group bases its financial risk management on sound economic objectives and good corporate practice. Group treasuryoperations are carried out under policies and parameters defined by the <strong>Rexam</strong> board and supervised by its finance committee.Group treasury is not operated as a separate profit centre nor does it enter into any transactions for speculative purposes.The Group’s major operational hedges comply with IAS39 and hedge accounting treatment is applied. Some smaller operationalexposures are hedged on an economic basis and hedge accounting treatment is not applied where the compliance burden is deemedto be onerous and the income statement volatility arising is not expected to be significant.(a) market risk: currenciesCurrency risks arise from the multi currency cash flows within the Group. These risks arise from exchange rate fluctuations relatingto the translation of balance sheet items of foreign subsidiaries (translation risk) and from currency flows from sales and purchases(transaction risk).The policy regarding translation risk is to mitigate the impact of foreign exchange movements between overseas currencies and sterlingarising on the translation of the value of non UK operations into sterling for reporting purposes. This is achieved by borrowing a proportionof debt, either directly or through the use of cross currency swaps and forward foreign exchange contracts, in currencies which match orare closely linked to the currencies of the overseas businesses. This approach also provides some protection against the foreign exchangetranslation of overseas earnings as it matches the currency of earnings to the currency of the interest expense. These amounts are includedin the consolidated financial statements by translation into sterling at the balance sheet date and, where hedge accounted, offset in equityagainst the translation movement in net assets. Some cross currency swaps used to manage the Group’s currency exposures, whilsteconomically effective, are ineligible for hedge accounting treatment.The policy regarding transaction risk is to hedge the reported net transaction exposure in full less an allowance for variability inforecasting. This is generally achieved through the use of forward foreign exchange contracts with amounts hedged being based onthe reporting from individual Group businesses. None of the foreign exchange derivative instruments at 31 December <strong>2011</strong> related toderivative trading activity, although some fair value gains and losses were taken to the consolidated income statement because IAS39hedge accounting treatment was not applied. Foreign exchange derivative instruments are used for hedging general business exposuresin foreign currencies such as the purchase and sale of goods, capital expenditure and dividend flows.Transactional foreign exchange risks are hedged by Group treasury unless it is a legal requirement in the country where the foreignexchange risk arises that hedging is carried out locally. In the latter case, hedging is carried out by the individual responsible for treasurywithin the local business, but still operating within the overall Group policy on foreign exchange management.The currency denomination of borrowings at 31 December <strong>2011</strong> was 68% in US dollars and 32% in euros (2010: 75% US dollars,22% euros, 3% all other currencies).(b) market risk: interest ratesChanges in interest rates on interest bearing receivables and floating rate debt in different currencies create interest rate risk. The objectiveof the Group’s interest rate risk management is to manage its exposure to the impact of changes in interest rates in the currencies in whichdebt is borrowed. Group policy is to keep between 35% and 85% of interest on borrowings at fixed rates. Interest rate risk is managedthrough the issue of fixed rate debt and through the use of interest rate derivatives that are used to manage the overall fixed to floating mixof debt, which was 75% fixed and 25% floating at 31 December <strong>2011</strong> (2010: 76% and 24%). Group treasury operates within a broadframework in respect of the mix of fixed and floating rate debt, as the optimum blend will vary depending on the mix of currencies and theGroup’s view of the debt markets at any point in time.Cash at bank earns interest at floating rates based on bank deposit rates in the relevant currency. Short term deposits are usually madefor periods varying between one day and three months depending on the immediate cash requirements of the Group and earn interest atthe respective short term deposit rates. Other floating rate financial instruments are at the appropriate LIBOR interest rates as adjusted byvariable margins. Interest on floating rate financial instruments is repriced at intervals of less than one year. Interest on fixed rate financialinstruments is fixed until maturity of the instrument.Some interest rate swaps used to manage the Group’s fixed to floating debt mix, whilst economically effective, are ineligible for hedgeaccounting treatment. Fair value gains and losses on these hedges are recognised in the consolidated income statement. In <strong>2011</strong>, therewas a gain of £23m (2010: loss £12m) on fair value changes on financing derivatives, disclosed separately within interest expense in theconsolidated income statement.financial statements governancesustainabilitybusiness reviewoverview
120<strong>Rexam</strong> annual report <strong>2011</strong>notes to the consolidated financial statements26 financial instruments continued(c) market risk: commodity pricesChanges in the market price of commodities used by the Group create commodity risk. Group policy is to manage these risks through bothits supply chain management and through use of financial derivatives. Where financial derivatives are used, the Group uses mainly overthe counter instruments transacted with banks, which are themselves priced through a recognised commodity exchange, such as theLondon Metal Exchange. The Group manages the purchase of certain raw materials, including aluminium, resin and energy costs throughphysical supply contracts which, in the main, relate directly to commodity price indices. With regard to aluminium, which represents theGroup’s largest commodity exposure, the policy is to eliminate as far as possible any market price variability through hedging in tandemwith contractual commitments to customers. Where <strong>Rexam</strong> assumes the aluminium price risk on customer contracts, it has defined a riskappetite with a predetermined aggregate consolidated income statement limit arising from any related aluminium hedging activities.Its position against this limit is monitored and reported on a monthly basis. For other commodities, the policy is to follow an incrementalhedge approach over a period of up to three years in order to manage the price year over year and limit uncertainty. None of thecommodity derivative financial instruments at 31 December <strong>2011</strong> related to derivative trading activity, although some fair value gainsand losses were taken to the consolidated income statement because hedge accounting was not applied. The commodity hedges mainlyrelate to contracted and expected future purchases of aluminium, but also include resin and energy.(d) market risk: euroIn response to the current instability in Europe, a ‘euro crisis committee’ has been established by the Group to monitor risks, createcontingency plans and take action as appropriate.(e) market risk: sensitivitiesA sensitivity analysis for financial assets and liabilities affected by market risk is set out below. Each risk is analysed separately and showsthe sensitivity of financial assets and liabilities when a certain risk is changed. The sensitivity analysis has been performed on balancesat 31 December each year. The rates used are based on historical trends and, where relevant, projected forecasts.Key methods and assumptions made when performing the sensitivity analysis (net of hedging):(a) For the floating rate element of interest rate swaps, the sensitivity calculation is performed based on the floating rates at 31 Decembereach year.(b) The translation impact of overseas subsidiaries into sterling is not included in the sensitivity analysis.(c) The sensitivity analysis ignores any tax implications.currenciesThe foreign exchange rate sensitivity analysis set out in the table below is based on foreign currency positions, other than each Groupentity’s own functional currency, on the balance sheet at 31 December. The analysis includes only risks arising from financial instrumentsand gives the estimated impact on profit before tax and equity of a 10% increase and decrease in exchange rates between currency pairswith significant currency positions.Increase%Impact onprofitbefore tax£mImpacton equity£mDecrease%Impact onprofitbefore tax£mImpacton equity£mAt 31 December <strong>2011</strong>Sterling/US dollar 10 (4) – (10) 5 –Sterling/euro 10 11 29 (10) (13) (36)Euro/US dollar 10 (1) (23) (10) 1 23At 31 December 2010Sterling/US dollar 10 (19) 4 (10) 23 (5)Sterling/euro 10 23 32 (10) (28) (39)Euro/US dollar 10 15 (16) (10) (16) 16The impact of currency risk on net investment hedges is offset by the translation of overseas subsidiaries on consolidation.The net impact of currency translation resulted in sales and underlying profit from continuing operations (reducing)/increasingas set out below.<strong>2011</strong>Sales£m<strong>2011</strong>Underlyingoperatingprofit£m2010Sales£m2010Underlyingoperatingprofit£mUS dollar (81) (9) 31 3Euro 20 3 (51) (3)Other currencies 8 – 42 7(53) (6) 22 7
12126 financial instruments continuedinterest ratesAt 31 December <strong>2011</strong>, if the US dollar interest rate were increased by 1% with all other variables held constant, profit before tax wouldincrease by £12m (2010: £7m) as a result of US dollar denominated floating rate debt and interest rate and cross currency derivatives thatare not hedge accounted. If euro and sterling interest rates were increased by 1% with all other variables held constant, profit before taxwould reduce by £9m (2010: £8m) as a result of fixed rate debt being swapped into floating rate debt. A reduction in interest rates wouldnot have a significant effect on profit before tax. There was no significant interest rate risk relating to equity in either year.commodity pricesAt 31 December <strong>2011</strong>, there was no price risk relating to the income statement since all significant commodity derivatives were treatedas cash flow hedges with movements being reflected in equity. If the aluminium price was increased or reduced by 10% with all othervariables held constant, equity would increase or decrease by £48m (2010: £45m).equity pricesThe Group is not subject to any significant equity price risk.overview(f) liquidity riskAn analysis of undiscounted contractual maturities for non derivative financial liabilities, derivative financial instruments and undrawncommitted debt facilities is set out below.Within1 year£m1 to 2years£m2 to 5years£mMore than5 years£mTotalcontractualamount£mAt 31 December <strong>2011</strong>Non derivative financial liabilities:Trade and other payables (795) (13) (15) (25) (848)Bank overdrafts (10) – – – (10)Bank loans (4) (2) – (26) (32)US public bond (24) (381) – – (405)US private placement (9) (155) – – (164)Subordinated bond (43) (43) (128) (673) (887)Medium term notes (23) (559) – – (582)Derivative financial instruments:Derivative contracts – settled gross payments (403) (124) (148) (1,186) (1,861)Derivative contracts – settled gross receipts 433 151 204 1,189 1,977Derivative contracts – net settlements 1 4 (1) – 4Commodity contracts (49) (10) (3) – (62)Undrawn committed debt facilities 50 – 809 – 859At 31 December 2010Non derivative financial liabilities:Trade and other payables (708) (18) (38) (25) (789)Bank overdrafts (15) – – – (15)Bank loans (24) (7) (7) (29) (67)US public bond (24) (24) (381) – (429)US private placement (9) (9) (155) – (173)Subordinated bond (43) (43) (130) (728) (944)Medium term notes (24) (24) (569) – (617)Finance leases (1) – – – (1)Derivative financial instruments:Derivative contracts – settled gross payments (607) (103) (205) (1,276) (2,191)Derivative contracts – settled gross receipts 631 123 228 1,282 2,264Derivative contracts – net settlements (3) 2 5 – 4Commodity contracts 36 12 1 – 49Undrawn committed debt facilities – 50 1,028 – 1,078financial statements governancesustainabilitybusiness review
122<strong>Rexam</strong> annual report <strong>2011</strong>notes to the consolidated financial statements26 financial instruments continuedThe Group monitors its liquidity to maintain a sufficient level of undrawn committed debt facilities, thereby ensuring financial flexibility.As at 31 December <strong>2011</strong>, <strong>Rexam</strong> had £859m of undrawn committed debt facilities available (2010: £1,078m).The Group mitigates refinancing risk by raising its debt requirements from a range of different sources. The range of maturity dates arisingon committed debt facilities is set out below.Maturity date2012 50 502013 1,039 1,0482015 – 1,0282016 809 –2067 654 654<strong>2011</strong>£m2010£m2,552 2,780(g) credit riskThe maximum credit risk exposure of the Group’s financial assets at 31 December is represented by the amounts reported under thecorresponding balance sheet headings. There are no significant concentrations of credit risk associated with financial instruments ofthe Group. Credit risk arises from exposures to external counterparties. In order to manage this risk, the Group has strict credit controlquality measures that are applied to counterparty institutions and also limits on maximum exposure levels to any one counterparty.To manage credit risk, the maximum limits for bank exposures held under Group policy are set out in the table below by individualcounterparty credit rating category. These limits are used when making investments and for the use of derivative instruments. The table alsosets out the Group’s financial asset exposure at 31 December for each counterparty credit rating category.<strong>2011</strong>Individualcounterpartylimit£m<strong>2011</strong>Cashand cashequivalents£m<strong>2011</strong>Derivatives£m<strong>2011</strong>Total£m2010Individualcounterpartylimit£m2010Cashand cashequivalents£m2010Derivatives£mCredit ratingAA 70 to 90 – – – 70 to 90 12 46 58AA– 60 to 80 13 48 61 60 to 80 75 65 140A+ 50 to 70 132 77 209 50 to 70 1 68 69A 40 to 60 136 87 223 40 to 60 25 147 172A– 20 to 40 130 91 221 20 to 40 – – –BBB+ and below 10 to 30 1 – 1 10 to 30 1 – 12010Total£m412 303 715 114 326 440Since 31 December <strong>2011</strong>, the credit ratings of certain banks included in the above table have been downgraded. However, none of theGroup’s individual counterparty limits have been breached as a result of these downgrades.See note 20 for information on credit risk with respect to customers.(h) capital risk managementThe Group’s objective is to minimise its cost of capital by optimising the efficiency of its capital structure, being the balance between equityand debt. The Group views its ordinary share capital as equity. This objective is always subject to an overriding principle that capital mustbe managed to ensure the Group’s ability to continue as a going concern in order to provide returns for shareholders and benefits for otherstakeholders. The Group is able to adjust its capital structure through the issue or redemption of either debt or equity and by adjustment tothe dividend paid to equity holders. The Group uses a range of financial metrics to monitor the efficiency of its capital structure, includingits weighted average cost of capital and net debt to EBITDA and ensures that its capital structure provides sufficient financial strength toallow it to secure access to debt finance at reasonable cost.At 31 December <strong>2011</strong>, the Group’s net debt to EBITDA for financial covenant purposes was 1.3 times (2010: 1.8 times). The Group aimsto keep this ratio below 2.5 times. For this purpose, net debt is broadly net borrowings adjusted to exclude interest accruals, certainderivative financial instruments and an equity portion of the subordinated bond and reflects non sterling amounts at average exchangerates. EBITDA is underlying operating profit after adding back depreciation and amortisation of computer software and adjusted whereappropriate to include acquisitions on a pro forma basis and excludes disposed businesses.
12326 financial instruments continued(iii) derivative financial instrumentsThe net fair values of the Group’s derivative financial instruments designated as fair value or cash flow hedges and those not designatedas hedging instruments are set out below.Fair value hedgesCross currency swaps 276 257Interest rate swaps 9 13285 270Cash flow hedgesForward aluminium commodity contracts (64) 50Forward gas commodity contracts (2) (2)Forward foreign exchange contracts 9 –(57) 48<strong>2011</strong>£m2010£moverviewTotal hedge accounted 228 318Not hedge accountedCross currency swaps (166) (175)Interest rate swaps (5) (10)Forward foreign exchange contracts 2 (3)Total not hedge accounted (169) (188)Total net fair value of derivative financial instruments 59 130fair value hedgesThe Group has designated interest rate swaps and the interest element of cross currency swaps as fair value hedges whereby interest isreceivable at fixed interest rates varying from 4.375% to 6.75% (2010: 4.375% to 6.75%) and payable at floating rates. These swapshedge the exposure to changes in the fair value of medium term notes which mature in 2013 (2010: 2013). The cross currency swapshedge changes in the fair value of the euro subordinated bond which matures in 2067. Net ineffectiveness gains of £9m were includedin interest in <strong>2011</strong> (2010: £5m).cash flow hedgesThe Group has designated forward foreign exchange contracts and aluminium, gas and resin commodity contracts as cash flow hedges.Forward foreign exchange contracts hedge foreign currency transaction risk and mature between 2012 and 2014 (2010: between<strong>2011</strong> and 2013). The aluminium commodity, gas and resin commodity contracts hedge anticipated future purchases of aluminium and gasrespectively, and mature between 2012 and 2014 (2010: between <strong>2011</strong> and 2013).not hedge accountedDerivatives are not used for trading purposes. However, some derivatives may not qualify for hedge accounting, or are specifically notdesignated as a hedge where natural offset is more appropriate.financial statements governancesustainabilitybusiness review
124<strong>Rexam</strong> annual report <strong>2011</strong>notes to the consolidated financial statements26 financial instruments continuednet investment hedgesAn analysis of the Group’s non derivative financial instruments designated as net investment hedges with respect to its subsidiaries,principally in the eurozone and the US, are set out below.Mediumterm notes£mUS publicbond£mAt 1 January <strong>2011</strong> (373) (43) (416)Net decrease in designations 13 41 54Exchange differences recognised in equity 12 2 14At 31 December <strong>2011</strong> (348) – (348)Total£mAt 1 January 2010 (483) (194) (677)Net decrease in designations 86 153 239Exchange differences recognised in equity 24 (2) 22At 31 December 2010 (373) (43) (416)An analysis of the notional amounts and maturity dates for derivative financial instruments is set out below.Maturitydate<strong>2011</strong>Notionalamounts£m2010Notionalamounts£mCurrencyFair value hedgesCross currency swaps Euro 2017 630 641Cross currency swaps Sterling 2017 (505) (505)Interest rate swaps Euro 2013 168 171Forward aluminium commodity contracts US dollar 2012 (4) (5)Cash flow hedgesForward foreign exchange contracts US dollar 2012 to 2014 177 141Forward foreign exchange contracts Sterling 2012 (30) (24)Forward foreign exchange contracts Swedish krone 2012 (17) (21)Forward aluminium commodity contracts US dollar 2012 to 2014 493 408Forward gas commodity contracts US dollar 2012 to 2014 8 8Forward resin commodity contracts US dollar 2012 5 –Not hedge accountedCross currency swaps Sterling 2017 505 505Cross currency swaps US dollar 2017 (654) (654)Interest rate swaps US dollar 2012 to 2014 803 364Interest rate swaps Euro 2014 168 –Forward foreign exchange contracts US dollar 2012 to 2014 52 (210)Forward aluminium commodity contracts US dollar 2012 (17) –Forward resin commodity contracts US dollar <strong>2011</strong> – 2For forward foreign exchange contracts, there are other currencies traded which have been excluded as the fair values for these contractswere immaterial.
12527 retirement benefit obligations(i) summaryUKdefinedbenefitpensions£mUSdefinedbenefitpensions£mOtherdefinedbenefitpensions£mTotaldefinedbenefitpensions£mOtherpensions£mTotalpensions£mRetireemedical£mGrossretirementbenefitobligations£mAt 1 January <strong>2011</strong> 19 (315) (38) (334) (18) (352) (111) (463)Exchange differences – (1) 1 – – – (1) (1)Service cost – continuing operations (7) (5) (1) (13) (10) (23) (1) (24)Service cost – discontinued operations – – – – (1) (1) – (1)Net finance (cost)/credit (see note below) 11 (15) (2) (6) – (6) (6) (12)Actuarial losses (68) (27) (7) (102) – (102) (4) (106)Cash contributions and benefits paid 32 11 3 46 10 56 9 65Transfers – 2 – 2 – 2 – 2At 31 December <strong>2011</strong> (13) (350) (44) (407) (19) (426) (114) (540)overviewAt 1 January 2010 (11) (218) (37) (266) (19) (285) (111) (396)Exchange differences – (11) – (11) 1 (10) (5) (15)Service cost – continuing operations (9) (4) (1) (14) (9) (23) (1) (24)Service cost – discontinued operations – (1) – (1) (3) (4) – (4)Exceptional items – discontinued operations – 2 – 2 – 2 – 2Net finance (cost)/credit 8 (14) (2) (8) – (8) (7) (15)Actuarial (losses)/gains 9 (73) (1) (65) – (65) 1 (64)Cash contributions and benefits paid 22 2 3 27 12 39 12 51Transfers – 2 – 2 – 2 – 2At 31 December 2010 19 (315) (38) (334) (18) (352) (111) (463)Pension assets – 19Retirement benefit obligations (540) (482)Gross retirement benefit obligations (540) (463)Tax 169 146Net retirement benefit obligations (371) (317)In addition to the £12m net finance cost for <strong>2011</strong> set out above, there is also a £4m transfer from the available for sale financial assetsreserve relating to market value losses transferred to the consolidated income statement following the annuitisation of certain pensionobligations. This gives a total net finance cost for <strong>2011</strong> of £16m as disclosed in the consolidated income statement.The Group operates various defined benefit pension plans throughout the world, the largest being the funded plans in the UK and the US.With respect to the UK, a full actuarial valuation by a qualified actuary was carried out as at 31 March <strong>2011</strong>. This valuation is in its finalstages and it is expected that the plan will be fully funded at that date. The next full actuarial valuation is due no later than 31 March 2014.With respect to the US, a full actuarial valuation by a qualified actuary is carried out annually, the latest being as at 1 January <strong>2011</strong>.As part of the 31 March <strong>2011</strong> UK valuation, <strong>Rexam</strong> <strong>PLC</strong> and the trustees to the plan expect to agree a six year escrow investment withcontributions of £10m in 2012 and £15m for each of the following five years. At each subsequent valuation date, the assets in escrow willeither be allocated to the plan, to <strong>Rexam</strong> <strong>PLC</strong>, or remain in escrow subject to the funding position of the plan. If there is a change of controlwith a subsequent material decline in <strong>Rexam</strong>’s credit rating or <strong>Rexam</strong>’s financial covenant, the escrow would be paid into the plan.In 2009, <strong>Rexam</strong> <strong>PLC</strong> entered into a security agreement with the trustees of the UK pension plan, granting them a charge over the BeverageCans UK facilities and machinery at Milton Keynes and Wakefield, enforceable up to 1 January 2013 in the event of a contribution defaultor a material decline in <strong>Rexam</strong>’s financial covenant.IFRIC 14 ‘IAS19 – The limit on a defined benefit asset, minimum funding requirements and their interaction’ had no impact on the Group in<strong>2011</strong> or 2010.<strong>2011</strong>£m2010£mfinancial statements governancesustainabilitybusiness review
126<strong>Rexam</strong> annual report <strong>2011</strong>notes to the consolidated financial statements27 retirement benefit obligations continued(ii) defined benefit pension plansUK<strong>2011</strong>£m(a) Amounts recognised in the consolidatedbalance sheetFair value of plan assets 1,719 1,079 13 2,811 1,598 1,026 13 2,637Present value of funded obligations (1,732) (1,380) (20) (3,132) (1,579) (1,295) (16) (2,890)Funded defined benefit pension plans (13) (301) (7) (321) 19 (269) (3) (253)Present value of unfunded obligations – (49) (37) (86) – (46) (35) (81)Net (liability)/asset (13) (350) (44) (407) 19 (315) (38) (334)US<strong>2011</strong>£mOther<strong>2011</strong>£mTotal<strong>2011</strong>£mUK2010£mUS2010£mOther2010£mTotal2010£m(b) Amounts recognised in the consolidatedincome statementContinuing operationsCurrent service cost (7) (5) (1) (13) (8) (4) (1) (13)Past service cost – – – – (1) – – (1)Exceptional items – past service credit – – – – – (1) – (1)Exceptional items – curtailments – – – – – 1 – 1Employee benefit expense (7) (5) (1) (13) (9) (4) (1) (14)Expected return on plan assets 95 46 1 142 92 52 – 144Interest cost (84) (61) (3) (148) (84) (66) (2) (152)Net finance (cost)/credit 11 (15) (2) (6) 8 (14) (2) (8)Total 4 (20) (3) (19) (1) (18) (3) (22)Discontinued operationsCurrent service cost – – – – – (1) – (1)Exceptional items – curtailment – – – – – 2 – 2Employee benefit expense – – – – – 1 – 1(c) Amounts recognised in the consolidatedstatement of comprehensive incomeActuarial gains/(losses) on plan assets 52 88 (1) 139 57 46 1 104Actuarial losses on retirement benefit obligations (120) (115) (6) (241) (48) (119) (2) (169)Total (68) (27) (7) (102) 9 (73) (1) (65)(d) Changes in the fair value of plan assetsAt 1 January 1,598 1,026 13 2,637 1,489 980 11 2,480Exchange differences – 2 (2) – – 44 – 44Expected return on plan assets 95 46 1 142 92 52 – 144Actuarial gains/(losses) 52 88 (1) 139 57 46 1 104Employer contributions 32 9 1 42 22 – 1 23Plan participant contributions 2 – 1 3 2 – 1 3Benefits paid (60) (92) – (152) (64) (96) (1) (161)At 31 December 1,719 1,079 13 2,811 1,598 1,026 13 2,637
12727 retirement benefit obligations continuedUK<strong>2011</strong>%(e) Major categories of plan assetsEquities 45 12 74 32 50 18 74 38Bonds 54 88 23 67 49 82 22 61Cash and other 1 – 3 1 1 – 4 1US<strong>2011</strong>%Other<strong>2011</strong>%Total<strong>2011</strong>%UK2010%US2010%Other2010%Total2010%(f) changes in the present value of defined benefit pension obligationsUK<strong>2011</strong>£mUS<strong>2011</strong>£mAt 1 January (1,579) (1,341) (51) (2,971) (1,500) (1,198) (48) (2,746)Exchange differences – (3) 3 – – (55) – (55)Current service cost – continuing operations (7) (5) (1) (13) (8) (4) (1) (13)Current service cost – discontinued operations – – – – – (1) – (1)Past service cost – continuing operations – – – – (1) – – (1)Exceptional items – discontinued operations – – – – – 2 – 2Interest cost (84) (61) (3) (148) (84) (66) (2) (152)Actuarial losses (120) (115) (6) (241) (48) (119) (2) (169)Plan participant contributions (2) – (1) (3) (2) – (1) (3)Benefits paid 60 94 2 156 64 98 3 165Transfer from available for sale financial assets – 2 – 2 – 2 – 2At 31 December (1,732) (1,429) (57) (3,218) (1,579) (1,341) (51) (2,971)(g) principal actuarial assumptionsFuture salary increases 4.60 4.00 3.10 5.00 4.00 3.08Future pension increases 3.10 – 1.32 3.50 – 1.35Discount rate 4.70 4.00 4.54 5.40 4.90 5.20Inflation rate 3.10 2.50 2.00 3.50 2.50 2.00Expected return on plan assets(net of administration expenses):Equities 6.11 7.46 7.00 7.51 7.67 8.25Bonds 3.51 4.46 3.60 4.61 4.37 3.90Cash and other 0.31 2.56 0.20 0.31 2.77 1.00To develop the expected return on plan assets assumptions, the Group considered the current level of expected returns on risk freeinvestments, primarily government bonds, the historical level of the risk premium associated with the asset class concerned and theexpectations for future returns of the asset class. The resulting returns for equities, bonds and cash were then reduced to allow foradministration expenses.The mortality assumptions used in valuing the liabilities of the UK pension plan are based on the standard tables S1NA as published bythe Institute and Faculty of Actuaries. These tables are adjusted to reflect the circumstances of the plan membership. The life expectancyassumed for a 65 year old pensioner is 86.9 years (2010: 86.2 years) for a male and 89.1 years (2010: 89.3 years) for a female.The life expectancy for a non pensioner currently aged 45 is 88.7 years (2010: 88.4 years) for a male and 90.9 years (2010: 91.7 years)for a female.The mortality assumptions used in valuing the liabilities of the US pension plans are based on the RP2000 combined active and retireemortality table projected to 2017 (2010: 2017), weighted 70% blue collar and 30% white collar. The life expectancy assumed for a65 year old pensioner is 83.6 years (2010: 83.6 years) for a male and 85.7 years (2010: 85.7 years) for a female.UK<strong>2011</strong>%Other<strong>2011</strong>£mUS<strong>2011</strong>%Total<strong>2011</strong>£mUK2010£mOther<strong>2011</strong>%US2010£mUK2010%Other2010£mUS2010%Total2010£mOther2010%financial statements governancesustainabilitybusiness reviewoverview
128<strong>Rexam</strong> annual report <strong>2011</strong>notes to the consolidated financial statements27 retirement benefit obligations continued(h) historic information on defined benefit plansFair value of plan assets 2,811 2,637 2,480 2,505 2,361Present value of defined benefit obligations (3,218) (2,971) (2,746) (2,586) (2,424)Net liability (407) (334) (266) (81) (63)<strong>2011</strong>£m2010£m2009£m2008£m2007£mCumulative actuarial (losses)/gains (130) (28) 37 223 253<strong>2011</strong> 2010 2009 2008 2007Experience gains/(losses) arising on plan assets:Amount (£m) 139 104 73 (221) 81Percentage of plan assets (%) 5 4 3 (9) 3Experience (losses)/gains arising on defined benefit obligations:Amount (£m) (241) (169) (259) 191 136Percentage of present value of defined benefit obligations (%) (7) (6) (9) 7 6The Group expects to contribute £53m in cash to its defined benefit pension plans in 2012, excluding any amounts deposited in escrow.(iii) other pension plansThe Group operates a number of US based defined contribution plans, included as part of other pensions in (i) above, for which the chargein the consolidated income statement for the year was £7m for continuing operations and £1m for discontinued operations (2010: £7mand £3m) and total cash contributions were £8m (2010: £10m).(iv) retiree medicalCertain current and former employees in the US are provided with cover for medical costs and life assurance, referred to in theseconsolidated financial statements as retiree medical. These unfunded benefits are assessed with the advice of a qualified actuary.(a) Amounts recognised in the consolidated balance sheetPresent value of the retiree medical obligation (114) (111)<strong>2011</strong>£m2010£m(b) Amounts recognised in the consolidated income statementContinuing operationsCurrent service cost (1) (1)Interest cost (including administration costs of £1m (2010: £1m)) (6) (7)(7) (8)(c) Amounts recognised in the consolidated statement of comprehensive incomeActuarial (losses)/gains (4) 1(d) Changes in the present value of the retiree medical obligationAt 1 January (111) (111)Exchange differences (1) (5)Current service cost (1) (1)Interest cost (6) (7)Actuarial (losses)/gains (4) 1Benefits paid 9 12At 31 December (114) (111)
12927 retirement benefit obligations continued(e) principal actuarial assumptions<strong>2011</strong>2010%%Discount rate 4.00 4.90Healthcare cost trend rate8.00 reducing to4.50 over 16 years8.30 reducing to4.50 over 17 yearsThe mortality assumptions used in valuing the liabilities for retiree medical are based on the RP2000 combined active and retiree tableprojected to 2017 (2010: 2017), weighted 85% blue collar and 15% white collar. The life expectancy assumed for a 65 year oldpensioner is 83.4 years (2010: 83.4 years) for a male and 85.5 years (2010: 85.5 years) for a female.Healthcare cost trend rates do not have a significant impact on the Group with respect to retiree medical. A one percentage point changein assumed rates would have the impact as set out below.1% increase – service cost and interest cost combined increase – –1% increase – retiree medical obligation increase (3) (3)1% decrease – service cost and interest cost combined reduction – –1% decrease – retiree medical obligation reduction 3 3(f) historic information on retiree medical<strong>2011</strong> 2010 2009 2008 2007Present value of retiree medical obligation (£m) (114) (111) (111) (127) (98)Cumulative actuarial gains (£m) 16 20 19 14 15Experience (losses)/gains arising on retiree medical obligation:Amount (£m) (4) 1 5 (1) –Percentage of present value of retiree medical obligation (%) (4) 1 5 (1) –28 provisionsEnvironmentalcompliance£mRestructuringof businesses£mIndirect taxexposures£mRegulatoryand otherclaims£m<strong>2011</strong>£mSharebasedpayment£mAt 1 January <strong>2011</strong> (21) (21) (32) (22) (6) (102)Exchange differences – – 2 – – 2Charge for the year – (19) (3) – (11) (33)Release for the year – – – 5 – 5Utilised 2 20 – 2 – 24Transfers – (2) – – – (2)At 31 December <strong>2011</strong> (19) (22) (33) (15) (17) (106)Current liabilities (5) (20) – (11) – (36)Non current liabilities (14) (2) (33) (4) (17) (70)At 31 December <strong>2011</strong> (19) (22) (33) (15) (17) (106)Current liabilities (3) (18) – (18) – (39)Non current liabilities (18) (3) (32) (4) (6) (63)At 31 December 2010 (21) (21) (32) (22) (6) (102)Environmental compliance mainly relates to the US and France and is long term in nature with the timing of utilisation unknown due to theneed to complete remedial investigations, to negotiate remedial plans with local authorities and to implement agreed plans. The provisionfor restructuring of businesses comprises £15m relating to Plastic Packaging in respect of restructuring following the disposal of Closuresand £7m relating to Beverage Cans for previously announced plant closures. Indirect tax exposures relate to Brazil and are long term innature, with the timing of payment, if any, dependent upon the outcome of tax cases and exposures. Regulatory and other claims relate tovarious proceedings where the timing of payment, if any, is dependent upon the outcome of the proceedings. Share based paymentrelates to cash settled share option schemes, the timing of payment being dependent on various performance criteria being met.2010£mTotal£mfinancial statements governancesustainabilitybusiness reviewoverview
130<strong>Rexam</strong> annual report <strong>2011</strong>notes to the consolidated financial statements29 share capital<strong>2011</strong>Thousands2010ThousandsNumber of issued and fully paid ordinary shares of 64 2 /7pAt 1 January 876,864 876,829Issued under employee share option schemes 167 35At 31 December 877,031 876,864The rights and restrictions attaching to the shares and the provisions relating to the transfer of shares are as governed by law and inaccordance with the Company’s articles of association. Holders of shares are entitled to receive all shareholder documents, to attend,speak and exercise voting rights, either in person or by proxy, on resolutions proposed at general meetings and participate in anydistribution of income or capital. The directors may refuse to register a transfer of shares where such transfer documents are not lodged byacceptable means or proof of title is required. Shares are held by the <strong>Rexam</strong> Employee Share Trust (Trust) for the satisfaction of certainshare options (note 31). The independent trustee of the Trust has the same rights as any other shareholder. Participants in option schemesdo not hold any voting rights on the shares until the date of exercise. There are no restrictions on the voting rights of holders of shares norany known agreements between holders of shares under which financial rights are held by any person other than the registered holder, orvoting rights or the transfer of shares are restricted.30 other reservesTranslationreserve£mNetinvestmenthedgereserve£mCash flowhedgereserve£mAvailablefor salefinancialassetsreserve£mAt 1 January <strong>2011</strong> 429 (104) 64 (3) 386Cost recognised in the income statement on annuitisation ofcertain pension obligations (net of tax) – – – 3 3Exchange differences before recognition of net investment hedges (30) – – – (30)Net investment hedges recognised – 14 – – 14Exchange differences recognised in the income statement ondisposal of Closures (89) – – – (89)Cash flow hedges recognised – – (92) – (92)Cash flow hedges transferred to inventory – – (16) – (16)Tax on cash flow hedges – – 28 – 28At 31 December <strong>2011</strong> 310 (90) (16) – 204Total£mAt 1 January 2010 441 (126) 51 (4) 362Exchange differences before recognition of net investment hedges (12) – – – (12)Net investment hedges recognised – 22 – – 22Cash flow hedges recognised – – 40 – 40Tax on cash flow hedges – – (4) – (4)Cash flow hedges transferred to inventory – – (25) – (25)Cash flow hedges transferred to the income statement – – 2 – 2Changes in market value of available for sale financial assets – – – 1 1At 31 December 2010 429 (104) 64 (3) 386
13131 share based payment(i) summary of <strong>Rexam</strong>’s share based payment schemesScheme name Abbreviation Scheme status Settlement basisLong Term Incentive Plan 2009 LTIP Open Equity and cashLong Term Incentive Plan 2007 LTIP 2007 Closed EquityExecutive Share Option Scheme ESOS Closed EquityPhantom Stock Plan Phantoms Closed CashSavings Related Share Option Schemes SAYE Open EquityLTIPThe LTIP is the primary long term incentive plan for <strong>Rexam</strong>’s executive directors, band 1 executives and other senior management. The LTIPmeasures performance targets over a three year period. Options will normally vest, subject to performance targets being achieved, on thethird anniversary of the date of grant at a nominal cost to the employee. Employees who leave with a right to exercise options mustnormally wait until the end of the measurement period. If the option vests, the employee will receive an entitlement which normally will betime apportioned for the period from the start of the measurement period to the date on which employment ended.Options granted in <strong>2011</strong> to executive directors and band 1 executives are subject to three performance conditions, compound annualgrowth in underlying earnings per share (EPS), return on capital employed (ROCE) and relative Total Shareholder Return (TSR), in theproportion 33%, 33% and 33%, respectively. These options are equity settled. Options granted in <strong>2011</strong> to other senior management aresubject to two performance conditions, EPS and ROCE, in the proportion 67% and 33% respectively. These options are either equitysettled or cash settled depending on the seniority of the employee.Options granted in <strong>2011</strong> include a dividend equivalent element whereby employees will be entitled to receive, in shares or cash, thenotional dividends paid during the measurement period on any options that vest.For further details of the LTIP refer to the remuneration report.LTIP 2007Prior to 2009, annual grants of options were made to executive directors and senior executives under the LTIP 2007. All outstandingoptions lapsed in <strong>2011</strong>.ESOSPrior to 2009, annual grants of options over ordinary shares were made to certain senior management. For grants up to andincluding 2006, shares vested if a performance target (growth in economic profit) was met over the three year measurement period.No performance targets were set for the 2007 and 2008 grants. Options are exercisable three years after grant date and expire ten yearsafter grant date. The exercise price was set at market value using the market price of a <strong>Rexam</strong> share at the grant date.PhantomsThis cash settled scheme operates in the same way as the ESOS scheme and relates to certain senior management located outside the UKand Europe.SAYEAll employee SAYE schemes are open to eligible employees resident in the UK and Ireland. <strong>Annual</strong> grants of options over shares arecurrently made at an exercise price of 80% of the market value of <strong>Rexam</strong> shares at the grant date. Options vest three, five or sevenyears after the commencement of the savings contract, depending on the term selected by the employee at grant and expire sixmonths after vesting.(ii) employee benefit expenseEquity settled 9 6Cash settled 10 5Total 19 11<strong>2011</strong>£m2010£mfinancial statements governancesustainabilitybusiness reviewoverview
132<strong>Rexam</strong> annual report <strong>2011</strong>notes to the consolidated financial statements31 share based payment continued(iii) key assumptions used in valuing options granted during the yearLTIPSAYEValuation models TSR – Monte Carlo BinomialEPS/ROCE – Black – ScholesExpected dividend growth (%) – 3.8Expected historical volatility (%) TSR – 25.4 to 36.4 29 to 35Risk free interest rate (%) TSR – 0.85 to 1.85 0.9 to 1.9Expected life (years) 2.2 to 2.7 3.25, 5.25, 7.25Weighted average share price (£) 3.40 to 3.70 3.40Weighted average fair value (£) 2.38 to 3.70 0.84 to 0.89The assumptions made to incorporate the effects of expected early exercise have been included by assuming an expected option lifebased on historical exercise patterns for each option scheme. Historical volatilities are arrived at using a period comparable with theexpected life of the option. The correlation coefficient for LTIP is calculated using the correlation matrix for the TSR simulation using threeyear daily historical stock price series for each company in the comparator group, including <strong>Rexam</strong>, from the beginning of themeasurement period.(iv) number of options and weighted average exercise prices of all option schemes<strong>2011</strong>Number ofoptionsThousands<strong>2011</strong>Weighted averageexercise price£2010Number ofoptionsThousands2010Weighted averageexercise price£Outstanding at 1 January 21,502 1.18 13,043 2.34Granted 10,857 0.05 13,195 0.04Exercised (252) 2.71 (93) 0.89Lapsed (3,771) 0.52 (4,643) 1.22Outstanding at 31 December 28,336 0.82 21,502 1.18Exercisable at 31 December 4,823 3.98 2,665 4.06(v) exercise prices and average remaining contractual lives of options by scheme<strong>2011</strong>Number ofoptionsThousands<strong>2011</strong>Range ofexercise prices£<strong>2011</strong>Weighted averageremainingcontractual lifeYears2010Number ofoptionsThousands2010Range ofexercise prices£2010Weighted averageremainingcontractual lifeYearsLTIP 21,674 – 1.7 12,224 – 2.2LTIP 2007 – – – 2,058 – 4.2ESOS 2,808 2.71 to 4.58 5.5 3,090 2.14 to 4.61 6.3SAYE 1,878 2.12 to 3.88 2.8 1,866 2.12 to 3.88 3.4Phantoms 1,976 2.71 to 4.57 5.4 2,264 2.71 to 4.57 6.3(vi) <strong>Rexam</strong> Employee Share TrustThe Group operates an employee share trust, the <strong>Rexam</strong> Employee Share Trust, that owns 7,468,028 ordinary shares of 64 2 / 7p in <strong>Rexam</strong><strong>PLC</strong> at 31 December <strong>2011</strong> (2010: 2,468,028) acquired at an average cost per share of £3.50 (2010: £3.38) and included in theconsolidated balance sheet within retained earnings at a cost of £26m (2010: £8m). These shares will be used to satisfy LTIP exercises.The purchases are funded by cash contributions from participating companies. Dividends receivable during the year have been waived.The administration expenses of the Trust are borne by the Trust. Shares are allocated by the Trust when related LTIP options are exercised.The market value of the shares at 31 December <strong>2011</strong> was £26m (2010: £8m).
13332 reconciliation of profit/(loss) before tax to cash generated/(used) from operations<strong>2011</strong>Continuingoperations£m<strong>2011</strong>Discontinuedoperations£m<strong>2011</strong>Totaloperations£m2010Continuingoperations£m2010Discontinuedoperations£m2010Totaloperations£mProfit/(loss) before tax 431 (26) 405 338 (177) 161Adjustments for:Share of post tax profits of associates and joint ventures (9) – (9) (5) – (5)Net interest expense 69 – 69 125 – 125Impairment of goodwill – – – – 59 59Impairment of intangible assets – 20 20 – 65 65Impairment of property, plant and equipment 7 14 21 6 55 61Reversal of impairment of property, plant and equipment (1) – (1) (3) – (3)Depreciation of property, plant and equipment 179 – 179 183 21 204Amortisation of intangible assets 38 – 38 46 15 61Movement in working capital (19) (24) (43) (20) – (20)Movement in provisions 5 (1) 4 (8) (2) (10)Movement in retirement benefit obligations (29) 1 (28) (12) 2 (10)Other adjustments (7) 2 (5) (3) – (3)Cash generated/(used) from operations 664 (14) 650 647 38 68533 contingent liabilitiesIn an international group a variety of claims arise from time to time; some have little or no foundation in law or in fact and others cannotbe quantified. The claims include litigation against Group companies, investigations by regulatory and fiscal authorities and obligationsarising under environmental legislation. Provision has been made in these consolidated financial statements against those claims whichthe directors consider are likely to result in significant liabilities. There are no contingent liabilities at 31 December <strong>2011</strong> or 31 December2010 that require disclosure.34 commitments(i) operating lease commitmentsThe Group leases offices and warehouses under non cancellable operating leases. The leases have varying terms, purchase options,escalation clauses and renewal rights. The Group also leases plant and equipment under cancellable operating leases.An analysis of the total future minimum lease payments under non cancellable operating leases is set out below.<strong>2011</strong>Property£m<strong>2011</strong>Plant andequipment£m2010Property£m2010Plant andequipment£mLess than 1 year 23 5 22 2Between 1 and 5 years 43 5 47 2Over 5 years 43 – 42 –Total 109 10 111 4Total future minimum sublease receipts under non cancellable operating leases are £8m (2010: £10m).(ii) capital commitmentsContracts placed for future capital expenditure not provided in the consolidated financial statements:Property, plant and equipment 52 51<strong>2011</strong>£m2010£mfinancial statements governancesustainabilitybusiness reviewoverview
134<strong>Rexam</strong> annual report <strong>2011</strong>five year financial summaryFor the year ended 31 DecemberConsolidated income statementContinuing operationsSales 4,734 4,619 4,533 4,254 3,423Underlying operating expenses (4,185) (4,106) (4,115) (3,831) (3,097)Underlying operating profit 549 513 418 423 326Underlying share of post tax profits of associates and joint ventures 9 5 2 2 –Retirement benefit obligations net finance cost (16) (15) (31) (7) (14)Underlying net interest expense (92) (113) (131) (132) (94)Underlying profit before tax 450 390 258 286 218Exceptional and other items 1 (19) (52) (124) (65) 22Profit before tax 431 338 134 221 240Tax (128) (102) (44) (62) (78)Profit for the financial year 303 236 90 159 162Discontinued operationsProfit/(loss) for the financial year 73 (112) (119) 12 78Total profit/(loss) for the financial year 376 124 (29) 171 240<strong>2011</strong>£m2010£m2009£m2008£m2007£mAs at 31 DecemberConsolidated balance sheetGoodwill and other intangible assets 2,177 2,231 2,481 2,949 2,216Property, plant and equipment 1,590 1,571 1,723 1,982 1,310Retirement benefit obligations (net of tax) (371) (317) (279) (170) (128)Other net assets/(liabilities) 235 524 225 16 (3)Underlying net assets 3,631 4,009 4,150 4,777 3,395<strong>2011</strong>£m2010£m2009£m2008£m2007£mShareholders’ equity 2,319 2,322 2,320 2,174 1,831Non controlling interests – 3 2 2 2Total equity 2,319 2,325 2,322 2,176 1,833Net borrowings 1,312 1,684 1,828 2,601 1,562Capital employed 3,631 4,009 4,150 4,777 3,395StatisticsUnderlying return on sales 2 % 11.6 11.1 9.2 9.9 9.5Underlying earnings per share 2 Pence 36.1 31.4 23.0 27.7 22.4Basic earnings per share 3 Pence 34.7 27.1 11.4 22.2 23.5Dividends per ordinary share 4 Pence 14.4 12.0 8.0 18.7 17.8Interest cover 5 Times 6.0 4.5 3.2 3.2 3.5Free cash flow £m 245 316 290 (128) 24Capital expenditure (gross) £m 240 206 184 389 311Return on net assets 6 % 29.5 27.0 22.1 27.5 30.3Return on capital employed 7 % 13.7 12.3 9.5 11.0 11.9Gearing % 57 72 79 120 85Average number of employees 3 Number 19,000 19,600 20,700 22,500 21,1001 Other items comprise the amortisation of certain acquired intangible assets and fair value changes on financing derivatives.2 Based on continuing operations before exceptional and other items.3 Based on continuing operations.4 Includes proposed final dividends.5 Based on underlying operating profit from continuing operations and underlying net interest expense from continuing operations.6 Underlying operating profit from total operations (excluding Glass, sold in 2007) plus share of associates and joint ventures profit after tax divided by the average of opening and closingshareholders’ equity after adding back retirement benefit obligations (net of tax) and net borrowings and excluding goodwill and certain acquired intangible assets.7 Underlying operating profit from total operations (excluding Glass, sold in 2007) plus share of associates and joint ventures profit after tax divided by the average of opening and closingshareholders’ equity after adding back retirement benefit obligations (net of tax) and net borrowings.
135companyfinancialstatements136 independent auditors’ report to the members of <strong>Rexam</strong> <strong>PLC</strong>137 <strong>Rexam</strong> <strong>PLC</strong> balance sheetnotes to the Company financial statements:138 note 1 – principal accounting policies139 note 2 – employee costs and numbers139 note 3 – equity dividends140 note 4 – tangible assets140 note 5 – investments in subsidiaries141 note 6 – debtors receivable within one year141 note 7 – other creditors141 note 8 – borrowings142 note 9 – derivative financial instruments142 note 10 – operating lease commitments142 note 11 – contingent liabilities143 note 12 – capital and reserves143 note 13 – share based paymentfinancial statements governance sustainabilitybusiness reviewoverview<strong>Rexam</strong> produces a variety of can ends, some ofwhich have coloured and customised tabs – givingour customers an enhanced on-shelf presence.
136 <strong>Rexam</strong> annual report <strong>2011</strong>independent auditors’ report to the members of <strong>Rexam</strong> <strong>PLC</strong>We have audited the Company financial statements of <strong>Rexam</strong> <strong>PLC</strong> for the year ended 31 December <strong>2011</strong> which comprise the <strong>Rexam</strong> <strong>PLC</strong>balance sheet and the related notes. The financial reporting framework that has been applied in their preparation is applicable law andUnited Kingdom Accounting Standards (United Kingdom Generally Accepted Accounting Practice).respective responsibilities of directors and auditorsAs explained more fully in the statement of directors’ responsibilities set out on page 81, the directors are responsible for the preparation ofthe Company financial statements and for being satisfied that they give a true and fair view. Our responsibility is to audit and express anopinion on the Company financial statements in accordance with applicable law and International Standards on Auditing (UK andIreland). Those standards require us to comply with the Auditing Practices Board’s Ethical Standards for Auditors.This report, including the opinions, has been prepared for and only for the company’s members as a body in accordance with Chapter 3of Part 16 of the Companies Act 2006 and for no other purpose. We do not, in giving these opinions, accept or assume responsibility forany other purpose or to any other person to whom this report is shown or into whose hands it may come save where expressly agreed byour prior consent in writing.scope of the audit of the financial statementsAn audit involves obtaining evidence about the amounts and disclosures in the financial statements sufficient to give reasonable assurancethat the financial statements are free from material misstatement, whether caused by fraud or error. This includes an assessment of: whetherthe accounting policies are appropriate to the Company’s circumstances and have been consistently applied and adequately disclosed;the reasonableness of significant accounting estimates made by the directors; and the overall presentation of the financial statements. Inaddition, we read all the financial and non financial information in the <strong>Rexam</strong> annual report <strong>2011</strong> to identify material inconsistencies withthe audited financial statements. If we become aware of any apparent material misstatements or inconsistencies we consider theimplications for our report.opinion on financial statementsIn our opinion the Company financial statements:• give a true and fair view of the state of the company’s affairs as at 31 December <strong>2011</strong>;• have been properly prepared in accordance with United Kingdom Generally Accepted Accounting Practice; and• have been prepared in accordance with the requirements of the Companies Act 2006.opinion on other matters prescribed by the Companies Act 2006In our opinion:• the part of the remuneration report to be audited has been properly prepared in accordance with the Companies Act 2006; and• the information given in the directors’ report for the financial year for which the Company financial statements are prepared isconsistent with the Company financial statements.matters on which we are required to report by exceptionWe have nothing to report in respect of the following matters where the Companies Act 2006 requires us to report to you if, in our opinion:• adequate accounting records have not been kept by the Company, or returns adequate for our audit have not been received frombranches not visited by us; or• the Company financial statements and the part of the remuneration report to be audited are not in agreement with the accountingrecords and returns; or• certain disclosures of directors’ remuneration specified by law are not made; or• we have not received all the information and explanations we require for our audit.other matterWe have reported separately on the consolidated financial statements of <strong>Rexam</strong> <strong>PLC</strong> for the year ended 31 December <strong>2011</strong>.Robert Milburn (Senior Statutory Auditor)for and on behalf of PricewaterhouseCoopers LLPChartered Accountants and Statutory AuditorsLondon22 February 2012
137<strong>Rexam</strong> <strong>PLC</strong> balance sheetAs at 31 DecembernotesFixed assetsTangible assets 4 14 15Investments in subsidiaries 5 5,202 5,204Derivative financial instruments 9 276 2435,492 5,462Current assetsDebtors receivable within one year 6 20 14Derivative financial instruments 9 10 27Cash at bank and in hand 343 69373 110Creditors: amounts falling due within one yearBorrowings 8 (39) (41)Derivative financial instruments 9 (2) (3)Other creditors 7 (333) (420)(374) (464)Net current liabilities (1) (354)Total assets less current liabilities 5,491 5,108Creditors: amounts falling due after more than one yearBorrowings 8 (1,753) (1,753)Derivative financial instruments 9 (170) (184)Other creditors 7 (693) (674)(2,616) (2,611)Provisions for liabilities and charges (2) (1)Net assets 2,873 2,496Capital and reservesOrdinary share capital 564 564Share premium account 989 989Capital redemption reserve 351 351Profit and loss reserve 814 437Other reserves 155 155Total capital and reserves 12 2,873 2,496Approved by the board on 22 February 2012Graham Chipchase, chief executiveDavid Robbie, finance director<strong>2011</strong>£m2010£mfinancial statements governancesustainabilitybusiness reviewoverview
138 <strong>Rexam</strong> annual report <strong>2011</strong>notes to the Company financial statements1 principal accounting policiesThe financial statements of <strong>Rexam</strong> <strong>PLC</strong> are prepared under UK GAAP using the historical cost convention as modified by the revaluationof certain financial instruments and share based payments and in accordance with applicable accounting standards. As permitted bysection 408 of the Companies Act 2006, the profit and loss account is not presented.foreign currenciesAll exchange differences arising on foreign currencies are taken to the profit and loss account.interestInterest on cash and cash equivalents and borrowings held at amortised cost is recognised in the profit and loss account using the effectiveinterest method. Interest includes exchange differences arising on cash and cash equivalents and borrowings. Interest includes all fairvalue gains and losses on derivative financial instruments, and corresponding adjustments to hedged items under designated fair valuehedging relationships, where they relate to financing activities and are recognised in the profit and loss account.retirement benefitsThe pension rights of <strong>Rexam</strong> <strong>PLC</strong> employees are dealt with through a self administered scheme, the assets of which are held independentlyof the Group. The scheme is a defined benefit scheme that is funded partly by contributions from members and partly by contributions from<strong>Rexam</strong> <strong>PLC</strong> and its subsidiaries at rates advised by independent professionally qualified actuaries. In accordance with FRS17, <strong>Rexam</strong> <strong>PLC</strong>accounts for its contributions as though it were a defined contribution scheme. This is because the underlying assets and liabilities of thescheme cover <strong>Rexam</strong> <strong>PLC</strong> and a number of its subsidiaries and it cannot be split between each subsidiary on a consistent and reasonablebasis, as the scheme has a large number of members who were employed by companies which are no longer in existence or are no longerpart of the Group. An actuarial valuation at a Group level on an FRS17 basis has not been performed, but a deficit at 31 December <strong>2011</strong>of £13m (2010: surplus £19m) has been calculated in accordance with IAS19. Further details of the scheme and its accounting deficit canbe found in note 27 to the consolidated financial statements.share based payment<strong>Rexam</strong> <strong>PLC</strong> operates various equity settled share option schemes. The services received from employees are measured by reference tothe fair value of the share options. The fair value is calculated at grant date and recognised in the profit and loss account, together with acorresponding increase in shareholders’ funds. Equity settled share options granted directly to subsidiary company employees are treatedas a capital contribution to the subsidiary. The capital contribution is measured by reference to the fair value of the share options andrecognised as an increase in the cost of investment with a corresponding increase in shareholders’ funds. The recognition of the fair valueis based on a straight line basis over the vesting period, based on an estimate of the number of options that will eventually vest. Vestingconditions, which comprise service conditions and performance conditions, are not taken into account when estimating the fair value.All non vesting conditions are included in fair value. FRS20 has been applied to equity settled share options granted after 7 November2002. The <strong>Rexam</strong> Employee Share Trust holds shares in <strong>Rexam</strong> <strong>PLC</strong> which are presented in the balance sheet as a deduction fromshareholders’ funds.tangible fixed assetsTangible fixed assets are stated in the balance sheet at cost less provision for depreciation. Depreciation is calculated to write off the cost,less estimated residual value, of tangible fixed assets over their expected lives by equal annual instalments. Depreciation is provided on alltangible fixed assets. Assumed lives vary according to the class of asset as follows:Computer hardware and software2 to 7 yearsFixtures and fittings4 to 10 yearsinvestments in subsidiariesInvestments in subsidiaries are stated at cost less provisions for impairment where appropriate.dividendsUnder FRS21, final ordinary dividends payable to the shareholders of <strong>Rexam</strong> <strong>PLC</strong> are recognised in the period that they are approved bythe shareholders. Interim ordinary dividends payable are recognised in the period that they are paid. Dividends receivable are recognisedwhen the Company’s right to receive payment is established.
1391 principal accounting policies continuedfinancial instrumentsDerivative financial instruments are measured at fair value. Derivative financial instruments used by the Company include interest rateswaps, cross currency swaps, forward foreign exchange contracts and forward aluminium commodity contracts.Certain derivative financial instruments are designated as hedges in line with the Company’s risk management policies. Hedges areclassified as follows:(i) fair value hedges where they hedge the exposure to changes in the fair value of a recognised asset or liability.(ii) cash flow hedges where they hedge exposure to variability in cash flows that is attributable to a particular risk associated witha recognised asset or liability or a forecast transaction.For fair value hedges, any gain or loss from remeasuring the hedging instrument at fair value is recognised in the profit and loss account.Any gain or loss on the hedged item attributable to the hedged risk is adjusted against the carrying amount of the hedged item andsimilarly recognised in the profit and loss account.For cash flow hedges, the portion of the gain or loss on the hedging instrument that is determined to be an effective hedge is recognisedin reserves, with any ineffective portion recognised in the profit and loss account. When hedged cash flows result in the recognition of anon financial asset or liability, the associated gains or losses previously recognised in reserves are included in the initial measurement ofthe asset or liability. For all other cash flow hedges, the gains or losses that are recognised in reserves are transferred to the profit and lossaccount in the same period in which the hedged cash flows affect the profit and loss account.Any gains or losses arising from changes in fair value of derivative financial instruments not designated as hedges are recognisedimmediately in the profit and loss account.Borrowings are measured at amortised cost except where they are hedged by an effective fair value hedge, in which case the carryingvalue is adjusted to reflect the fair value movements associated with the hedged risk.Up front fees paid on the establishment of loan facilities are initially capitalised as transaction costs of the loan and amortised in interestover the expected term of the loan. Ongoing commitment fees are expensed in interest as incurred.Debtors are measured at amortised cost less any provision for impairment. Debtors are discounted when the time value of moneyis considered material.2 employee costs and numbersEmployee costs including directors:Wages and salaries 18 17Social security 2 2Retirement benefits 10 8Share based payment 4 2For details of directors’ remuneration see the remuneration report.<strong>2011</strong>£m2010£m34 29<strong>2011</strong>2010NumberNumberAverage employee numbers 126 1093 equity dividendsFor details of equity dividends see note 11 to the consolidated financial statements.financial statements governancesustainabilitybusiness reviewoverview
140<strong>Rexam</strong> annual report <strong>2011</strong>notes to the Company financial statements4 tangible assetsComputerhardwareand software£mFixtures andfittings£mCostAt 1 January <strong>2011</strong> 25 2 27Additions 2 1 3At 31 December <strong>2011</strong> 27 3 30Accumulated depreciationAt 1 January <strong>2011</strong> (11) (1) (12)Depreciation for the year (4) – (4)At 31 December <strong>2011</strong> (15) (1) (16)Total£mCarrying value at 31 December <strong>2011</strong> 12 2 14CostAt 1 January 2010 18 2 20Additions 7 – 7At 31 December 2010 25 2 27Accumulated depreciationAt 1 January 2010 (8) (1) (9)Depreciation for the year (3) – (3)At 31 December 2010 (11) (1) (12)Carrying value at 31 December 2010 14 1 155 investments in subsidiariesAt 1 January <strong>2011</strong> 2,000 3,204 5,204Exchange differences – (37) (37)Additions/advances 15 341 356Disposals/repayments – (321) (321)At 31 December <strong>2011</strong> 2,015 3,187 5,202Shares£mLoans£mTotal£mAt 1 January 2010 1,778 3,555 5,333Exchange differences – 42 42Additions/advances 611 1,007 1,618Disposals/repayments (389) (1,400) (1,789)At 31 December 2010 2,000 3,204 5,204For details of the principal subsidiaries of <strong>Rexam</strong> <strong>PLC</strong> see note 15 to the consolidated financial statements.
1416 debtors receivable within one yearTrade debtors 2 1Trade balances due from subsidiaries 2 2Prepayments 3 3Other debtors 13 8<strong>2011</strong>£m2010£m20 147 other creditorsAmounts falling due within one yearTrade creditors (3) (1)Interest bearing loans due to subsidiaries (306) (402)Other tax and social security (2) (2)Accruals (10) (12)Other creditors (12) (3)(333) (420)Amounts falling due after more than one yearDue to subsidiaries (693) (672)Other creditors – (2)8 borrowings<strong>2011</strong>£m2010£m(693) (674)UnsecuredBank overdrafts (1) –Bank loans net of capitalised financing fees 5 3US public bond (357) (357)US private placement (147) (147)Subordinated bond (736) (727)Medium term notes (556) (566)(1,792) (1,794)Repayment analysisAmounts falling due after more than one year:In more than one year but not more than two years (1,040) –In more than two years but not more than five years 5 (1,044)In more than five years (718) (709)(1,753) (1,753)Amounts falling due within one year (39) (41)(1,792) (1,794)In <strong>2011</strong> a fair value loss of £1m (2010: £nil) on medium term notes and a fair value gain of £10m (2010: loss of £5m) on the subordinatedbond under designated fair value hedge relationships were included in retained profit for the year.<strong>2011</strong>£m2010£mfinancial statements governancesustainabilitybusiness reviewoverview
142<strong>Rexam</strong> annual report <strong>2011</strong>notes to the Company financial statements9 derivative financial instrumentsFor details of the financial risk management objectives and policies and principal financial risks see note 26 to the consolidatedfinancial statements.Fair value of derivative financial instruments at 31 DecemberCross currency swaps 110 82Interest rate swaps 4 3Forward foreign exchange contracts – (2)<strong>2011</strong>£m2010£m114 83Market values have been used to calculate the fair value of cross currency swaps. The fair value of interest rate swaps has been determinedby discounting cash flows at prevailing interest rates. The fair value of forward foreign exchange contracts has been determined bymarking those contracts to market against prevailing forward foreign exchange rates.Fair value changes included in retained profit at 31 DecemberCross currency swaps (57) 40Interest rate swaps 3 9Forward foreign exchange contracts (3) (1)<strong>2011</strong>£m2010£m(57) 48cross currency swapsAt 31 December <strong>2011</strong> and 2010 two cross currency swaps were outstanding. The first swapped €750m to £505m receiving fixed interestrates of 6.75% and paying floating interest rates. The second swapped £505m to US$1,007m receiving and paying floating interest rates.Both of these swaps mature in 2017.interest rate swapsStartdateMaturitydate Receive PayPrincipal€200m 2006 2013 4.375% Floating + marginUS$400m 2009 2012 Floating 2.06%US$161m 2010 2012 Floating 1.0% to 3.7%€200m 2013 2014 Floating 1.56%US$350m 2013 2014 Floating 1.27%US$325m 2013 2014 Floating 1.10%forward foreign exchange contractsAt 31 December <strong>2011</strong>, forward foreign exchange contracts had principal amounts equivalent to £41m (2010: £269m). The maincurrencies traded were the US dollar, euro and rouble. These contracts mature in 2012 (2010: <strong>2011</strong>).10 operating lease commitmentsOperating lease rentals payable in 2012 relating to contracts expiring after five years are £1m (<strong>2011</strong>: £1m).11 contingent liabilities<strong>2011</strong>2010£m£mGuarantees 2 44
14312 capital and reservesOrdinarysharecapital£mSharepremiumaccount£mCapitalredemptionreserve£mProfitand lossreserve£mMergerand otherreserves£mAt 1 January <strong>2011</strong> 564 989 351 437 155 2,496Retained profit for the year – – – 377 – 377Share options: value of services provided – – – 3 – 3Share options: cost of investment – – – 15 – 15Purchase of <strong>Rexam</strong> <strong>PLC</strong> shares by Employee Share Trust – – – (18) – (18)At 31 December <strong>2011</strong> 564 989 351 814 155 2,873Totalequity£mAt 1 January 2010 563 989 351 342 155 2,400Retained profit for the year – – – 90 – 90Share options: value of services provided – – – 2 – 2Share options: proceeds from shares issued 1 – – – – 1Share options: cost of investment – – – 9 – 9Purchase of <strong>Rexam</strong> <strong>PLC</strong> shares by Employee Share Trust – – – (6) – (6)At 31 December 2010 564 989 351 437 155 2,496The profit after tax for the financial year dealt within the financial statements of <strong>Rexam</strong> <strong>PLC</strong> is £488m (2010: £195m). Other reserves reflectunrealised gains related to the transfer of investments between subsidiaries. The profit and loss reserve of £814m (2010: £437m) arosepartly as a result of a provision of £214m against certain investments in subsidiaries in 2001 of which £156m was reversed in 2005. Thedirectors consider the value of the remaining investments in subsidiaries is considerably more than their book value. Accordingly, theremaining provision of £58m does not impact the distributable reserves of <strong>Rexam</strong> <strong>PLC</strong> which were £842m at 31 December <strong>2011</strong>(2010: £480m) after deducting £30m (2010: £15m) in respect of share options capitalised in cost of investment.For details of ordinary shares see note 29 to the consolidated financial statements.13 share based payment<strong>Rexam</strong> <strong>PLC</strong>’s share based payment schemes comprise LTIP, LTIP 2007, ESOS and SAYE. For further information on these schemes, includingthe valuation models, assumptions used and settlement basis, see note 31 to the consolidated financial statements.The number of options and weighted average exercise prices of share option schemes relating to <strong>Rexam</strong> <strong>PLC</strong> are set out below.<strong>2011</strong>Number ofoptionsThousands<strong>2011</strong>Weighted averageexercise price£2010Number ofoptionsThousands2010Weighted averageexercise price£Outstanding at 1 January 5,450 0.88 4,598 1.22Granted 2,567 0.06 2,814 0.03Transferred in 57 – 8 2.12Exercised (52) 2.24 (62) 0.16Lapsed (1,464) 0.09 (1,908) 0.47Outstanding at 31 December 6,558 0.72 5,450 0.88Exercisable at 31 December 967 3.99 505 4.03The exercise prices and average remaining contractual lives of share options relating to <strong>Rexam</strong> <strong>PLC</strong> by scheme are set out below.<strong>2011</strong>Number ofoptionsThousands<strong>2011</strong>Range ofexercise prices£<strong>2011</strong>Weighted averageremainingcontractual lifeYears2010Number ofoptionsThousands2010Range ofexercise prices£2010Weighted averageremainingcontractual lifeYearsLTIP 5,211 – 1.7 2,726 – 2.2LTIP 2007 – – – 1,343 – 4.2ESOS 958 2.71 to 4.57 5.5 1,024 2.14 to 4.57 6.3SAYE 389 2.12 to 2.91 2.8 357 2.12 to 3.65 3.5financial statements governancesustainabilitybusiness reviewoverview
144 <strong>Rexam</strong> annual report <strong>2011</strong>shareholder information<strong>Rexam</strong> websitewww.rexam.comThe <strong>Rexam</strong> website has a range of information on the Group.You can view online or download publications such as theConsumer Packaging <strong>Report</strong> (packaging unwrapped), <strong>Rexam</strong>’sannual reports, half year results announcements, press releasesand AGM related information and documents. There is practicalinformation such as real time and historic <strong>Rexam</strong> shares prices and,in the Investors’ section, information on dividend payments andrecord dates, and choices as to how your dividend can be paiddirectly to your bank account or reinvested in shares through thedividend reinvestment plan.stock exchange listingThe Company’s ordinary shares of 64 2 / 7 p each are listed withthe UK Listing Authority and trade on the London Stock Exchangeunder the code REX. In the US, shares are traded in the formof ADRs under the symbol REXMY on the Pink Sheets electronictrading market.holders of ordinary sharesregistrarwww.shareview.co.ukEquinitiAspect HouseSpencer RoadLancingWest Sussex BN99 6DAUnited KingdomTel: 0800 169 6946 for UK shareholders 1Tel: +44 121 415 7008 for overseas shareholders 2Please write to Equiniti or contact their helpline to:• check your shareholding• register change of address or name• obtain a replacement dividend cheque or tax voucher• record the death of a shareholder• amalgamate multiple accounts• ask any other question about your shareholding.1 Calls to this number are free of charge when dialled from a BT landline. Other telephoneprovider costs may vary. Lines open 8.30am to 5.30pm, Monday to Friday.2 Lines open 8.30am to 5.30pm, Monday to Friday.holders of american depositary receipts (ADRs)depositarywww.bnymellon.com/shareownerThe Bank of New York MellonPO Box 358516Pittsburgh, PA 15252-8516United StatesTel: +1 201 680 6825Tel: 1 888 BNY ADRS (toll free within the US)email: shrrelations@bnymellon.comPlease write to The Bank of New York Mellon or contact theirhelpline to ask any question about <strong>Rexam</strong>’s ADR programme.capital gains taxThe market value of <strong>Rexam</strong> shares at 31 March 1982 was 75.3p pershare, as adjusted for the subdivision of shares in November 1992and the capital reorganisation in October 1998.Shareholders requiring clarification of their capital gains taxposition should consult their professional advisor.ShareGiftwww.sharegift.orgTel: +44 (0)20 7930 3737ShareGift is an independent charity share donation scheme thatprovides a charitable solution to the problem of unwanted smallholdings of shares. If you have shares that you wish to dispose ofand whose value makes it uneconomic to sell, you may wish toconsider donating them to charity through ShareGift.fraudulent transactionshttp://www.fsa.gov.uk/consumerinformationThe Financial Services Authority (FSA)25 The North ColonnadeCanary WharfLondon E14 5HSUnited KingdomTel: 0845 606 1234 if calling from within the UKTel: +44 20 7066 1000 if calling from outside the UKThe FSA has issued a warning to all UK shareholders aboutunsolicited phone calls or correspondence concerning investmentmatters. If you receive such calls and are concerned, report thematter to the FSA either by calling them or visiting their website.financial calendar 2012Please check the <strong>Rexam</strong> website nearer to the expected datesto ensure there have been no changes to them.Events 2012Announcement of <strong>2011</strong> final results22 FebruaryAnnouncement of 1 st interim management statement 3 May<strong>Annual</strong> General Meeting 20123 MayEx dividend date for <strong>2011</strong> final dividend9 MayRecord date for <strong>2011</strong> final dividend11 MayProposed payment date for <strong>2011</strong> final dividend7 JuneAnnouncement of 2012 half year results1 AugustProposed payment date for 2012 interim dividend 4 SeptemberAnnouncement of 2 nd interim management statement 15 NovemberFinancial year end31 Decembershareholder profileAn analysis of <strong>Rexam</strong> <strong>PLC</strong> ordinary shares by category and size ofholding, as at 21 February 2012, is as follows:holdingsnumber %sharesnumber %CategoryIndividuals 13,824 74 20,874,240 2Institutions 4,917 26 856,164,013 9818,741 100 877,038,253 100Size of holdingUp to 2,000 shares 13,583 73 9,998,966 12,001 – 20,000 shares 4,389 23 20,281,777 220,001 – 100,000 shares 356 2 17,117,760 2Over 100,000 shares 413 2 829,639,750 9518,741 100 877,038,253 100
145addressesregistered office and headquarters<strong>Rexam</strong> <strong>PLC</strong>4 MillbankLondon SW1P 3XRUnited KingdomTel: +44 (0)20 7227 4100Fax: +44 (0)20 7227 4109main overseas service centreUSA<strong>Rexam</strong> Inc4201 Congress StreetSuite 340CharlotteNC 28209United StatesTel: +1 704 551 1500Fax: +1 704 551 1572For details of our individual operationsplease go to our website www.rexam.comoperational headquarters<strong>Rexam</strong> Beverage Can Europe & Asia100 Capability GreenLutonBedfordshire LU1 3LGUnited KingdomTel: +44 (0)1582 408999Fax: +44 (0)1582 726065<strong>Rexam</strong> Beverage Can North America8770 W Bryn Mawr AvenueChicagoIL 60631United StatesTel: +1 773 399 3000Fax: +1 773 399 8088<strong>Rexam</strong> Beverage Can South AmericaAv. Luis Carlos Prestes290 – sala 101Barra da TijucaRio de Janeiro – RJCEP 22.775-055BrazilTel: +55 21 2104 3300Fax: +55 21 2104 3425<strong>Rexam</strong> Plastic Packaging4 MillbankLondon SW1P 3XRUnited KingdomTel: +44 (0)20 7227 4100Fax: +44 (0)20 7227 4109Board photography: Marcus LyonFeature photography:L2PM Films and Lasse Davidssondesign and production by Radley Yeldarwww.ry.comThis report has been printed on Hello Silk,a paper which is certified by the ForestStewardship Council ® . The paper is madein a mill registered to EMAS, the EcoManagement Audit Scheme, and withISO14001 environmental managementsystem accreditation. This report wasprinted using vegetable oil based inks bya CarbonNeutral ® printer registered toEMAS and with ISO14001 environmentalmanagement system accreditation.find out more onlineOur website www.rexam.comcontains a full interactive versionof the <strong>2011</strong> annual report. It alsocontains annual reports fromprevious years (back to 1999)as well as investor presentations,publications and other materialon <strong>Rexam</strong>, its markets and business.
<strong>Rexam</strong> <strong>PLC</strong>4 MillbankLondon SW1P 3XRUnited Kingdomwww.rexam.com