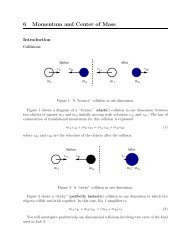
Lab#7: Riemann-sums and Definite integrals using Derive- (chapter ...
Lab#7: Riemann-sums and Definite integrals using Derive- (chapter ...
Lab#7: Riemann-sums and Definite integrals using Derive- (chapter ...

You also want an ePaper? Increase the reach of your titles
YUMPU automatically turns print PDFs into web optimized ePapers that Google loves.
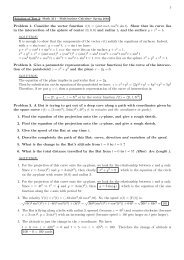
Math 111 - Calculus I- Fall 2003<strong>Lab#7</strong>: <strong>Riemann</strong>-<strong>sums</strong> <strong>and</strong> <strong>Definite</strong> <strong>integrals</strong> <strong>using</strong> <strong>Derive</strong>- (<strong>chapter</strong> 5)1. Goals of this lab• To find an antiderivative or indefinite integral <strong>using</strong> <strong>Derive</strong>.• To find the definite <strong>and</strong> indefinite <strong>integrals</strong> <strong>using</strong> <strong>Derive</strong>• To find all <strong>Riemann</strong>-<strong>sums</strong> L n , R n , M n <strong>and</strong> T n <strong>using</strong> <strong>Derive</strong>• To draw all <strong>Riemann</strong>-<strong>sums</strong> L n , R n , M n <strong>and</strong> T n <strong>using</strong> <strong>Derive</strong>.• To compare the exact value of a definite integral <strong>and</strong> the <strong>Riemann</strong>-<strong>sums</strong> L n , R n <strong>and</strong> M n .• Relationship between the definite integral of a positive function <strong>and</strong> the enclosed area.• The effects of the increase or decrease of a function on the <strong>Riemann</strong>-<strong>sums</strong> L n <strong>and</strong> R ncompare to the exact value.2. Practice <strong>using</strong> new comm<strong>and</strong>s in <strong>Derive</strong>∫(A) Follow the steps below to find the Indefinite integral f(x) dx, i.e. the antiderivative of f(x), wheref(x) = 3x(1) Click on the button with icon ∫ , called calculate integral.(2) Enter the expression of the function (for our example, enter 3x)(3) Enter the variable (x in this case)(4) Choose ⊙ Indefinite in the integral box down to the left.(5) Enter the value of the constant if it is given or just enter c.(6) Click on OK∫.(7) The integral 3x dx will appear highlighted on the Algebra Window.(8) Click on the = button to get the answer.(B) Follow the steps below to find the <strong>Definite</strong> integral(1) Click on the button with icon ∫ .∫ 41f(x) dx, where f(x) = 3x(2) Enter the expression of the function (for our example, enter 3x)(3) Enter the variable (x in this case)(4) Choose ⊙ <strong>Definite</strong> in the integral box down to the left.(5) Then enter the Upper Limit 4 (in our example), <strong>and</strong> the Lower Limit 1 (in our example)(6) Click on OK .(7) The integral∫ 413x dx will appear highlighted on the Algebra Window.(8) Then click on the button = or ≈ to have the answer.(C) Follow the following steps to get ready to draw <strong>and</strong> to find the <strong>Riemann</strong>-<strong>sums</strong>:(1) In the Algebra Window of <strong>Derive</strong>, go to FILE / LOAD / UTILITY to open the folder UTILITY.(2) Look for a file called riemann.mth, then go to step (4). If you do not find it go to step (3).(3) Since you did not find the file riemann.mth, you should download it from the homework web page,save it ”somewhere” then load it from this ”somewhere” via the <strong>Derive</strong> Algebra Window <strong>using</strong> FILE/ LOAD (like in step (2)).(4) Highlight it <strong>and</strong> OPEN it, (it will take some time). If nothing happens, it is normal but <strong>Derive</strong> isnow ready for the riemann-<strong>sums</strong>.(5) The riemann-<strong>sums</strong> of a function f(x) are approximation of the area between the graph of f <strong>and</strong> thex-axis by n equal-width rectangular strips from x = a through x = b.(D) Follow the steps below to find L n = LEFT(f(x), x, n, a, b) <strong>and</strong> to draw it asDRAW LEFT(f(x), x, n, a, b) for f(x) = 3x, n = 8 = number of strips, a = 1 <strong>and</strong> b = 4.1
2(a) Declare the function f(x) := 3x <strong>and</strong> graph it. then go back to the algebra window.(b) Enter LEFT(f(x), x, 8, 1, 4) to have the value of Left-sum L n , then click on OK <strong>and</strong> =or ≈ .(c) Enter DRAW LEFT(f(x), x, 8, 1, 4) to draw the n rectangles for the Left-sum, click on<strong>and</strong> ≈ . Then Plot expression by clicking on —∽|— twice. If you see just dots (no rectangles)you have to go the Options/Points <strong>and</strong> choose Yes in Connect.(E) Open a new Plot Window, <strong>and</strong> do the same for R n=RIGHT(f(x), x, n, a, b) <strong>and</strong>DRAW RIGHT(f(x), x, n, a, b) to have the value of Right-sum R n , <strong>and</strong> to draw the correspondingn rectangles for n = 8 = number of strips, a = 1 <strong>and</strong> b = 4.(F) Do the same for M n= MID(f(x), x, n, a, b) <strong>and</strong> DRAW MID(f(x), x, n, a, b) to have the valueof Midpoint-sum M n , <strong>and</strong> to draw the corresponding n rectangles for n = 8 = number of strips, a = 1 <strong>and</strong>b = 4.(G) Do the same for T n= TRAP(f(x), x, n, a, b) <strong>and</strong> DRAW TRAP(f(x), x, n, a, b) to have thevalue of Trapezoid-sum T n , <strong>and</strong> to draw the corresponding n Trapezoids for n = 8 = number of strips,a = 1 <strong>and</strong> b = 4.OK3. ApplicationI. For the function f(x) = x 2 on the interval [a, b] = [0, 1] do the following, <strong>and</strong> report your resultin the given table:(1) Declare the function(2) Open a new Plot Window, graph the function, <strong>and</strong> use Set/Range from the menu to have better viewof the function on the interval [0, 1].(3) Is the function increasing or decreasing in the interval [0, 1]?∫∫1(4) Use the button to find the exact value of f(x) dx0(5) Find L n for n = 5, a = 0, b = 1 <strong>using</strong> LEFT(f(x), x, 5, 0, 1).(6) Sketch the corresponding rectangles <strong>using</strong> DRAW LEFT(f(x), x, 5, 0, 1), <strong>and</strong> print the plot window.(7) Visually, say if L 5 is an underestimate or overestimate of the exact area.(8) Repeat the previous questions (5), (6) & (7) with n = 20 to find L 20 .(9) Visually, decide which of L 20 or L 5 is a better approximation of the exact area under the graph.(10) Repeat the previous questions (2) to (9) for R n ; the right riemann-sum.II. Repeat all what you did for f(x) above to the function g(x) = 1do the following, <strong>and</strong> report your result in the given table.1+xon the interval [a, b] = [0, 1]III. Analyze the results from the table <strong>and</strong> the printed drawings, <strong>and</strong> type or write answersto the following:(1) How the increase of the values of n affects the estimations of the area by L n <strong>and</strong> R n ?(2) Is there a relationship between the increase or decrease of a function <strong>and</strong> the fact of L n or R n beingunderestimate or overestimate?(3) What can you say about the riemann-<strong>sums</strong> R n <strong>and</strong> L n compare to∫ 10f(x) dx <strong>and</strong>∫ 10g(x) dx?(4) What can you say about the value of the definite integral of a positive function <strong>and</strong> the the area betweenthe graph of f <strong>and</strong> the x-axis?