National Knowledge Commission Report to the Nation 2009: Baseline
National Knowledge Commission Report to the Nation 2009: Baseline
National Knowledge Commission Report to the Nation 2009: Baseline

Create successful ePaper yourself
Turn your PDF publications into a flip-book with our unique Google optimized e-Paper software.
Annexure I: <strong>Baseline</strong><strong>Report</strong> <strong>to</strong> <strong>the</strong> <strong>Nation</strong>171
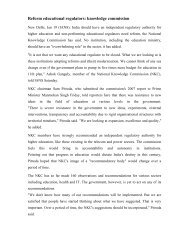
Table 5: Number of teachers by type of schools and pupil:teacher ratioType of SchoolNo. of teachers(in lakh)Percentage of trainedteachersFemale teachers per100 male teachersPupil teacher ratioPrimary 21.8 86 65 46Upper primary 16.7 87 67 34High schools 11.2 89 61 32Higher/ Senior secondary 10.3 90 62 34Source: <strong><strong>Nation</strong>al</strong> Level Statistics 2005-06, MHRDTeachers: The <strong>to</strong>tal number of teachers in primaryschools increased from 5.38 lakh in 1950-51 <strong>to</strong> 21.6lakh in 2004-2005 i.e. by more than four times.However, <strong>the</strong> number of teachers is still not adequate <strong>to</strong>meet <strong>the</strong> needs of <strong>the</strong> bourgeoning student populationas is evident from <strong>the</strong> teacher pupil ratio.During <strong>the</strong> year 1950-51 <strong>the</strong> pupil teacher ratio inprimary schools was 1:24, in middle schools it was1:20 and in higher/higher secondary schools, <strong>the</strong> pupilteacher ratio was 1:21. By 2004-2005 this ratio hadincreased <strong>to</strong> 1:46 in primary schools; 1:35 in upperprimary schools and 1:33 in secondary/senior secondaryschools. Though <strong>the</strong> number of educational institutionshas considerably increased after Independence and also<strong>the</strong> number of teachers, <strong>the</strong> higher pupil teacher ratioindicates that <strong>the</strong> increase in enrolment at each levelis comparatively more than <strong>the</strong> increase in number ofteachers. The increased enrolment at various levels alsounderscores <strong>the</strong> need for opening of a greater numberof educational institutions as well as employing moreteachers for improving <strong>the</strong> quality of education.Teacher training programs: Teacher training has beenidentified as a crucial input for quality school education.However, <strong>the</strong> status of teacher training in India is amatter of great concern. According <strong>to</strong> DISE data, only33 per cent of <strong>the</strong> teachers received in-service trainingin 2005-06. In 2002, 65467 men and 67096 womenenrolled in<strong>to</strong> teacher training courses in India. There areat present, about 571 DIETs, and DRCs, 104 Collegesof Advanced Teaching and 31 Institutes of AdvancedStudies in Education, for pre-service and in-servicetraining, functioning in <strong>the</strong> country.Teacher Absenteeism: Teacher absenteeism has beenidentified as a major impediment <strong>to</strong> improvement inquality of school education. The PROBE survey in 242villages across 5 north Indian states found that in abouthalf <strong>the</strong> schools, <strong>the</strong>re was no teaching activity at <strong>the</strong> timeof <strong>the</strong> investiga<strong>to</strong>rs’ visit. It is significant that this patternoccurred even in cases where <strong>the</strong> school infrastructure(in terms of number of class rooms, teaching aids andeven teacher-pupil ratio) was relatively good.Infrastructure: There is a severe lack of basicinfrastructure in schools in India. The PROBE (1999)survey, for instance, found <strong>the</strong> following with respect<strong>to</strong> government schools: (a) only a fourth of <strong>the</strong> sampleschools had at least two teachers, two all-wea<strong>the</strong>rclassrooms, and some teaching aids; (b) at <strong>the</strong> time of<strong>the</strong> investiga<strong>to</strong>r’s visit, one-third of <strong>the</strong> headmasterswere absent, one-third of <strong>the</strong> schools had a singleteacher present, and about half of <strong>the</strong> schools had noteaching activity; (c) in many schools class students weresystematically neglected. Similarly, <strong>the</strong> DISE surveyfound that only about 50 per cent of <strong>the</strong> schools hadboundary walls, 33 per cent had electricity connections,and 52 per cent had playgrounds. These representserious flaws in <strong>the</strong> schooling process.Management: At present, government and localbodies own more than 90 per cent of <strong>the</strong> primaryschools, 72 per cent of <strong>the</strong> upper primary schoolsand 39 per cent of <strong>the</strong> secondary schools. Thereare indications of a rise in <strong>the</strong> number of privateunrecognised schools in India. According <strong>to</strong> <strong>the</strong>DISE Analytical <strong>Report</strong> as many as 63,411 and1,26,110 schools in 2005-06 were being managed by<strong>the</strong> private aided and private unaided managementsrespectively. Toge<strong>the</strong>r, <strong>the</strong>y run a <strong>to</strong>tal of 1,89,521schools (16.86 per cent). There is evidence <strong>to</strong> suggestthat private schools are concentrated in areas wheregovernment funded schools are dysfunctional.Although <strong>the</strong> student profile of private schools is moreeconomically advantaged, <strong>the</strong> rate of enrolment frompoor families has also increased steadily. Findingsfrom <strong>the</strong> MIMAP survey in India show that, of allschool-enrolled children aged 5-10 years old livingbelow <strong>the</strong> poverty line, 14.8 per cent attended privateschools (8 per cent in rural and 36 per cent in urbanIndia). The corresponding figures for ages 11-14<strong>Report</strong> <strong>to</strong> <strong>the</strong> <strong>Nation</strong>177
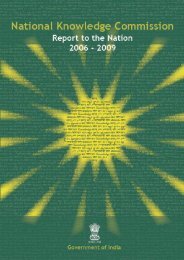
years and 15-17 years were 13.8 per cent and 7 percent respectively (Pradhan and Subramaniam, 2000).Fur<strong>the</strong>r, amongst <strong>the</strong> students from poor backgroundsin private schools, <strong>the</strong> majority are male.Curriculum, pedagogy and learning outcomes: An allIndia study Annual Status of Education <strong>Report</strong> (ASER)conducted by PRATHAM in 2006 found <strong>the</strong> levelsin arithmetic and reading amongst primary schoolchildren <strong>to</strong> be surprisingly low. Close <strong>to</strong> 35 per cen<strong>to</strong>f children in <strong>the</strong> 7-14 age group could not read asimple paragraph (grade 1 level difficulty) and almost60 per cent of children could not read a simple s<strong>to</strong>ry(grade 2 level). In Government Schools, 49.6 percent of classes II-IV could not subtract (level 1), and77.8 per cent could not complete sums in division. Inprivate schools, 37.9 could not subtract (level 1) and66.7 per cent could not finish division sums (level 2).The situation in Tamil Nadu, Karnataka and Gujarat(where <strong>the</strong> schools function and where all provisionrelated indica<strong>to</strong>rs are good) are far worse than in Biharand Chhattisgarh (where indica<strong>to</strong>rs like teacher-pupilratio, drop out rates are extremely high, and <strong>the</strong>reare fewer schooling facilities). The high failure rates,especially among <strong>the</strong> rural, economically weaker andsocially deprived children, forces one <strong>to</strong> critically review<strong>the</strong> whole system of evaluation and examination.It is widely recognised that <strong>the</strong>re is a need <strong>to</strong> shiftfocus from rote learning from textbooks <strong>to</strong> developingbasic skills and <strong>the</strong> ability of students <strong>to</strong> apply <strong>the</strong>irlearning <strong>to</strong> real situations. Also creativity, problemsolvingability and encouragement for constructionof knowledge based on students’ own experiencesneeds <strong>to</strong> be promoted. Introducing accountabilityand developing o<strong>the</strong>r measures <strong>to</strong> improve teachingFigure 5: Percentage of schools with basic facilities9080706050403020100 Boundarywall(in %)Drinkingwater facilityCommon<strong>to</strong>ilet facilityGirls <strong>to</strong>iletfacilityElectricityconnectionComputers Ramp Book bank Playground Medicalcheck upSource: Elementary Education in India, Analytical <strong>Report</strong> 2006-07Figure 6: Management-wise percentage of schools120Govt. Local body Private aided Private unaided10080(in %)6040200Primary Upper primary Secondary/SeniorSecondarySource: <strong><strong>Nation</strong>al</strong> Level Statistics 2005-06, MHRD178 <strong><strong>Nation</strong>al</strong> <strong>Knowledge</strong> <strong>Commission</strong>
Figure 7: Percentage of children (Class I <strong>to</strong> VIII) who cannot706050(in %)403020100Read Letter Read Word Read Level 1(Std 1) textRead Level 2(Std 2) textRecognisenumbersSubtractDivideSource: Annual Status of Education <strong>Report</strong> (Rural) 2006Figure 8: Expenditure on education as a percentage of GDP2.5ElementarySecondary/Higher secondary21.5(in %)10.501990-911991-921992-931993-941994-951995-961996-971997-981998-991999-20002000-012000-022000-032000-042000-05Source: MHRDquality at <strong>the</strong> primary level needs <strong>to</strong> be thought of.The <strong><strong>Nation</strong>al</strong> Policy on Education (NPE), 1986postulated that <strong>the</strong> examination system should berecast so as <strong>to</strong> ensure a method of assessment that isa valid and reliable measure of student developmentand a powerful instrument for improving teaching andlearning be developed.Government funding: The share of public expenditureon education has been declining steadily and was 3.5 percent in 2004-05. The share of elementary education wasRs. 40,000 crores out of almost 100,000 crores allotted<strong>to</strong> education. This amount is insufficient <strong>to</strong> provideuniversal elementary education of eight years for everychild in <strong>the</strong> age group 6 – 14 years. It is also less than<strong>the</strong> proportion of GDP invested in education in manyo<strong>the</strong>r developing countries. India’s <strong>to</strong>tal expenditureon school education for <strong>the</strong> year 2005-06, elementaryand secondary combined was around Rs. 78,661 crores,amounting <strong>to</strong> only 2.46 per cent of GDP. The TenthPlan outlay for Elementary Education and Literacy wasRs. 30,000 crore. The actual expenditure has been Rs.48,201 crore, out of which SSA (Rs. 28,077 crore) andMDM (Rs. 13,827 crore) account for 88 per cent. Thegraph below shows public expenditure on educationfrom year 1992-93 <strong>to</strong> 2005-06 in 1993-94 constantprices. The percentage allocation for education wasaround 3.5 per cent of GDP until <strong>the</strong> late 1990s, rose<strong>to</strong> more than 4 per cent at <strong>the</strong> turn of <strong>the</strong> decade but hassince declined <strong>to</strong> 3.75 per cent of GDP.<strong>Report</strong> <strong>to</strong> <strong>the</strong> <strong>Nation</strong>179
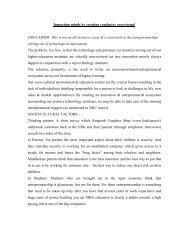
Formal vocational training and broadactivity status: The proportion of persons(15-29 years) who received formalvocational training was <strong>the</strong> highest among<strong>the</strong> unemployed. The proportion wasaround 3 per cent for <strong>the</strong> employed, 11 percent for <strong>the</strong> unemployed and 2 per cent forpersons not in <strong>the</strong> labour forceFigure 10: Status of Vocational Education and Training (VET)No VET Receiving formal VET Received formal VET Received non formal VET1% 2% 8%Issues in <strong>the</strong> CurrentFramework1. Participation: The Kothari <strong>Commission</strong>on Educational Reforms, 1966 had visualisedthat 25 per cent of <strong>the</strong> students at <strong>the</strong>secondary stage would go for <strong>the</strong> vocationalstream. At present only about 5 per cent of<strong>the</strong> children of <strong>the</strong> 16 <strong>to</strong> 18 age group arein <strong>the</strong> vocational stream. This is despite <strong>the</strong>fact that in urban areas, only about 19.6 percent of male and 11.2 per cent of femaleworkers possessed marketable skills, whereas,in rural areas only about 10 per cent of maleand 6.3 per cent of female workers possessedmarketable skills. This figure is far higher indeveloped even developing countries2. Capacity utilisation: There is littlecapacity in vocational education and eventhat is under-utilised. Only 6,800 schoolshave received grants and <strong>the</strong> <strong>to</strong>tal enrolmentreported is only about 5 per cent at most.More recent information suggests that <strong>the</strong>enrolment figure is less than three per cen<strong>to</strong>f <strong>the</strong> students attending Grades 11-12.The weighted average capacity utilisation of<strong>the</strong> schools receiving grants is about 42 percent. This implies that between 350,000 <strong>to</strong>400,000 students are enrolled in vocationaleducation, which works out <strong>to</strong> less thanthree per cent of <strong>the</strong> 14 million studentsor more in Grades 11 and 12, implyingthat less than one per cent of students whohad entered Grade 1 over <strong>the</strong> last decadeor so would have eventually participatedin vocational education. It is also widelyrecognised that existing student capacity inITIs/ITCs largely goes unutilised.3. Flexibility: The current frameworkrequires minimum qualifications, varyingSource: Status of Education and Vocational Training in India, 2004-05, NSS 61 st RoundFigure 11: Urban-rural break up of VocationalEducation and Training% who received formal VET87654321015-19Source: Status of Education and Vocational Training in India, 2004-05, NSS 61 st Round% who received formal vocational training161412108642089%Rural Urban Total20-24 25-29Figure 12: Activity status of persons receiving vocational trainingEmployedUnemployedRural Urban TotalNot in labour forceSource: Status of Education and Vocational Training in India, 2004-05, NSS 61 st Round<strong>Report</strong> <strong>to</strong> <strong>the</strong> <strong>Nation</strong>181
Table 7: International comparisons on size of vocational-secondary educationCountry Secondary enrolment ratio Number of students(thousands)Vocational-technical share(per cent of <strong>to</strong>tal secondaryenrolments)Russia 88 6277 60China 52 15300 55Chile 70 652 40Indonesia 43 4109 33Korea 93 2060 31Mexico 58 - 12Malaysia 59 533 11South Africa 77 - 1Source: World Bank, 2006Table 8: All India seats utilisation in respect of technician, trade and graduate apprenticesSeats located Seats utilised Per cent utilisationTechnician apprentices 39004 22837 59 per centTrade apprentices 182046 127741 70 per centGraduate apprentices 20420 6084 22 per centSource: Annual <strong>Report</strong> 2002-03, Ministry of Labour, Govt. of IndiaFigure 13: Seat utilisation against sanctioned strength6051%50Percentage of ITIs403024% 25%20100Under utilisation Full utilisation Over utilisationSource: FICCI Survey, 2006from Class VIII – Class XII, for participation in formalvocational training. While this may be necessary forcertain trades, it is unnecessarily restrictive in o<strong>the</strong>rs.Also, once an individual leaves mainstream educationfor vocational training, <strong>the</strong>re is no provision for him/her <strong>to</strong> return <strong>to</strong> <strong>the</strong> former at a later stage. Not onlydoes this encourage a general view of work and studybeing mutually exclusive options, it also increases<strong>the</strong> perceived risk of taking up vocational training.The system is also not responsive <strong>to</strong> labour marketdemand conditions. The inflexibilities in <strong>the</strong> course/curriculum set-up, lead <strong>to</strong> over supply in some tradesand shortages in o<strong>the</strong>rs. Moreover, <strong>the</strong>re is not enoughemphasis on short training course designed <strong>to</strong> impartspecific skills. Vocational education and trainingin India relies exclusively on a few training courseswith long duration (2 <strong>to</strong> 3 years) covering around 100skills. In China, on <strong>the</strong> o<strong>the</strong>r hand, <strong>the</strong>re exist about4000 short duration modular courses which provide skillsmore closely tailored <strong>to</strong> employment requirements.182 <strong><strong>Nation</strong>al</strong> <strong>Knowledge</strong> <strong>Commission</strong>
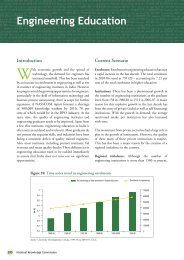
4. Impact: Of <strong>the</strong> trained candidates, <strong>the</strong> labour marke<strong>to</strong>utcomes as seen from placement/ absorption ratesare reportedly very low. Although countrywide figureson <strong>the</strong> labour market success of ITI/ITC graduatesare difficult <strong>to</strong> come by, an ILO study reports that in<strong>the</strong> states of Orissa, Andhra Pradesh and Maharashtra,<strong>the</strong> percentages of graduates found <strong>to</strong> be in wageemployment/self-employment upon graduation fromITIs were 16.2 per cent, 41 per cent and 35 per centrespectively. The corresponding percentages for thosegraduating from ITCs were 21.3 per cent, 22.8 per centand 35.6 per cent respectively5. Industry linkages: Although provisions exist for <strong>the</strong>participation of industry representatives/experts in <strong>the</strong>setting of curriculum and hiring of apprentices, <strong>the</strong>re is asignificant mismatch between industry skill requirementsand <strong>the</strong> talent pool emerging from ITIs/ITCs. This isone of <strong>the</strong> fac<strong>to</strong>rs contributing <strong>to</strong> low success in <strong>the</strong>labour market for VET graduates. The private sec<strong>to</strong>rdoes undertake in-house training programs and <strong>to</strong> avery limited extent also trains ‘outsiders’. However, suchprograms are limited <strong>to</strong> catering <strong>to</strong> <strong>the</strong>ir own felt needs,in <strong>the</strong> nature of captive skill development. Low payingcapacity of learners and <strong>the</strong> reluctance of industries <strong>to</strong>train workers for fear of losing <strong>the</strong>m <strong>to</strong> competition hasresulted in chronic deficiency in private investment inthis area.6. Quality and accreditation: The quality of <strong>the</strong> trainingimparted is also a matter of concern, as <strong>the</strong> <strong>to</strong>olkits,faculty, and curriculum are reportedly sub-standard. Theexisting institutions also lack financial and administrativeau<strong>to</strong>nomy. The testing, certification & accreditationsystem is reportedly weak, and since <strong>the</strong> deliverablesare not precisely defined, <strong>the</strong>re is no effort at evaluatingoutcomes and tracking placements. The problemis fur<strong>the</strong>r complicated with lack of industry-facultyinteraction on course curricula and o<strong>the</strong>r fac<strong>to</strong>rs. Thesystem of vocational training is currently characterised bya lack of ongoing moni<strong>to</strong>ring for quality in institutionsimparting VET. Although a system of inspections byState governments is in place, this is sub-optimal becauseit permits <strong>the</strong> proliferation of rent-seeking practices anddoes not achieve its stated objectives. An au<strong>to</strong>nomoussystem of accreditation is missing in <strong>the</strong> VET sec<strong>to</strong>r.Figure 14: Employment status of ITI/ITC graduatesITIITC45% of graduates employed in organised sec<strong>to</strong>r4035302520151050Orissa Andhra Pradesh MaharashtraSource: Industrial Training Institutes of India: The Efficiency Study <strong>Report</strong>, ILO, 2003Table 9: Internal efficiency of ITIs and ITCs in 3 statesIndica<strong>to</strong>r Orissa Andhra Pradesh MaharashtraITIs ITCs ITIs ITCs ITIs ITCsStudent retention 80.9 94.9 68.3 84.8 85.6 89Graduation rate 88.3 95.6 62.9 62.7 77.5 79.4Capacity utilisation 102.1 101 77.4 83.3 92.2 91Student:Teacher ratio 9.3 5.4 5.5 9.6 - -Overall internal efficiency 73.8 90.9 31.8 45.7 62.6 61.1Source: Industrial Training Institutes of India: The Efficiency Study <strong>Report</strong>, ILO, 2003<strong>Report</strong> <strong>to</strong> <strong>the</strong> <strong>Nation</strong>183
Higher EducationIntroductionAdemographic explosion in <strong>the</strong> youngpopulation of <strong>the</strong> country means that highereducation needs <strong>to</strong> keep apace with <strong>the</strong>growth in <strong>the</strong> relevant population. As per <strong>the</strong> 2001Census, 31.2 per cent of <strong>the</strong> country or 337 millionwere below <strong>the</strong> age of 15. Providing higher educationfor this group is imperative and has <strong>to</strong> be provided onan unprecedented scale <strong>to</strong> meet <strong>the</strong> challenges of thisunique demographic trend. The higher educationsec<strong>to</strong>r currently faces major challenges of quality andexcellence, and of improving access with inclusiveness.The proportion of our population, in <strong>the</strong> relevant agegroup, that enters <strong>the</strong> world of higher education isonly about 10 per cent (2004-05). Access <strong>to</strong> highereducation in terms of <strong>the</strong> available number of seats inuniversities is simply not adequate in relation <strong>to</strong> <strong>the</strong>current demand. There are also large disparities inenrolment rates across states, urban and rural areas,sex, caste and poor-non-poor.Current ScenarioInstitutions: As in 2006, <strong>the</strong> Indian higher educationsystem consisted of 355 universities and 18,064colleges - <strong>the</strong>re exist 20 Central Universities, 216 StateUniversities, 101 Deemed Universities, 5 Institutionsestablished through State Legislation and 13 Institutionsof <strong><strong>Nation</strong>al</strong> Importance.Enrolment: Around 110 lakh students were estimated<strong>to</strong> be currently enrolled in <strong>the</strong> Indian higher educationsystem in 2005-06. The growth of student enrolmentin higher education in India has been uneven and slow.For instance, while <strong>the</strong> enrolment grew by 6.7 per centin 2001-2002, in 2005-06 it grew by 5.2 per cent.Teachers: The <strong>to</strong>tal number of teachers in <strong>the</strong> highereducation system is 4.88 lakhs. Out of <strong>the</strong> <strong>to</strong>tal teachingfaculty, 84 per cent were employed in affiliated collegesand only 16 per cent in <strong>the</strong> universities and universitycolleges. The student-teacher ratio works out <strong>to</strong> 18 in<strong>the</strong> university departments and colleges and 23 in <strong>the</strong>affiliated colleges.Issues in <strong>the</strong> Current FrameworkExpansion: The current enrolment in higher educationstands at about 11 million. While <strong>the</strong>re has been aconsistent growth in enrolment in higher education over<strong>the</strong> last few years, this is not enough when comparedFigure 15: Growth of higher education systemUniversitiesColleges4003503002502001501005001950-51 1955-56 1960-61 1965-66 1970-71 1975-76 1980-81 1985-86 1990-91 1995-96 2000-01 2005-0620000180001600014000120001000080006000400020000Source: UGC184 <strong><strong>Nation</strong>al</strong> <strong>Knowledge</strong> <strong>Commission</strong>
Figure 16: Growth of student enrolment in higher education in India(1950-51 <strong>to</strong> 2005-06)Annual growth rateTotal Enrolment25120000002010000000(in %)151080000006000000400000052000000001950-51 1955-56 1960-61 1965-66 1970-71 1975-76 1980-81 1985-86 1990-91 1995-96 2000-01 2005-06Source: UGCTable 10: Number of teachers in institutions of higher education, 2005-06InstitutionEnrolment(in thousands)Teachers(in thousands)Student:TeacherratioUniversity Departments & University Colleges 1427 79 18Affiliated Colleges 9601 409 23Total 11028 488 22Source: UGC Annual <strong>Report</strong>, 2005-06<strong>to</strong> o<strong>the</strong>r countries. The gross enrolment ratio (GER)for higher education currently is around 10 per centwhereas it is 25 per cent for many o<strong>the</strong>r developingcountries. Even South-east Asian countries show muchhigher enrolment: Philippines (31 per cent), Thailand(19 per cent), Malaysia (27 per cent) and China (13 percent). The enrolment figure for <strong>the</strong> USA is 81 per cent,54 per cent in <strong>the</strong> UK and 49 per cent in Japan. Variouscommittees that have examined <strong>the</strong> higher educationscenario in India have recommended an increasein <strong>the</strong> GER <strong>to</strong> at least 20 per cent. For instance, <strong>the</strong>CABE Committee on Financing of Higher Educationconcluded on <strong>the</strong> basis of international experience thatan enrolment rate of 20 per cent or more is consistentwith a turnaround in economic performance. If Indiahas <strong>to</strong> achieve <strong>the</strong> target soon, it would imply morethan doubling <strong>the</strong> scale and size of <strong>the</strong> higher educationsystem within <strong>the</strong> next 5 <strong>to</strong> 7 years.Table 11: Gross Enrolment Ratio (GER) for18-24 years (in percentage)YearHigher Education2001-02 8.072002-03 8.972003-04 9.212004-05 9.97Source: MHRDAccess: With high disparities, inclusive education hasremained an elusive target. Inter-caste, male-female andregional disparities in enrolment still remain prominent.For example, while <strong>the</strong> gross enrolment ratio for peopleliving in urban areas was almost 20 per cent, it was only6 per cent for rural areas. Fur<strong>the</strong>r, <strong>the</strong> gross enrolmentration for Scheduled Tribes (STs), Scheduled Castes<strong>Report</strong> <strong>to</strong> <strong>the</strong> <strong>Nation</strong>185
(SCs) and O<strong>the</strong>r Backward Classes (OBCs) was 6.57,6.52 and 8.77 respectively, much lower than <strong>the</strong> all-India figure of 11.Regulation: The regula<strong>to</strong>ry structures in <strong>the</strong> currenthigher education system are cumbersome. Entry throughlegislation alone, at present, is a formidable barrier. Itrequires an Act of Legislature of Parliament <strong>to</strong> set upa university. The deemed university route is much <strong>to</strong>odifficult for new institutions. The consequence is a steadyincrease in <strong>the</strong> average size of existing universities witha steady deterioration in <strong>the</strong>ir quality. The absence ofcompetition only compounds problems. A vast majorityof <strong>the</strong> colleges are not recognised by UGC undersection 2(f) of UGC Act. This poses a great challengefor <strong>the</strong> UGC in respect of maintenance of standard ofteaching and examination in higher education. Also <strong>the</strong>current system of affiliated colleges for undergraduatecolleges is not adequate. These are affiliated <strong>to</strong> largeunwieldy universities, making it difficult <strong>to</strong> moni<strong>to</strong>r<strong>the</strong> standard of education being imparted. Currentlyabout 90 per cent of <strong>the</strong> undergraduate enrolment and67 per cent of <strong>the</strong> postgraduate enrolment is in <strong>the</strong>affiliated colleges. There are a large number of institutionsthat are technically under <strong>the</strong> purview of <strong>the</strong> UGC butare not provided financial support by it because <strong>the</strong>y fail<strong>to</strong> fulfill <strong>the</strong> minimum eligibility norms.Faculty: Shortage of quality faculty is one of <strong>the</strong> mainproblems afflicting higher education in India <strong>to</strong>day.Teacher shortages often occur due <strong>to</strong> non availabilityof suitably qualified people. Fur<strong>the</strong>r, <strong>the</strong> academicprofession has seen a steady decline in popularity –possibly as a result of lack of incentives here and morelucrative opportunities in o<strong>the</strong>r professions. Apart fromincreasing compensation of teachers, <strong>the</strong>re is also a need<strong>to</strong> introduce performance-based incentives in order <strong>to</strong>ensure teaching of superior quality.Funding: Public expenditure (Centre and States)on education is only around 3.6 per cent of GDP.Government funding of higher education is still below1 per cent of GDP. The percentage expenditure onUniversity and Higher Education <strong>to</strong> GDP, which was0.77 per cent in 1990-91 showed a gradual decrease<strong>to</strong> 0.66 per cent in 2004-2005. Various committeeshave unanimously recommended that state fundingbe increased <strong>to</strong> 6 per cent. While <strong>the</strong> Central AdvisoryBoard for Education (CABE) recommends spending1 per cent <strong>to</strong> higher education and 0.5 per cent <strong>to</strong>technical education, <strong>the</strong> proportions in 2004-05 were0.34 per cent for higher education and 0.03 per cent fortechnical education.India also has one of <strong>the</strong> lowest public expenditure onhigher education per student at 406 US Dollars, whichcompares unfavourably with Malaysia (11,790 dollars),China (2728 dollars), Brazil (3986 dollars), Indonesia(666 dollars) and <strong>the</strong> Philippines (625 dollars). Innominal terms <strong>the</strong> public expenditure per student inhigher education s<strong>to</strong>od at Rs. 12518 respectively in 2003-04. The trend analysis shows that <strong>the</strong> increase is not thatmarked if we consider <strong>the</strong> growth in enrolment, with<strong>the</strong> nominal public expenditure per student in highereducation going up by only 40 per cent from 1993-94<strong>to</strong> 2003-04. In fact, in real terms, public expenditureper student in higher education has declined fromRs. 8961 in 1993-94 <strong>to</strong> Rs. 7117 in 2003-04.Figure 17: Disparities in enrolment in higher education (2004-05)2520Gross Enrolment Ratio151050Source: UGCRuralUrban Male Female SCs STs OBCs O<strong>the</strong>rs All India186 <strong><strong>Nation</strong>al</strong> <strong>Knowledge</strong> <strong>Commission</strong>
Figure 18: Sec<strong>to</strong>r-wise plan & non-plan budgeted expenditure for educationdepartments of State & Centre (Revenue Account)ElementarySecondary Higher Technical4500040000(Rs. thousand crore)350003000025000200001500010000500001993-941994-951995-961996-971997-981998-991999-20002000-012001-022002-032003-04(R)2004-05(B)Source: MHRDFigure 19: Public expenditure per student in higher education - nominal and realNominalReal140001200010000800060004000200001993-941994-951995-961996-971997-981998-991999-20002000-012001-022002-032003-04Source: Analysis of Budgeted Expenditure on Education, MHRD, Govt. of IndiaPrivate institutions: The share of private unaidedhigher education institutions increased from 42.6 percent in 2001 <strong>to</strong> 63.21 per cent in 2006. Their shareof enrolments also increased from 32.89 per cent <strong>to</strong>51.53 per cent in <strong>the</strong> same period. This trend is likely<strong>to</strong> continue and <strong>the</strong>refore, it is reasonable <strong>to</strong> expectthat about half of incremental enrolment targeted forhigher education will come from private providers.There is a need for <strong>the</strong> state <strong>to</strong> recognise <strong>the</strong> role of<strong>the</strong> private sec<strong>to</strong>r and encourage <strong>the</strong>ir participation.There has already been a de-fac<strong>to</strong> privatisation of <strong>the</strong>professional education sec<strong>to</strong>r, with more than 80 percent of <strong>the</strong> engineering colleges being privately fundedand managed. While <strong>the</strong>re are strict entry barriers for<strong>the</strong> private sec<strong>to</strong>r, <strong>the</strong>re is not enough regulation on <strong>the</strong>products and outputs of <strong>the</strong> private sec<strong>to</strong>r.Accreditation: Accreditation in higher educationpertains <strong>to</strong> determining <strong>the</strong> quality of an institution.The criteria on which institutions are judged typicallyinvolve expected student achievement, quality ofcurriculum, faculty, academic support and services forstudents, and financial capacity. In India accreditation(unlike in o<strong>the</strong>r countries such as <strong>the</strong> USA and <strong>the</strong> UK)is performed by government agencies. The <strong><strong>Nation</strong>al</strong>Assessment and Accreditation Council (NAAC) wasset up by <strong>the</strong> UGC in 1994 <strong>to</strong> accredit institutionsof higher education. The NAAC’s assessment is basedon pre-determined criteria that combine self-studyand peer review. NAAC accredits and certifies foreducational quality in institutions based on sevencriteria with different weights for each criterion, andfor different types of institutions. NAAC has so far<strong>Report</strong> <strong>to</strong> <strong>the</strong> <strong>Nation</strong>187
completed accreditation of only 140 out of <strong>the</strong> 355universities and 3,492 out of <strong>the</strong> 18,064 colleges. Thiscovered just over 10 per cent of all institutions, andbarely any private colleges and universities. The resultsof <strong>the</strong> accreditation process thus far indicate seriousquality problems. Only 9 per cent of <strong>the</strong> colleges and31 per cent of <strong>the</strong> universities are rated as ‘A’ grade and<strong>the</strong> rest fall in ‘B’ and ‘C’ categories. Accreditation byNAAC is voluntary and valid for five years. However,very few institutions have applied for accreditationby NAAC.Quality: There are concerns about <strong>the</strong> quality ofhigher education provided in India currently. There isan annual outflow of more than 1,50,000 students <strong>to</strong>institutes in <strong>the</strong> west every year – driving out nearly2-3 billion dollars in foreign exchange per annum. Itmakes India <strong>the</strong> second-largest target market globallyfor education institutes in <strong>the</strong> west. Though <strong>the</strong>problem of reaching world class standards is not aspressing as meeting <strong>the</strong> larger needs of <strong>the</strong> population,India’s standing in this regard is indicative perhapsof <strong>the</strong> generally low standards. In a London TimesHigher Education Supplement ranking of <strong>the</strong> <strong>to</strong>p200 universities, only 1 Indian institution waslisted, while <strong>the</strong> Shanghai University ranking of500 world-class universities featured only 3 Indianuniversities.Figure 20: Country wise Number of Universities in Times Top 100 Universities353031252015131050654321USA UK Australia France China Canada Singapore IndiaSource: Times Higher Education Supplement, LondonTable 12: Current Quality Status in Colleges of Higher Education in India (2005)DetailsNumberTotal number of colleges 17,625Number of colleges under UGC purview 14,000Number of colleges recognised under Section 2(f) of UGC Act5,589 (40 per cent)Number of colleges recognised under Section 12(B) of UGC Act5,273 (38 per cent)Number of colleges actually funded by <strong>the</strong> UGC4,870 (35 per cent)Number of colleges accredited by <strong>the</strong> NAAC2,780 (20 per cent)Number of colleges accredited by <strong>the</strong> NAAC and scoring above 60 per cent 2,506 (17.9)Source: MHRD188 <strong><strong>Nation</strong>al</strong> <strong>Knowledge</strong> <strong>Commission</strong>
More Talented Studentsin Maths and ScienceIntroductionAs India seeks <strong>to</strong> establish itself as a knowledgesuperpower, it is essential for it <strong>to</strong> build onits science and technology base. Pure scienceshas a critical role <strong>to</strong> play in this – a strong foundationin science helps in building excellence in technology,propelling economic growth and prosperity, andconsequently raising living standards. While India hashad a rich heritage in abstract thinking and scientificdiscoveries, of late <strong>the</strong> progress in this field has beenon <strong>the</strong> decline. It is increasingly felt that with <strong>the</strong>popularity of arts, commerce and professional courses,and more lucrative opportunities in related professions,<strong>the</strong>re has been a decline in students studying purema<strong>the</strong>matics and science. In order <strong>to</strong> create a criticalbase of scientific professionals in <strong>the</strong> country it isnecessary that immediate steps be taken <strong>to</strong> attractmore quality students in ma<strong>the</strong>matics and science.Current ScenarioSchool level: While science dominates as <strong>the</strong> mostpreferred subject at <strong>the</strong> middle school level (class 6-8), itbecomes less popular at <strong>the</strong> higher secondary level (class11-12). In a science survey conducted by <strong>the</strong> NCAER,22 per cent of <strong>the</strong> class 6-8 students said <strong>the</strong>y wouldlike <strong>to</strong> study pure science in <strong>the</strong> future. Yet, at <strong>the</strong> levelof class 11 and 12, only 13.4 per cent of <strong>the</strong> surveyedstudents wanted <strong>to</strong> study pure sciences at <strong>the</strong> graduate/postgraduate level. This percentage is lower than <strong>the</strong>figure for o<strong>the</strong>r disciplines – engineering, medicine, artsand commerce.Fur<strong>the</strong>r, <strong>the</strong> number of students opting for scienceafter <strong>the</strong> secondary school stage has dropped from 32per cent in <strong>the</strong> early 1950s <strong>to</strong> 19.7 per cent in recentyears. More significantly, while in <strong>the</strong> 1950s, <strong>the</strong>brightest students entered science, <strong>the</strong> current sciencestudents often take it as a last resort. This indicatesthat young students, particularly <strong>the</strong> brighter ones, aredrifting away from science. For instance, as reportedby Homi Bhabha Centre for Science Education(HBCSE), very few students selected for Olympiadsin Physics, Chemistry or Biology went on <strong>to</strong> opt forhigher education in basic sciences. The choice of <strong>the</strong><strong><strong>Nation</strong>al</strong> Talent Search awardees also reflects this trendin recent years. Of <strong>the</strong> 750 awardees, only about 100Figure 21: Preferred subject for higher education by level of students (2004)Science Engineering Medicine Arts Commerce O<strong>the</strong>rs10080% of students60402006th - 8th 9th 10th 11th - 12thClassSource: India Science <strong>Report</strong>, <strong><strong>Nation</strong>al</strong> Council of Applied Economic Research<strong>Report</strong> <strong>to</strong> <strong>the</strong> <strong>Nation</strong>189
opted for science and only 15 <strong>to</strong> 20 of <strong>the</strong> awardeespursued science <strong>to</strong> <strong>the</strong> post-graduation level.Fur<strong>the</strong>r analysis of <strong>the</strong> reasons behind why students takescience or choose not <strong>to</strong> take science at higher secondarylevel reveals that passion for science is <strong>the</strong> primary decisionfac<strong>to</strong>r. Not surprisingly, ‘better job opportunities’ is <strong>the</strong>second most important reason for taking up scienceat higher secondary level. Peer pressure, <strong>the</strong> changingsocio-economic situation, and market mechanisms haveresulted in <strong>the</strong> drift of students away from basic sciences<strong>to</strong> professional courses which lure <strong>the</strong> student pool withhigh salaries. (See Tables 13 and 14)Table 13: Reasons for taking admission in scienceReasonPercentage of sciencestudents(Class 11 & 12)Interested in science subjects 66.6Better job opportunities 20.4Parents’ desire 3.3Interested in doing research1.8in scienceInfluenced by <strong>the</strong> work of1.3scientistsQuality of science teachers0.8is very goodInfluence of peer group 0.7Intend <strong>to</strong> go abroad 0.2O<strong>the</strong>rs 4.8Source: India Science <strong>Report</strong>, <strong><strong>Nation</strong>al</strong> Council of Applied EconomicResearchTable 14: Reasons for not taking admission inscienceReasonPercentage of nonsciencestudents(Class 11 & 12)Not interested in science subjects 44.5Difficult subject 20.4Higher studies are costly 9.9Interested in commerce 5.4Like art subjects 4.8No future opportunities 2.1No science college nearby 2Difficult <strong>to</strong> get through1.1competitive examinationPoor quality of teaching at school 1.1O<strong>the</strong>rs 8.9Source: India Science <strong>Report</strong>, <strong><strong>Nation</strong>al</strong> Council of Applied EconomicResearchHigher education: Approximately 2.25 millionstudents were enrolled in science in 2005-06 (UGC)– accounting for 19 per cent of <strong>the</strong> <strong>to</strong>tal enrolmentin higher education. The number in absolute termsis not small. The s<strong>to</strong>ck situation in 2004 was alsogood. About a fourth of those qualified <strong>to</strong> <strong>the</strong> levelof graduate and above had a background of scienceeducation. There are 8.74 million graduates in all (22.3per cent of <strong>to</strong>tal graduates), 1.8 million postgraduates(19.4 per cent of <strong>to</strong>tal post graduates), and 0.1 milliondoc<strong>to</strong>rates (one-third of <strong>to</strong>tal doc<strong>to</strong>rates) in science.However enrolments in pure science and ma<strong>the</strong>maticshave not grown as much as in professional fields. Even<strong>the</strong> number of students from India going abroad <strong>to</strong>Figure 22: Gross enrolment in higher educationArtsScienceCommerce/Management60000005000000400000030000002000000100000001995-96 2000-01 2005-06Source: UGC190 <strong><strong>Nation</strong>al</strong> <strong>Knowledge</strong> <strong>Commission</strong>
Figure 23: State-wise enrolment in science (2000-01)300000250000200000150000100000500000Andhra PradeshTamil NaduUttar PradeshMaharashtraGujaratWest BengalMadhya PradeshKeralaKarnatakaGujaratOrissaRajasthanJharkhandChhattisgarhPunjabAssamHaryanaJ&KSource: University Development in India, 1995-95 <strong>to</strong> 2000-01, UGCFigure 24: Science and engineering doc<strong>to</strong>ral degrees as a percentage of all doc<strong>to</strong>raldegrees in selected countries706560555045403530France Mexico China USA Brazil UK Russia Germany India Korea JapanSource: NSF, Science and Engineering Indica<strong>to</strong>rs 2004, Appendix table 2-36pursue maths and science has fallen. According <strong>to</strong>MHRD figures, <strong>the</strong>re has been an absolute decreaseof 33 per cent in <strong>the</strong> number of students going abroadin <strong>the</strong> science stream (between 1991 and 1998) while<strong>the</strong> numbers in banking, technology, commerceand management have increased considerably. Thiscould be a result of shift in student interest <strong>to</strong> pursuecourses which have better career options than science.There is also a striking regional imbalance inenrolment in science with Andhra Pradesh and TamilNadu having much larger students taking up sciencethan in <strong>the</strong> o<strong>the</strong>r states.Research: While research in all areas requires attention,<strong>the</strong> condition of science is particularly dismal. Theabsolute number of science graduates is not smallbut <strong>the</strong> number of doc<strong>to</strong>rates in science streamleaves much <strong>to</strong> be desired. According <strong>to</strong> 2005-06UGC figures, science doc<strong>to</strong>ral students formed only1.1 per cent of <strong>the</strong> graduate enrolment in science. Whilemost advanced countries have more than 60 per cen<strong>to</strong>f <strong>to</strong>tal doc<strong>to</strong>ral degrees in science and engineeringfields, India has only 46 per cent doc<strong>to</strong>rates in scienceand engineering (See Figure 24).The declining interest in science and ma<strong>the</strong>maticsneeds <strong>to</strong> be addressed comprehensively. Issues relating<strong>to</strong> pedagogy, evaluation, curriculum, careers, andinfrastructure need <strong>to</strong> be tackled effectively. Large scalescience popularisation programs could also re-establish<strong>the</strong> passion science once generated.<strong>Report</strong> <strong>to</strong> <strong>the</strong> <strong>Nation</strong>191
Legal EducationIntroductionLegal Education as an aspect of professionaleducation has assumed considerable significance,not only in terms of <strong>the</strong> his<strong>to</strong>rical utility of law insociety but also in <strong>the</strong> current context of globalisation.Legal education is a vital link in <strong>the</strong> creation ofknowledge concepts as well as in <strong>the</strong> application of suchconcepts in society. The need for trained law personnelin academia, litigation, corporate practice, governmentand civil society has increased significantly over <strong>the</strong>last few years and it is estimated that <strong>the</strong> demands forsuch trained personnel will rise far more exponentiallyin <strong>the</strong> years <strong>to</strong> come. There is <strong>the</strong>refore a need <strong>to</strong>articulate a clear long term vision on legal educationin India.Current ScenarioInstitutions: As in 2006, <strong>the</strong>re were roughly 750institutions in India imparting legal education.Of <strong>the</strong>se, 153 were government institutionsand 586 were private institutions. There were a<strong>to</strong>tal number of 11 <strong><strong>Nation</strong>al</strong> Law School Universities(NLSUs).Enrolment: In 2005-06, <strong>the</strong>re were 3.36 lakh studentsenrolled in legal education in India, accounting for 3.05 percent of <strong>the</strong> <strong>to</strong>tal enrolment in higher education. Fur<strong>the</strong>r,a <strong>to</strong>tal of 936 students were admitted <strong>to</strong> <strong>the</strong> NLSUs in2006.Figure 25: Number of institutions teaching law (2006)8007497006005865004003002001000Total153Government Private NLSU11Source: Bar Council of India192 <strong><strong>Nation</strong>al</strong> <strong>Knowledge</strong> <strong>Commission</strong>
Figure 26: Total enrolment in lawPercentage of <strong>to</strong>tal enrolment in higher educationTotal enrolment in law4.543.532.521.510.501995-96 1996-97 1997-98 1998-99 1999-2000 2000-01272000270000268000266000264000262000260000258000256000Source: University Development in India, 1995-96 <strong>to</strong> 2000-01, UGCFigure 27: Total number of law graduates admitted <strong>to</strong> <strong>the</strong> Bar50,00045,00046,43840,00035,00033,65730,00028,26825,00020,00015,00010,0005,00002002 2003 2004Source: Bar Council of India<strong>Report</strong> <strong>to</strong> <strong>the</strong> <strong>Nation</strong>193
Medical EducationIntroductionAssuring a minimal level of health care <strong>to</strong> <strong>the</strong>population is a critical constituent of <strong>the</strong>development process. As a result, <strong>the</strong> goal andobjectives of medical education, its quality and quantityhas wide ramifications for human development, healthservices and build up of intellectual capital for <strong>the</strong>welfare of <strong>the</strong> whole country. While medical educationin India has expanded in <strong>the</strong> last 60 years, it continues<strong>to</strong> remain inadequate given <strong>the</strong> needs of <strong>the</strong> country.This is reflected in <strong>the</strong> shortage of health professionalsand health services, with wide disparities betweenrural and urban areas and also between various states.There is thus an urgent need <strong>to</strong> expand India’s medicaleducation system while keeping issues of quality inconsideration.Current ScenarioEnrolment: The number of students enrolled in medicaleducation has increased by around 85 per cent in <strong>the</strong>last ten years, from 1,88,187 in 1995-96 <strong>to</strong> 3,48,485in 2005-06. However, enrolment in medicine as aproportion <strong>to</strong> <strong>to</strong>tal enrolment in higher education hasbarely increased – it has changed from 2.9 per cent in1995-96 <strong>to</strong> 3.1 per cent in 2005-06.Institutions: The <strong>to</strong>tal number of medical colleges(allopathy, ayurveda, homeopathy, unani, dental,nursing and pharmacy) put <strong>to</strong>ge<strong>the</strong>r s<strong>to</strong>od at 2092in 2005-06. This was a sharp increase from just 817medical colleges in 2004-05.Allopathic Medical Colleges: As of 2006, <strong>the</strong>re were 262allopathic medical colleges in <strong>the</strong> country, out of which174 medical colleges were recognised under Section 11(2)of <strong>the</strong> IMC Act, 1956 by Medical Council of India. Theremaining 88 colleges are permitted under Section 10Aof <strong>the</strong> IMC Act, 1956 for starting MBBS courses. Out of<strong>the</strong> 262 medical colleges, 131 were government medicalcolleges, and remaining 131 were private medical colleges.The admission capacity in <strong>the</strong>se colleges is approximately29,172 students per year. The increase in private medicalcolleges has been sharp – <strong>the</strong>y grew from 47 in 1995 <strong>to</strong>131 in 2006. In <strong>the</strong> same period, government run medicalcolleges have increased only from 109 <strong>to</strong> 131.AYUSH Medical Colleges: Ayurveda, Yoga and Naturopathy,Unani, Siddha and Homeopathy (AYUSH) colleges haveseen a gradual increase in <strong>the</strong> last five years. (See Figure 31)It is a matter of concern that a large number of medicalcolleges are concentrated in six states (Maharashtra,Karnataka, Andhra Pradesh, Tamil Nadu, Kerala andFigure 28: Growth in enrolment in medicine4000003500003000002500002000001500001000005000001995-96 2000-01 2005-06Source: UGC194 <strong><strong>Nation</strong>al</strong> <strong>Knowledge</strong> <strong>Commission</strong>
Figure 29: Growth in medical colleges25002092200015001000759 78381750002002-03 2003-04 2004-052005-06Source: MHRD, Selected Statistics 2005-06Figure 30: Growth in medical colleges – government and privateGovernmentPrivate1401201008060402001993 1994 1995 1996 1997 1998 1999 2000 2001 2002 2003 2004 2005 2006Source: Medical Council of IndiaGujarat). These states cover about 63 per cent of <strong>the</strong> <strong>to</strong>talnumber of medical colleges and 67 per cent of <strong>the</strong> numberof seats. In contrast <strong>to</strong> this, a disproportionately smallnumber of colleges/seats are located in <strong>the</strong> o<strong>the</strong>r states– 20 per cent of <strong>the</strong> aggregate number of colleges and 18per cent of <strong>the</strong> seats in <strong>the</strong> case of <strong>the</strong> Empowered ActionGroup states; and 3 per cent of <strong>the</strong> aggregate number ofcolleges and 3 per cent of <strong>the</strong> seats in <strong>the</strong> North Eastern/Hilly states. There is also a rural urban divide with only30 per cent of <strong>the</strong> population in <strong>the</strong> urban areas with96 per cent of educational institutes here, whereas wheremore than 70 per cent of <strong>the</strong> population lives, availabilityof educational facilities is meager.Regulation: A plethora of bodies exist <strong>to</strong> controlmedical education. Authorities involved includeMinistry of Health, Medical Council of India(MCI), UGC, State Medical Education Departmentsand Councils, Medical Colleges/Institutes, NAMSand NBE (<strong><strong>Nation</strong>al</strong> Board of Examinations). TheMedical Council of India (MCI) was established in1933 and as per Indian Medical Council Act 1933is <strong>the</strong> statu<strong>to</strong>ry recommending body. The MCI onlyrecognises institutions <strong>to</strong> start a course and expand itaccording <strong>to</strong> laid down criteria under <strong>the</strong> MCI Act of1956. With <strong>the</strong> prior permission of <strong>the</strong> Governmen<strong>to</strong>f India, it has no regula<strong>to</strong>ry powers; it is only arecommenda<strong>to</strong>ry body. Over <strong>the</strong> years it has failed<strong>to</strong> serve <strong>the</strong> purpose and led <strong>to</strong> a progressive declinein medical education. The State Medical EducationDepartments and Councils grant licenses <strong>to</strong> practicewithout assessment. Medical colleges largely follow<strong>Report</strong> <strong>to</strong> <strong>the</strong> <strong>Nation</strong>195
<strong>the</strong> MCI with no attempt <strong>to</strong> upgrade or evaluatestudents or courses.Quality: There is lack of consistent and regulatedstandards in medical education with many of <strong>the</strong>colleges having questionable training capacities and noaccreditation system. Medical graduates are often notassessed for clinical skills in accordance with nationaland international standards. There is lack of appropriateregulation and that fur<strong>the</strong>r compounds <strong>the</strong> problem.State governments can grant license <strong>to</strong> practice generalspecialty, sub-specialty or super-specialty medicine withno assessment of clinical skills. With roughly 26000graduates passing out from MBBS every year and only11-12 thousand postgraduate seats, about 14-15 thousandgraduates get in<strong>to</strong> medical practice with <strong>the</strong>oreticalknowledge but no application of knowledge. MCI hasnei<strong>the</strong>r <strong>the</strong> power nor <strong>the</strong> infrastructure <strong>to</strong> continuouslymoni<strong>to</strong>r and standards. Major reforms at each levelare needed in order <strong>to</strong> elevate <strong>the</strong> present condition ofmedical education in India <strong>to</strong> international standards.Curriculum: The graduate course is 4½ years withassessments in <strong>the</strong> 1 st year and 2 nd year and 2½ years later,by internal and external examiners assessing <strong>the</strong>oreticalknowledge acquired. Skill assessment is limited <strong>to</strong> acase discussion. Internship is of 1 year duration with nofaculty supervision or system of assessment. The graduateacquires unsupervised clinical skills after leaving medicalschool and before entering general practice. Only aboutfive thousand can get a postgraduate seat and <strong>the</strong>n gothrough a graded clinical responsibility. It is <strong>the</strong>reforenot surprising that a series of studies conducted byAIIMS and a consortium of 16 medical colleges duringFigure 31: Growth of AYUSH colleges in India460440420431 4314444003803603743883403202000-01 2001-02 2002-03 2003-04 2004-05Source: Medical Council of IndiaFigure 32: State wise distribution of medical colleges (2005)MaharashtraKarnatakaAndhra PradeshTamil NaduKeralaUttar PradeshGujaratWest BengalRajasthanMadhya PradeshBiharPunjabDelhiJammu & KashmirOrissaJharkhandHaryanaAssamUttaranchalHimachal PradeshChhattisgarhTripuraGoa0 5 10 15 20 25 30 35 40 45Source: Medical Council of India196 <strong><strong>Nation</strong>al</strong> <strong>Knowledge</strong> <strong>Commission</strong>
1989-1995 concluded that our medical graduates lackclinical skills. As a follow up <strong>to</strong> <strong>the</strong>se studies, WHOSEARO conducted a study General Practice in India,Nepal & Sri Lanka- a status report (1998) which found <strong>the</strong>medical care delivered by a sample of general practitioners<strong>to</strong> be of questionable quality.Funding: The Central Budget allocation for healthwhich includes medical education has declined from1.3 per cent of <strong>the</strong> GDP in 1999 <strong>to</strong> about 0.9 percent <strong>to</strong>day. As a percentage share of <strong>the</strong> Total CentralBudget, it has been stagnant at 1.3 per cent, while in<strong>the</strong> states, it has declined from 7 per cent <strong>to</strong> 5.5 per cent(<strong><strong>Nation</strong>al</strong> Health Policy 2002). The results from <strong>the</strong><strong><strong>Nation</strong>al</strong> Health Account (NHA) for <strong>the</strong> year 2001-02showed that <strong>to</strong>tal health expenditure in <strong>the</strong> country wasRs. 1,05,734 crore, accounting for 4.6 per cent of itsGDP. Out of this, public health expenditure constitutedRs. 21,439 crore (0.94 per cent), private heal<strong>the</strong>xpenditure constituted Rs. 81,810 crore (3.58 per cent)and external support Rs. 2,485 crore (0.11 per cent).In nominal terms, <strong>the</strong> per capita public heal<strong>the</strong>xpenditure increased from Rs. 89 in 1993-94 <strong>to</strong>Rs. 214 in 2003-04, which in real terms is Rs. 122.Given <strong>the</strong>se statistics, it is no surprise that <strong>the</strong> reachand quality of public health services has been below <strong>the</strong>desirable standard.Health Services and Medical Personnel: While Indiahas seen considerable improvements in health standardsin <strong>the</strong> last six decades, problems of access <strong>to</strong> qualityhealthcare and shortages of skilled medical personnelstill persist. As per 2007 figures, India had 6.9 lakhregistered allopathic doc<strong>to</strong>rs, 7.2 lakh AYUSH doc<strong>to</strong>rs,15 lakh nurses and 6.8 lakh pharmacists. While <strong>the</strong>absolute number is not very low for a developingcountry, <strong>the</strong> numbers prove inadequate in view ofIndia’s large population.Figure 33: Growth of per capital health expenditure by Centre and StatesNominalReal2502001501005001993-94 1994-95 1995-96 1996-97 1997-98 1998-99 1999-2000 2000-01 2001-02 2002-03 2003-04Figure 34: Number of doc<strong>to</strong>rs per 1000 populationGreeceItalyFranceGermanyAustraliaUSUKJapanIndia0 0.5 1 1.5 2 2.5 3 3.5 4 4.5 5Source: Journal of Royal Society of Medicine Vol. 99, June 2006<strong>Report</strong> <strong>to</strong> <strong>the</strong> <strong>Nation</strong>197
Management EducationIntroductionIn recent years <strong>the</strong>re has been an unprecedentednumber of technical and management institutionsbeing set up, mostly through private capital. In<strong>the</strong> field of management education, India has around1200 institutions providing undergraduate andpost-graduate level courses. Since <strong>the</strong> managementgraduates and post-graduates produced by <strong>the</strong>seinstitutions are primarily absorbed by industry,<strong>the</strong>re is a growing need <strong>to</strong> match <strong>the</strong> curriculum andstructure of management education <strong>to</strong> better fit <strong>the</strong>needs of India and <strong>to</strong> <strong>the</strong> changes in <strong>the</strong> industrialand services sec<strong>to</strong>rs within <strong>the</strong> country. Moreover,it is important <strong>to</strong> properly assess <strong>the</strong> quality ofmanagement education imparted <strong>to</strong> <strong>the</strong> students ofvarious institutions.Current ScenarioAs in 2006-07, <strong>the</strong>re were over 1100 business schools in<strong>the</strong> country. Of <strong>the</strong>se, 5 were private aided institutions,903 were private unaided and 149 were governmentinstitutions.In <strong>the</strong> last decade, <strong>the</strong> country has witnessed aphenomenal growth in enrolment in managementeducation. The current intake stands at roughly 92,000,with <strong>the</strong> majority of <strong>the</strong> students enrolled in privatemanagement colleges.The distribution of management institutions shows aregional imbalance, with 86 per cent of <strong>the</strong> collegesconcentrated in north and south India. There appears<strong>to</strong> be a correlation between <strong>the</strong> number of schools ina state and its economic and industrial development.The regional imbalances in development and <strong>the</strong>creation of capacity for management education in <strong>the</strong>state are probably related.A large proportion of <strong>the</strong> capacity is filled through all-India examinations conducted at a number of locationsthroughout <strong>the</strong> country. Therefore, a high per capita seatcapacity for a state does not necessarily mean a higherFigure 35: Number of management institutions(2006-07)1200Figure 36: Intake in management colleges(2006-07)1000001000800800006000060040000400200200000Government Private Total0Government Private TotalSource: MHRDSource: MHRD198 <strong><strong>Nation</strong>al</strong> <strong>Knowledge</strong> <strong>Commission</strong>
Figure 37: Regional distribution of managementcolleges (2006-07)7%17%46%North South East West30%opportunities in education. The imbalance betweendemand and supply for management graduates has led<strong>to</strong> an overly commercial and exploitative environmentin management education. It is not clear how many of<strong>the</strong> recently started institutions are merely speculativeand how many are seriously committed <strong>to</strong> <strong>the</strong> cause ofmanagement education. It is not also clear how manyactually meet <strong>the</strong> norms and standards establishedby <strong>the</strong> All India Council for Technical Education.The regula<strong>to</strong>ry framework and implementation hasbeen unable <strong>to</strong> link <strong>the</strong> entrepreneurial initiative <strong>to</strong>performance in terms of educational quality. It has acontrol perspective focusing on inputs such as land,faculty, and o<strong>the</strong>r infrastructure ra<strong>the</strong>r than on <strong>the</strong>outcomes such as quality of education, research,access, cost effectiveness or relevance.Source: MHRDlevel of opportunity for aspirants from that state. Theper capita seats per lakh of population may be partlya reflection of <strong>the</strong> state’s capacity <strong>to</strong> absorb a higherpercentage of management graduates.Growth in <strong>the</strong> number of business schools hasaccelerated over <strong>the</strong> last two decades. This acceleration,propelled by <strong>the</strong> increase in <strong>the</strong> rate of growth of <strong>the</strong>Indian economy, speaks also for <strong>the</strong> entrepreneurialinitiative of promoters <strong>to</strong> seize commercialTable 15: Growth of business schools in Indiaduring 1950-2006PeriodNo. ofBusinessschools addedAverageannualaddition1950-80 (30 years) 118 41980-1995 (15 years) 304 201995-2000 (5 years) 322 642000-2006 (6 years) 1017 169Source: Adapted from Dayal, I., “Developing Management Education inIndia”, Journal of Management Research, 2(2), August 2002, page: 101.Figure 38: State-wise MBA/PGDBM seats per lakh population (2006)2520151050DelhiAndhra PradeshMaharashtraTamil NaduGoaKarnatakaPunjabHaryanaUttaranchalOrissaUttar PradeshKeralaMadhya PradeshGujaratJ&KJharkhandWest BengalNagalandHimachal PradeshTripuraChhattisgarhManipurAssamBiharSource: <strong>Report</strong> of <strong>the</strong> Working Group on Management Education, <strong><strong>Nation</strong>al</strong> <strong>Knowledge</strong> <strong>Commission</strong><strong>Report</strong> <strong>to</strong> <strong>the</strong> <strong>Nation</strong>199
Engineering EducationIntroductionWith economic growth and <strong>the</strong> spread oftechnology, <strong>the</strong> demand for engineers hasincreased manifold. This has been matchedby an increase in enrolments in engineering as well as risein number of engineering institutes in India. Howeverkeeping in mind <strong>the</strong> growing opportunities for engineers,particularly in <strong>the</strong> field of information technology andbusiness process outsourcing, <strong>the</strong>re is scope for fur<strong>the</strong>rexpansion. A NASSCOM report foresees a shortageof 500,000 knowledge workers by 2010, 70 percent of which would be in <strong>the</strong> BPO industry. At <strong>the</strong>same time, <strong>the</strong> quality of engineering institutes andengineering graduates needs <strong>to</strong> be improved. Apart froma few elite institutes, engineering education in India isoften seen as outdated and irrelevant. Most graduates donot possess <strong>the</strong> requisite skills, and industries have beenfacing a consistent deficit of quality trained engineers.Also, most institutes, including premier institutes, fail<strong>to</strong> attract and retain quality faculty. These deficiencies inengineering education need <strong>to</strong> be tackled immediately<strong>to</strong> ensure that India does not miss out on significan<strong>to</strong>pportunities.Current ScenarioEnrolment: Enrolment in engineering education has seena rapid increase in <strong>the</strong> last decade. The <strong>to</strong>tal enrolmentin 2005-06 s<strong>to</strong>od at 795120 – accounting for 7.21 percent of <strong>the</strong> <strong>to</strong>tal enrolment in higher education.Institutions: There has been a phenomenal growth in<strong>the</strong> number of engineering institutions at <strong>the</strong> graduatelevel, from 158 in 1980-81 <strong>to</strong> 1512 in 2006-07. A majorreason for this explosive growth in <strong>the</strong> last decade hasbeen <strong>the</strong> entry of private (aided as well as self financing)institutions. With <strong>the</strong> growth in demand, <strong>the</strong> averagesanctioned intake per institution has also increasedwith time.The investment from private sec<strong>to</strong>r has had a large role <strong>to</strong>play in <strong>the</strong> growth of institutions. However, <strong>the</strong> qualityof <strong>the</strong>se many of <strong>the</strong>se private institutions is suspect.This has also been a major reason for <strong>the</strong> creation of aregional imbalance in <strong>the</strong> country.Regional imbalance: Although <strong>the</strong> number ofengineering institutions is more than 1500 at present,Figure 39: Time series trend in engineering enrolmentsAs percentage of <strong>to</strong>tal enrolment in higher educationEnrolment in engineering(in %)76.86.66.46.265.85.67000006000005000004000003000002000001000005.41995-96 1996-97 1997-98 1998-99 1999-2000 2000-010Source: University Development in India, 1995-96 <strong>to</strong> 2001-01, UGC200 <strong><strong>Nation</strong>al</strong> <strong>Knowledge</strong> <strong>Commission</strong>
Figure 40: Growth in engineering institutions1600151214001200100080077660040033720001581980 1990 2000 2006Source: UGCdata on <strong>the</strong> region-wise distribution ofinstitutions and sanctioned intake ofstudents indicates regional disparity. Onone hand, where <strong>the</strong>re are around 268institutions in <strong>the</strong> sou<strong>the</strong>rn region, <strong>the</strong>re areonly 9 institutions in <strong>the</strong> eastern region. At<strong>the</strong> extreme end of <strong>the</strong> spectrum, Nagaland,Andaman and Nicobar, Daman & Diu haveno engineering institutions at all. Out of <strong>the</strong>seven Indian Institutes of Technology, three(Delhi, Kanpur and Roorkee) are located in<strong>the</strong> North, two in <strong>the</strong> East (Kharagpur andGuwahati) and two in <strong>the</strong> South (Chennaiand Mumbai).Faculty: The rapid growth of engineeringinstitutions and <strong>the</strong> inadequate supply ofteachers <strong>to</strong>ge<strong>the</strong>r have created a shortage offaculty across engineering disciplines andinstitutions. India has a faculty strength ofaround 67,000 in engineering. According<strong>to</strong> <strong>the</strong> AICTE Review Committee <strong>Report</strong>2003, <strong>the</strong> increase in <strong>the</strong> sanctionednumber of student intake has led <strong>to</strong> anescalation of faculty requirements of about95,924. This indicates a shortfall of over26,000 engineering doc<strong>to</strong>rates and 30,000engineering postgraduates for meeting <strong>the</strong>teaching requirements.Figure 41: Average sanctioned intake per institutionAverage Sanctioned Intake3803603403203002802602402202002000-01 2001-02 2002-03 2003-04 2004-05 2005-06 2006-07Source: AICTEFigure 42: Share of institutions by intake (2006-07)10%3%Private aidedPrivate unaidedGovt. institutionsQuality: Engineering education in Indiahas a pyramidal structure, with a fewelite institutions at <strong>the</strong> peak and a largeproportion of institutions at <strong>the</strong> bot<strong>to</strong>m ofthis pyramid. Flexible institutions, worldSource: AICTE87%<strong>Report</strong> <strong>to</strong> <strong>the</strong> <strong>Nation</strong>201
Figure 43: Region-wise distribution of engineeringinstitutions in 2006-0714%Source: AICTE11% 9%37%8%9%12%CentralEasternNor<strong>the</strong>rnNorth-westSou<strong>the</strong>rnSouth-westWesternclass infrastructure, relevant curriculum, good facultyand industry linkages are crucial inputs needed <strong>to</strong>enhance quality of engineering education in India.Current engineering graduates are often found <strong>to</strong> beill-equipped <strong>to</strong> meet <strong>the</strong> skill demands of <strong>the</strong> industry– a survey by <strong>the</strong> McKinsey Global Institute showedthat multinationals found only 25 per cent of Indianengineers employable.Research: Postgraduate education in engineeringand technology had a late start in our country. At<strong>the</strong> time of India’s independence only 6 institutionsoffered postgraduate programs in engineering andtechnology <strong>to</strong> just about 70 students. In 2003, 1552postgraduate engineering programs were recognised inengineering, offered by 321 institutions with a <strong>to</strong>talsanctioned intake of over 26,000. In 2004-05, only968 doc<strong>to</strong>rate degrees were awarded in engineering,<strong>the</strong> majority of which came ei<strong>the</strong>r from <strong>the</strong> IndianInstitutes of Technology or <strong>the</strong> Indian Institute ofScience, Bangalore.202 <strong><strong>Nation</strong>al</strong> <strong>Knowledge</strong> <strong>Commission</strong>
Open and Distance EducationIntroductionDistance education is provided by openuniversities and correspondence coursesoffered by Distance Education Institutions(DEIs) of conventional universities. Almost onefifthstudents enrolled in higher education in Indiaare receiving education through <strong>the</strong> distance mode,i.e. through <strong>the</strong> open universities or though <strong>the</strong>correspondence courses of traditional universities.Given <strong>the</strong> rapid expansion required in highereducation in India, open and distance educationcan play an extremely significant role in meeting<strong>the</strong> increased demand for higher education.Moreover, <strong>the</strong>re is an unprecedented opportunitywith regard <strong>to</strong> technology especially in <strong>the</strong> formof open courseware. However, problems relating<strong>to</strong> quality as well as brand equity of distanceeducation persist.Current ScenarioEnrolment: In 2004-05, around eleven millionpeople were enrolled in higher education inIndia, of which <strong>the</strong> open and distance educationsystem (including correspondence courses offeredby distance educational institutions (DEIs) ofconventional colleges) served roughly 20 per cent.Within this, open universities served 10 per cen<strong>to</strong>f <strong>the</strong> higher education need. The figure belowillustrates <strong>the</strong> growth in enrolment in highereducation and open and distance educationfrom 1996 <strong>to</strong> 2004. In 2000-01, only 4 percent of <strong>the</strong> higher education need was served byopen universities, but in 2003-04 <strong>the</strong> figure wasaround 10 per cent, while <strong>the</strong> overall distanceeducation contribution is around nineteen percent. The figure below also shows <strong>the</strong> contribution<strong>to</strong> distance education by open universities andby correspondence courses of conventionaluniversities.Figure 44: Contribution of Open and DistanceEducation (ODE)Figure 45: Enrolment in open universities andcorrespondence coursesThousandsThousands120010008006004002000120001000080006000400020000Source: MHRDSource: MHRDTotal enrolment in higher educationEnrolment in open universities and correspondenceEnrolment in ODE as a percentage of <strong>to</strong>tal highereducation251996-97 1997-98 1998-99 1999-00 2000-01 2001-02 2002-03 2003-04Enrolment in open universitiesEnrolment in correspondenceEnrolment in open universities as a percentage of <strong>to</strong>tal higher educationEnrolment in correspondence as a percentage of <strong>to</strong>tal higher education1996-97 1997-98 1998-99 1999-00 2000-01 2001-02 2002-03 2003-042015105014121086420<strong>Report</strong> <strong>to</strong> <strong>the</strong> <strong>Nation</strong>203
Institutions: In India <strong>the</strong>re are 14 open universities– 13 state open universities and one national OpenUniversity – Indira Gandhi <strong><strong>Nation</strong>al</strong> Open University(IGNOU). IGNOU now has a cumulative enrolmen<strong>to</strong>f about 15 lakh, offers a <strong>to</strong>tal of 126 programs and hasa teaching staff of 325 and 1157. Distance educationthrough correspondence courses is provided byo<strong>the</strong>r regular universities as well. As on date <strong>the</strong>re are119 Correspondence Course Institutes (CCIs) inconventional Universities. In 2003, open universitiesserved only eight per cent of <strong>the</strong> <strong>to</strong>tal higher educationenrolment, while correspondence courses constitutednearly one fifth of <strong>the</strong> <strong>to</strong>tal higher education enrolment.Quality: The quality and delivery mechanisms ofdistance education provided by correspondence coursesare relatively poor. Most correspondence courses areinstituted as a mode of resource generation in view of<strong>the</strong> unmet demand for higher education. Fur<strong>the</strong>r, <strong>the</strong>resources thus earned are not used for <strong>the</strong> improvemen<strong>to</strong>f <strong>the</strong> correspondence programs. Therefore, qualityconcerns become secondary <strong>to</strong> those of numbers andincome. Due <strong>to</strong> inadequate mechanisms of qualitycontrol and regulation, students graduating from bothregular courses and correspondence courses get <strong>the</strong> samedegree, despite sharp differences in quality of pedagogicalprocess and achievement. Substantial investments inTable 16: Enrolment in open universities and correspondence courses (1996 <strong>to</strong> 2003)YearTotal enrolment inhigher educationEnrolment inopen universitiesEnrolment inopen universities(% of <strong>to</strong>tal)Enrolment incorrespondenceTotal enrolmentin open & distanceeducation1996-97 6842598 294947 4.31 819110 11140571997-98 7260418 316089 4.35 959228 12753171998-99 7705520 247168 3.21 868459 11156271999-00 8050607 381862 4.74 971991 13538532000-01 8399443 379286 4.52 1055317 14346032001-02 8821095 632214 7.17 1123344 17555582002-03 9516773 765489 8.04 1012779 1778268Source: Department of Secondary & Higher Education, MHRDTable 17: Enrolment and teachers in open universities in India (2003-2004)Open University Enrolment Studentson RollTeachers Budget # RevenueReceipts*Indira Gandhi <strong><strong>Nation</strong>al</strong> Open University, New Delhi 334315 1187100 307 21170 13950Dr. B.R. Ambedkar Open University, Hyderabad 190320 - 89 3320 2730Vardhaman Mahaveer Open University, Kota 5999 - 30 355 390.5Nalanda Open University, Patna 1805 8484 6 948 95.95Yashwantrao Chavan Maharashtra Open University, 102642 800587 39 2189 1600NashikDr. Babasaheb Ambedkar Open University, Ahmedabad 13824 68865 39 - -Madhya Pradesh Bhoj Open University, Bhopal 192230 192230 36 121.5 1129.04Netaji Subhas Open University, Kolkata 14734 225244 4 310 175Uttar Pradesh Rajarshi8025 22172 11 - -Tandon Open UniversityKarnataka State Open University, Mysore 19580 33172 63 46 1156Tamil Nadu Open University, Chennai 9361 9361 20 192.9 192.9#Budget plan + non plan * in Rs LakhSource: Distance Education Council204 <strong><strong>Nation</strong>al</strong> <strong>Knowledge</strong> <strong>Commission</strong>
correspondence courses must be made by universities <strong>to</strong>improve resources, delivery and modes of pedagogicalassistance and assessment.International comparisons: Most of <strong>the</strong> developingcountries worldwide have realised <strong>the</strong> need for openuniversities. Developed countries such as France andUK have pioneered open and distance education. UnitedStates remains <strong>the</strong> undisputed leader in online education.Table 18 below lists mega open universities of <strong>the</strong> world,along with enrolments and budget.Issues in <strong>the</strong> Current Framework1. The same form and structure of degree programs:Open and distance education imparted in openuniversities system has evolved alternative deliverymodes with a lot of flexibility. However, it has retained<strong>the</strong> same form and structure, eventually culminating in adegree or diploma certification. Though this is followed<strong>to</strong> retain recognition from employers and acceptancefrom society, it has not made <strong>the</strong> system responsive <strong>to</strong><strong>the</strong> dynamic developmental needs of <strong>the</strong> people.2. Limited linkages with <strong>the</strong> workplace: The emphasison people’s education with a focus on work relatedskills and productivity as expected in <strong>the</strong> <strong>Report</strong> ofEducation <strong>Commission</strong> (1964-66) on Educationand Development is yet <strong>to</strong> be achieved and built in<strong>to</strong><strong>the</strong> open and distance education system. Linkingeducation with productivity demands linking learningwith workplace based training and education for valueaddition.3. Limited coverage and access: Although <strong>the</strong> existingsize and <strong>the</strong> share of <strong>the</strong> open and distance educationsystem in higher education is significant, it is still <strong>to</strong>osmall <strong>to</strong> support life-long learning for <strong>the</strong> citizens of <strong>the</strong>country.4. Lack of access <strong>to</strong> media: Study texts form <strong>the</strong>main study materials for a large majority of students.Pedagogical use of various electronic media is yet verylimited.5. Lack of coordination: There is an overlap of targetgroups <strong>to</strong> be covered by <strong>the</strong> open schooling and open anddistance higher education. The latter is for mature adultsand many open universities have reduced <strong>the</strong> age criteriafrom 21 years <strong>to</strong> 18 years <strong>to</strong> enable open admissionfor prepara<strong>to</strong>ry courses essential for admission <strong>to</strong> opendegree programs, for those who have not class twelvegraduates. Since open schools also cater <strong>to</strong> mature adults,it is essential <strong>to</strong> have coordination amongst <strong>the</strong> schooland higher education programs <strong>to</strong> cater <strong>to</strong> diverse needsof mature adults.Table 18: Open and distance education in o<strong>the</strong>r countries - mega universitiesCountry Institution Enrolment ~Budget in Million US$ Unit Cost*Pakistan AIOU 456,126Turkey Anadolu 1,187,100 32.4 budget for 2000 10China CCRTVU 2,300,000 40France CNED 184,614 56.0 1995 figure 50India IGNOU 1,187,100 47.0 budget for 2004 35Korea KNOU 196,402 > 79.0 1995 figure 5UK OU 203,744 > 300.0 1995 figure 50Thailand STOU 181,372 > 46.0 1995 figure 30Indonesia UT 222,068 > 21.0 1995 figure 15* Unit cost per student as a percentage of <strong>the</strong> average for o<strong>the</strong>r universities in <strong>the</strong> country<strong>Report</strong> <strong>to</strong> <strong>the</strong> <strong>Nation</strong>205
More Quality Ph.DsIntroductionAs India seeks <strong>to</strong> transform itself in<strong>to</strong> aknowledge society, reviving <strong>the</strong> culture ofresearch and innovation becomes all <strong>the</strong> moreimportant. High quality research in all frontiers ofknowledge is essential <strong>to</strong> achieve long term competitiveadvantage. However, <strong>the</strong> growth in higher educationin India has not been accompanied by an equivalentgrowth in doc<strong>to</strong>ral students. The declining quality ofresearch work and deteriorating research standards andinfrastructure in <strong>the</strong> country are a cause of concern.Inadequate infrastructure and lack of strong incentives<strong>to</strong> practice quality research are major causes of declinein interest <strong>to</strong>wards research work. Administrativehurdles add <strong>to</strong> <strong>the</strong> already unfavourable environmentfor research.Current ScenarioThe current quantum of research happening in Indiais insufficient. Of <strong>the</strong> 11 million students enrolled inhigher education in 2005-06, only 0.64 per cent wereenrolled in research programs. Fur<strong>the</strong>r, out of <strong>the</strong> 17898of doc<strong>to</strong>rate degrees awarded in 2004-05, <strong>the</strong> Faculty ofArts awarded 7532 degrees and <strong>the</strong> Faculty of Scienceshad 5549 degrees. Thus, <strong>the</strong>se two faculties <strong>to</strong>ge<strong>the</strong>raccounted for 73 per cent of <strong>the</strong> <strong>to</strong>tal number of researchdegrees awarded. There are also wide disparities withinstates in <strong>the</strong> number of doc<strong>to</strong>ral degrees granted.India’s poor performance in research is also highlightedby comparisons with o<strong>the</strong>r countries. In 2002, USA had4373, Japan had 5084, Germany had 3208 and evenFigure 46: Growth of doc<strong>to</strong>rates: Faculty-wise number of doc<strong>to</strong>rate degrees awarded20000Arts Science Engg. Med. Vet O<strong>the</strong>rs1800017853 178981600015418140001200011544 1189910000800060004000200002000-01 2001-02 2002-03 2003-04 2004-05Source: Annual <strong>Report</strong>, 2005-06, University Grants <strong>Commission</strong>206 <strong><strong>Nation</strong>al</strong> <strong>Knowledge</strong> <strong>Commission</strong>
Figure 47: State-wise distribution of Ph.D degrees awardedUttar PradeshMaharashtraMadhya PradeshKarnatakaRajasthanKeralaTamil NaduWest BengalDelhiOrissaAndhra PradeshGujaratPunjabHaryanaChhattisgarhAssamUttaranchalChandigarhBiharHimachalJharkhandManipurMeghalayaJ & KGoaArunachalNagalandTripuraSikkim0 200 400 600 800 1000 1200 1400Source: MHRD, Selected Statistics, 2004-05.Figure 48: Growth in number of doc<strong>to</strong>rates compared <strong>to</strong> o<strong>the</strong>r countriesIndia USA China Germany UK Japan45,00040,00035,00030,00025,00020,00015,00010,0005,00001983 1985 1987 1989 1991 1993 1995 1997 1999 2000 2001 2002 2003Source: NSF, Science and Engineering Indica<strong>to</strong>rs 2006, Appendix Tables 2.42 and 2.43China had 633 researchers per million inhabitants whileIndia had only 112. Similarly, while <strong>the</strong> number ofdoc<strong>to</strong>rates increased by only 20 per cent in India, Chinashowed a spectacular growth of 85 per cent in Ph.Ds,Taiwan 57 per cent and Japan 48 per cent between 1991and 2001.Fur<strong>the</strong>r, according <strong>to</strong> <strong><strong>Nation</strong>al</strong> Science Foundation,USA, <strong>the</strong> number of Indians who received USdoc<strong>to</strong>rate degrees in 2003 in science and engineeringis approximately 14000, a figure roughly doublefor Indian science and engineering doc<strong>to</strong>rates whoreceived degrees in India. Indians also earned byfar <strong>the</strong> largest number of U.S. doc<strong>to</strong>ral degreesawarded <strong>to</strong> any foreign group in computerand information sciences. This points out <strong>to</strong> <strong>the</strong>absence of a conducive research environment inIndia.<strong>Report</strong> <strong>to</strong> <strong>the</strong> <strong>Nation</strong>207
Intellectual Property RightsIntroductionIntellectual property rights (IPR) have emergedas an indispensable strategic <strong>to</strong>ol in <strong>to</strong>day’sknowledge economies and societies, particularlyin <strong>the</strong> context of economic globalisation. An entity’sability <strong>to</strong> compete in <strong>the</strong> global market depends <strong>to</strong>a large extent on its capacity <strong>to</strong> generate new ideasthrough innovation in science and technology. IPR, byconferring exclusive monopoly rights <strong>to</strong> its owner fora limited duration, has emerged as a significant fac<strong>to</strong>rin creating incentives for innovation and generationof economic value. An effective IPR system is also aconstituent of a reliable legal environment, which inturn becomes an important fac<strong>to</strong>r for decisions onforeign investment and technology transfer.Current ScenarioPatent trends: India has witnessed a markedrise in <strong>the</strong> number of patent applications filed.While in 1992, 3467 applications were filed, in2006-07, almost 29000 applications were filed.Similarly, number of patents granted has increased– although less rapidly. In <strong>the</strong> past five years,patent grants have shown a more than five-foldincrease.Fur<strong>the</strong>r, of <strong>the</strong> <strong>to</strong>tal of 28940 applications in 2006-07,only 18 per cent were filed by Indian residents – <strong>the</strong>remaining were filed by foreign applicants. This insharp contrast with countries such as USA, China,France, Germany, Korea and UK, where domesticpatent application filing is much higher than foreignapplications.A sec<strong>to</strong>r-wise analysis of patents filed in India showthat <strong>the</strong> chemical, mechanical and computer fieldsrank <strong>the</strong> highest in terms of number of applicationsfiled. However, <strong>the</strong> food, biotechnology and electricalindustries have seen <strong>the</strong> highest growth in <strong>the</strong> lastthree years.International comparisons: India figures in <strong>the</strong> <strong>to</strong>p 20patent offices, both by patent filings and patent grants.Its ranking fur<strong>the</strong>r improves if one takes in<strong>to</strong> accountFigure 52: Comparative Trend of Patents Filed and Granted35000FiledGranted3000025000200001500010000500001992-931993-941994-951995-961996-971997-981998-991999-20002000-012001-022002-032003-042004-052005-062006-07Source: Annual <strong>Report</strong> of <strong>the</strong> Office of <strong>the</strong> Controller General of Patents, Designs, Trademarks, Geographical Indications,Intellectual Property Training Institute, and Patent Information System, 2006-07208 <strong><strong>Nation</strong>al</strong> <strong>Knowledge</strong> <strong>Commission</strong>
Figure 53: Applications filed by Indians and ForeignersIndiansForeigners25000200001500010000500001992-931993-941994-951995-961996-971997-981998-991999-20002000-012001-022002-032003-042004-052005-062006-07Source: Annual <strong>Report</strong> of <strong>the</strong> Office of <strong>the</strong> Controller General of Patents, Designs, Trademarks, Geographical Indications,Intellectual Property Training Institute, and Patent Information System, 2006-07Figure 54: Number of patent applications filed under various fields of inventions70002004-05 2005-06 2006-076000500040003000200010000Chemical Drug Food Electrical Mechanical Computer/ElectronicsBiotechnologyGeneralSource: Annual <strong>Report</strong> of <strong>the</strong> Office of <strong>the</strong> Controller General of Patents, Designs, Trademarks, Geographical Indications,Intellectual Property Training Institute, and Patent Information System, 2006-07Figure 55: India patent figures (2005)30,000Patent filings25,00020,00015,000Patent grants<strong>the</strong> data for <strong>the</strong> year 2006 (WIPO rankings shown beloware based on 2005 figures for India and 2006 figures for<strong>the</strong> o<strong>the</strong>r countries). Yet, when one takes in<strong>to</strong> accountpatent filings as a proportion of population, GDP andR&D expenditure – a better index for innovation –India fares badly.10,0005,0000By patent officeBy country of originSource: WIPO Statistics Database<strong>Report</strong> <strong>to</strong> <strong>the</strong> <strong>Nation</strong>209
Table 21: Patent filings by patent office: Top20 offices, 200620061 United States of America 4259662 Japan 4086743 China 2105014 Republic of Korea 1661895 European Patent Office 1352316 Germany 605857 Canada 420388 Russian Federation 376919 Australia 2600310 United Kingdom 2574511 India (2005) 2450512 Brazil 2407413 France 1724914 Mexico 1550515 Hong Kong (SAR), China 1379016 Singapore 916317 Israel 749618 New Zealand 736519 Thailand 624820 Norway 6076Source: WIPO Statistics DatabaseTable 22: Patent grants by patent office:Top 20 offices, 200620061 United States of America 1737702 Japan 1413993 Republic of Korea 1207904 European Patent Office 627805 China 577866 Russian Federation 232997 Germany 210348 Canada 149729 France 1378810 Mexico 963211 Australia 942612 United Kingdom 790713 Singapore 739314 Hong Kong (SAR), China 514615 India (2005) 432016 Ukraine 370517 New Zealand 341218 Poland 268619 Israel 258420 Brazil 2465Source: WIPO Statistics DatabaseFigure 56: Resident patent filings per million population (2006)JapanKoreaUSGermanyFinlandUKFranceRussiaCanadaSingaporeAustraliaChinaBrazilThailandMexicoIndia500.00 1,000.00 1,500.00 2,000.00 2,500.00 3,000.00Source: WIPO Statistics Database210 <strong><strong>Nation</strong>al</strong> <strong>Knowledge</strong> <strong>Commission</strong>
Figure 57: Resident patent filings per $Billion GDP (2006)KoreaJapanRussiaChinaUSAGermanyFinlandUKFranceCanadaAustraliaBrazilSingaporeIndiaThailandMexico20.00 40.00 60.00 80.00 100.00 120.00 140.00Source: WIPO Statistics DatabaseFigure 58: Resident patent filings per $Million R&D expenditures (2006)6.005.004.003.002.001.000KoreaRussiaJapanSource: WIPO Statistics DatabaseChinaThailandGermanyUSAUKBrazilFranceIndiaFinlandCanadaAustraliaMexicoSingapore<strong>Report</strong> <strong>to</strong> <strong>the</strong> <strong>Nation</strong>211
EntrepreneurshipIntroductionEntrepreneurship is considered <strong>to</strong> be a significantdeterminant of economic development. Newentrepreneurial activities play a vital part in <strong>the</strong>process of creative destruction that fosters innovation,employment, and growth. While India has traditionallybeen an entrepreneurial country, it fares poorly innumerous global studies exploring <strong>the</strong> entrepreneurialand business potential of countries. For instance, in<strong>the</strong> World Bank Doing Business report (2008) whichinvestigates regulations that enhance business activity,India is ranked 120 out of 178 economies. Similarly, in<strong>the</strong> World Economic Forum’s Global CompetitivenessIndex (2007), India ranks 48 th among 131 countries.Current ScenarioAccording <strong>to</strong> <strong>the</strong> Global Entrepreneurship Moni<strong>to</strong>r(2007) report, India’s High-Growth ExpectationEarly-Stage Entrepreneurship (HEA) rate is only onefifthof that of China. Fur<strong>the</strong>r, among medium andlow income countries, while China’s nascent and newentrepreneurs appear <strong>to</strong> be <strong>the</strong> most growth-oriented,with more than 10 per cent of <strong>the</strong>m anticipatinghigh growth. Early-stage entrepreneurial activity inIndia is marked by low levels of growth expectation.This is despite <strong>the</strong> extremely high levels of potentialentrepreneurial activity as perceived by <strong>the</strong> nonentrepreneuriallyactive population in <strong>the</strong> country(See Figure 60).While data on entrepreneurship is hard <strong>to</strong> come by,<strong>the</strong> following numbers are telling. According <strong>to</strong> <strong>the</strong>NSS 62 nd round, in rural India, almost 50 per cen<strong>to</strong>f all workers are self-employed – 57 per cent amongmales and nearly 62 per cent among females, while<strong>the</strong> corresponding figures in urban India are 42 formales and 44 for females. The NSSO defines a selfemployedperson as one who has worked in householdenterprises as own-account worker; worked inhousehold enterprises as an employer or worked inhousehold enterprises as helper. The essential feature of<strong>the</strong> self-employed is that <strong>the</strong>y have au<strong>to</strong>nomy (decidehow, where and when <strong>to</strong> produce) and economicindependence (in respect of choice of market, scaleof operation and finance) for carrying out <strong>the</strong>iroperation. According <strong>to</strong> <strong>the</strong> 5 th Economic CensusFigure 59: Ease of doing business – Global Rank140120100806040200Singapore Japan Mexico Pakistan China Russia India BrazilSource: Doing Business, 2008212 <strong><strong>Nation</strong>al</strong> <strong>Knowledge</strong> <strong>Commission</strong>
Figure 60: Overall and potential entrepreneurial activity60Overall entrepreneurial activityPotential entrepreneurial activity5040( in %)3020100Thailand Brazil China Hong Kong USA India Japan UK RussiaSource: Global Entrepreneurship Moni<strong>to</strong>r, 2007conducted by <strong>the</strong> Central Statistical Organisation(CSO), <strong>the</strong>re are 41.83 million establishments in<strong>the</strong> country engaged in different economic activitieso<strong>the</strong>r than crop production and plantation. Fivestates viz. Tamil Nadu (10.60 per cent), Maharashtra(10.10 per cent), West Bengal (10.05 per cent),Uttar Pradesh (9.61 per cent) and Andhra Pradesh(9.56 per cent) <strong>to</strong>ge<strong>the</strong>r account for about 50 percent of <strong>the</strong> <strong>to</strong>tal establishments in <strong>the</strong> country. Thesame five states also have <strong>the</strong> combined share of about50 per cent of <strong>to</strong>tal employment.Issues in <strong>the</strong> Current FrameworkFinance: Access <strong>to</strong> credit is considered <strong>to</strong> be one of<strong>the</strong> key problems faced by entrepreneurs in India.This problem is particularly acute at <strong>the</strong> start-upstage, where bank finance is hard <strong>to</strong> obtain. Despitenew sources of finance such as venture capital, angelfunding and private equity becoming increasinglypopular, institutional finance is still not able <strong>to</strong> meet<strong>the</strong> current entrepreneurial demands.Regulation and governance: An entrepreneur has <strong>to</strong>deal with a host of regula<strong>to</strong>ry and compliance issues.These include registering one’s business, obtaininggovernment clearances and licenses, paying taxes andcomplying with labour regulations. Cumbersomepaperwork, long delays and red tapism involved insuch transactions create unnecessary burdens forentrepreneurs, constraining <strong>the</strong>ir productivity and<strong>the</strong>ir ability <strong>to</strong> do business. As seen in <strong>the</strong> DoingBusiness 2008 rankings, India performs poorly in<strong>the</strong>se indica<strong>to</strong>rs. A study investigating <strong>the</strong> effect ofregulation on entrepreneurship using <strong>the</strong> GEM datasetshows India <strong>to</strong> be having one of <strong>the</strong> worst regula<strong>to</strong>ryindices. (See Figure 61). Moreover, lack of clarity oninformation relating <strong>to</strong> legal and procedural aspectsof starting an enterprise, as well as those relating <strong>to</strong>clearances, licenses and government schemes fur<strong>the</strong>raggravates <strong>the</strong> problem.Table 23: India’s Ranking in Doing Business 2008Starting a Business 111Dealing with Licenses 134Employing Workers 85Registering Property 112Paying Taxes 165Trading Across Borders 79Enforcing Contracts 177Closing a Business 137Source: Doing Business, World Bank, 2008Manpower: Availability of skilled manpower is ano<strong>the</strong>rcrucial issue for entrepreneurs. For example, in a surveyof entrepreneurs conducted by KPMG and TiE in2008, skilled manpower emerged as <strong>the</strong> second mostimportant fac<strong>to</strong>r for fostering entrepreneurial growth.Fur<strong>the</strong>r parameters reflecting labour market efficiencyand flexibility are dismal. In <strong>the</strong> Global CompetitivenessIndex, India ranks 102 nd in hiring and firing practicesand 85 th in employing workers in <strong>the</strong> Doing Business2008 report.<strong>Report</strong> <strong>to</strong> <strong>the</strong> <strong>Nation</strong>213
Figure 61: Regula<strong>to</strong>ry indices0.9Entry Contract Labour0.80.70.60.50.40.30.20.10Singapore US UK Germany Korea China Brazil IndiaSource: Explaining International Differences in Entrepreneurship: The Role of Individual Characteristics and Regula<strong>to</strong>ryConstraints, Silvia Ardagna and Annamaria Lusardi, 2008Figure 62: Relative importance of fac<strong>to</strong>rs on a scale of 1-32.82.72.722.67 2.662.62.52.522.42.32.28 2.272.22.12.0Infrastructure Manpower issues Finance Local environmentand ecosystemGovernance issuesRegula<strong>to</strong>ry issuesSource: Entrepreneurial India, KPMG-TiE <strong>Report</strong>, 2008Infrastructure: India’s physical infrastructure – roads,rail, ports, power, and telecom – is also considered <strong>to</strong> bea bottleneck <strong>to</strong> <strong>the</strong> smooth operation of entrepreneurialactivity. The high transport and supply chain costs thatpoor infrastructure entails can be affect competitiveness<strong>to</strong> a great extent, particularly for a small and mediumenterprise. Enterprises surveyed in <strong>the</strong> GlobalCompetitiveness <strong>Report</strong> 2007-08, rated inadequateinfrastructure as ‘<strong>the</strong> most problematic fac<strong>to</strong>r’ for doingbusiness in India.Education: While <strong>the</strong> influence of educationon entrepreneurship is considered debatable,increasingly education is being seen as part of <strong>the</strong>larger ecosystem that impacts entrepreneurshipand entrepreneurial motivations. Greater practicalexposure, critical analysis, entrepreneurshipcurriculum, incubation and men<strong>to</strong>ring,industry-research linkages can help in fosteringentrepreneurship.214 <strong><strong>Nation</strong>al</strong> <strong>Knowledge</strong> <strong>Commission</strong>
AgricultureIntroductionAgriculture is <strong>the</strong> principal means of livelihood forover 60 per cent of India’s population. Despitea steady decline of its share in <strong>the</strong> GDP (from36.4 per cent in 1982-83 <strong>to</strong> 18.5 per cent in 2006-07), it remains <strong>the</strong> largest economic sec<strong>to</strong>r in India.Low and volatile growth rates plaguing agriculture aresymp<strong>to</strong>matic of agrarian crises in several parts of <strong>the</strong>Indian countryside. Public investment in agriculture hasdeclined and this sec<strong>to</strong>r has also not been able <strong>to</strong> attractprivate investment because of lower/unattractive returns.A well thought-out strategy for promoting agriculturalgrowth is essential for both alleviating poverty andachieving food-security at <strong>the</strong> national level. Generationand application of knowledge – through agriculturalresearch and extension services can play a crucial role inmeeting <strong>the</strong> above objectives.Current ScenarioResearch: The Department of Agricultural Researchand Education (DARE) is responsible for addressingagricultural research and education needs in <strong>the</strong> country.This responsibility is discharged through <strong>the</strong> IndianCouncil of Agricultural Research (ICAR), an apexand au<strong>to</strong>nomous organisation for agricultural researchand education. The DARE has an extensive networkcomprising 48 Central Institutes, 5 <strong><strong>Nation</strong>al</strong> Bureau,12 Project Direc<strong>to</strong>rates, 32 <strong><strong>Nation</strong>al</strong> Research Centresand 62 All-India Coordinated Research Projects.Education: The Indian agricultural education systemcomprises of 40 State Agricultural Universities (SAUs),four ICAR Institutes (IARI, IVRI, NDRI, CIFE),Allahabad Agricultural Institute, one Central AgriculturalUniversity and four Central Universities which have astrong agricultural faculty. There are also a large numberof private colleges both affiliated and non-affiliated <strong>to</strong>SAUs. According <strong>to</strong> UGC, <strong>the</strong>re are currently 63962students enrolled in agriculture education in India,accounting for just 0.58 per cent of <strong>the</strong> <strong>to</strong>tal enrolment inhigher education. There is a striking regional imbalancein enrolment with Uttar Pradesh accounting for almost30 per cent of <strong>the</strong> all-India student enrolment. Fur<strong>the</strong>r,agricultural studies are not an attractive option anymoreFigure 49: Average GDP growth rates of agriculture and o<strong>the</strong>r sec<strong>to</strong>rs at1999-2000 pricesNon-agriculture Total economy Agriculture & allied108Average growth rates (%)6420Pre-Green Revolution(1951-52 <strong>to</strong> 1967-68)Green Revolution period(1968-69 <strong>to</strong> 1980-81)Wider technologydissemination period(1981-82 <strong>to</strong> 1990-91)Early Reforms period(1991-92 <strong>to</strong> 1996-97)Ninth and Tenth Plan(1997-98 <strong>to</strong> 2006-07)Source: Economic Survey, 2007-08<strong>Report</strong> <strong>to</strong> <strong>the</strong> <strong>Nation</strong>215
Figure 50: Investment in agriculture: Gross capital formation in agriculture as apercentage of GDP from agriculturePublic Sec<strong>to</strong>rPrivate Sec<strong>to</strong>r1210Average growth rates (%)864201980-85 1985-90 1990-95 1995-2000 2000-01 2001-02 2002-03 2003-04 2004-05 2005-06 2006-07Source: Eleventh Five Year Plan, Planning <strong>Commission</strong>Figure 51: Enrolment in agriculture education (2001)1600014000120001000080006000400020000Uttar PradeshSource: University Development in India, 1995-96 <strong>to</strong> 2000-01, UGC– it is looked upon as an inferior science <strong>to</strong> be taken upwhen all else fails.Extension: The Department of Agriculture and Cooperation(DAC) is <strong>the</strong> central agency coordinatingagricultural extension. In addition, <strong>the</strong> <strong><strong>Nation</strong>al</strong> Instituteof Agricultural Marketing (NIAM) and <strong>the</strong> <strong><strong>Nation</strong>al</strong>Institute of Agricultural Extension Management(MANAGE) are au<strong>to</strong>nomous bodies established forproviding <strong>the</strong> government fur<strong>the</strong>r assistance, especiallyin facilitating <strong>the</strong> acquisition of managerial andtechnical skills by personnel involved in <strong>the</strong> agriculturaleconomy.Various structures, projects and initiatives have beenput in place in order <strong>to</strong> promote agriculture extensionin <strong>the</strong> country. These include Agricultural TechnologyManagement Agency (ATMA), Krishi Vigyan KendrasMaharashtraKarnatakaTamil NaduAndhra PradeshRajasthanMadhya PradeshGujaratWest BengalUttarakhandPunjabHimachal PradeshHaryanaAssamOrissaKeralaChhattisgarhBihar(KVKs), Agri-clinic and agri-business centres, KisanCall Centre Scheme etc. ATMAs have been set upin various districts <strong>to</strong> decentralise, integrate andcoordinate R&D activities, using modern informationand communication technology <strong>to</strong> improve linkagesbetween <strong>the</strong> various extension agencies. KVKs havebeen initiated by ICAR <strong>to</strong> identify <strong>the</strong> technologicalgaps, critical needs and requirements of <strong>the</strong> farmers,and impart skill through various programs. Inaddition <strong>to</strong> <strong>the</strong> demonstration of latest technologicaldevelopment, assessment and refinement at farmers’fields, <strong>the</strong> KVKs also provide farm informationservices through literature, exhibitions, field days,farmers <strong>to</strong>urs, crop seminars, kisan melas, radioand television programs, correspondence services,telephone consultancy and helpline services etc. Sofar over 554 KVKs (as on August 2007) have beenestablished.216 <strong><strong>Nation</strong>al</strong> <strong>Knowledge</strong> <strong>Commission</strong>
Table 19: Global extension practicesCountryUnited Statesof America,Canada, Australia,DenmarkCosta RicaEnglandHollandAlbaniaUgandaIsraelIndonesiaLao People’sDemocraticRepublic, Vietnamand MaliExtension PracticesStrong extension services – first public, and now public and/or private. None of <strong>the</strong>se very developedcountries has ever considered <strong>the</strong> discipline of extension as inferior <strong>to</strong> o<strong>the</strong>r agricultural disciplinesat <strong>the</strong> time of resource allocation. Several developed countries have fully or partially privatised <strong>the</strong>iragricultural extension services in a variety of ways.The government provides farmers with extension vouchers which can be used for getting extensionadvice from private specialists.The public extension service has evolved over time in<strong>to</strong> a private consulting practice. The positiveresult is enhanced efficiency of staff, and <strong>the</strong> negative effect is <strong>the</strong> deprivation of small farmers ofextension services as <strong>the</strong> result of <strong>the</strong>ir inability or unwillingness <strong>to</strong> pay.About 60 per cent of <strong>the</strong> extension budget comes from farmers, while <strong>the</strong> remaining 40 per centis provided by <strong>the</strong> government. The benefits include increased efficiency, improved quality, clien<strong>to</strong>rientation,job satisfaction for staff, and expanded marketing opportunities for farmers.Private sec<strong>to</strong>r entrepreneurial initiatives <strong>to</strong> create a long-term relationship with farmers have proved <strong>to</strong>be successful.Privatisation of extension through <strong>the</strong> creation of a pool of private extension specialists out of itsexisting public extension service. Registered farmers’ associations could call upon this pool throughbidding for providing services related <strong>to</strong> selected enterprises, and pay for <strong>the</strong> services from <strong>the</strong> fundsgiven <strong>to</strong> <strong>the</strong>m by <strong>the</strong> donors through decentralised government units.The government is still responsible for providing extension advice, but encourages privatisation through<strong>the</strong> standing practice of growers <strong>to</strong> contribute portion of <strong>the</strong>ir income <strong>to</strong> research and developmentincluding extension, public and private partnership in financing and operating units within <strong>the</strong>extension service, payment for services by commodity production and marketing boards beyond a basicextension package, <strong>the</strong> provision of more intensive extension activities at <strong>the</strong> request of needy growers,special agreements with commodity farmers’ organisations, extension staff working on <strong>the</strong>ir day off inexchange for direct payment from farmers, provision of equipment like mobile phones <strong>to</strong> extensionadvisers by growers associations, and direct payment by farmers for participation in training activities.Some projects have not only encouraged NGOs and <strong>the</strong> private sec<strong>to</strong>r, but also agricultural researchinstitutes, agricultural universities and farmers’ associations, <strong>to</strong> participate in <strong>the</strong> delivery of extensionservices. Indonesia has successfully established new institutions called Agricultural TechnologyAssessment Institutes at provincial level, bringing <strong>to</strong>ge<strong>the</strong>r farmers, researchers and extension specialists.Experimenting with tele-centres, which have already exhibited <strong>the</strong>ir benefits in several Western Europeancountries. Virtual linkages are being established for bringing research and extension <strong>to</strong>ge<strong>the</strong>r, andone example is <strong>the</strong> VERCON (virtual extension, research and communication network) <strong>to</strong>ol, whichFAO has introduced in Egypt and Bhutan. Under an FAO project in <strong>the</strong> Philippines, <strong>the</strong> Internetand interactive e-mail facilities have been established at municipality level for supporting decentralisedextension staff. Expert systems are also being developed <strong>to</strong> compensate, <strong>to</strong> some extent, for <strong>the</strong> <strong>to</strong>o-rarevisits of subject-matter specialists <strong>to</strong> farmers’ fields. Over 30 per cent of extension staff in Es<strong>to</strong>nia use <strong>the</strong>Internet. One can find programs like “virtual gardens” and “virtual farms” on <strong>the</strong> Internet.Source: ‘Modernising <strong><strong>Nation</strong>al</strong> Agricultural Extension Systems, A Practical Guide for Policy-Makers of Developing Countries’, FAO, 2005.Issues within <strong>the</strong> research and extensionframeworkFunding: The current allocation <strong>to</strong> agricultural R&D,which stands at is 0.7 per cent of agriculture GDP, isgrossly inadequate. This funds crunch is <strong>the</strong> main fac<strong>to</strong>rbehind <strong>the</strong> disintegration of public systems of agriculturalR&D in several places. Today almost in all SAUs about80-85 per cent of <strong>the</strong> budget goes <strong>to</strong>wards salary and o<strong>the</strong>restablishment costs. The ICAR share also has dwindledand varied from 33 per cent in <strong>the</strong> Fifth Plan <strong>to</strong> almost9 per cent in <strong>the</strong> Eighth Plan. In all SAUs, 25 <strong>to</strong> 30 percent posts are not filled on account of squeeze in budgetand this has seriously impacted quality of instruction.Allocations <strong>to</strong> this sec<strong>to</strong>r must be significantly increasedboth at <strong>the</strong> Centre (<strong>to</strong> at least 1 per cent of GDP) andin states.Infrastructure and human resources: The financial crunchcoupled with bureaucratic rigidities has caused colossalgaps both in basic infrastructure and human resources.Lack of water, power, basic equipment like cell phones<strong>Report</strong> <strong>to</strong> <strong>the</strong> <strong>Nation</strong>217
and vans, vacancies in <strong>the</strong> scientific posts in agriculturaluniversities and understaffing of extension providingbodies by underpaid workers are just some of <strong>the</strong> problemsplaguing public research and extension units.Service providers outside <strong>the</strong> public sec<strong>to</strong>r: TheFarmers <strong>Commission</strong> <strong>Report</strong> testified that in <strong>the</strong> 40 percent of farmer households at an all-India level who didaccess modern technology, “o<strong>the</strong>r progressive farmers”emerged as <strong>the</strong> most popular source (16.7 per cent);followed by “input dealers” (13.1 per cent) and “radio”(13 per cent). Private R&D institutes and demanddrivenextension service providers have entered <strong>the</strong>agricultural economy in a big way. As R&D providersby proxy, <strong>the</strong>y may well be motivated by vested interestsand thus pose a real threat <strong>to</strong> <strong>the</strong> farmer who has no o<strong>the</strong>roption. Alternatively, service providers in <strong>the</strong> privatesec<strong>to</strong>r may fulfill an important function efficiently,in <strong>the</strong> absence of a more reliable mechanism.Research-Extension linkages: There is often disconnectbetween <strong>the</strong> research done by agricultural scientistsand <strong>the</strong> on-farm practices of farmers. (See Table 20)The structure of <strong>the</strong> present public extension system islinear and compartmentalised, thus propagating a <strong>to</strong>pdownapproach that does not encourage interaction andco-operation amongst <strong>the</strong> several ac<strong>to</strong>rs. Mostimportantly, it does not incorporate a mechanism forfeedback. Therefore, extension workers continue <strong>to</strong>disseminate technology that may not only be irrelevant,but also harmful for <strong>the</strong> farming community.Information and Communication Technology (ICT):The availability and convergence of ICTs – computers,digital networks, telecommunication etc. – has beensignificant in <strong>the</strong> dissemination of knowledge andinformation <strong>to</strong> <strong>the</strong> rural population in recent years.The village knowledge centres established by <strong>the</strong> MSSwaminathan Research Foundation (MSSRF) inPondicherry, and <strong>the</strong> village internet kiosks establishedby ITC under <strong>the</strong> “e-chaupal” program are examplesof highly successful ICT deployment for research andextension and market access in agriculture.Agricultural universities: In order <strong>to</strong> meet <strong>the</strong> systemicchallenges in <strong>the</strong> R&D arena, <strong>the</strong> syllabus and curriculumin agricultural universities need <strong>to</strong> be more flexible andinterdisciplinary. Incorporation of social sciences andmanagement techniques, primacy accorded <strong>to</strong> fieldworkand regular training and refresher courses for extensionworkers must be added <strong>to</strong> <strong>the</strong> curriculum in order <strong>to</strong>address <strong>the</strong> disconnect between <strong>the</strong> lab and <strong>the</strong> land.Incentives and schemes must be established <strong>to</strong> attract <strong>the</strong>best minds <strong>to</strong> stimulate R&D activities in universities.Table 20: State-wise performance and potential yield of selected cropsStateImprovedpractice (I)Farmerpractice (F)Actual yield2003-04 (A)Gap (%)Wheat (Yield: Kg/ha - 2002-03 <strong>to</strong> 2004-05)I and FI and ABihar 3651 2905 1783 25.7 104.8Madhya Pradesh 3297 2472 1789 33.4 84.3Uttar Pradesh 4206 3324 2794 26.5 50.5Rice (irrigated) (Yield: Kg/ha - 2003-04 <strong>to</strong> 2004-05)Uttar Pradesh 7050 5200 2187 35.6 222.4Bihar 4883 4158 1516 17.4 222.1Chhattisgarh 3919 3137 1455 24.9 169.4SugarcaneMaharashtra 127440 99520 51297 28.1 148.4Karnataka 147390 128000 66667 15.1 121.2Bihar 74420 49440 40990 50.5 81.6Source: Economic Survey 2007-08Note:The data and statistics provided in <strong>the</strong> baseline section, unless stated o<strong>the</strong>rwise, have been taken from Ministry of HumanResource Development (MHRD), Planning <strong>Commission</strong>, University Grants <strong>Commission</strong> (UGC) and District InformationSystem for Education (DISE).218 <strong><strong>Nation</strong>al</strong> <strong>Knowledge</strong> <strong>Commission</strong>