Tables - South African Health Information
Tables - South African Health Information
Tables - South African Health Information

Create successful ePaper yourself
Turn your PDF publications into a flip-book with our unique Google optimized e-Paper software.
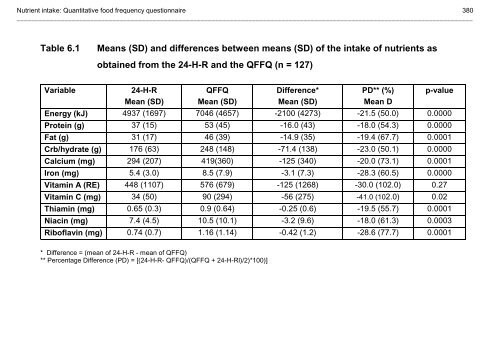
Nutrient intake: Quantitative food frequency questionnaire380____________________________________________________________________________________________________________________________Table 6.1Means (SD) and differences between means (SD) of the intake of nutrients asobtained from the 24-H-R and the QFFQ (n = 127)Variable24-H-RMean (SD)QFFQMean (SD)Difference*Mean (SD)PD** (%)Mean Dp-valueEnergy (kJ) 4937 (1697) 7046 (4657) -2100 (4273) -21.5 (50.0) 0.0000Protein (g) 37 (15) 53 (45) -16.0 (43) -18.0 (54.3) 0.0000Fat (g) 31 (17) 46 (39) -14.9 (35) -19.4 (67.7) 0.0001Crb/hydrate (g) 176 (63) 248 (148) -71.4 (138) -23.0 (50.1) 0.0000Calcium (mg) 294 (207) 419(360) -125 (340) -20.0 (73.1) 0.0001Iron (mg) 5.4 (3.0) 8.5 (7.9) -3.1 (7.3) -28.3 (60.5) 0.0000Vitamin A (RE) 448 (1107) 576 (679) -125 (1268) -30.0 (102.0) 0.27Vitamin C (mg) 34 (50) 90 (294) -56 (275) -41.0 (102.0) 0.02Thiamin (mg) 0.65 (0.3) 0.9 (0.64) -0.25 (0.6) -19.5 (55.7) 0.0001Niacin (mg) 7.4 (4.5) 10.5 (10.1) -3.2 (9.6) -18.0 (61.3) 0.0003Riboflavin (mg) 0.74 (0.7) 1.16 (1.14) -0.42 (1.2) -28.6 (77.7) 0.0001* Difference = (mean of 24-H-R - mean of QFFQ)** Percentage Difference (PD) = [(24-H-R- QFFQ)/(QFFQ + 24-H-Rl)/2)*100)]
Nutrient intake: Quantitative food frequency questionnaire381____________________________________________________________________________________________________________________________Table 6.2Pearson correlation coefficient between the nutrient intake as obtained from the 24-H-Rand QFFQVariable Pearson r p-valueEnergy 0.4 0.0001Protein 0.4 0.0001Fat 0.43 0.0001Carbohydrate 0.36 0.0001Calcium 0.38 0.0001Iron 0.4 0.0001Vitamin A 0.06 0.5Vitamin C 0.45 0.0001Thiamin 0.38 0.0001Niacin 0.34 0.0001Riboflavin 0.27 0.002
Nutrient intake: Quantitative food frequency questionnaire382____________________________________________________________________________________________________________________________Table 6.3Bland-Altman Method: Complete data set of nutrient intake as obtained from the 24-H-Rand the QFFQ (n = 127)VariableLimits of agreementa Lower b Upperc Spearman rd P-valuee sd/smEnergy (kJ) -6448 10648 0.65 0.0000 1.54Protein (g) -70 102 0.55 0.0000 1.60Fat (g) -56 84 0.53 0.0000 1.40Carbohydrate (g) -205 347 0.56 0.0000 1.53Calcium (mg) -557 807 0.35 0.0001 1.42Iron (mg) -11 17 0.41 0.0000 1.40Vitamin A (RE) -2411 2661 0.38 0.00001 1.90Vitamin C (mg) -494 606 0.46 0.0000 1.72Thiamin (mg) -0.75 15 0.51 0.0000 1.50Niacin (mg) -17 23 0.33 0.0002 1.67Riboflavin (mg) -1.8 2.6 0.43 0.0000 1.71a. Lower limit = mean of QFFQ and 24-H-R - 2 standard deviationsb. Upper limit = mean of QFFQ and 24-H-R + 2 standard deviationsc. Spearman correlation between the mean of the QFFQ and 24-H-R and the difference between the QFFQ and 24-H-Rd. Significance of the Spearman correlatione. Standard deviation of the difference/standard deviation of the mean
Nutrient intake: Quantitative food frequency questionnaire383____________________________________________________________________________________________________________________________Table 6.4Bland-Altman Method: Excluding outliers on mean dietary intake (greater than the mean± two standard deviations) as obtained from the 24-H-R and QFFQVariablenLimits of agreementa Lower b Upperc Spearman rd P-valuee sd/smEnergy (kJ) 120 -4310 7145 0.59 0.0000 1.50Protein (g) 118 -42 62 0.46 0.0000 1.44Fat (g) 118 -40 56 0.41 0.0000 1.50Carbohydrate (g) 110 -144 228 0.44 0.0000 1.60Calcium (mg) 116 -455 601 0.21 0.03 1.65Iron (mg) 122 -6 10 0.34 0.0001 1.35Vitamin A (RE) 122 -927 1313 0.42 0.0000 1.62Vitamin C (mg) 124 -132 184 0.42 0.0000 1.70Thiamin (mg) 122 -0.7 1.1 0.45 0.0000 1.33Niacin (mg) 120 -8.5 12 0.24 0.008 1.25Riboflavin (mg) 120 -1.28 1.9 0.40 0.0001 1.53a.b.c.d.e.Lower limit = mean of QFFQ and 24-H-R - 2 standard deviationsUpper limit = mean of QFFQ and 24-H-R + 2 standard deviationsSpearman correlation between the mean of the QFFQ and 24-H-R and the difference between the QFFQ and 24hr recallsSignificance of the Spearman correlationStandard deviation of the difference/standard deviation of the mean
Nutrient intake: Quantitative food frequency questionnaire384____________________________________________________________________________________________________________________________Table 6.5Percentage of subjects classified into the same or adjacent quintiles of the twodistributions by the data obtained from the QFFQ and the 24-H-R (n = 127)VariableSame(%)Q1(%)Q2(%)Q3(%)Energy 36 68 89 96Protein 36 72 90 96Fat 33 69 87 98Carbohydrate 31 72 88 95Calcium 28 65 84 96Iron 28 69 89 100Vitamin A 31 61 85 96Vitamin C 31 62 85 95Thiamin 37 77 92 98Niacin 28 65 89 100Riboflavin 31 65 89 91Q n = Quintile number
Nutrient intake: Quantitative food frequency questionnaire385____________________________________________________________________________________________________________________________Table 6.6Comparison of Energy Intake: Basal Metabolic Rate (EI : BMR) ratios as obtained fromthe QFFQ and the 24-H-R (n = 127)Dietary method* Mean EI : BMR ratio Standard DeviationQFFQ 1.98 1.2324-H-R 1.4 0.41* Difference significant P=0.0002Table 6.7Percentage Distribution of EI : BMR as obtained from the QFFQ and the 24-H-REI : BMRQFFQ(%)24-H-R(%)0 – 0,99 14.8 15.61,0 - 1,19 11.7 19.51,2 -1,39 10.2 18.01,4 - 1,59 6.3 14.81,6 – 1,79 14.1 14.1>=1,8 43.0 18.0
Nutrient intake: Quantitative food frequency questionnaire386____________________________________________________________________________________________________________________________Table 6.8Means (SD) and differences between the means (SD) of the dietary intake as obtainedfrom the first and second administration of the QFFQ (n = 136)Variable QFFQ 1Mean (SD)QFFQ2Mean (SD)DifferenceMean (SD)PD (%)Mean (SD)p-valueEnergy (kJ) 7056 5377 6685 3981 371 3747 0.07 41 0.5Protein (g) 49 37 46 29 2.5 27 1.4 46 0.5Fat (g) 47 49 44 35 3 35 1.1 42 0.6Crb/hydrate (g) 249 180 235 139 13.5 130 -3.4 52 0.5Calcium (mg) 430 731 377 258 52 692 -6.4 54 0.4Iron (mg) 8.9 9.6 7.9 5.7 0.9 8.9 2.8 49 0.3Vitamin A (RE) 578 814 495 566 83 697 7.2 72 0.3Vitamin C (mg) 59 109 62 138 -3 116 -0.31 72 0.8Thiamin (mg) 0.91 0.8 0.89 0.59 0.02 0.74 - - 0.8Niacin (mg) 10.2 9.7 9.4 7.1 0.82 6.7 - - 0.4Riboflavin mg) 1.1 1.6 1.1 1.2 0.05 1.33 - - 0.8
Nutrient intake: Quantitative food frequency questionnaire387____________________________________________________________________________________________________________________________Table 6.9Pearson correlation coefficients between the dietary intake from the first and secondadministration of the QFFQ (n = 136)Variable Pearson r P-valueEnergy 0.72 0.0001Protein 0.68 0.0001Fat 0.69 0.0001Carbohydrate 0.70 0.0001Calcium 0.32 0.0001Iron 0.41 0.0001Vitamin A 0.53 0.0001Vitamin C 0.58 0.0001Thiamin 0.48 0.0001Niacin 0.72 0.0001Riboflavin 0.58 0.0001
Nutrient intake: Quantitative food frequency questionnaire388____________________________________________________________________________________________________________________________Table 6.10Bland-Altman Method: dietary intake from the first and second administration of the QFFQ(n = 136)VariableLimits of agreementa Lower b Upperc Spearman rd p-valuee sd/smEnergy (kJ) -7123 7865 0.17 0.04 0.86Protein (g) -52 57 0.18 0.03 0.98Fat (g) -67 73 0.13 0.12 0.92Carbohydrate (g) -247 273 0.19 0.03 0.88Calcium (mg) -1334 1438 0.09 0.32 1.6Iron (mg) -17 19 0.14 0.11 1.4Vitamin A (RE) -1311 1477 0.07 0.41 1.15Vitamin C (mg) -235 229 0.11 0.20 1.1Thiamin (mg) -1.38 1.42 0.15 0.08 1.2Niacin (mg) -13 15 0.07 0.45 0.9Riboflavin (mg) -2.6 2.65 0.01 0.88 1.1a.b.c.d.e.Lower limit = mean of QFFQ1 and QFFQ2 - 2 standard deviationsUpper limit = mean of QFFQ1 and QFFQ2 + 2 standard deviationsSpearman correlation between the mean of the QFFQ1 and QFFQ2 and the difference between the QFFQ1 and QFFQ2Significance of the Spearman correlationStandard deviation of the difference/standard deviation of the mean
Nutrient intake: Quantitative food frequency questionnaire389____________________________________________________________________________________________________________________________Table 6.11 Percentage of subjects classified into the same or adjacent quintiles of the twodistributions by the data obtained from the first and second administration of the QFFQ (n= 136)VariableSame(%)Q*1(%)Q2(%)Q3(%)Energy 50 85 94 100Protein 50 83 93 99Fat 49 83 97 100Carbohydrate 52 81 96 100Calcium 52 87 97 100Iron 49 85 93 100Vitamin A 50 79 93 98Vitamin C 52 80 94 100Thiamin 50 81 65 98Niacin 100 100 100 100Riboflavin 74 83 83 100* Q n = Quintile number
Nutrient intake: Quantitative food frequency questionnaire390____________________________________________________________________________________________________________________________Table 6.12The percentage of children that were being breastfed at the time of the survey asdetermined by the QFFQ by age group: <strong>South</strong> Africa 1999Response (%)1 – 3YearsAge group4 – 6Years7 – 9YearsRSANumber (n) 1292 1070 479 2841Yes 19 3 1 10No 81 97 99 90Table 6.13The percentage of children that were being breastfed at the time of the survey asdetermined by the QFFQ by province: <strong>South</strong> Africa 1999Response (%)Area of residenceEC FS G/TENG KZN M/GA NC NP NW WC RSANumber (n) 421 208 425 543 157 157 340 233 357 2841
Nutrient intake: Quantitative food frequency questionnaire391____________________________________________________________________________________________________________________________Yes 7 13 12 8 4 19 11 7 11 10No 93 87 88 92 96 81 89 93 89 90Table 6.14The percentage of children that were being breastfed at the time of the survey asdetermined by the QFFQ by area of residence: <strong>South</strong> Africa 1999Response (%)Area of residenceCommercial Formal Informal Tribal Urban Rural RSAFarms Urban UrbanNumber (n) 291 1087 329 1134 1416 1425 2841Yes 17 9 15 8 10 10 10No 83 91 85 92 90 90 90Table 6.15The percentage of children that had been breastfed as infants as determined by the QFFQby age group: <strong>South</strong> Africa 1999Response (%)Age group1 – 3 4 – 6 7 – 9 RSAYears Years YearsNumber (n) 1271 1076 482 2829
Nutrient intake: Quantitative food frequency questionnaire392____________________________________________________________________________________________________________________________Yes 87 85 84 86No 12 13 13 13Don’t know 1 2 2 2Table 6.16The percentage of children that had been breastfed as infants as determined by the QFFQby province: <strong>South</strong> Africa 1999Response (%)Area of residenceEC FS G/TENG KZ M/GA NC NP NW WC RSANumber (n) 412 207 422 540 162 157 346 232 351 2829Yes 84 89 86 83 81 82 93 90 83 86No 14 9 12 15 18 13 6 10 16 13Don’t Know 1 2 1 2 1 4 1 0 2 2Table 6.17The percentage of children that had been breastfed as infants as determined by the QFFQby area of residence: <strong>South</strong> Africa 1999
Nutrient intake: Quantitative food frequency questionnaire393____________________________________________________________________________________________________________________________Response (%)Area of residenceCommercial Formal Informal Tribal Urban Rural RSAFarms Urban UrbanNumber (n) 287 1079 324 1139 1403 1426 2829Yes 86 82 87 89 83 88 86No 12 15 13 11 15 11 13Don’t Know 2 3 1 1 2 1 2Table 6.18 The duration of breastfeeding for children who had been breastfed as infants asdetermined by the QFFQ by age group: <strong>South</strong> Africa 1999Response (%)Age group1 – 3 4 – 6 7 – 9 RSAYears Years YearsNumber (n) 960 842 364 2166< 4 months 16 14 14 154 – 6 months 10 9 9 107 – 12 months 15 11 12 13> 1 year 59 66 65 63Table 6.19 The duration of breastfeeding for children who had been breastfed as infants as
Nutrient intake: Quantitative food frequency questionnaire394____________________________________________________________________________________________________________________________determined by the QFFQ by province: <strong>South</strong> Africa 1999Response (%)Area of residenceEC FS G/TENG KZ M/GA NC NP NW WC RSANumber (n) 333 181 333 419 117 79 232 197 275 2166< 4 months 17 9 14 14 4 24 3 10 32 154 – 6 months 9 9 12 9 9 14 2 9 14 107 – 12 months 13 19 10 12 12 23 14 12 11 13> 1 year 61 64 64 65 74 39 81 69 43 63Table 6.20 The duration of breastfeeding for children who had been breastfed as infants asdetermined by the QFFQ by area of residence: <strong>South</strong> Africa 1999Response (%)Area of residenceCommercial Formal Informal Tribal Urban Rural RSAFarms Urban UrbanNumber (n) 201 817 252 896 1069 1097 2166< 4 months 17 22 13 8 20 10 154 – 6 months 11 13 9 6 12 7 107 – 12 months 12 15 10 12 13 12 13> 1 year 60 50 69 73 55 71 63Table 6.21The percentage of children that were receiving infant formulae at the time of the survey as
Nutrient intake: Quantitative food frequency questionnaire395____________________________________________________________________________________________________________________________determined by the QFFQ by age group: <strong>South</strong> Africa 1999Response (%)Age group1 – 3 3 – 6 7 - 9 RSAYears Years YearsNumber (n) 1300 1075 478 2853Yes 9 1 1 5No 91 98 98 95Don’t know 0 0 1 0Table 6.22The percentage of children that were receiving infant formulae at the time of the survey asdetermined by the QFFQ by province: <strong>South</strong> Africa 1999Response (%)Area of residenceEC FS G/TENG KZ M/GA NC NP NW WC RSANumber (n) 418 207 426 548 162 157 348 231 356 2853Yes 3 3 5 5 9 5 5 4 7 5No 97 97 95 95 91 91 95 96 92 95Don’t know 0 0 0 0 0 4 0 0 1 0
Nutrient intake: Quantitative food frequency questionnaire396____________________________________________________________________________________________________________________________Table 6.23The percentage of children that were receiving infant formulae at the time of the survey asdetermined by the QFFQ by area of residence: <strong>South</strong> Africa 1999Response (%)Area of residenceCommercial Formal Informal Tribal Urban Rural RSAFarms Urban UrbanNumber (n) 291 1089 327 1146 1416 1437 2853Yes 5 6 5 4 6 4 5No 94 94 95 96 94 95 95Don’t know 1 0 0 0 0 0 0Table 6.24The brand name of infant formula used as determined by the QFFQ (n = 108): <strong>South</strong> Africa1999Formula nameNumber(n)Percentage(%)LactogenLactogen 211111010Infacare 1 0.9Infagro 7 6Infasoy 3 3Isomil 4 4Klim 1 0.9
Nutrient intake: Quantitative food frequency questionnaire397____________________________________________________________________________________________________________________________NanNan 2278257Nespray 12 11PelargonPelargon 25150.9Progress 3 3S26 10 9SMA 4 4Table 6.25The percentage of children that were following a special diet as determined by the QFFQby age group: <strong>South</strong> Africa 1999Response (%)Age group1 – 3 3 – 6 7 – 9 RSAYears Years YearsNumber (n) 1306 1085 481 2872Yes 2 1 2 1No 98 99 98 98Don’t know 0 1 1 1
Nutrient intake: Quantitative food frequency questionnaire398____________________________________________________________________________________________________________________________Table 6.26Response (%)The percentage of children that were following a special diet as determined by the QFFQby province: <strong>South</strong> Africa 1999Area of residenceEC FS G/TENG KZ M/GA NC NP NW WC RSANumber (n) 424 208 425 555 163 156 352 232 357 2872Yes* 2 0 2 1 2 1 1 2 1 1No 98 99 98 99 98 96 97 98 99 98Don’t know 0 0 0 0 1 3 2 0 0 1*Of the children who said YES, they follow a special diet, there were 28 who replied the following:1 (3.6%) diabetic, 6 (21.4%) slimming, 13 (46.4%) allergies, 8 (28.6%) otherTable 6.27 The percentage of children that were following a special diet as determined by the QFFQby area of residence: <strong>South</strong> Africa 1999Response (%)Area of residenceCommercial Formal Informal Tribal Urban Rural RSAFarms Urban UrbanNumber (n) 291 1092 328 1161 1420 1452 2872Yes 1 2 0 1 1 1 1No 98 98 100 98 98 98 98Don’t know 1 1 0 1 0 1 1
Nutrient intake: Quantitative food frequency questionnaire399____________________________________________________________________________________________________________________________Table 6.28The percentage of children that had eaten away from home during the week preceding theinterview as determined by the QFFQ by age group: <strong>South</strong> Africa 1999Response (%)Age group1 – 3 3 – 6 7 – 9 RSAYears Years YearsNumber (n) 1306 1081 480 2867Yes 16 23 26 20No 83 74 72 78Don’t know 2 3 3 2Table 6.29 The percentage of children that had eaten away from home during the week preceding theinterview as determined by the QFFQ by province: <strong>South</strong> Africa 1999Response (%)Area of residenceEC FS G/TENG KZ M/GA NC NP NW WC RSANumber (n) 424 208 425 554 163 156 355 232 350 2867Yes 21 13 25 20 9 6 12 13 41 20No 73 85 75 79 90 90 83 87 58 78Don’t know 6 2 1 2 1 4 5 0 0 2
Nutrient intake: Quantitative food frequency questionnaire400____________________________________________________________________________________________________________________________*Eat out: 1 time – 103 responses (22.3%); 2 times – 52 (11.3%); 3 times – 33 (7.1%); 4 times – 28 (6.1%); 5 times – 215 (46.5%); 6 times – 5 (1.1%); 7times – 19 (4.1%); 7 times – 7 (1.5%). A total of 269 (58.2%) of these replied that it was at creche/school/pre-school/day mother; 14 (3.0%) said it was arestaurant/take away and the rest was with family, friends or neighboursTable 6.30The percentage of children that had eaten away from home during the week preceding theinterview as determined by the QFFQ by area of residence: <strong>South</strong> Africa 1999Response (%)Area of residenceCommercial Formal Informal Tribal Urban Rural RSAFarms Urban UrbanNumber (n) 289 1087 330 1161 1417 1450 2867Yes 17 25 22 15 24 16 20No 82 72 78 81 74 81 78Don’t know 1 2 1 3 2 3 2Table 6.31 The percentage of children that eat maize porridge as determined by the QFFQ by agegroup: <strong>South</strong> Africa 1999Response (%)Age group1 – 3 3 – 6 7 – 9 RSAYears Years YearsNumber (n) 1306 1084 482 2872Yes 94 94 90 93No 6 6 10 7Don’t know 0 0 0 0
Nutrient intake: Quantitative food frequency questionnaire401____________________________________________________________________________________________________________________________Table 6.32 The percentage of children that eat maize porridge as determined by the QFFQ byprovince: <strong>South</strong> Africa 1999Response (%)Area of residenceEC FS G/TENG KZ M/GA NC NP NW WC RSANumber (n) 424 208 426 551 164 157 354 232 356 2872Yes 96 99 95 91 98 99 95 100 76 93No 4 1 5 8 2 1 5 0 24 7Don’t know 0 0 0 0 0 0 0 0 0 0Table 6.33The percentage of children that eat maize porridge as determined by the QFFQ by area ofresidence: <strong>South</strong> Africa 1999Response (%)Area of residenceCommercial Formal Informal Tribal Urban Rural RSAFarms Urban UrbanNumber (n) 291 1092 329 1160 1421 1451 2872Yes 97 87 98 96 90 96 93No 3 13 2 4 10 3 7
Nutrient intake: Quantitative food frequency questionnaire402____________________________________________________________________________________________________________________________Don’t know 0 0 0 0 0 0 0Table 6.34Response (%)Maize: The percentage of respondents who knew the brand name as determined by theQFFQ by age group: <strong>South</strong> Africa 19991 - 3YearsAge group4 - 6Years7 – 9YearsRSANumber (n) 1228 1011 441 2680Yes 90 87 89 89No 9 12 11 10Don’t know 1 1 1 1Table 6.35Maize: The percentage of respondents who knew the brand name as determined by theQFFQ by area of residence: <strong>South</strong> Africa 1999Response (%)Area of residenceCommercial Formal Informal Tribal Urban Rural RSAFarms Urban UrbanNumber (n) 277 986 328 1089 1314 1366 2680
Nutrient intake: Quantitative food frequency questionnaire403____________________________________________________________________________________________________________________________Yes 90 89 91 88 89 89 89No 8 11 9 11 10 11 10Don’t know 2 1 0 1 0 1 1Table 6.36Maize: The percentage of respondents who knew the brand name as determined by theQFFQ by province: <strong>South</strong> Africa 1999Response (%)Area of residenceEC FS G/TENG KZ M/GA NC NP NW WC RSANumber (n) 403 203 412 517 157 152 321 224 291 2680Yes 77 89 90 94 96 92 87 92 86 89No 22 11 9 5 4 5 12 7 13 10Don’t know 1 0 0 1 0 3 1 1 1 1Table 6.37Maize: The brand names purchased as determined by the QFFQ by province: <strong>South</strong> Africa1999Brand name EC (%) FS (%) G/TENG (%) KZ (%) M/GA (%) NC (%) NW %) NP (%) WC (%) RSA (%)Number (n) 397 199 407 497 160 147 210 328 256 2601A1 - - 3 - - - 5 - - 0.9ACE 9 2 33 22 4 1 5 3 2 12Bathobothe - - - - - - 10 - - 0.8
Nutrient intake: Quantitative food frequency questionnaire404____________________________________________________________________________________________________________________________Blue Bird 8 - - 0.6 - - 0.5 - - 1Bokomo 2 0.5 - - - 4 - - 5 1Crown 3 - - 0.8 - - 0.5 2 - 0.9Excella 1 6 0.7 - - - - 0.6 2 0.9Impala 28 8 4 10 2.5 56 2 5 68 18Induna 8 6 1 4 0.6 7 2 13 3 5Inkanyezi 2 - - 12 - - - - - 2Inyala 2 - - 6 - - - - - 1Iwisa 4 18 23 0.4 9 16 19 2 13 10Mazola - - 7 - - - 2 - - 1Nyala 1 - - 10 - - - - - 2OTK 3 - 1 5 0.6 - - 1 - 2Pride - 0.5 4 1 0.6 - - - - 1Shaya - - 0.2 - - - 1 12 - 2“Special” 1 5 - 2 - 0.7 1 5 0.8 2Super Sun - 2 11 0.6 57 - 3 5 - 6Tafelberg - - 0.5 - - - 6 9 - 2Thuso 7 13 1 - - - - - - 2Westra 2 7 - - - 11 18 - - 3White Diamond - 3 0.2 1 2.5 - - 5 - 1Table 6.38 Maize: The place of purchase as determined by the QFFQ by age group: <strong>South</strong> Africa 1999Place of purchase (%)1 - 3YearsAge group4 - 6Years7 – 9YearsRSANumber (n) 1271 1058 465 2794
Nutrient intake: Quantitative food frequency questionnaire405____________________________________________________________________________________________________________________________Shop 92 91 92 92Employer 2 3 2 2Harvest/Grind Self 1 1 0 1Other 1 1 1 1Don’t Know 0 1 0 0Not Applicable 3 3 4 3Table 6.39 Maize: The place of purchase as determined by the QFFQ by area of residence: <strong>South</strong>Africa 1999Place of purchase (%)Area of residenceCommercial Formal Informal Tribal Urban Rural RSAFarms Urban UrbanNumber (n) 282 1051 329 1132 1380 1414 2794Shop 77 90 98 97 92 93 92Employer 19 1 1 0 1 4 2Harvest/Grind Self 0 0 0 1 0 1 1Other 1 1 1 2 1 2 1Don’t Know 1 0 0 0 0 1 0Not Applicable 2 9 0 0 7 0 3Table 6.40 Maize: The place of purchase as determined by the QFFQ by province: <strong>South</strong> Africa 1999Place of purchase (%)Area of residenceEC FS G/TENG KZ M/GA NC NP NW WC RSANumber (n) 413 200 418 537 154 155 345 229 343 2794
Nutrient intake: Quantitative food frequency questionnaire406____________________________________________________________________________________________________________________________Shop 98 77 95 96 99 90 95 95 76 92Employer 1 19 0 0 1 8 1 2 1 2Harvest/Grind Self 1 2 0 1 0 0 0 1 0 1Other 0 3 1 1 0 1 4 0 1 1Don’t Know 1 0 1 0 0 1 0 1 0 0Not Applicable 0 0 3 1 1 0 0 0 21 3Table 6.41 Maize: The amount purchased as determined by the QFFQ by province: <strong>South</strong> Africa 1999AmountEC FS G/TENG KZ M/GA NC NP NW WC RSApurchased (%)Number (n) 416 208 414 538 162 156 350 233 269 2758< 2 kg 1 0 1 1 0 1 0 0 40 5≥2 - ≤5 kg 4 1 3 2 1 5 1 3 29 7≥5 - ≤10 kg 6 0 12 1 2 6 1 1 8 5≥10 - ≤25 kg 52 48 68 28 23 71 7 43 23 37≥25 - ≤50 kg 20 8 9 19 17 6 8 17 0 13≥50 - ≤80 kg 16 21 5 22 36 9 16 34 0 16>80 kg 0.7 22 1 25 21 3 67 3 0 16Table 6.42 Maize: The duration of storage as determined by the QFFQ by province: <strong>South</strong> Africa 1999Time Stored (%) EC FS G/TENG KZ M/GA NC NP NW WC RSANumber (n) 414 207 412 535 162 155 349 231 268 2744
Nutrient intake: Quantitative food frequency questionnaire407____________________________________________________________________________________________________________________________< 7 days 3 1 3 1 0 2 0 1 9 2≥7 - ≤14 days 6 4 10 6 1 6 0 6 23 7≥14 - ≤21 days 15 14 24 14 8 24 3 23 24 16≥21 - ≤28 days 23 14 16 13 9 20 7 28 8 15≥28 - ≤60 days 53 61 44 61 78 45 77 42 29 55>60 days 1 7 3 5 4 3 12 0 8 5Table 6.43 Maize: The duration of cooking as determined by the QFFQ by province: <strong>South</strong> Africa 1999Time Cooked (%) EC FS G/TENG KZ M/GA NC NP NW WC RSANumber (n) 348 204 360 444 138 138 281 198 260 2385< 10 min 0 1 3 1 1 4 0 2 11 210-20- min 4 2 10 2 0 9 2 8 37 820-30- min 4 2 19 10 12 17 5 11 15 1030-45- min 18 46 42 33 38 36 30 38 19 3245-60- min 3 36 13 16 22 16 15 18 4 1560-90- min 49 13 10 37 23 17 43 18 10 27>90 min 21 2 3 2 1 1 5 5 4 6
Nutrient intake: Quantitative food frequency questionnaire408____________________________________________________________________________________________________________________________Table 6.44Type of appliance (%)Maize: The type of appliance used for cooking as determined by the QFFQ by age group:<strong>South</strong> Africa 19991 - 3YearsAge group4 - 6Years7 – 9YearsRSANumber (n) 1255 1040 456 2751Open Fire 25 28 24 26Electric Stove 35 36 38 36Gas Stove 6 5 4 5Paraffin Stove 27 25 25 26Other 4 4 6 4Not Applicable 3 3 4 3
Nutrient intake: Quantitative food frequency questionnaire409____________________________________________________________________________________________________________________________Table 6.45 Maize: The type of appliance used for cooking as determined by the QFFQ by area ofType of appliance (%)residence: <strong>South</strong> Africa 1999Area of residenceCommercial Formal Informal Tribal Urban Rural RSAFarms Urban UrbanNumber (n) 286 1009 328 1128 1337 1414 2751Open Fire 25 3 4 53 4 47 26Electric Stove 40 63 29 13 55 18 36Gas Stove 7 6 5 3 6 4 5Paraffin Stove 20 19 53 26 27 25 26Other 7 2 8 5 4 5 4Not Applicable 2 6 1 1 5 1 3
Nutrient intake: Quantitative food frequency questionnaire410____________________________________________________________________________________________________________________________Table 6.46Maize: The type of appliance used for cooking as determined by the QFFQ by province:<strong>South</strong> Africa 1999Type ofEC FS G/TENG KZ M/GA NC NP NW WC RSAappliance (%)Number (n) 412 205 405 527 157 155 338 226 326 2751Open Fire 39 14 2 33 20 21 58 30 4 26Electric Stove 17 24 57 34 50 40 27 27 52 36Gas Stove 4 5 2 4 4 16 2 4 9 5Paraffin Stove 38 56 31 21 16 21 7 39 10 26Other* 1 1 7 5 10 2 6 0 7 4Not Applicable 0 0 1 2 0 0 0 0 18 3* Other includes Coal Stove (101 cases), Microwave (6 cases), Woodstove (21 cases)