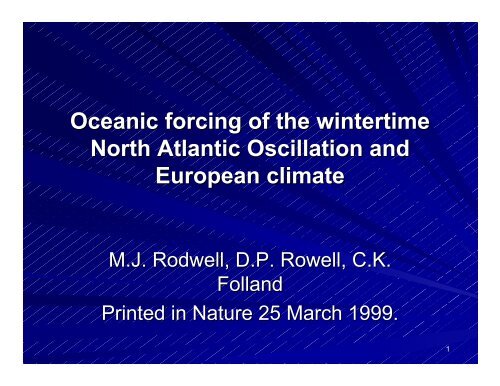
North Atlantic Oscillation Presentation
North Atlantic Oscillation Presentation
North Atlantic Oscillation Presentation
- No tags were found...

Create successful ePaper yourself
Turn your PDF publications into a flip-book with our unique Google optimized e-Paper software.
The positive phaseStronger subtropicalhigh pressure.(Azores High).Stronger Icelandic lowMore and strongerwinter storms on afurther north stormtrack5
Positive phase effectsWarm and wet winters in Europe.Cold and dry winters in northern Canadaand Greenland.Mild and wet winters in the U.S. EastCoast.6
The negative phaseWeak subtropical highWeak Icelandic lowResults in fewer andweaker winter stormspassing on a farthersouth more east-westtrack.7
Negative phase effectsMoist air in the Mediterranean.Cold air in northern Europe.Cold outbreaks in the U.S. east coast withsnowy periodsGreenland and northern Canada have abit milder winters.8
The <strong>North</strong> <strong>Atlantic</strong> <strong>Oscillation</strong>IndexNAO index= SLP (Lisbon) – SLP (Stykkisholmur)Red- positive phaseBlue- negative phaseDecadal trendsIs it linked to global warming?9
Global Warming10
Difference b/w - and + phase.Negative phase Dec-Feb, 1962-1969.1969.Positive phase Dec-Feb, 1987-1994.1994.P increased up to 30% in Britain andScandinavia.Decreased by 50% in southern Spain,Italy, and Greece.Benefits can be gained, if skillful longrange forecasts can be made.11
Paper’s GoalShow fluctuations of SST and strength of NAOare related.Prove SST characteristics are communicated tothe atmosphere by E, P, and atmosphericheating.Observational studies have shown that theremay be significant predictability of mixed-layeroceanic temps in the <strong>North</strong> <strong>Atlantic</strong> atmultiannual time scales.Show from the results NAO may be predictable.12
MethodologyInstruments:Global Atmospheric Model HadAM2bHorizontal grid 2.5 x 3.75, 19 vertical levels.Sigma coordinates.Time step: 30 min.Incorporates prognostic cloud water and ice.Mass flux convection scheme.13
MethodologyData:Model is forced with SST’s and sea iceextents from GISST 3.0 data set.Ensemble of six 128 year simulations from1870.Averages of the ensemble.Used data between 1947-1997.1997.Focus on DJF season.14
Model Verification15
Model Verification- UnfilteredModel simulates the main features of theNAO index well.Correlation b/w simulated and observed issignificant at the 98% level.Assuming SST is known, it may bepossible to predict the correct sign 2 out of3 years.Ensemble performs the best.16
Model Verification-FilteredTime scales longer than 6.5 years.Correlation is significant at the 99.9% levelObserved European sfc T and NAO indexis highly correlated, model does not do aswell.Note: The atmospheric model used doesnot have feedback into the ocean.Skill resides in prescribed SST and seaice.17
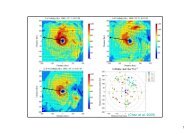
Regression of the observedunfiltered NAO index on to SST’s18
Regression of the observedunfiltered NAO index on to SST’sNegative centers in (ST) and south of (GL)and positive centers off the US east coastagrees well with previous work done.Outside regions, not significant correlation.When the NAO is regressed onto winterMSLP outside of (NA) there is nostatistical significance.19
Regression of the modelsimulated NAO index on to SST’sSimilar pattern as the unfiltered observed.This suggests ocean to atmosphereforcing is important at this time scale.Model correctly simulates the mainmechanisms.Difference between figures is in the <strong>North</strong>Sea and Baltic may suggest atmosphereto ocean forcing is dominate there.20
Set of figures from Grotzner21
Analysis in the Ocean’s MixedLayer.E in fig c represents cooling of the oceanand damps the P-N P N SST anomalies (fig a).Positive feedback on SST involving Econsidered by Groztner and Latif does notoccur in this model.Ekman Transport does provide a positivefeedback to the P-N P N SST anomaly overalmost the entire <strong>North</strong> <strong>Atlantic</strong> and formost of the year.22
ConclusionsEvidence has been provided thatsimulations of the NAO in the HadAM2bmodel are influenced by a pattern of <strong>North</strong><strong>Atlantic</strong> SST variability.The use of an atmospheric model forcedwith imposed SST’s was essential inestablishing the chain of cause and effectfrom SST anomalies to the NAO.23
ConclusionsPrevious authors (Saravanan) havesuggested that extra tropical ocean sfcheat fluxes may be over estimated.The results imply that the extra tropical (aswell as tropical) evaporative heat flux, andSST’s beneath them, may be central to theskill of our simulation of the NAO.24
Future WorkResolve the differences.Understand interannual and longer timescales predictability of SST pattern.Use fully coupled model, where synopticand longer time scale forcing of the oceanby the atmosphere is included.25
My CriticismNAO is predictable only if SST’s areknown.Most of the skill in the simulations is due tolonger term decadal variations. The realchallenge resides in forecasting theshorter term variations.26