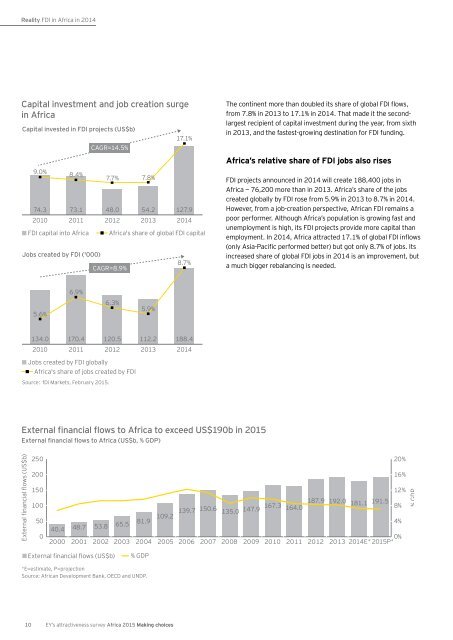
Reality FDI in Africa in 2014Capital investment and job creation surgein AfricaCapital invested in FDI projects (US$b)9.0%8.4%74.3 73.1 48.0 54.2 127.9FDI capital into AfricaJobs created by FDI ('000)CAGR=14.5%7.7% 7.8%17.1%2010 2011 2012 2013 2014Africa's share of global FDI capitalCAGR=8.9%8.7%The continent more than doubled its share of global FDI flows,from 7.8% in 2013 to 17.1% in 2014. That made it the secondlargestrecipient of capital investment during the year, from sixthin 2013, and the fastest-growing destination for FDI funding.Africa’s relative share of FDI jobs also risesFDI projects announced in 2014 will create 188,400 jobs inAfrica — 76,200 more than in 2013. Africa’s share of the jobscreated globally by FDI rose from 5.9% in 2013 to 8.7% in 2014.However, from a job-creation perspective, African FDI remains apoor performer. Although Africa’s population is growing fast andunemployment is high, its FDI projects provide more capital thanemployment. In 2014, Africa attracted 17.1% of global FDI inflows(only Asia-Pacific performed better) but got only 8.7% of jobs. Itsincreased share of global FDI jobs in 2014 is an improvement, buta much bigger rebalancing is needed.5.6%6.9%6.3%5.9%134.0 170.4 120.5 112.2 188.42010 2011 2012 2013 2014Jobs created by FDI globallyAfrica's share of jobs created by FDISource: fDi Markets, February <strong>2015</strong>.External financial flows to Africa to exceed US$190b in <strong>2015</strong>External financial flows to Africa (US$b, % GDP)External financial flows (US$b)25020015010050020%16%12%48.7 53.8 65.5 81.9 109.2 139.7 150.6 135.0 147.9 167.3 187.9 192.0 181.1 191.5164.08%4%40.40%2000 2001 2002 2003 2004 2005 2006 2007 2008 2009 2010 2011 2012 2013 2014E* <strong>2015</strong>P*% GDPExternal financial flows (US$b)% GDP*E=estimate, P=projectionSource: African Development Bank, OECD and UNDP.10 <strong>EY</strong>’s <strong>attractiveness</strong> <strong>survey</strong> Africa <strong>2015</strong> Making choices
www.ey.com/<strong>attractiveness</strong>African FDI inflows now exceed development aidAfrica has attracted substantial capital flows in the past decade,bolstered by strong growth prospects and better economicmanagement. A joint study by the African DevelopmentBank (AfDB), the Organization for Economic Cooperation andDevelopment (OECD) and the United Nations DevelopmentProgram (UNDP) estimates that external financial flows to Africahave quadrupled since 2000. 4External capital inflows are vital to the well-being of Africaneconomies. In <strong>2015</strong>, they are forecast to equal 7.2% of thecontinent’s GDP. Not only have these flows grown rapidly overall,but their sources have changed fundamentally. FDI has grownalmost five-fold since 2000. It has overtaken officialdevelopment assistance (ODA), which more than tripled in thesame period to US$56.3b in 2014, but which is expected toslow sharply henceforth. Meanwhile, remittances from Africansworking abroad have become the biggest source of foreigninflows to African states. After a six-fold increase, they areexpected to have topped US$64b in <strong>2015</strong>.While remittances help build homes, start businesses, andsupport consumption, FDI plays an equally vital role, helpingto build infrastructure, supply necessities, reduce poverty,develop skills, and more. FDI is helping diversify the continent’seconomies, many of which are overdependent on extracting andexporting natural resources.Foreign investments (both direct and portfolio) now largest source of capital flows to Africa (US$b)20002002200420062008201020122014E* <strong>2015</strong>P*Foreign directinvestments12.523.320.023.425.433.835.452.866.455.146.049.849.754.249.455.2Portfolioinvestments1.5-3.6-0.4-0.76.96.322.514.4-24.6-0.321.56.825.721.513.518.4Official developmentassistance15.516.821.427.430.035.844.639.545.247.948.051.751.355.856.354.9Remittances10.912.112.815.419.533.337.344.048.045.251.955.761.260.661.864.6% GDP6.8%8.4%9.3%9.3%9.7%11.0%12.3%11.4%8.7%10.0%9.6%8.6%8.3%8.2%7.3%7.2%Total40.448.753.865.581.9109.2139.7150.6135.0147.9167.3164.0187.9192.0181.1191.5*E=estimate, P=projectionSource: African Development Bank, OECD and UNDP.Where investors go: North Africa rebounds assouthern projects falterLast year, we highlighted an increase of FDI inflows in SSA, whilethose to North Africa declined. 2014 saw a strong resurgenceof FDI in North Africa, particularly in terms of capital inflows andjobs. Egypt and Morocco were the biggest winners. Meantime inSSA, where annual FDI project growth averaged 5.3% over thepast five years, project numbers fell 14.6% in 2014. Each of thethree key sub-regions (Southern, East and West Africa) attractedfewer projects, with declines in the hub economies of SouthAfrica, Nigeria, Ghana and Kenya. However, Mozambique andEthiopia attracted increased inward investment.North Africa recovers lost groundNorth Africa has regained traction after two sluggish years,attracting 22.2% more FDI projects than in 2013. It won ahigher share of African FDI projects, capital and jobs for thefirst time since 2007. And the capital inflows were big: NorthAfrica accounted for more than half of all African FDI inflows,against just 19.1% in 2013. And the number of jobs created,in a region where they are sorely needed, more than trebled toalmost 80,000, with North Africa’s share doubling to more than42% of the total. Though Libya remains unstable, investors have4 African Economic Outlook, African Development Bank, OECD and UNDP, <strong>2015</strong>.<strong>EY</strong>’s <strong>attractiveness</strong> <strong>survey</strong> Africa <strong>2015</strong> Making choices11