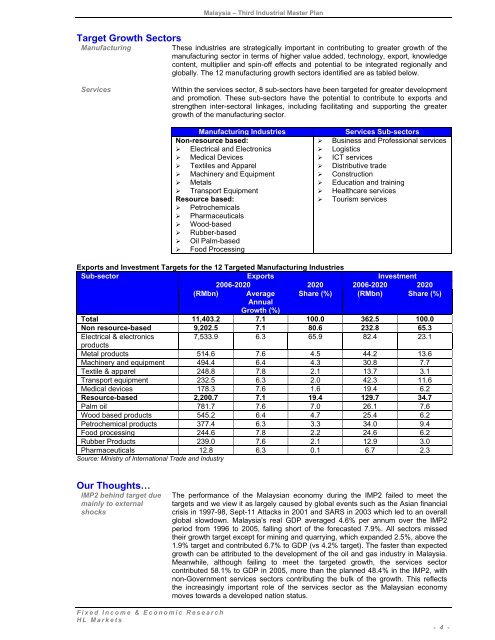
Malaysia – Third <strong>Industrial</strong> <strong>Master</strong> <strong>Plan</strong>Target Growth SectorsManufacturingThese industries are strategically important in contributing to greater growth of themanufacturing sector in terms of higher value added, technology, export, knowledgecontent, multiplier <strong>and</strong> spin-off effects <strong>and</strong> potential to be integrated regionally <strong>and</strong>globally. The 12 manufacturing growth sectors identified are as tabled below.ServicesWithin the services sector, 8 sub-sectors have been targeted <strong>for</strong> greater development<strong>and</strong> promotion. These sub-sectors have the potential to contribute to exports <strong>and</strong>strengthen inter-sectoral linkages, including facilitating <strong>and</strong> supporting the greatergrowth of the manufacturing sector.Manufacturing IndustriesNon-resource based:‣ Electrical <strong>and</strong> Electronics‣ Medical Devices‣ Textiles <strong>and</strong> Apparel‣ Machinery <strong>and</strong> Equipment‣ Metals‣ Transport EquipmentResource based:‣ Petrochemicals‣ Pharmaceuticals‣ Wood-based‣ Rubber-based‣ Oil Palm-based‣ Food ProcessingServices Sub-sectors‣ Business <strong>and</strong> Professional services‣ Logistics‣ ICT services‣ Distributive trade‣ Construction‣ Education <strong>and</strong> training‣ Healthcare services‣ Tourism servicesExports <strong>and</strong> Investment Targets <strong>for</strong> the 12 Targeted Manufacturing IndustriesSub-sector Exports Investment2006-2020 2020 2006-2020 2020(RMbn) Average Share (%) (RMbn) Share (%)AnnualGrowth (%)Total 11,403.2 7.1 100.0 362.5 100.0Non resource-based 9,202.5 7.1 80.6 232.8 65.3Electrical & electronics7,533.9 6.3 65.9 82.4 23.1productsMetal products 514.6 7.6 4.5 44.2 13.6Machinery <strong>and</strong> equipment 494.4 6.4 4.3 30.8 7.7Textile & apparel 248.8 7.8 2.1 13.7 3.1Transport equipment 232.5 6.3 2.0 42.3 11.6Medical devices 178.3 7.6 1.6 19.4 6.2Resource-based 2,200.7 7.1 19.4 129.7 34.7Palm oil 781.7 7.6 7.0 26.1 7.6Wood based products 545.2 6.4 4.7 25.4 6.2Petrochemical products 377.4 6.3 3.3 34.0 9.4Food processing 244.6 7.8 2.2 24.6 6.2Rubber Products 239.0 7.6 2.1 12.9 3.0Pharmaceuticals 12.8 6.3 0.1 6.7 2.3Source: Ministry of International Trade <strong>and</strong> IndustryOur Thoughts…IMP2 behind target duemainly to externalshocksThe per<strong>for</strong>mance of the Malaysian economy during the IMP2 failed to meet thetargets <strong>and</strong> we view it as largely caused by global events such as the Asian financialcrisis in 1997-98, Sept-11 Attacks in 2001 <strong>and</strong> SARS in 2003 which led to an overallglobal slowdown. Malaysia’s real GDP averaged 4.6% per annum over the IMP2period from 1996 to 2005, falling short of the <strong>for</strong>ecasted 7.9%. All sectors missedtheir growth target except <strong>for</strong> mining <strong>and</strong> quarrying, which exp<strong>and</strong>ed 2.5%, above the1.9% target <strong>and</strong> contributed 6.7% to GDP (vs 4.2% target). The faster than expectedgrowth can be attributed to the development of the oil <strong>and</strong> gas industry in Malaysia.Meanwhile, although failing to meet the targeted growth, the services sectorcontributed 58.1% to GDP in 2005, more than the planned 48.4% in the IMP2, withnon-Government services sectors contributing the bulk of the growth. This reflectsthe increasingly important role of the services sector as the Malaysian economymoves towards a developed nation status.Fixed Income & Economic ResearchHL Markets- 4 -
Malaysia – Third <strong>Industrial</strong> <strong>Master</strong> <strong>Plan</strong>Contribution of the Services Sector to Gross GDP in Selected Countries, 2004USA Hong Singapore Irel<strong>and</strong> Thail<strong>and</strong> MalaysiaKongShare to GDPServices (%) 80.4 91.8 70.1 44.6 49.9 60.3Manufacturing (%) 12.7 3.7 25.1 40.8 38.7 31.6Primary Sector (%) 2.2 0.1 0.1 4.0 11.4 15.4GDP growth rate (%) 4.4 8.1 8.4 4.9 6.1 7.1Services sector growth rate 5.1 7.8 6.4 3.8 6.5 6.4(%)Share of services sector to 79.0 94.5 79.2 65.0 43.1 57.8total employment (%)Source: USA: Bureau of Economic Analysis & Bureau of Labour Statistics; Singapore: Economic Survey of Singapore: HongKong: Central Statistics Hong Kong: Thail<strong>and</strong>: National Economic & Social Development Board: Irel<strong>and</strong>: Central Statistics Office,Irel<strong>and</strong>: Malaysia: Economic Report 2004/2005 <strong>and</strong> Bank Negara Report 2004.IMP3 emphasizes onattaining globalcompetitiveness……by leveraging onexisting strength, ANDbuilding on newcompetenciesIMP3 seeks to addressissues <strong>and</strong> challengesextensivelyServices sector to takeover the driver seat butwith manufacturingsector to remainprominentFinancial servicesamong the beneficiaryLimited short term gainbut long term positive6.3% growth target isachievable barringmajor externalsetbacksThe 3 rd <strong>Industrial</strong> <strong>Master</strong> <strong>Plan</strong> (IMP3), 2006-2020 outlines the industrial strategies<strong>and</strong> policies, which <strong>for</strong>m part of the country’s continuing ef<strong>for</strong>ts towards realising itsobjective of becoming a fully developed nation by 2020. The IMP3 rides on itsobjective to achieve global competitiveness through innovation <strong>and</strong> trans<strong>for</strong>mation ofthe manufacturing <strong>and</strong> services sectors while contributing to meeting the 5development trusts of the National Mission introduced under the 9MP.The IMP3 leverages upon the strengths <strong>and</strong> capabilities of existing industries <strong>and</strong> thecountry’s resources as well as its experiences of the previous plans, adjusted toreflect developments <strong>and</strong> opportunities in the global, regional <strong>and</strong> domesticenvironments. With this in mind, emphasis is given to technological upgrading,attracting <strong>and</strong> generating quality investments, developing innovative <strong>and</strong> creativehuman capital <strong>and</strong> integrating Malaysian industries <strong>and</strong> services into the regional <strong>and</strong>global networks <strong>and</strong> supply chains.The Malaysian economy is targeted to grow at an average of 6.3% YOY during theentire IMP3 period (2006-2020) after having exp<strong>and</strong>ed an average of 4.6%YOY from1996-2005. The IMP3 deals comprehensively with issues <strong>and</strong> challenges faced bythe manufacturing <strong>and</strong> non-government services sectors, including the provision of ahighly skilled <strong>and</strong> knowledgeable work<strong>for</strong>ce, creation of an efficient network oflogistics services <strong>and</strong> application of advance technologies.While the manufacturing sector was targeted to take the lead in driving growth in theIMP2, the IMP3 sees the services sector assuming the lead role in driving economicgrowth from 2006-2020. The manufacturing sector is expected to remain animportant source of growth <strong>and</strong> is targeted to contribute 28.5% to GDP in 2020 withan annual growth of 5.6% per annum during the IMP3. The services sector is set toplay a bigger role by broadening its economic base <strong>and</strong> contribution to exports. Overthe next 15 years, the sector is expected to grow at an annual rate of 7.3% <strong>and</strong>contribute 66.5% to GDP where 59.7% share is estimated to emanate from the non-Government services sectors. Meanwhile, even as the agriculture sector is expectedto become the third engine of growth, it is only expected to contribute 7.0% to GDP in2020, down from 8.2% in 2005. It is also interesting to note that all sectors, exceptservices, are expected to see a decline in their contribution to total GDP by 2020.Since RM1.3 trillion in overall investments or RM84.6bn of investments are neededannually to support growth in the targeted sectors, the financial services industrycould be among the most notable beneficiary of the IMP3 in terms of growth ascompanies look to the capital/ financial markets to raise their capital requirements.This is despite the fact that it is not one of the target growth sectors.We are of the view that the impact on the economy will be limited in the short-termbut it will be a positive in the longer term should competitiveness <strong>and</strong> potentials of thetargeted industries <strong>and</strong> services are enhanced during the IMP3 period.We believe that the 6.3% targeted growth <strong>for</strong> the entire IMP3 period (2006-2020) isachievable barring major economic setbacks arising from a global downturnespecially in the US <strong>and</strong> that the IMP3 policies <strong>and</strong> strategies are efficiently <strong>and</strong>effectively implemented. We are also of view that the IMP3 will be able to ride on theup-cycle of economic growth in Asia <strong>and</strong> other emerging markets. It is hopeful thatFixed Income & Economic ResearchHL Markets- 5 -


