Mortality - Isle of Wight Council
Mortality - Isle of Wight Council
Mortality - Isle of Wight Council

Create successful ePaper yourself
Turn your PDF publications into a flip-book with our unique Google optimized e-Paper software.
<strong>Isle</strong> <strong>of</strong> <strong>Wight</strong> Joint Strategic Needs Assessment - 2011<strong>Isle</strong> <strong>of</strong> <strong>Wight</strong> JSNA Briefing Note:<strong>Mortality</strong> (Deaths)page 1
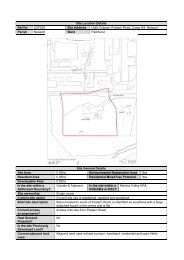
<strong>Isle</strong> <strong>of</strong> <strong>Wight</strong> Joint Strategic Needs Assessment - 2011<strong>Mortality</strong> (Deaths)BackgroundInformation about mortality (deaths) provides an insight into the health <strong>of</strong> the Island population in that, in very general terms, the healthier people are,the longer they are likely to live, and the lower (better) an area’s mortality rate.<strong>Mortality</strong> rates are affected by the age at which people die and are increased (worsened) by early (premature) deaths. Nationally, deaths before theage <strong>of</strong> 75 are regarded as ‘premature’.See also separate briefing note on Life Expectancy – life expectancy and mortality rates are calculated using the same data about deaths andpopulation.Contents and Key PointsThe data and charts below show, for the <strong>Isle</strong> <strong>of</strong> <strong>Wight</strong>:Number <strong>of</strong> deaths by year. There are approximately 1,680 deaths <strong>of</strong> IW residents each year (2005-09 annual average). The trend has beendownwards over time: longer-term trends will be affected by improving population health and projected population increases.Number <strong>of</strong> deaths by gender and age. 28% <strong>of</strong> IW deaths are in the under-75 age group, 72% are in the 75+ age group. Each year there aremore deaths <strong>of</strong> females compared with males.Main causes <strong>of</strong> death. Nearly 75% <strong>of</strong> IW deaths are from the 3 main causes <strong>of</strong> Cardiovascular Disease, Cancer and Respiratory Disease,mirroring the national pr<strong>of</strong>ile.<strong>Mortality</strong> rate from All Causeso All Ages. The IW mortality rate has decreased (improved) steadily, though the downward trend has slowed since 2004-06. The mostrecent IW rate is lower (better) than England’s and similar to the South East’s. <strong>Mortality</strong> is higher among males compared with females.o Age Under-75. While the IW rate has decreased (improved) steadily over time, the rate increased (worsened) in recent years, though itimproved again in 2009. The most recent IW rate is lower (better) than England’s and similar to the South East’s. <strong>Mortality</strong> is higheramong males compared with females.<strong>Mortality</strong> Rates from the 3 Main Causes <strong>of</strong> Death:o All Ages. Cancer, followed closely by CVD, have the highest mortality rates. <strong>Mortality</strong> rates from respiratory disease is considerablylower.o Age Under-75. Cancer is the major cause <strong>of</strong> mortality in the under-75 age group, and is considerably higher than the CVD mortality rate.Respiratory disease makes a relatively smaller contribution to mortality in this age group.page 2
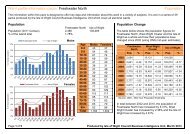
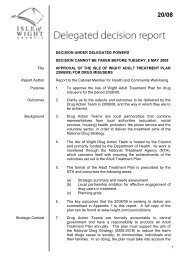
1995199619971998199920002001200220032004200520062007200820092010number <strong>of</strong> deathsnumber <strong>of</strong> deaths<strong>Isle</strong> <strong>of</strong> <strong>Wight</strong> Joint Strategic Needs Assessment - 2011Number <strong>of</strong> Deaths by YearThe charts below show trends in the number <strong>of</strong> deaths each year for Persons, All Ages and aged under-75 (the threshold below which deaths aredefined nationally as ‘premature’).In the last 5 years for which data is available (2006-10), there have been on average each year:- 1,691 deaths <strong>of</strong> IW residents <strong>of</strong> All Ages, <strong>of</strong> which on average:- 477 were among people aged under-75 (28% <strong>of</strong> all deaths).- 1,214 were among people aged over-75 (72% <strong>of</strong> all deaths).Both charts below show downward trends. Future trends in numbers <strong>of</strong> deaths will be affected both by improving health (exerting a downwardpressure) and projected population increases (exerting an upward pressure).Persons, All AgesPersons, aged under-75<strong>Isle</strong> <strong>of</strong> <strong>Wight</strong> Residents - Number <strong>of</strong> Deaths:Persons, All Ages<strong>Isle</strong> <strong>of</strong> <strong>Wight</strong> Residents - Number <strong>of</strong> Deaths:Persons aged under-752,0001,8001,6001,4001,2001,000Data Source: Office for National Statistics - Annual Death Extractspage 3600400200IW trendData Source: Office for National Statistics - Annual Death Extracts1995199619971998199920002001200220032004200520062007200820092010
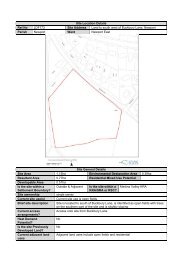
number <strong>of</strong> deaths% <strong>of</strong> total deaths<strong>Isle</strong> <strong>of</strong> <strong>Wight</strong> Joint Strategic Needs Assessment - 2011Main Causes <strong>of</strong> DeathNearly 75% <strong>of</strong> all deaths on the IW are caused by 3 main conditions:cardiovascular disease (including heart disease and stroke);cancer;respiratory disease (including bronchitis, chronic obstructive pulmonary disease and pneumonia).Data Source: Office for National Statistics – NHS Vital Statistics TablesIW – Number <strong>of</strong> Deaths by CauseThe chart below shows the number <strong>of</strong> deaths <strong>of</strong> IW residents from thesethree main causes for each <strong>of</strong> the last 3 years.For each condition the number <strong>of</strong> deaths has been broadly similar ineach <strong>of</strong> the 3 years except for cancer, where the number <strong>of</strong> deathsincreased by 13% between 2007-2008. It is not yet clear whether thiswas an anomaly, and the trend will be monitored.Main Causes <strong>of</strong> Death – Comparative BreakdownThe chart below shows the percentage <strong>of</strong> deaths accounted for by each<strong>of</strong> these three main causes, compared with England, for the period2006-08.Among IW residents these 3 causes accounted for 73% <strong>of</strong> all deaths, asimilar percentage to England (75%), with each <strong>of</strong> the 3 main causesmaking up a very similar % <strong>of</strong> the total.<strong>Isle</strong> <strong>of</strong> <strong>Wight</strong>: Deaths Registered in 2007 - 2009:All Ages - Breakdown by 3 Main Causes <strong>of</strong> Death3 Main Causes <strong>of</strong> Death as a % <strong>of</strong> All Deaths, 2007 - 2009:All Ages - <strong>Isle</strong> <strong>of</strong> <strong>Wight</strong> compared with England2007 2008 2009England<strong>Isle</strong> <strong>of</strong> <strong>Wight</strong>80040%60030%40020%20010%0cardiovascular disease cancer respiratory disease0%cardiovascular disease cancer respiratory diseaseData Source: Office for National Statistics - Vital Statistics TablesData Source: Office for National Statistics - Vital Statistics Tablespage 5
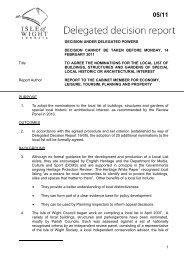
mortality per 100,000 populationmortality per 100,000 population<strong>Isle</strong> <strong>of</strong> <strong>Wight</strong> Joint Strategic Needs Assessment - 2011<strong>Mortality</strong> Rates from All Causes, All Ages<strong>Mortality</strong> (death) rates for a specific area are calculated using data on the number <strong>of</strong> deaths in that area, and its population, by gender and age. Thesame data is used to calculate Life Expectancy at Birth (see separate briefing).The mortality rates shown below are ‘directly age-standardised’, which means that they take account <strong>of</strong> the gender and age structure <strong>of</strong> thepopulation. This enables direct comparisons between areas with, for example, larger or smaller proportions <strong>of</strong> older people in their populations.Data Source: National Centre for Health Outcomes Development (NCHOD)Comparative <strong>Mortality</strong> Trends – All AgesThe chart below shows the trends in the IW all-cause mortality ratecompared with England and the South East. The pattern is similar to thatfor life expectancy, with a steady reduction (improvement) over time,which has however slowed since 2004-06. The most recent IW rate (for2007-09) is lower (better) than England’s and similar to the South East’s.IW <strong>Mortality</strong> Trends by Gender – All AgesThe chart below shows trends in IW all-cause mortality rates by gender.<strong>Mortality</strong> for males has been consistently higher than for females,however it has fallen slightly faster.800<strong>Mortality</strong> from All Causes (Directly Age Standardised Rates):Persons, All Ages<strong>Isle</strong> <strong>of</strong> <strong>Wight</strong> England South East900<strong>Isle</strong> <strong>of</strong> <strong>Wight</strong> <strong>Mortality</strong> from All Causes (Directly AgeStandardised Rates): All Ages: by GenderMalesFemales7006005004001995-971996-981997-991998-20001999&20012001-032002-042003-052004-062005-072006-082007-093001995-971996-981997-991998-20001999 &20012001-032002-042003-052004-062005-072006-082007-09Data Source: National Centre for Health Outcomes DevelopmentData Source: National Centre for Health Outcomes Developmentpage 6
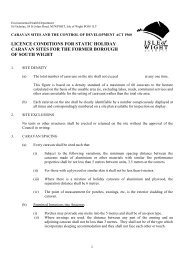
mortality per 100,000 populationmortality per 100,000 population<strong>Isle</strong> <strong>of</strong> <strong>Wight</strong> Joint Strategic Needs Assessment - 2011<strong>Mortality</strong> Rates from All Causes, Age under-75<strong>Mortality</strong> rates in the under-75 age group are considered nationally to be a measure <strong>of</strong> premature mortality. The charts below show mortality ratesfrom all causes <strong>of</strong> death among this age group. <strong>Mortality</strong> rates from the 3 main causes <strong>of</strong> death are then shown to indicate what contribution each ismaking to overall trends in under-75 mortality rates.Comparative <strong>Mortality</strong> Trends – age under-75The chart below shows the trends in IW all-cause mortality among peopleaged under-75 compared with England and the South East. Annual ratesare shown.While the IW rate decreased (improved) steadily over most <strong>of</strong> the periodshown, between 2004 – 2008 the rate increased (worsened), though itimproved again in 2009.The most recent IW rate (2009) is lower than the England rate but similarto the South East rate.IW <strong>Mortality</strong> Trends by Gender – age under-75The chart below shows the trends in IW all-cause mortality amongpeople aged under-75 by gender. Annual rates are shown.<strong>Mortality</strong> among males has been consistently higher than amongfemales. However both rates have decreased (improved) by 31% since1995, and the gap between the 2 rates has closed.<strong>Mortality</strong> from All Causes (Directly Age Standardised Rates):Persons aged under 75<strong>Isle</strong> <strong>of</strong> <strong>Wight</strong>: <strong>Mortality</strong> from All Causes (Directly Age StandardisedRates): Age under 75 by Gender<strong>Isle</strong> <strong>of</strong> <strong>Wight</strong> England South East600malesfemales4504003504003002502002001501993199419951996199719981999200020012002200320042005200620072008200901993 1994 1995 1996 1997 1998 1999 2000 2001 2002 2003 2004 2005 2006 2007 2008 2009Data Source: National Centre for Health Outcomes Development (NCHOD)Data Source: National Centre for Health Outcomes Development (NCHOD)page 7
mortality per 100,000populationmortality per 100,000 population<strong>Isle</strong> <strong>of</strong> <strong>Wight</strong> Joint Strategic Needs Assessment - 2011<strong>Mortality</strong> Rates from the 3 Main Causes <strong>of</strong> Death – Persons by Age GroupThe charts below compare <strong>Isle</strong> <strong>of</strong> <strong>Wight</strong> directly age-standardised mortality rates for Persons by age group, for the 3 main causes <strong>of</strong> death:Cardiovascular Disease (CVD);All cancers.Respiratory disease:o pneumoniao bronchitis, emphysema and other chronic obstructive pulmonary disease (COPD),(These 2 sets <strong>of</strong> conditions account for more than 80% <strong>of</strong> deaths from respiratory disease.)Data Source: National Compendium for Health Outcome Indicators (NCHOD)All Ages (Persons)Cancer, followed closely by CVD, have the highest mortality rates.The 2 respiratory conditions have considerably lower mortality rates.<strong>Isle</strong> <strong>of</strong> <strong>Wight</strong>: Main Causes <strong>of</strong> DeathDirectly Age-Standardised <strong>Mortality</strong> Rates, 2007-09:Persons, All Ages200Under-75 (Persons)Cancer is the major cause <strong>of</strong> mortality in the under-75 age group, and isconsiderably higher than the CVD mortality rate. The respiratory conditionsmake a relatively smaller contribution to mortality in this age group.<strong>Isle</strong> <strong>of</strong> <strong>Wight</strong>: Main Causes <strong>of</strong> DeathDirectly Age-Standardised <strong>Mortality</strong> Rates, 2007-09:Persons, Age under-7520015015010010050500cardiovasculardiseasecancerbronchitis,emphysema &other COPDData Source: National Centre for Health Outcomes Development (NCHOD)pneumonia0cardiovasculardiseasecancerbronchitis,emphysema &other COPDData Source: National Centre for Health Outcomes DevelopmentpneumoniaSee also separate briefing notes on Cancer, Cardiovascular Disease and Respiratory Disease.page 8