Use of the census of population to discern trends in the Welsh ...
Use of the census of population to discern trends in the Welsh ...
Use of the census of population to discern trends in the Welsh ...

You also want an ePaper? Increase the reach of your titles
YUMPU automatically turns print PDFs into web optimized ePapers that Google loves.
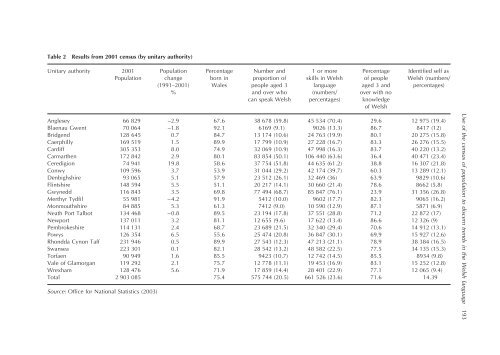
Table 2Results from 2001 <strong>census</strong> (by unitary authority)Unitary authority 2001PopulationPopulationchange(1991–2001)%Percentageborn <strong>in</strong>WalesNumber andproportion <strong>of</strong>people aged 3and over whocan speak <strong>Welsh</strong>1 or moreskills <strong>in</strong> <strong>Welsh</strong>language(numbers/percentages)Percentage<strong>of</strong> peopleaged 3 andover with noknowledge<strong>of</strong> <strong>Welsh</strong>Identified self as<strong>Welsh</strong> (numbers/percentages)Anglesey 66 829 −2.9 67.6 38 678 (59.8) 45 534 (70.4) 29.6 12 975 (19.4)Blaenau Gwent 70 064 −1.8 92.1 6169 (9.1) 9026 (13.3) 86.7 8417 (12)Bridgend 128 645 0.7 84.7 13 174 (10.6) 24 763 (19.9) 80.1 20 275 (15.8)Caerphilly 169 519 1.5 89.9 17 799 (10.9) 27 228 (16.7) 83.3 26 276 (15.5)Cardiff 305 353 8.0 74.9 32 069 (10.9) 47 998 (16.3) 83.7 40 220 (13.2)Carmar<strong>the</strong>n 172 842 2.9 80.1 83 854 (50.1) 106 440 (63.6) 36.4 40 471 (23.4)Ceredigion 74 941 19.8 58.6 37 754 (51.8) 44 635 (61.2) 38.8 16 307 (21.8)Conwy 109 596 3.7 53.9 31 044 (29.2) 42 174 (39.7) 60.3 13 289 (12.1)Denbighshire 93 065 5.1 57.9 23 512 (26.1) 32 469 (36) 63.9 9829 (10.6)Fl<strong>in</strong>tshire 148 594 5.5 51.1 20 217 (14.1) 30 660 (21.4) 78.6 8662 (5.8)Gwynedd 116 843 3.5 69.8 77 494 (68.7) 85 847 (76.1) 23.9 31 356 (26.8)Merthyr Tydfil 55 981 −4.2 91.9 5412 (10.0) 9602 (17.7) 82.3 9065 (16.2)Monmouthshire 84 885 5.3 61.3 7412 (9.0) 10 590 (12.9) 87.1 5871 (6.9)Neath Port Talbot 134 468 −0.8 89.5 23 194 (17.8) 37 551 (28.8) 71.2 22 872 (17)Newport 137 011 3.2 81.1 12 655 (9.6) 17 622 (13.4) 86.6 12 326 (9)Pembrokeshire 114 131 2.4 68.7 23 689 (21.5) 32 340 (29.4) 70.6 14 912 (13.1)Powys 126 354 6.5 55.6 25 474 (20.8) 36 847 (30.1) 69.9 15 927 (12.6)Rhondda Cynon Taff 231 946 0.5 89.9 27 543 (12.3) 47 213 (21.1) 78.9 38 384 (16.5)Swansea 223 301 0.1 82.1 28 542 (13.2) 48 582 (22.5) 77.5 34 135 (15.3)Torfaen 90 949 1.6 85.5 9423 (10.7) 12 742 (14.5) 85.5 8934 (9.8)Vale <strong>of</strong> Glamorgan 119 292 2.1 75.7 12 778 (11.1) 19 453 (16.9) 83.1 15 252 (12.8)Wrexham 128 476 5.6 71.9 17 859 (14.4) 28 401 (22.9) 77.1 12 065 (9.4)Total 2 903 085 75.4 575 744 (20.5) 661 526 (23.6) 71.6 14.39Source: Office for National Statistics (2003)<strong>Use</strong> <strong>of</strong> <strong>the</strong> <strong>census</strong> <strong>of</strong> <strong>population</strong> <strong>to</strong> <strong>discern</strong> <strong>trends</strong> <strong>in</strong> <strong>the</strong> <strong>Welsh</strong> language 193