The Adoption of Agricultural Technology - Food Security Group
The Adoption of Agricultural Technology - Food Security Group
The Adoption of Agricultural Technology - Food Security Group
You also want an ePaper? Increase the reach of your titles
YUMPU automatically turns print PDFs into web optimized ePapers that Google loves.
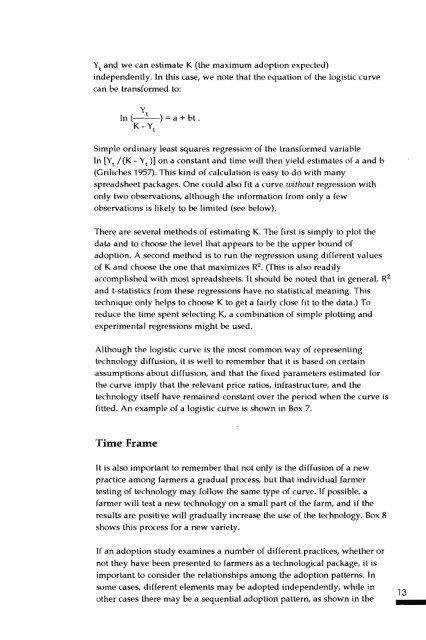
Yt and we can estimate K (the maximum adoption expected)independenlly. In this case, we note that the equation <strong>of</strong> the logistic curvecan be transformed to:Y tIn (--) =a + bt .K - Y tSimple ordinary least squares regression <strong>of</strong> the transformed variableIn [Y t/ (K - Y t)] on a constant and time wiII then yield estimates <strong>of</strong> a and b(Griliches 1957). This kind <strong>of</strong> calculation is easy to do with manyspreadsheet packages. One could also fit a curve without regression withonly two observations, although the information from only a fewobservations is likely to be limited (see below).<strong>The</strong>re are several methods <strong>of</strong> estimating K. <strong>The</strong> first is simply to plot thedata and to choose the level that appears to be the upper bound <strong>of</strong>adoption. A second method is to run the regression using different values<strong>of</strong> K and choose the one that maximizes R 2 • (This is also readilyaccomplished with most spreadsheets. It should be noted that in general, R 2and t-statistics from these regressions have no statistical meaning. Thistechnique only helps to choose K to get a fairly close fit to the data.) Toreduce the time spent selecting K, a combination <strong>of</strong> Simple plotting andexperimental regressions might be used.Although the logistic curve is the most common way <strong>of</strong> representingtechnology diffusion, it is well to remember that it is based on certainassumptions about diffusion, and that t~e fixed parameters estimated forthe curve imply that the relevant price ratios, infrastructure, and thetechnology itself have remained constant over the period when the curve isfitted. An example <strong>of</strong> a logistic curve is shown in Box 7.Time FrameIt is also important to remember that not only is the diffusion <strong>of</strong> a newpractice among farmers a gradual process, but that individual farmertesting <strong>of</strong> technology may follow the same type <strong>of</strong> curve. If possible, afarmer wiII test a new technology on a small part <strong>of</strong> the farm, and if theresults are positive wiII gradually increase the use <strong>of</strong> the technology. Box 8shows this process for a new variety.If an adoption study examines a number <strong>of</strong> different practices, whether ornot they have been presented to farmers as a technological package, it isimportant to consider the relationships among the adoption patterns. Insome cases, different elements may be adopted independently, while inother cases there may be a sequential adoption pattern, as shown in the13


