Hybrid Rice Production Possibilities in the ... - AgEcon Search
Hybrid Rice Production Possibilities in the ... - AgEcon Search
Hybrid Rice Production Possibilities in the ... - AgEcon Search

You also want an ePaper? Increase the reach of your titles
YUMPU automatically turns print PDFs into web optimized ePapers that Google loves.
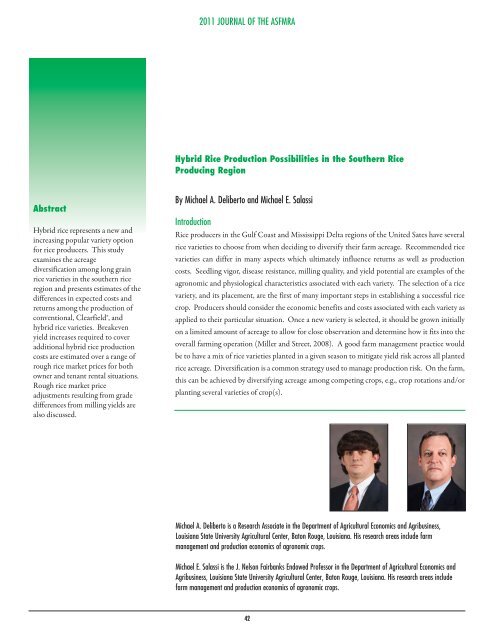
2011 JOURNAL OF THE ASFMRA<strong>Hybrid</strong> <strong>Rice</strong> <strong>Production</strong> <strong>Possibilities</strong> <strong>in</strong> <strong>the</strong> Sou<strong>the</strong>rn <strong>Rice</strong>Produc<strong>in</strong>g RegionAbstract<strong>Hybrid</strong> rice represents a new and<strong>in</strong>creas<strong>in</strong>g popular variety optionfor rice producers. This studyexam<strong>in</strong>es <strong>the</strong> acreagediversification among long gra<strong>in</strong>rice varieties <strong>in</strong> <strong>the</strong> sou<strong>the</strong>rn riceregion and presents estimates of <strong>the</strong>differences <strong>in</strong> expected costs andreturns among <strong>the</strong> production ofconventional, Clearfield®, andhybrid rice varieties. Breakevenyield <strong>in</strong>creases required to coveradditional hybrid rice productioncosts are estimated over a range ofrough rice market prices for bothowner and tenant rental situations.Rough rice market priceadjustments result<strong>in</strong>g from gradedifferences from mill<strong>in</strong>g yields arealso discussed.By Michael A. Deliberto and Michael E. SalassiIntroduction<strong>Rice</strong> producers <strong>in</strong> <strong>the</strong> Gulf Coast and Mississippi Delta regions of <strong>the</strong> United Sates have severalrice varieties to choose from when decid<strong>in</strong>g to diversify <strong>the</strong>ir farm acreage. Recommended ricevarieties can differ <strong>in</strong> many aspects which ultimately <strong>in</strong>fluence returns as well as productioncosts. Seedl<strong>in</strong>g vigor, disease resistance, mill<strong>in</strong>g quality, and yield potential are examples of <strong>the</strong>agronomic and physiological characteristics associated with each variety. The selection of a ricevariety, and its placement, are <strong>the</strong> first of many important steps <strong>in</strong> establish<strong>in</strong>g a successful ricecrop. Producers should consider <strong>the</strong> economic benefits and costs associated with each variety asapplied to <strong>the</strong>ir particular situation. Once a new variety is selected, it should be grown <strong>in</strong>itiallyon a limited amount of acreage to allow for close observation and determ<strong>in</strong>e how it fits <strong>in</strong>to <strong>the</strong>overall farm<strong>in</strong>g operation (Miller and Street, 2008). A good farm management practice wouldbe to have a mix of rice varieties planted <strong>in</strong> a given season to mitigate yield risk across all plantedrice acreage. Diversification is a common strategy used to manage production risk. On <strong>the</strong> farm,this can be achieved by diversify<strong>in</strong>g acreage among compet<strong>in</strong>g crops, e.g., crop rotations and/orplant<strong>in</strong>g several varieties of crop(s).Michael A. Deliberto is a Research Associate <strong>in</strong> <strong>the</strong> Department of Agricultural Economics and Agribus<strong>in</strong>ess,Louisiana State University Agricultural Center, Baton Rouge, Louisiana. His research areas <strong>in</strong>clude farmmanagement and production economics of agronomic crops.Michael E. Salassi is <strong>the</strong> J. Nelson Fairbanks Endowed Professor <strong>in</strong> <strong>the</strong> Department of Agricultural Economics andAgribus<strong>in</strong>ess, Louisiana State University Agricultural Center, Baton Rouge, Louisiana. His research areas <strong>in</strong>cludefarm management and production economics of agronomic crops.42
2011 JOURNAL OF THE ASFMRAwea<strong>the</strong>r disturbances, and also allows growers <strong>in</strong> southwesternLouisiana and Texas to harvest a second (ratoon) crop (Sha,L<strong>in</strong>scombe, and Groth, 2007).Accord<strong>in</strong>g to Arkansas, Louisiana, Mississippi, and Texas rice acreagesummaries for 2009, of <strong>the</strong> approximate 2,345,914 acres of rice <strong>in</strong>planted <strong>in</strong> <strong>the</strong> region, long gra<strong>in</strong> varieties were produced onapproximately 88.2 percent (2,069,898 acres) of <strong>the</strong> total rice acreage,with <strong>the</strong> rema<strong>in</strong><strong>in</strong>g 11.8 percent (276,016 acres) of acreage <strong>in</strong>medium gra<strong>in</strong> varieties. Lead<strong>in</strong>g long gra<strong>in</strong> conventional rice varieties<strong>in</strong> production with<strong>in</strong> this region <strong>in</strong>clude: Cheniere, Cocodrie, Wells,and Francis. Clearfield® (CL) rice varieties <strong>in</strong>clude CL 151, 161, 131,and 171. <strong>Hybrid</strong> varieties grown <strong>in</strong> <strong>the</strong> region <strong>in</strong>clude CLXL 729 and745 along with XL 723 and 729, to a less extent (Table 3).In Arkansas, conventional varieties account for approximately 31.2percent of long gra<strong>in</strong> rice acres. Clearfield® rice accounts for 18percent and Clearfield® hybrid varieties account for 23 percent. InLouisiana, 47 percent of <strong>the</strong> long gra<strong>in</strong> rice acreage is planted <strong>in</strong>Clearfield® varieties. Conventional varieties represent 20 percent, andClearfield® hybrids account for 13 percent. Conventional long gra<strong>in</strong>rice acreages Mississippi represents 43 percent of total acreage, withClearfield® and Clearfield® hybrid varieties account<strong>in</strong>g for 46 percentand seven percent, respectively. Long gra<strong>in</strong> acres <strong>in</strong> Texas are ma<strong>in</strong>lyconcentrated <strong>in</strong> conventional varieties, at 49 percent. Clearfield®varieties account for 16 percent, with Clearfield® hybrids account<strong>in</strong>gfor six percent and conventional hybrids total<strong>in</strong>g 11 percent.<strong>Rice</strong> Variety Trials/Characteristics<strong>Rice</strong> variety performance trials across <strong>the</strong> sou<strong>the</strong>rn rice productionregion have demonstrated <strong>the</strong> yield advantage of hybrids overconventional rice varieties. Table 4 depicts comparative variety trialresults from evaluations conducted <strong>in</strong> 2009. General results across <strong>the</strong>rice belt show that hybrid yield advantage exists <strong>in</strong> each productionregion with similar, or slightly lower mill<strong>in</strong>g yields. Variety trialresults, specifically hybrid yield levels, will vary from <strong>the</strong> actual farmyields due to <strong>the</strong> agronomic site characteristics and productionpractices associated <strong>in</strong> different production areas. Rough rice value,on ei<strong>the</strong>r a market price or a loan rate basis, is based on <strong>the</strong> rough ricemill<strong>in</strong>g yield and <strong>the</strong> milled rice value (price) for whole kernel andbroken kernel rice. Mill<strong>in</strong>g yield refers to <strong>the</strong> amount of white“polished” rice that can be obta<strong>in</strong>ed from rough rice kernel. Thesefactors are important <strong>in</strong> correctly evaluat<strong>in</strong>g rice crop profitability.Estimated Variable <strong>Production</strong> CostsIn Arkansas, 2010 projected production costs for drill plantedconventional rice are $597.30 per acre. <strong>Hybrid</strong> rice <strong>in</strong> Arkansas wasestimated at $674.54 per acre. In Louisiana, water plantedconventional rice was projected to total $576.15 per acre for 2010.Clearfield® rice, drill planted was estimated to total $594.13 for thatsame year (see Table 5). In Mississippi, Clearfield® rice expenses for2010 total $545.60 per acre. In Texas, rice production costs areestimated at $523.62 per acre for Jefferson and Liberty Counties,while rice farms west of <strong>the</strong> Houston area exhibit production costs at$774.79 per acre <strong>in</strong> 2010.Variation <strong>in</strong> production costs with<strong>in</strong> <strong>the</strong> region can be attributed tosoil, climate, tillage, rotational systems, and disease pressure. Inputssuch as chemicals, fertilizer, and fuel, have <strong>the</strong> potential to vary bylocale, along with land tenure and “custom” farm<strong>in</strong>g activities.Noticeable production cost <strong>in</strong>creases result from: <strong>the</strong> price ofClearfield® and hybrid rice seed as compared to conventional rice seed,additional recommended fertilizer (N) application rates per varietytype, fungicide application(s), dry<strong>in</strong>g, and haul<strong>in</strong>g charges. Dry<strong>in</strong>gand haul<strong>in</strong>g are functions of <strong>the</strong> yield per acre; <strong>the</strong>refore <strong>the</strong>se rateswill vary by <strong>the</strong> rice output. Information on rice production costs wereobta<strong>in</strong>ed from each state’s university agricultural extension service.Comparison of Clearfield ® and <strong>Hybrid</strong> <strong>Rice</strong> Enterprise Budgetsfor LouisianaA hybrid variety rice enterprise budget for Louisiana is be<strong>in</strong>gdeveloped due to <strong>the</strong> fact that many producers are expand<strong>in</strong>g <strong>the</strong>iracreage allocation to <strong>in</strong>clude <strong>the</strong>se high yield<strong>in</strong>g varieties. Obta<strong>in</strong><strong>in</strong>gdetailed production cost estimates for hybrid variety rice is limited.The premium that hybrid rice seed demands can act as a majordeterrent for producers <strong>in</strong> <strong>in</strong>vest<strong>in</strong>g acres to this variety. Informationfrom Louisiana rice producers and area extension agents has aided <strong>in</strong>obta<strong>in</strong><strong>in</strong>g an overall estimate of production costs associated withhybrid rice production. Irrigation cost estimates were held constantbetween varieties at an application of 25 acre-<strong>in</strong>ches of water from adeep well water source. Herbicide and <strong>in</strong>secticide costs were also heldconstant based on <strong>in</strong>dustry as well as university recommendations.Through <strong>the</strong> comparison of seed costs for conventional, Clearfield®,and Clearfield® hybrid rice varieties, noticeable differences exist <strong>in</strong> <strong>the</strong>seed<strong>in</strong>g rates and price per acre. <strong>Hybrid</strong> rice is planted at a lowerdensity as compared to <strong>the</strong> conventional and Clearfield® rice and as aresult, <strong>the</strong> recommended seed<strong>in</strong>g rate is 30 pounds per acre. Seed44
2011 JOURNAL OF THE ASFMRAcosts for drill plant<strong>in</strong>g Clearfield® rice (e.g., CL 151) at arecommended rate of 75 pounds per acre at a unit price of $0.88 perpounds amounts to a $66.00 per acre cost. The seed cost forClearfield® hybrid varieties, specifically CLXL 729, were obta<strong>in</strong>edthrough dealer price quotes on a dollars per acre basis. In January2010, Clearfield® hybrid rice seed was quoted at $146.00 per acre,represent<strong>in</strong>g an $80.00 per acre <strong>in</strong>crease <strong>in</strong> seed cost for hybrids overClearfield® varieties.Nitrogen (N) fertilizer recommendations for <strong>the</strong> majority of ricevarieties produced <strong>in</strong> Louisiana for Clearfield® rice is between 120-160 pounds per acre. The price per pound of N was projected <strong>in</strong> early2010 at $0.42. Assum<strong>in</strong>g an application rate of 130 pounds per acre,<strong>the</strong> total N cost per acre is $54.60. The recommended N applicationrate for hybrid rice is 150 pounds per acre. Hold<strong>in</strong>g <strong>the</strong> N fertilizerunit price per pound constant at $0.42, <strong>the</strong> total N cost for <strong>the</strong> hybridcrop is $63.00. Although, <strong>the</strong> N cost is slightly higher ($8.40 per acre)with <strong>the</strong> election of hybrid varieties, this expenditure may becomesignificant if <strong>the</strong> price of fertilizer were to <strong>in</strong>crease to 2008 levels <strong>in</strong>excess of $0.54 per pound.Disease pressure <strong>in</strong> south Louisiana is a critical issue confront<strong>in</strong>g riceproducers. Diseases such as blast, sheath blight, and straigh<strong>the</strong>ad cansignificantly reduce <strong>the</strong> yield potential of <strong>the</strong> rice plant, regardless of<strong>the</strong> variety. Fungicide applications are common to Clearfield®varieties planted <strong>in</strong> Louisiana. Quadris® (Syngenta Crop Protection) isa typical rice fungicide treatment with a recommended applicationrate of 10.0 fluid ounce per acre. At a material price of $2.56 perounce, <strong>the</strong> fungicide application would equate to $25.60 per acre.<strong>Hybrid</strong> rice varieties, as described by <strong>Rice</strong>Tec, do not normally requirefungicides due to <strong>the</strong>ir disease resistance packages. However,producers and farm managers should take note that rice fields need tobe scouted regularly and treated if necessary. A common fungicideapplication for hybrid varieties may <strong>in</strong>clude a treatment on roughly 60percent of all hybrid rice acreage, based on <strong>the</strong> assumption thatprobably more than half of hybrid rice acreage would be treated byproducers with a fungicide as a precaution. The Quadris® price is heldconstant with <strong>the</strong> fluid ounce application reduced to represent 60percent of its orig<strong>in</strong>al amount. This is <strong>in</strong>tended to represent aweighted average of <strong>the</strong> acreage receiv<strong>in</strong>g a fungicide application andnot a reduction <strong>in</strong> <strong>the</strong> rate of <strong>the</strong> chemical. The cost estimate for afungicide treatment on hybrid rice would <strong>the</strong>refore be $15.36,represent<strong>in</strong>g a $10.24 cost sav<strong>in</strong>gs <strong>in</strong> application compared toClearfield® varieties.Based on <strong>the</strong> <strong>in</strong>put rate assumptions for seed, N fertilizer, andfungicide categories utilized <strong>in</strong> this analysis, production of a hybridvariety, such as CLXL 729 compared to a Clearfield® 151 <strong>in</strong> Louisianawould be expected to have production costs, which are $74.70 peracre higher.Required Breakeven Yield IncreasesThe breakeven rice yield <strong>in</strong>creases required for hybrid rice producedon cropland which is ei<strong>the</strong>r owned or cash rented, represent<strong>in</strong>gsituations <strong>in</strong> which <strong>the</strong> producer would pay all of <strong>the</strong> <strong>in</strong>creased hybridrice production costs and receive 100 percent of <strong>the</strong> crop proceedsafter sale, was estimated us<strong>in</strong>g <strong>the</strong> follow<strong>in</strong>g formula:(1)where BEYI is <strong>the</strong> required breakeven rice yield <strong>in</strong>crease (cwt/ac),ΔPC is <strong>the</strong> change <strong>in</strong> production costs per acre paid by <strong>the</strong> grower($/ac), MP is <strong>the</strong> rough rice market price (cwt/ac), and HD is <strong>the</strong>haul<strong>in</strong>g and dry<strong>in</strong>g charge per yield unit ($/cwt). To reflectrepresentative haul<strong>in</strong>g and dry<strong>in</strong>g charges, $0.30 per cwt was assignedto <strong>the</strong> haul<strong>in</strong>g expense category. Commercial rice dry<strong>in</strong>g facilitieswere contacted <strong>in</strong> southwestern Louisiana <strong>in</strong> order to accuratelyestimate dry<strong>in</strong>g costs. Assum<strong>in</strong>g that <strong>the</strong> rice is harvested at amoisture content of 22 percent, <strong>the</strong> applicable dry<strong>in</strong>g cost per cwt of$1.54 was assigned. Dry<strong>in</strong>g and haul<strong>in</strong>g are calculated as a function ofyield, mean<strong>in</strong>g higher yield<strong>in</strong>g varieties will <strong>in</strong>cur greater costs <strong>in</strong> <strong>the</strong>setwo production categories. For rice produced on land that is sharerentedwhere <strong>the</strong> grower receives an agreed upon predeterm<strong>in</strong>edpercentage of <strong>the</strong> crop, proceeds at sale and would most likely pay formost or all of <strong>the</strong> <strong>in</strong>crease <strong>in</strong> production costs, <strong>the</strong> required breakevenyield would be estimated via <strong>the</strong> revised formula:(2)BEYI = ΔPC / (MP – HD)BEYI = ΔPC / (MP – HD) x GS%where ΔPC is <strong>the</strong> change <strong>in</strong> production costs per acre paid by <strong>the</strong>grower ($/ac) and GS% is <strong>the</strong> grower’s share of <strong>the</strong> crop proceedsunder a crop share land tenure arrangement. It should be noted that<strong>the</strong> change <strong>in</strong> production costs per acre may be different <strong>in</strong> Equation2 than <strong>in</strong> Equation 1 due to <strong>the</strong> contractual obligations of each partyto share <strong>in</strong> certa<strong>in</strong> expense categories.Breakeven yield <strong>in</strong>creases are highly dependent on <strong>the</strong> current relevantrough rice market price level. Increases (decreases) <strong>in</strong> rough ricemarket price reduce (raise) required breakeven yields. For example,45
2011 JOURNAL OF THE ASFMRAUnited States Department of Agriculture. National Agricultural Statistics Service. U.S. and All States Data-Crops. www.nass.usda.gov. DateAccessed: June 15, 2010.Webster, E. and R. Levy. “Weed Management.” Louisiana <strong>Rice</strong> <strong>Production</strong> Handbook. Ed. J. Saichuk. Louisiana State University AgriculturalCenter. Publication No. 2321. June 2009.Wilson, Charles E. et al. “<strong>Rice</strong> Information” University of Arkansas Division of Agriculture. No. 168. December 2009.48
2011 JOURNAL OF THE ASFMRATable 1. <strong>Rice</strong> production (1,000 cwt) by locale <strong>in</strong> <strong>the</strong> sou<strong>the</strong>rn region (2000-2009)Year Arkansas Louisiana Mississippi Texas U.S. 1/2000200186,112102,85824,40230,01412,86216,69814,34214,790190,872215,27020022003200420052006200720082009Average (1,000 cwt)Prod. Increase 2/ (1,000 cwt)96,75296,188108,560108,79296,56595,81492,93899,92498,450312.429,40026,39728,73030,98320,29423,22227,03729,21726,969-148.216,19215,91216,14616,83213,23013,89215,68716,28115,37329.314,61611,88014,90613,26610,7609,49711,86813,20112,912-371.6210,960199,897232,362222,833194,585198,388203,733219,850208,875555.91 U.S. serves as a representative for all rice produc<strong>in</strong>g states <strong>in</strong>clud<strong>in</strong>g Missouri and California2 Slope function used to calculate <strong>the</strong> production <strong>in</strong>crease <strong>in</strong> 1,000 cwt for each state based on historical production data available from NASSTable 2. <strong>Rice</strong> yield level (lbs/ac) by locale <strong>in</strong> <strong>the</strong> sou<strong>the</strong>rn region (2000-2009)Year Arkansas Louisiana Mississippi Texas U.S. 1/200020016,0116,3505,0805,5005,9006,6606,7006,8506,2816,49620022003200420052006200720082009Average (lbs)Yearly Increase 2/ (lbs)6,4406,6106,9806,6506,9007,2306,6606,8006,67378.05,5005,8705,3905,9005,8806,1405,8306,3005,739103.26,4006,8006,9006,4007,0007,3506,8506,7006,69083.67,1006,6006,8406,6007,1706,5506,9007,7706,90852.76,5786,6706,9886,6246,8987,2196,8467,0856,76880.11 U.S. serves as a representative for all rice produc<strong>in</strong>g states <strong>in</strong>clud<strong>in</strong>g Missouri and California2 Slope function used to calculate <strong>the</strong> production <strong>in</strong>crease <strong>in</strong> pounds for each state based on historical production data available from NASS49
2011 JOURNAL OF THE ASFMRATable 3. Long gra<strong>in</strong> rice acreage summary for sou<strong>the</strong>rn rice produc<strong>in</strong>g states, 2009 crop yearStateArkansasLouisianaMississippiTotal <strong>Rice</strong> AcresPercent of TotalTotal <strong>Rice</strong> AcresPercent of TotalTotal <strong>Rice</strong> AcresPercent of TotalMajor Long Gra<strong>in</strong> <strong>Rice</strong> Varieties<strong>Rice</strong> Varieties Planted <strong>in</strong> ArkansasWells CLXL 729 CL 151 Francis CLXL 745 CL 171 Cheniere O<strong>the</strong>r 1/240,778 220,733 172,488 140,345 118,461 93,751 78,455 169,92316.51 15.14 11.83 9.63 8.12 6.43 5.38 11.65<strong>Rice</strong> Varieties Planted <strong>in</strong> LouisianaCL 151 CL 161 Cocodrie CL 131 Cheniere CLXL 729 CLXL 745 O<strong>the</strong>r 2/116,864 43,609 40,630 39,992 36,236 30,163 27,298 70,15625.61 9.56 8.90 8.76 7.94 6.61 5.98 15.38<strong>Rice</strong> Varieties Planted <strong>in</strong> MississippiCocodrie CL 151 CL 131 CLXL 729 CLXL 745 Cheniere Bowman O<strong>the</strong>r 3/94,097 65,879 48,729 10,442 7,256 7,162 5,952 10,13037.69 26.39 19.52 4.18 2.91 2.87 2.38 4.0TexasTotal <strong>Rice</strong> AcresPercent of Total<strong>Rice</strong> Varieties Planted <strong>in</strong> TexasCocodrie CL 151 Presidio XL 723 Cheniere Milagro CLXL 745 O<strong>the</strong>r 4/36,772 27,239 20,858 17,017 13,642 11,748 11,025 6,05321.63 16.02 12.27 10.01 8.03 6.91 6.49 3.561 Arkansas o<strong>the</strong>r long gra<strong>in</strong> varieties <strong>in</strong>clude: Catahoula, CL 131, CL 161, Cypress, CLXL 730, CLXL 746, CLXL 751, and XL 723.2 Louisiana o<strong>the</strong>r long gra<strong>in</strong> varieties <strong>in</strong>clude: Catahoula, CL 171, CLXL 730, Cypress, XP 746, Sab<strong>in</strong>e, Wells, and XL 723.3 Mississippi o<strong>the</strong>r long gra<strong>in</strong> varieties <strong>in</strong>clude: Sab<strong>in</strong>e, Wells, XP 723, CLXL 745, CLXL 744, CL 161, CL 171, and Cheniere.4 Texas o<strong>the</strong>r long gra<strong>in</strong> varieties <strong>in</strong>clude: XP 723, XL 729, Catahoula, CL 171, XL 746, CL 161, Sierra, and CLXL 730.Source: Variety trial results were obta<strong>in</strong>ed from <strong>the</strong> University of Arkansas Division of Agriculture, Louisiana State University Ag Center <strong>Rice</strong>Research Station, Mississippi State University Delta Research Center, and Texas A&M University Extension Agricultural EconomicsDepartment.50
2011 JOURNAL OF THE ASFMRATable 4. 2009 sou<strong>the</strong>rn rice variety performance trial resultsArkansasVariety Seed Type Percent ofstate acreageWellsConventional 16.51CL 151Clearfield® 11.83CLXL 729 CL <strong>Hybrid</strong> 15.14Gra<strong>in</strong> Yield(lbs/ac)8,2356,9758,730Mill<strong>in</strong>g Yield62-7464-7159-73LouisianaCocodrieCL 151CLXL 729ConventionalClearfield®CL <strong>Hybrid</strong>8.9025.616.616,8858,5019,16267-7367-7261-71MississippiCocodrieCL 151CLXL 729ConventionalClearfield®CL <strong>Hybrid</strong>37.6926.394.188,9109,90012,46555-6762-6963-72TexasCocodrieCL 151CLXL 729ConventionalClearfield®CL <strong>Hybrid</strong>21.6316.021.006,4767,3127,07359-7157-7058-70Source: Variety trial results were obta<strong>in</strong>ed from <strong>the</strong> University of Arkansas Division of Agriculture, Louisiana State University Ag Center <strong>Rice</strong>Research Station, Mississippi State University Delta Research Center, and Texas A&M University Extension Agricultural EconomicsDepartment.Table 5. Estimates variable costs per acre among common rice varieties for sou<strong>the</strong>rn rice region, 2010Variable (Direct) Cost per AcreExpense Category Arkansas (C) Arkansas (H) Louisiana (CL) Louisiana (H) Mississippi (CL) Texas (C)FertilizersChemicals 1/$131.26$102.63$141.96$83.11$99.00$80.78$107.40$70.54$73.74$85.09$118.20$65.00Diesel FuelSeedTotal Direct Costs 2/ $88.58$34.04$597.30$88.58$141.96$674.54$134.02$66.00$594.13$134.02$146.00$764.25$67.28$82.72$545.60$45.00$31.50$523.621 Farm chemicals <strong>in</strong>clude herbicides, fungicides, and <strong>in</strong>secticides recommended for use by each state’s extension service.2 Dry<strong>in</strong>g and haul<strong>in</strong>g charges are per unit and <strong>the</strong>refore are function of <strong>the</strong> projected yield level. They are not <strong>in</strong>cluded <strong>in</strong> this table. [C =conventional variety, CL = Clearfield® variety, H = hybrid variety].Source: Variety trial results were obta<strong>in</strong>ed from <strong>the</strong> University of Arkansas Division of Agriculture, Louisiana State University Ag Center <strong>Rice</strong>Research Station, Mississippi State University Delta Research Center, and Texas A&M University Extension Agricultural EconomicsDepartment.51
2011 JOURNAL OF THE ASFMRATable 6. Ma<strong>in</strong> crop breakeven yield <strong>in</strong>creases required to cover <strong>in</strong>creased production costs from Clearfield® to hybrid rice production <strong>in</strong> LouisianaRough <strong>Rice</strong>Price ($/cwt)$12.00$13.00$14.00$15.00Owner-Operatoror Cash Rent735 lbs/ac669 lbs/ac614 lbs/ac567 lbs/acTenant-Operator70/30 Crop Share1,050 lbs/ac956 lbs/ac878 lbs/ac811 lbs/acTable 7. Estimated mill<strong>in</strong>g yield impacts on rough rice market prices for 2009 variety trial yield resultsArkansasLouisianaMississippiTexasBase Rough <strong>Rice</strong> Market Price LevelVariety Mill<strong>in</strong>g Yield $12.00 $13.00 $14.00 $15.00Wells 1/62-74 $12.91 $13.99 $15.06 $16.14CLXL 729 3/ 58-70 $12.21 $13.22 $14.24 $15.26CL 151 2/64-71 $12.66 $13.71 $14.77 $15.82CLXL 729 3/ 59-73 $12.61 $13.66 $14.71 $15.76Cocodrie 1/ 67-73 $13.04 $14.12 $15.21 $16.30CL 151 2/67-72 $12.91 $13.98 $15.06 $16.13CLXL 729 2/ 61-71 $12.45 $13.49 $14.53 $15.56Cocodrie 1/ 55-67 $11.62 $12.59 $13.56 $14.53CL 151 2/62-69 $12.29 $13.31 $14.34 $15.36CLXL 729 3/ 63-72 $12.72 $13.78 $14.84 $15.90Cocodrie 1/ 59-71 $12.39 $13.42 $14.46 $15.49CL 151 2/57-70 $12.14 $13.15 $14.16 $15.171 Conventional variety2 Clearfield® variety3 <strong>Hybrid</strong> varietySource: Variety trial results were obta<strong>in</strong>ed from <strong>the</strong> University of Arkansas Division of Agriculture, Louisiana State University Ag Center <strong>Rice</strong>Research Station, Mississippi State University Delta Research Center, and Texas A&M University Extension Agricultural EconomicsDepartment.52