Mapping Cultural Participation in Chicago - Cultural Policy Center
Mapping Cultural Participation in Chicago - Cultural Policy Center
Mapping Cultural Participation in Chicago - Cultural Policy Center

You also want an ePaper? Increase the reach of your titles
YUMPU automatically turns print PDFs into web optimized ePapers that Google loves.
<strong>Mapp<strong>in</strong>g</strong> <strong>Cultural</strong> <strong>Participation</strong> <strong>in</strong> <strong>Chicago</strong>Robert LaLonde Colm O’Muircheartaigh Julia Perk<strong>in</strong>swith Diane Grams Ned English and D. Carroll Joynes<strong>Cultural</strong> <strong>Policy</strong> <strong>Center</strong> at the University of <strong>Chicago</strong> | The Irv<strong>in</strong>g B. Harris Graduate School of Public <strong>Policy</strong> Studies
<strong>Mapp<strong>in</strong>g</strong><strong>Cultural</strong> <strong>Participation</strong><strong>in</strong> <strong>Chicago</strong>Robert LaLondeColm O’MuircheartaighJulia Perk<strong>in</strong>swith Diane GramsNed English andD. Carroll Joynes<strong>Cultural</strong> <strong>Policy</strong> <strong>Center</strong>at the University of <strong>Chicago</strong>The Irv<strong>in</strong>g B. Harris Graduate Schoolof Public <strong>Policy</strong> Studies
Copyright © 2006 The University of <strong>Chicago</strong>, <strong>Cultural</strong> <strong>Policy</strong> <strong>Center</strong>Pr<strong>in</strong>ted <strong>in</strong> the United StatesISBN 0-9747047-2-5The maps conta<strong>in</strong>ed <strong>in</strong> this report were produced by theNational Op<strong>in</strong>ion Research <strong>Center</strong> (NORC).For more <strong>in</strong>formation or for copies of this book contact:The <strong>Cultural</strong> <strong>Policy</strong> <strong>Center</strong> at the University of <strong>Chicago</strong>The Irv<strong>in</strong>g B. Harris Graduate School of Public <strong>Policy</strong> Studies1155 East 60th Street, Suite 285<strong>Chicago</strong>, Ill<strong>in</strong>ois 60637-2745Phone: (773) 702-4407Fax: (773) 702-0926Email: culturalpolicy@uchicago.edu<strong>Cultural</strong> <strong>Policy</strong> <strong>Center</strong> website: http://culturalpolicy.uchicago.eduHarris School website: http://harrisschool.uchicago.eduA jo<strong>in</strong>t <strong>in</strong>itiative of the Harris School of Public <strong>Policy</strong> Studies and the Division ofthe Humanities, the <strong>Cultural</strong> <strong>Policy</strong> <strong>Center</strong> is a nationally recognized leader <strong>in</strong>the emerg<strong>in</strong>g field of cultural policy research and education. Its mission is toprovide research and <strong>in</strong>form policy that affects the arts, humanities, and culturalheritage. It serves as an <strong>in</strong>cubator for new ways of understand<strong>in</strong>g what the artsand culture are, as well as what they do and how they can be affected by a rangeof policies <strong>in</strong> the public and private sectors.This project was supported through a grant from the Joyce Foundation.The research and conclusions expressed here<strong>in</strong> are the work of the researchersat the <strong>Cultural</strong> <strong>Policy</strong> <strong>Center</strong> and do not necessarily represent the views ofthe Joyce Foundation.Graphic Design:Kym Abrams DesignCather<strong>in</strong>e Lange Communications
IllustrationsMapsMap 1 <strong>Chicago</strong> Metropolitan Statistical Area (MSA)............................................. 14Map 2 Cook County by Township...................................................................... 15Map 3 City of <strong>Chicago</strong> by Community Area........................................................ 16Map 4 City of <strong>Chicago</strong> by Census Tract............................................................. 18Map 5Density of Households Participat<strong>in</strong>g <strong>in</strong> Larger <strong>Cultural</strong> Institutions:<strong>Chicago</strong> MSA by Township and Census Tract............................................. 23Map 6Density of Households Participat<strong>in</strong>g <strong>in</strong> Larger <strong>Cultural</strong> Institutions:Cook County by Township and Census Tract.............................................. 25Map 7Density of Households Participat<strong>in</strong>g <strong>in</strong> Larger <strong>Cultural</strong> Institutions:City of <strong>Chicago</strong> by Community Area......................................................... 26Map 8Density of Households Participat<strong>in</strong>g <strong>in</strong> Larger <strong>Cultural</strong> Institutions:City of <strong>Chicago</strong> by Census Tract.............................................................. 28Map 8aDensity of Households Participat<strong>in</strong>g <strong>in</strong> Larger <strong>Cultural</strong> Institutions:City of <strong>Chicago</strong> by Census Tract, Detail of Near North Side.......................... 29Map 8bDensity of Households Participat<strong>in</strong>g <strong>in</strong> Larger <strong>Cultural</strong> Institutions:City of <strong>Chicago</strong> by Census Tract, Detail of Beverly and Morgan Park............. 29Map 8cDensity of Households Participat<strong>in</strong>g <strong>in</strong> Larger <strong>Cultural</strong> Institutions:City of <strong>Chicago</strong> by Census Tract, Detail of Hyde Park and Kenwood.............. 29Map 9a African-American Population Density: City of <strong>Chicago</strong> by Census Tract......... 31Map 9b Lat<strong>in</strong>o Population Density: City of <strong>Chicago</strong> by Census Tract......................... 32Map 10Comb<strong>in</strong>ed Population Density of African-Americans and Lat<strong>in</strong>os:City of <strong>Chicago</strong> by Census Tract.............................................................. 33Map 11 Median Household Income: City of <strong>Chicago</strong> by Census Tract........................ 35Map 12Density of Bachelor’s Degrees among Adult Population:City of <strong>Chicago</strong> by Census Tract.............................................................. 36Map 13Predicted Density of Households Participat<strong>in</strong>g <strong>in</strong> Larger <strong>Cultural</strong> Institutions:City of <strong>Chicago</strong> by Census Tract.............................................................. 39Map 14Unexpected Deviations from Predicted Density of HouseholdsParticipat<strong>in</strong>g <strong>in</strong> Larger <strong>Cultural</strong> Institutions:City of <strong>Chicago</strong> by Census Tract.............................................................. 402
Map 15a Density of Households Participat<strong>in</strong>g <strong>in</strong> Sampled Diverse Institutions:City of <strong>Chicago</strong> by Census Tract.............................................................. 43Map 15b Density of Households Participat<strong>in</strong>g <strong>in</strong> Sampled Ethnic Institutions:City of <strong>Chicago</strong> by Census Tract.............................................................. 44Map 15c Density of Households Participat<strong>in</strong>g <strong>in</strong> Sampled Other <strong>Cultural</strong>Institutions: City of <strong>Chicago</strong> by Census Tract............................................. 45Map 16Density of Households Participat<strong>in</strong>g <strong>in</strong> Sampled DiverseInstitutions, but not <strong>in</strong> Larger <strong>Cultural</strong> Institutions:City of <strong>Chicago</strong> by Census Tract.............................................................. 47Map 17Density of Households Participat<strong>in</strong>g <strong>in</strong> Sampled EthnicInstitutions, but not <strong>in</strong> Larger <strong>Cultural</strong> Institutions:City of <strong>Chicago</strong> by Census Tract.............................................................. 48Map 18Density of Households Participat<strong>in</strong>g <strong>in</strong> Sampled OtherInstitutions, but not <strong>in</strong> Larger <strong>Cultural</strong> Institutions:City of <strong>Chicago</strong> by Census Tract.............................................................. 49TablesTable 1<strong>Participation</strong> Overlap between Diverse Institutions andLarger <strong>Cultural</strong> Institutions.................................................................... 46Table 2<strong>Participation</strong> Overlap between Ethnic Institutions andLarger <strong>Cultural</strong> Institutions.................................................................... 46Table 3<strong>Participation</strong> Overlap between Other Institutionsand Larger <strong>Cultural</strong> Institutions.............................................................. 503
<strong>Mapp<strong>in</strong>g</strong> <strong>Cultural</strong> <strong>Participation</strong> <strong>in</strong> <strong>Chicago</strong>4
ForewordMany studies claim to ‘map’ the terra<strong>in</strong> of the cultural landscape. However, never beforehave actual maps of an entire major U.S. metropolitan area been produced to exam<strong>in</strong>eand understand cultural participation. Never before have so many arts organizationscome together, collaboratively shar<strong>in</strong>g one of their most valuable resources—theirorganizational databases—to improve our collective knowledge of our city, its culturalorganizations, and the people who visit, participate <strong>in</strong>, and support them.The goal of our research was simple—to establish basel<strong>in</strong>e measures for culturalparticipation <strong>in</strong> nonprofit arts organizations <strong>in</strong> the <strong>Chicago</strong> metropolitan area. With suchmeasures <strong>in</strong> hand, cultural <strong>in</strong>stitutions, foundations, and policymakers <strong>in</strong> <strong>Chicago</strong> andbeyond could better understand the effectiveness of future efforts designed to builddiverse audiences for their wide-rang<strong>in</strong>g cultural activities.Our focus was the nonprofit arts and cultural organizations located with<strong>in</strong> the <strong>Chicago</strong>metropolitan area <strong>in</strong> Ill<strong>in</strong>ois. To establish this basel<strong>in</strong>e measure, we <strong>in</strong>vited all 508 artsorganizations listed as 501(c)(3) nonprofits to participate <strong>in</strong> this study.Sixty-one organizations shared their organizational databases with the research teamassembled by the <strong>Cultural</strong> <strong>Policy</strong> <strong>Center</strong> at the University of <strong>Chicago</strong>. This large-scalecollaboration resulted <strong>in</strong> a s<strong>in</strong>gle database of 1.4 million addresses. With the help ofexperts from the Irv<strong>in</strong>g B. Harris Graduate School of Public <strong>Policy</strong> Studies and theNational Op<strong>in</strong>ion Research <strong>Center</strong> (NORC), these data were analyzed aga<strong>in</strong>st censusdata and mapped to better understand the characteristics of participants.This collaborative effort has led <strong>Chicago</strong> to be the first city <strong>in</strong> the United Statesto have actual maps of its landscape of cultural participation.We hope that the organizations who shared their valuable <strong>in</strong>formation with us f<strong>in</strong>d thisstudy useful. These data enabled us to pa<strong>in</strong>t a picture of the terra<strong>in</strong> <strong>in</strong> the arts todayand to place their organizations with<strong>in</strong> this terra<strong>in</strong>. It is our aspiration that our support<strong>in</strong>gfoundation, these organizations, and other arts organizations and foundations willuse these maps <strong>in</strong> their plann<strong>in</strong>g, audience development, and budget<strong>in</strong>g, so thatunderparticipat<strong>in</strong>g groups and areas might be the focus of greater organizational andprogrammatic emphasis.Beyond such direct uses, we hope that the study will be helpful to other metropolitanareas, not only by provid<strong>in</strong>g generalized f<strong>in</strong>d<strong>in</strong>gs that can serve as a basis of comparison,but also by suggest<strong>in</strong>g a methodological model to guide local efforts to understand artsparticipation patterns.5
<strong>Mapp<strong>in</strong>g</strong> <strong>Cultural</strong> <strong>Participation</strong> <strong>in</strong> <strong>Chicago</strong>6
AcknowledgmentsWe thank the Joyce Foundation for its f<strong>in</strong>ancial support of this research and <strong>in</strong>dividualstaff members for shar<strong>in</strong>g their expertise throughout the research process. Specifically,we thank Ellen Alberd<strong>in</strong>g, foundation president; Michelle Boone, culture program officer;and Reg<strong>in</strong>ald Jones, former program officer at Joyce, now executive director of the SteansFamily Foundation.We thank Julia Perk<strong>in</strong>s, pr<strong>in</strong>cipal of MBMD Consultants and a core member of the team.She worked as the <strong>Center</strong>’s community fellow, and her tireless efforts drove this projectthrough to its completion.We thank the University of <strong>Chicago</strong>, the Irv<strong>in</strong>g B. Harris Graduate School of Public<strong>Policy</strong> Studies, and the National Op<strong>in</strong>ion Research <strong>Center</strong> (NORC). We want to giveparticular thanks to Robert LaLonde, faculty member at the Harris School, and ColmO’Muircheartaigh, vice president at NORC and a faculty member at the Harris School. Weare <strong>in</strong>debted to the hard work and patience of Ned English, survey methodologist atNORC, who not only produced the maps <strong>in</strong>cluded <strong>in</strong> this report, but also generated scoresof others. Their expertise led the analysis and conclusions we identify here. This studywould not have been possible without access to resources available through the universityenvironment.The current and former staff at the <strong>Cultural</strong> <strong>Policy</strong> <strong>Center</strong> played important rolesthroughout the two-year project. We thank D. Carroll Joynes, executive director, andLawrence Rothfield, faculty director, for their project oversight and support; researchassociate Diane Grams, whose project management kept the large volume of data secureand <strong>in</strong>tact; and Wendy Norris, who began as a graduate research assistant and ended uplead<strong>in</strong>g the f<strong>in</strong>al edit<strong>in</strong>g and communications efforts. We also thank Katie Claussen,public events coord<strong>in</strong>ator; Michael Washburn and Kimberly McCullough, former assistantdirectors for communications; and Stefanie White, former assistant director for public<strong>in</strong>formation.We would also like to thank the follow<strong>in</strong>g University of <strong>Chicago</strong> graduate andundergraduate research assistants for their dedication and hard work: Isabel Anadon,Erica Coslor, Evan Druce, Jessica Feldman, Stephanie Hughes, Ofurhe Igb<strong>in</strong>edion, Ala<strong>in</strong>aJas<strong>in</strong>evicius, Sarah Lawrence, Christ<strong>in</strong>a Le, Emily Lehrer, Helen Li, Jeremy Mallory, EmilyO’Neill, and Rosemary Polanco. Their support, time, and analytical m<strong>in</strong>ds were importantcontributions to this project.We also thank our edit<strong>in</strong>g consultant John Whitman, whose skills transformed the ideasand labor of many <strong>in</strong>to a uniform text.F<strong>in</strong>ally, we thank the sixty-one organizations whose staff provided us with theirorganizational data. Without their <strong>in</strong>volvement and trust, this project would not havebeen possible.—The <strong>Cultural</strong> <strong>Policy</strong> <strong>Center</strong> at the University of <strong>Chicago</strong>7
<strong>Mapp<strong>in</strong>g</strong> <strong>Cultural</strong> <strong>Participation</strong> <strong>in</strong> <strong>Chicago</strong>8
ExecutiveSummaryIn early 2003, the Joyce Foundation and the University of <strong>Chicago</strong>’s <strong>Cultural</strong> <strong>Policy</strong> <strong>Center</strong>began discussions on the need to measure arts participation <strong>in</strong> the <strong>Chicago</strong>land area.At that time, there were no reliable basel<strong>in</strong>e data to serve as a benchmark of audienceparticipation.<strong>Mapp<strong>in</strong>g</strong> <strong>Cultural</strong> <strong>Participation</strong> <strong>in</strong> <strong>Chicago</strong> provides this basel<strong>in</strong>e formeasur<strong>in</strong>g arts participation.The study also addresses several critical questions about <strong>Chicago</strong>’s arts audiences:• What is the current m<strong>in</strong>ority participation <strong>in</strong> <strong>Chicago</strong>’s twelve largest cultural<strong>in</strong>stitutions?• Can differences <strong>in</strong> participation by race and ethnicity be accounted for by other factors,such as household <strong>in</strong>come, household structure, and educational atta<strong>in</strong>ment?• How do participation patterns <strong>in</strong> the larger organizations compare to participationpatterns <strong>in</strong> smaller, more localized, diverse and ethnically specific organizations?The study analyzes more than one million records from sixty-one arts andculture organizations, represent<strong>in</strong>g almost six hundred thousand households.The data are built from the records of the cultural <strong>in</strong>stitutions. Each <strong>in</strong>dividual-level pieceof data is an adm<strong>in</strong>istrative record of a transaction between the <strong>in</strong>stitution and an <strong>in</strong>dividualor household. The core data are those from the twelve largest not-for-profit cultural<strong>in</strong>stitutions <strong>in</strong> <strong>Chicago</strong>, supplemented by a sample of forty-n<strong>in</strong>e smaller <strong>in</strong>stitutions. Thegenerosity of our partner<strong>in</strong>g <strong>in</strong>stitutions <strong>in</strong> shar<strong>in</strong>g their data deserves special recognition.We f<strong>in</strong>d that participation <strong>in</strong> <strong>Chicago</strong>’s largest arts and cultural organizations ishighest <strong>in</strong> predom<strong>in</strong>antly white, high-<strong>in</strong>come areas of the metropolitan area.In these areas, roughly one household <strong>in</strong> two participates <strong>in</strong> some way <strong>in</strong> the city’s largestarts organizations. By contrast, participation rates are low throughout much of the restof the metropolitan area. They are consistently lowest <strong>in</strong> areas with large percentages ofAfrican-American or Lat<strong>in</strong>o households.However, there are also many predom<strong>in</strong>antly white areas, regardless of <strong>in</strong>come,that are not significantly engaged with <strong>Chicago</strong>’s largest arts organizations.In all of these low participation areas, roughly one household <strong>in</strong> twenty participates <strong>in</strong> thecity’s large organizations.The socioeconomic attributes of a neighborhood are the most importantpredictors of the density of arts participation.Attributes of a neighborhood, such as its median household <strong>in</strong>come, the percentageof residents with bachelor’s or master’s degrees, household structure, and the age ofresidents can expla<strong>in</strong> much, although not all, of the variation <strong>in</strong> arts participationdensities across <strong>Chicago</strong>.Thus ethnicity represents only a part of the picture.The socioeconomic characteristics are much stronger predictors of who does and doesnot participate <strong>in</strong> these organizations.9
<strong>Mapp<strong>in</strong>g</strong> <strong>Cultural</strong> <strong>Participation</strong> <strong>in</strong> <strong>Chicago</strong>Even after we account for a neighborhood’s socioeconomic characteristics,its ethnic composition still is a predictor of participation <strong>in</strong> the area’slargest arts organizations.When we compare predom<strong>in</strong>antly white, Lat<strong>in</strong>o, and African-American communitieswith similar socioeconomic characteristics, we f<strong>in</strong>d that rates of participation with largeorganizations tend to be lower <strong>in</strong> predom<strong>in</strong>antly African-American communities than <strong>in</strong>predom<strong>in</strong>antly Lat<strong>in</strong>o or white areas. However, this is not systematically the case: we canidentify some predom<strong>in</strong>antly African-American areas <strong>in</strong> which arts participation is muchhigher than expected.There is no earlier benchmark with which to compare the current situation.Thus, we cannot address whether progress is be<strong>in</strong>g made. Indeed, a major purpose of thisstudy is to provide that basel<strong>in</strong>e for future studies. Currently, however, <strong>Chicago</strong>’s largearts organizations appear not to be successfully engag<strong>in</strong>g households <strong>in</strong> areas with poorsocioeconomic backgrounds. This f<strong>in</strong>d<strong>in</strong>g suggests that to engage such households, theseorganizations may have to reassess their audience development practices, which could<strong>in</strong>clude pric<strong>in</strong>g structure, type of services, program delivery, and hours of operations,along with conduct<strong>in</strong>g further research on the barriers and motivations for audienceparticipation.Ethnic, diverse, and other smaller arts organizations successfully reacha different audience.Not only do the diverse and ethnic <strong>in</strong>stitutions tap a different population, but theiraudiences are relatively unengaged with the larger <strong>in</strong>stitutions. This f<strong>in</strong>d<strong>in</strong>g holdsespecially true for the smaller organizations whose missions target particular ethnicand diverse audiences.There are still significant gaps <strong>in</strong> our knowledge of participation.Despite our request<strong>in</strong>g data from <strong>Chicago</strong>’s 496 small and medium-size arts and cultureorganizations, only forty-n<strong>in</strong>e provided data for this study.• This did not allow us to create a representative sample of small and medium-sizeorganizations from which to draw conclusions.• Furthermore, our data do not reflect the participation of schools and community groupswith arts organizations because these data are not tracked on a systematic basis.To improve our understand<strong>in</strong>g of audience participation <strong>in</strong> <strong>Chicago</strong>’s arts and culturalorganizations, we recommend that these organizations, along with the arts community,work together to develop a more uniform system for collect<strong>in</strong>g <strong>in</strong>formation about theirparticipants. It appears that many smaller organizations may require some assistance <strong>in</strong>this regard if we are to establish a more reliable basel<strong>in</strong>e of participation patterns <strong>in</strong> theiractivities. Many of the area’s largest organizations already have relatively sophisticatedsystems for record<strong>in</strong>g audience participation. However, even their <strong>in</strong>formation hasimportant gaps. Most need to develop a system to collect <strong>in</strong>formation on school andcommunity groups that participate <strong>in</strong> their activities. Many of the large museums do notsystematically collect and ma<strong>in</strong>ta<strong>in</strong> <strong>in</strong>formation on their visitors. We propose that the artsand culture community <strong>in</strong> <strong>Chicago</strong> address these and related issues prior to futureresearch, studies, and evaluations of audience participation.10 Executive Summary
Introduction<strong>Chicago</strong>’s cultural <strong>in</strong>stitutions are a vital force <strong>in</strong> the life of our communities.In early 2003, the Joyce Foundation approached the <strong>Cultural</strong> <strong>Policy</strong> <strong>Center</strong> to discusshow to assess the impact of efforts by the city’s largest cultural <strong>in</strong>stitutions to broadentheir African-American and Lat<strong>in</strong>o audience base. However, to identify and understandchange it is first necessary to establish a basel<strong>in</strong>e measure. While other research hasbeen conducted on this topic, not until now has a basel<strong>in</strong>e measure been available. Thisproject was designed to be a first step <strong>in</strong> address<strong>in</strong>g this <strong>in</strong>formation gap.The <strong>in</strong>itial focus of the project was on participation of African-American and Lat<strong>in</strong>ocommunities <strong>in</strong> <strong>Chicago</strong>’s largest not-for-profit cultural <strong>in</strong>stitutions. We began byconsider<strong>in</strong>g only these large <strong>in</strong>stitutions, of which we identified twelve <strong>in</strong> our dataset,each with annual revenue <strong>in</strong> excess of $8 million. We then focused on participation <strong>in</strong>smaller and more specifically targeted <strong>in</strong>stitutions to determ<strong>in</strong>e whether they engageda different population than the large <strong>in</strong>stitutions.Initial discussions with a limited set of <strong>in</strong>stitutions revealed that there was little systematiccollection or analysis of data on participants; nor was there any uniform method ofdisplay<strong>in</strong>g or analyz<strong>in</strong>g the data. Thus, there was no available measure of the actualsociodemographic distribution of participants, whether from the overall population orfrom specific demographic groups.This project is a pioneer<strong>in</strong>g effort to gather and pool data that is <strong>in</strong>dependentlycollected by diverse cultural <strong>in</strong>stitutions.The generosity of our partner<strong>in</strong>g <strong>in</strong>stitutions <strong>in</strong> shar<strong>in</strong>g their data deserves specialrecognition. Their support was <strong>in</strong>valuable. By analyz<strong>in</strong>g and present<strong>in</strong>g the pooled datawe provide a resource that is of value to all. The participat<strong>in</strong>g <strong>in</strong>stitutions are providedwith their own <strong>in</strong>dividual maps, show<strong>in</strong>g the distribution of their participants. Thoughwe could not hope to collect data from all <strong>Chicago</strong> <strong>in</strong>stitutions, collect<strong>in</strong>g data from across-section of <strong>in</strong>stitutions provides not only a solid basis for <strong>in</strong>ference, but identifiesthe problems to be faced <strong>in</strong> mount<strong>in</strong>g a more comprehensive data collection <strong>in</strong> the future.The data are built from the records of the cultural <strong>in</strong>stitutions.Each <strong>in</strong>dividual-level piece of data is an adm<strong>in</strong>istrative record of a transaction betweenthe <strong>in</strong>stitution and an <strong>in</strong>dividual or household. The core data are those from almost allof the larger not-for-profit cultural <strong>in</strong>stitutions <strong>in</strong> <strong>Chicago</strong>, supplemented by a sample ofsmaller <strong>in</strong>stitutions.We use technology that is widely applied <strong>in</strong> plann<strong>in</strong>g and market<strong>in</strong>g to convert these datato useful <strong>in</strong>formation. The address of each transaction is geocoded, mean<strong>in</strong>g it is given aprecise geographical location on a map. This geocode provides a l<strong>in</strong>k with other datasources, <strong>in</strong> particular, data from the U.S. 2000 Census, which allows us to describe <strong>in</strong> richdetail the characteristics of the area or neighborhood <strong>in</strong> which the address is located. Inl<strong>in</strong>k<strong>in</strong>g participation to socioeconomic factors and to race and ethnicity, we use thesummary characteristics of the geographical units based on the 2000 Census of population.The primary objective of this study is to further the dialogue <strong>in</strong> describ<strong>in</strong>g artsparticipation with<strong>in</strong> the city’s cultural landscape.11
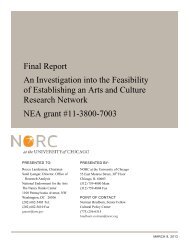
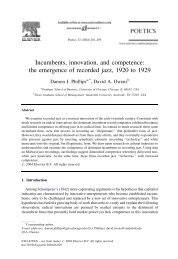
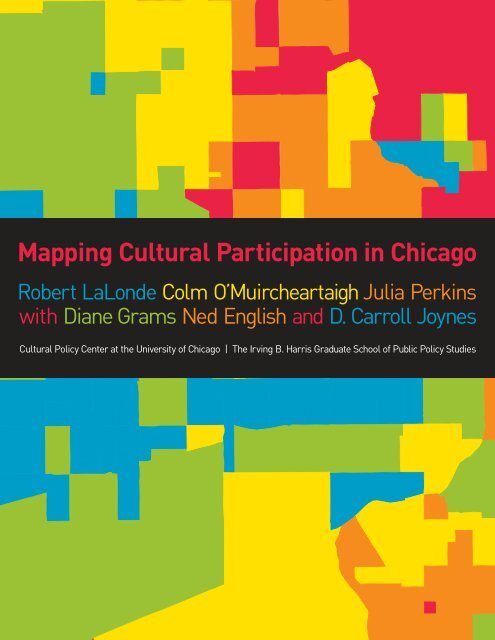
<strong>Mapp<strong>in</strong>g</strong> <strong>Cultural</strong> <strong>Participation</strong> <strong>in</strong> <strong>Chicago</strong>The primary form of presentation is through maps that display the relative density ofparticipation across the <strong>Chicago</strong>land area. The largest area we consider is the Censusdef<strong>in</strong>ed<strong>Chicago</strong> metropolitan statistical area (MSA) shown <strong>in</strong> Map 1. The MSA conta<strong>in</strong>sfourteen counties, extend<strong>in</strong>g north to Kenosha, Wiscons<strong>in</strong>, and south to Grundy and WillCounties <strong>in</strong> Ill<strong>in</strong>ois and Jasper and Newton Counties <strong>in</strong> Indiana. It also extends fromLake Michigan <strong>in</strong> the east to DeKalb County <strong>in</strong> the west. Map 2 details the townships andcommunity areas with<strong>in</strong> Cook County. Map 3 shows the seventy-seven community areasof the City of <strong>Chicago</strong>. Map 4 shows the more detailed subdivision <strong>in</strong>to census tracts;each census tract conta<strong>in</strong>s about one thousand to two thousand households.<strong>Mapp<strong>in</strong>g</strong> <strong>Cultural</strong> <strong>Participation</strong> <strong>in</strong> <strong>Chicago</strong> is divided <strong>in</strong>to five ma<strong>in</strong> sections.First, we produce a set of maps for arts <strong>in</strong>stitutions with annual revenues of $8 millionand above that presents the relative density of cultural participation across the area.This first set (Maps 5–8) illum<strong>in</strong>ates the conventional wisdom about the distribution ofparticipation. These maps do not expla<strong>in</strong> the variation; they merely demonstrate it.Second, we map <strong>Chicago</strong>’s African-American and Lat<strong>in</strong>o populations (Maps 9–10) andcompare their distributions to the density of cultural participation as shown <strong>in</strong> Map 8.This comparison reveals important variations <strong>in</strong> participation patterns.Third, we build an explanatory model to predict and expla<strong>in</strong> the variation <strong>in</strong> terms of thesocioeconomic characteristics of the areas (Maps 11–14). Us<strong>in</strong>g the model, we producea new set of maps that shows how much of the variation <strong>in</strong> activity can be expla<strong>in</strong>ed byvariation <strong>in</strong> the socioeconomic and demographic nature of the areas. Essentially, thisthird stage can be thought of as compar<strong>in</strong>g the distribution of participation with thedistributions of economic resources and demand, as represented by factors such as<strong>in</strong>come, education, and family composition. The expected pattern of participation <strong>in</strong> anarea is def<strong>in</strong>ed as the level that would be predicted by the socioeconomic characteristicsof the area. This third stage shows a very different picture from the first. Here we are<strong>in</strong>terested <strong>in</strong> the extent to which the socioeconomic model fails to expla<strong>in</strong> the variabilityand variation <strong>in</strong> arts participation among communities <strong>in</strong> the <strong>Chicago</strong> area.Fourth, we look separately at three categories of smaller <strong>in</strong>stitutions: those with amission explicitly target<strong>in</strong>g a diverse community (Maps 15a and 16); those with amission directed at a particular ethnicity (Maps 15b and 17); and f<strong>in</strong>ally, other smaller<strong>in</strong>stitutions (Maps 15c and 18). We contrast the patterns of arts participation amongthese <strong>in</strong>stitutions with the patterns for the larger <strong>in</strong>stitutions.In the f<strong>in</strong>al section of the report, we summarize our f<strong>in</strong>d<strong>in</strong>gs, present our conclusions,and offer an agenda for future work.12 Introduction
The <strong>Chicago</strong>Context<strong>Chicago</strong> has one of the country’s most diverse populations and is one of thenation’s most vibrant and diverse culture and arts environments.<strong>Chicago</strong> is the third largest metropolitan area <strong>in</strong> the United States beh<strong>in</strong>d New Yorkand Los Angeles. <strong>Chicago</strong>’s arts and culture community serves the city’s seventy-sevencommunity areas of almost three million people and the entire metropolitan statisticalarea (MSA) of n<strong>in</strong>e million. The characteristics of <strong>Chicago</strong>’s residents and its <strong>in</strong>stitutionsdemonstrate the diversity of the social, economic, and cultural resources of the entiremetropolitan area.The City of <strong>Chicago</strong>’s population is roughly evenly divided among African-Americans(36 percent), Caucasians (31 percent), and Lat<strong>in</strong>os (26 percent). The other races makeup the rema<strong>in</strong><strong>in</strong>g 7 percent of the city’s population. Outside of the city, much smallerpercentages of the population are either African-American or Lat<strong>in</strong>o. As a result, forthe <strong>Chicago</strong> metropolitan area 18 percent of the population is African-American and16 percent is Lat<strong>in</strong>o.Although the <strong>Chicago</strong> area’s Lat<strong>in</strong>o population comes from many parts of the WesternHemisphere, the vast majority report either hav<strong>in</strong>g immigrated from Mexico or be<strong>in</strong>gof Mexican ancestry. Approximately 70 percent of the city’s Lat<strong>in</strong>o population ofapproximately three-quarters of a million persons is of Mexican descent. Fifteen percentreport be<strong>in</strong>g from Puerto Rico or of Puerto Rican ancestry. The rema<strong>in</strong><strong>in</strong>g 15 percentreport ancestry from Spanish-speak<strong>in</strong>g countries throughout the Caribbean and Centraland South America. In the rest of the metropolitan area outside of the City of <strong>Chicago</strong>, aneven larger percentage of Lat<strong>in</strong>os report that they are Mexican or of Mexican orig<strong>in</strong>.The median household <strong>in</strong>come for the City of <strong>Chicago</strong> is substantially less ($38,625) thanthe <strong>Chicago</strong> MSA ($51,046). Furthermore, the metropolitan area has three to four timesmore middle <strong>in</strong>come and wealthy households than the City of <strong>Chicago</strong>.In the city, 25 percent of <strong>Chicago</strong>’s population holds a bachelor’s degree or higher, while<strong>in</strong> the metropolitan statistical area, the figure is 29 percent.Def<strong>in</strong>itions and Maps of <strong>Chicago</strong>• The <strong>Chicago</strong> MSA is the fourteen-county area shown <strong>in</strong> Map 1; the population of theMSA is about n<strong>in</strong>e million.• Just over five million of the people <strong>in</strong> the <strong>Chicago</strong> MSA live <strong>in</strong> Cook County, which isdivided <strong>in</strong>to townships and community areas, as shown <strong>in</strong> Map 2.• The City of <strong>Chicago</strong>, with a population of nearly three million, is shown <strong>in</strong> Map 3.With<strong>in</strong> the city, the boundaries of the seventy-seven community areas are shown.The populations of community areas range from 3,000 to 117,500.• Map 4 shows the boundaries of the 865 census tracts <strong>in</strong> the City of <strong>Chicago</strong>. Mosttracts have populations of about 2,000 to 5,000, with 1,000 to 2,000 households <strong>in</strong> each.13
CookCookCookCookCookCookCookCookCookDeKalbDeKalbDeKalbDeKalbDeKalbDeKalbDeKalbDeKalbDeKalbDuPageDuPageDuPageDuPageDuPageDuPageDuPageDuPageDuPageGrundyGrundyGrundyGrundyGrundyGrundyGrundyGrundyGrundyKaneKaneKaneKaneKaneKaneKaneKaneKaneKendallKendallKendallKendallKendallKendallKendallKendallKendallLakeLakeLakeLakeLakeLakeLakeLakeLakeMcHenryMcHenryMcHenryMcHenryMcHenryMcHenryMcHenryMcHenryMcHenryWillWillWillWillWillWillWillWillWillJasperJasperJasperJasperJasperJasperJasperJasperJasperLakeLakeLakeLakeLakeLakeLakeLakeLakeNewtonNewtonNewtonNewtonNewtonNewtonNewtonNewtonNewtonPorterPorterPorterPorterPorterPorterPorterPorterPorterKenoshaKenoshaKenoshaKenoshaKenoshaKenoshaKenoshaKenoshaKenoshaLake Michigan1<strong>Chicago</strong> Metropolitan Statistical Area (MSA)
Barr<strong>in</strong>gtonPalat<strong>in</strong>eWheel<strong>in</strong>gNorthfieldNew TrierHanoverSchaumburgElk GroveMa<strong>in</strong>eNilesEvanstonLake MichiganNorwood ParkLeydenRiver ForestOak ParkProvisoBerwynRiversideCiceroLyonsStickneyWorthLemontPalosCalumetOrlandBremenThornton2Cook County by TownshipRichBloom
53535353535353535354545454545454545449494949494949494975757575757575757572727272727272727260606060606060606031313131313131313137873737373737373737343434343434343434346464646464646464645454545454545454542424242424242424252525252525252525255555555555555555516242424242424242424282828282828282828323232323232323232333333333333333333343434343434343434353535353535353535363636363636363636373737373737373737383838383838383838393939393939393939404040404040404040414141414141414141444444444444444444474747474747474747 484848484848484848505050505050505050515151515151515151595959595959595959616161616161616161676767676767676767 686868686868686868696969696969696969717171717171717171777777777777777777565656565656565656646464646464646464535353535353535353545454545454545454494949494949494949757575757575757575727272727272727272747474747474747474606060606060606060313131313131313131537873737373737373737362626262626262626249101010101010101010252525252525252525434343434343434343464646464646464646454545454545454545424242424242424242525252525252525252555555555555555555121212121212121212202020202020202020126111111111111111111131313131313131313141414141414141414151515151515151515 161616161616161616171717171717171717181818181818181818 191919191919191919212121212121212121222222222222222222232323232323232323 242424242424242424262626262626262626 272727272727272727282828282828282828292929292929292929303030303030303030323232323232323232333333333333333333343434343434343434353535353535353535363636363636363636373737373737373737383838383838383838393939393939393939404040404040404040414141414141414141444444444444444444474747474747474747 484848484848484848505050505050505050515151515151515151575757575757575757585858585858585858595959595959595959616161616161616161636363636363636363656565656565656565666666666666666666676767676767676767 6868686868686868686969696969696969697070707070707070707171717171717171717777777777777777777676767676767676763City of <strong>Chicago</strong> by Community AreaLake Michigan
Characteristics of <strong>Cultural</strong> InstitutionsIn addition to its well-known major museums, perform<strong>in</strong>g groups, and culturalattractions, <strong>Chicago</strong>’s metropolitan region with<strong>in</strong> Ill<strong>in</strong>ois is home to 508 arts and cultural<strong>in</strong>stitutions. 1 This arts and cultural landscape offers audiences a range of experiencesthat <strong>in</strong>clude theater, arts education, ballet, contemporary dance, opera, choral music,symphonic music, museums, contemporary music, media arts, literature, and visual arts.<strong>Chicago</strong> is a major center for theater and the perform<strong>in</strong>g arts, with more than half of the508 <strong>in</strong>stitutions <strong>in</strong> the MSA identified as perform<strong>in</strong>g arts organizations.Just as diverse as the range of cultural experiences available are the sizes and ages ofthe <strong>in</strong>stitutions that provide them. A recent survey conducted by the <strong>Chicago</strong> CommunityTrust and Affiliates revealed that the budgets of <strong>Chicago</strong>’s nonprofit arts and culturalorganizations vary from less than $150,000 to more than $10 million. Just twelve ofthese organizations have budgets <strong>in</strong> excess of $8 million per year. By contrast, there arehundreds of small to medium-size organizations with fewer staff and lower budgets.Accord<strong>in</strong>g to a study commissioned by the Ill<strong>in</strong>ois Arts Alliance (Grams 2005), 69 percentof arts organizations <strong>in</strong> the <strong>Chicago</strong> MSA have budgets less than $250,000. Statewide,most arts organizations have fewer than eleven employees, nearly 40 percent do not havefull-time staff, and nearly one-fifth have no paid staff whatsoever.1 This figure is based on a list<strong>in</strong>g for tax year2002–2003 of nonprofit arts and culturalorganizations for the <strong>Chicago</strong> metropolitanstatistical area with<strong>in</strong> Ill<strong>in</strong>ois. This list waspurchased from Guidestar.com and servedas the source of organizations contacted forthis study.Although most of these organizations are small, many are well-established. Accord<strong>in</strong>g to2002 figures from A Survey of <strong>Chicago</strong>’s <strong>Cultural</strong> Landscape, 64 percent of theorganizations surveyed have existed for ten or more years, while 35 percent have existedfor more than twenty-one years (Zehr and Burros 2002). The economic environmentwith<strong>in</strong> the <strong>Chicago</strong> metropolitan area susta<strong>in</strong>s many nonprofit arts <strong>in</strong>stitutions, but mostrema<strong>in</strong> small and community-based.Community Areas (see Map 3)1 Rogers Park21 Avondale41 Hyde Park61 New City2 West Ridge22 Logan Square42 Woodlawn62 West Elsdon3 Uptown23 Humboldt Park43 South Shore63 Gage Park4 L<strong>in</strong>coln Square24 West Town44 Chatham64 Clear<strong>in</strong>g5 North <strong>Center</strong>25 Aust<strong>in</strong>45 Avalon Park65 West Lawn6 Lake View26 West Garfield Park46 South <strong>Chicago</strong>66 <strong>Chicago</strong> Lawn7 L<strong>in</strong>coln Park27 East Garfield Park47 Burnside67 West Englewood8 Near North Side28 Near West Side48 Calumet Heights68 Englewood9 Edison Park29 North Lawndale49 Roseland69 Greater Grand Cross<strong>in</strong>g10 Norwood Park30 South Lawndale50 Pullman70 Ashburn11 Jefferson Park31 Lower West Side51 South Deer<strong>in</strong>g71 Auburn Gresham12 Forest Glen32 Loop52 East Side72 Beverly13 North Park33 Near South Side53 West Pullman73 Wash<strong>in</strong>gton Heights14 Albany Park34 Armour Square54 Riverdale74 Mount Greenwood15 Portage Park35 Douglas55 Hegewisch75 Morgan Park16 Irv<strong>in</strong>g Park36 Oakland56 Garfield Ridge76 O'Hare17 Dunn<strong>in</strong>g37 Fuller Park57 Archer Heights77 Edgewater18 Montclare38 Grand Boulevard58 Brighton Park19 Belmont Crag<strong>in</strong>39 Kenwood59 McK<strong>in</strong>ley Park20 Hermosa40 Wash<strong>in</strong>gton Park60 Bridgeport17
Lake Michigan4City of <strong>Chicago</strong> by Census Tract
Studies of Arts <strong>Participation</strong>Previous studies of arts participation generally fall <strong>in</strong>to four categories: 2• survey research that documents participation rates and patterns for a variety ofpopulations• theoretical frameworks that expla<strong>in</strong> why particular participation patterns exist andwhat their ramifications may be for society as a whole or for <strong>in</strong>dividual participants• exam<strong>in</strong>ations of arts activities <strong>in</strong> specific locales on topics rang<strong>in</strong>g from the reasonsthat artists settle <strong>in</strong> a region, to the effects arts programm<strong>in</strong>g has on a neighborhood,to local audience demographics• studies offer<strong>in</strong>g new methods for <strong>in</strong>creas<strong>in</strong>g audience participationBy contrast, our study is unique <strong>in</strong> several ways. First, we draw our participation datafrom the records of the arts organizations themselves. Second, our analytical emphasisis geographic; the data are used to describe the geographic or spatial distribution ofparticipation. This is particularly relevant <strong>in</strong> <strong>Chicago</strong>, where the unique demographicattributes of a neighborhood have been seen as an important social characteristic.Third, we relate the density of participation to the socioeconomic, racial, and ethniccharacteristics of census tracts. Fourth, we compare and contrast the reach of artsorganizations of different types.2 A list of recommended references isprovided at the end of this report.The <strong>Chicago</strong> Context 19
InformationCollectionInitially, this project focused on the largest not-for-profit cultural <strong>in</strong>stitutionsand a set of localized or specialized <strong>in</strong>stitutions. The objective was to contrastthe audience reach of the larger <strong>in</strong>stitutions with that of more localizedorganizations.In accordance with the orig<strong>in</strong>al scope of the project, we approached forty-oneorganizations. We contacted them <strong>in</strong> person and performed <strong>in</strong>tensive follow-up tomaximize the likelihood of a response. Of the twelve largest <strong>in</strong>stitutions—those withrevenues of $8 million or more—all responded (100 percent). Of the twenty-n<strong>in</strong>e targetedsmaller <strong>in</strong>stitutions, sixteen responded (55 percent).However, <strong>in</strong> order not to exclude any organizations that might wish to participate, webroadened the scope of the data collection to <strong>in</strong>clude a less-<strong>in</strong>tensive recruitment amongas many cultural organizations as possible. We <strong>in</strong>cluded all registered not-for-profit arts,culture, and humanities organizations located <strong>in</strong> the <strong>Chicago</strong> metropolitan area <strong>in</strong> Ill<strong>in</strong>ois. 3These 467 organizations received a written <strong>in</strong>vitation but were not earmarked for <strong>in</strong>tensivefollow-up. Only thirty-three responded. Internal resource constra<strong>in</strong>ts and technologychallenges prevented many organizations from submitt<strong>in</strong>g their data.A full list of respond<strong>in</strong>g <strong>in</strong>stitutions is given <strong>in</strong> Appendix I. As context, we present twomaps <strong>in</strong> Appendix II, one show<strong>in</strong>g the locations of respond<strong>in</strong>g organizations, the othershow<strong>in</strong>g the locations of the eligible organizations that did not respond.Nonrespond<strong>in</strong>g organizations did not affect the analysis of the twelve larger<strong>in</strong>stitutions. However, the large number of nonrespond<strong>in</strong>g organizations doescreate some limitations on conclusions for overall and specific levels ofparticipation.Our conclusions on patterns of participation and the reach of the large organizationsare not affected by the nonrespond<strong>in</strong>g <strong>in</strong>stitutions. Our data do allow us to contrastthe reach of large and small <strong>in</strong>stitutions. However, due to the high number ofnonrespond<strong>in</strong>g organizations, our data do not permit us to reach strong conclusionsabout the overall level of arts participation, whether <strong>in</strong> the entire <strong>Chicago</strong> metropolitanstatistical area or with<strong>in</strong> particular small communities. Significant participation bymembers of a community <strong>in</strong> local or specialized organizations not <strong>in</strong>cluded <strong>in</strong> the studywould crucially affect these estimates.3 Researchers <strong>in</strong>vited an <strong>in</strong>stitution toparticipate <strong>in</strong> the study if it met thesecriteria:• It was classified as an arts, culture, orhumanities organization with<strong>in</strong> theGuidestar cod<strong>in</strong>g system.• It had filed an IRS Form 990 <strong>in</strong> 2003 forfiscal year 2002.• It was located with<strong>in</strong> the <strong>Chicago</strong> MSA <strong>in</strong>Ill<strong>in</strong>ois.We made an exception to these criteria forseveral organizations that were notidentified as arts and culture organizationsby Guidestar, but whose purpose ostensiblyplaced them <strong>in</strong> this group<strong>in</strong>g. These<strong>in</strong>cluded the Art Institute of <strong>Chicago</strong> andorganizations associated with the Universityof <strong>Chicago</strong>. Guidestar codes these asprofessional schools.The DataOur data are built from records provided by the cultural <strong>in</strong>stitutions. We use theserecords, which represent some form of transaction between households and each of thecultural <strong>in</strong>stitutions, as our sample. These records become a proxy for arts participation.Each data po<strong>in</strong>t is an adm<strong>in</strong>istrative record of a transaction between the<strong>in</strong>stitution and an <strong>in</strong>dividual or household.The identify<strong>in</strong>g factor we use is the postal address of the record, which is recorded <strong>in</strong>the membership and mail<strong>in</strong>g lists of the <strong>in</strong>stitutions. The level of detail recorded and thequality of the address <strong>in</strong>formation varies by <strong>in</strong>stitution; considerable data edit<strong>in</strong>g andmanipulation was required to produce a coherent database. The extent to which<strong>in</strong>stitutions record transactions and the type of transactions they record vary widely20
across <strong>in</strong>stitutions, whether for structural or adm<strong>in</strong>istrative reasons. For example, <strong>in</strong><strong>in</strong>stitutions present<strong>in</strong>g the perform<strong>in</strong>g arts, buy<strong>in</strong>g a ticket is the most basic level ofparticipation; <strong>in</strong> museums, it is a museum visit. In both types of <strong>in</strong>stitutions, higher levelsof participation may be <strong>in</strong>dicated by season-ticket hold<strong>in</strong>g, or some form of membership.The basic unit <strong>in</strong> the analysis is geographical, not <strong>in</strong>dividual.Us<strong>in</strong>g databases of census tracts and street addresses, the National Op<strong>in</strong>ion Research<strong>Center</strong> (NORC) at the University of <strong>Chicago</strong> geocoded all addresses <strong>in</strong> our data set; thelocation of each address <strong>in</strong> our files was identified, and the address was mapped onto theappropriate street segment. This analysis makes it possible to produce maps show<strong>in</strong>g thedistribution of activity across the entire <strong>Chicago</strong> MSA and beyond.Furthermore, it makes l<strong>in</strong>kage possible between our records of participation <strong>in</strong> cultural<strong>in</strong>stitutions and data about the community available elsewhere. Our primary source ofexternal data is the 2000 Census, which provides <strong>in</strong>formation, also based on censustracts, on socioeconomic characteristics such as <strong>in</strong>come, education, and householdcomposition, as well as crucial data on race and ethnicity.Though we can l<strong>in</strong>k household addresses <strong>in</strong> the database to specific areas, we need totake <strong>in</strong>to account the size of the population <strong>in</strong> each location to be able to compare andcontrast areas. We choose density of participation as our first measure, where density ismeasured as the proportion of households <strong>in</strong> an area that participate <strong>in</strong> at least one ofthese <strong>in</strong>stitutions. In calculat<strong>in</strong>g levels of participation we use population basel<strong>in</strong>e datafrom the 2000 Census; changes <strong>in</strong> population size and composition s<strong>in</strong>ce 2000 are notreflected <strong>in</strong> our measures. 4From census figures, we know the characteristics of the areas where people live,but we do not know the characteristics of the <strong>in</strong>dividuals or hous<strong>in</strong>g units <strong>in</strong> ourown database.Individual names and identification are removed from the records before we analyzethem, and we have no access to personal characteristics of <strong>in</strong>dividuals or families.A household can appear multiple times <strong>in</strong> the overall database, either because it hasmultiple transactions with a particular organization, or because it has transactions withmany organizations, or both. We measure participation as a household’s <strong>in</strong>volvement withat least one organization. In select<strong>in</strong>g the data po<strong>in</strong>ts for each map, a household isrepresented only once. 54 Look<strong>in</strong>g to the future, the U.S. CensusBureau’s new large-scale national survey,the American Community Survey (ACS),will provide updated <strong>in</strong>formation aboutpopulation size and composition on aroll<strong>in</strong>g basis from 2008 onward.5 A shortcom<strong>in</strong>g of the data is that schoolgroups and other social or civic groups areexcluded. In no case, however, were thosedata available at the level of the <strong>in</strong>dividualparticipant; <strong>in</strong>deed, <strong>in</strong>stitutional recordsof such visits were often not even <strong>in</strong>electronic form.21
<strong>Mapp<strong>in</strong>g</strong> andModel<strong>in</strong>g<strong>Participation</strong> <strong>in</strong> <strong>Chicago</strong>’s Large <strong>Cultural</strong> InstitutionsAll of the city’s arts <strong>in</strong>stitutions play a significant role <strong>in</strong> promot<strong>in</strong>g the vibrancy andrichness of <strong>Chicago</strong>’s cultural landscape. The larger cultural <strong>in</strong>stitutions, however, are avital and extremely visible element of the city’s cultural life on both a local and nationallevel. A major focus of the study is to measure the variation <strong>in</strong> participation <strong>in</strong> these<strong>in</strong>stitutions across the region. This section presents the results of our analysis of therecords of these <strong>in</strong>stitutions.We analyze the data by area. Areas vary greatly <strong>in</strong> terms of the sizes of their populations.Therefore, present<strong>in</strong>g the counts of participat<strong>in</strong>g households would be extremelymislead<strong>in</strong>g.Density of participation is our basic measure.Density is measured as the proportion of households <strong>in</strong> an area that participates. Thusif one area has 2,000 households, and if 1,000 of these households participate <strong>in</strong> the<strong>in</strong>stitutions, the density of participation is one <strong>in</strong> two, or 50 percent; if another area has12,000 households, and if 1,200 of these participate, the density of participation is one <strong>in</strong>ten, or 10 percent. On the maps, the density of participation with<strong>in</strong> an area is <strong>in</strong>dicated bythe color of the area on the map. Colors range from red for the highest density areas, toorange, yellow, and green for mid-density areas, to blue for the lowest density areas.The area designated by each color represents one-fifth of the activity be<strong>in</strong>g described.In other words, of all participat<strong>in</strong>g households <strong>in</strong> the sample, the area designated <strong>in</strong> redrepresents the top 20 percent <strong>in</strong> terms of rates of participation; the area shaded <strong>in</strong> bluerepresents the lowest 20 percent <strong>in</strong> terms of rates of participation.Maps of <strong>Chicago</strong>Maps 5–8 pa<strong>in</strong>t a picture of density of participation at <strong>Chicago</strong>’s twelve largestcultural organizations.6 Consequently, the areas labeled by eachcolor vary somewhat from one map toanother, and areas can have a differentdesignation <strong>in</strong> different maps. For example,Evanston is <strong>in</strong> the top (red) category forthe map of the whole MSA (Map 5), butorange <strong>in</strong> the map that is conf<strong>in</strong>ed to CookCounty (Map 6). It is important to note thatthe value for the arts participation density<strong>in</strong> Evanston does not change between CookCounty and the MSA. What does changeis whether Evanston’s arts participationdensity is high enough, <strong>in</strong> comparison withall of the densities with<strong>in</strong> the geographicarea be<strong>in</strong>g considered, to rank with<strong>in</strong> thetop (red) category (as it does <strong>in</strong> the caseof the whole MSA), or <strong>in</strong> the second highest(orange) category (as <strong>in</strong> the case ofCook County).On the maps, each household recorded as participat<strong>in</strong>g with these <strong>in</strong>stitutions isrepresented only once. The data represent the comb<strong>in</strong>ed reach of these <strong>in</strong>stitutions.The sequence of maps starts with a regional map show<strong>in</strong>g the fourteen counties of the<strong>Chicago</strong> MSA. Succeed<strong>in</strong>g maps home <strong>in</strong>, first on Cook County, then on the seventy-sevencommunity areas with<strong>in</strong> the City of <strong>Chicago</strong>, and f<strong>in</strong>ally on the 865 census tracts with<strong>in</strong>the City of <strong>Chicago</strong>.Map 5 shows the distribution of participation across the entire <strong>Chicago</strong> MSA.For each of the maps, the total area is divided so that each category—red, orange, yellow,green, and blue—represents 20 percent of the participants <strong>in</strong> the area presented <strong>in</strong> the map. 6The borders represent tracts <strong>in</strong> the City of <strong>Chicago</strong> and townships <strong>in</strong> the rest of the MSA.There is considerable variation across the region. The red areas on the map are thosewith the highest rate of participation; <strong>in</strong> these locations more than one household <strong>in</strong> twoparticipates <strong>in</strong> at least one of the twelve largest organizations. These areas account for20 percent of all participat<strong>in</strong>g households, even though they comprise less than 4 percentof the region’s population. In the <strong>Chicago</strong> MSA as a whole, the only red areas are <strong>in</strong> thesuburbs of the north lakeshore and the western suburb of River Forest. As we will see,22
Lake Michigan5Density of Households Participat<strong>in</strong>g <strong>in</strong> Larger <strong>Cultural</strong> Institutions<strong>Chicago</strong> MSA by Township and Census Tract32% and Above18% to 32%13% to 18%7% to 13%Below 7%
<strong>Mapp<strong>in</strong>g</strong> <strong>Cultural</strong> <strong>Participation</strong> <strong>in</strong> <strong>Chicago</strong>with<strong>in</strong> the city there are certa<strong>in</strong> census tracts with<strong>in</strong> community areas that displaypatches of red; however, no community area with<strong>in</strong> the City of <strong>Chicago</strong> exhibits thishighest density of participation.At the other end of the spectrum, blue represents the areas with the lowest participation;<strong>in</strong> every one of these areas, less than one household <strong>in</strong> ten participates, with the averagedensity be<strong>in</strong>g around one <strong>in</strong> twenty. Not surpris<strong>in</strong>gly, the sections of the MSA distant fromthe city have very low densities. Blue also predom<strong>in</strong>ates on the south and west sides of<strong>Chicago</strong> and <strong>in</strong> the near south suburbs. All of these blue areas must be comb<strong>in</strong>ed toarrive at 20 percent, or one-fifth, of the households <strong>in</strong> the MSA that participate with thetwelve largest cultural <strong>in</strong>stitutions, despite their compris<strong>in</strong>g 57 percent of the population.The orange areas are quite active, though less so than the red. Here about one household<strong>in</strong> four participates. There are areas of orange <strong>in</strong> the north suburbs near the lake <strong>in</strong>Lake County’s Shields Township, which conta<strong>in</strong>s Lake Forest and Lake Bluff. Away fromthe lake <strong>in</strong> Lake County, Vernon Township conta<strong>in</strong>s Vernon Hills and Buffalo Grove, andCuba Township conta<strong>in</strong>s Lake Barr<strong>in</strong>gton and Barr<strong>in</strong>gton Hills. The rest of the orangeareas are with<strong>in</strong> Cook County. The yellow areas have participation rates close to thosefor the <strong>Chicago</strong> region as a whole; about one household <strong>in</strong> six <strong>in</strong> these yellow areasparticipates. Interest<strong>in</strong>gly, there are large patches of yellow on the map of the northernand western suburbs, even though these areas are quite distant from the <strong>in</strong>stitutionsthemselves. Some examples are Niles <strong>in</strong> Cook County and the eastern portion of DuPageCounty. Similarly, there are large green areas <strong>in</strong> the suburbs; <strong>in</strong> those, about onehousehold <strong>in</strong> ten participates.Map 6 presents the results for Cook County.The townships with highest density of participation are New Trier (which conta<strong>in</strong>s Wilmette,W<strong>in</strong>netka, Kenilworth, and Glencoe) and River Forest. Oak Park <strong>in</strong> the west and Evanstonand Northfield <strong>in</strong> the north are <strong>in</strong> the second highest category, matched by a number ofcommunity areas <strong>in</strong> the city (see Map 7). 7 Outside the city, the lowest density <strong>in</strong> CookCounty is <strong>in</strong> the south and west suburbs, and <strong>in</strong> Hanover, Schaumburg, and Elk Grove <strong>in</strong>the northwest.Map 7 represents the city’s seventy-seven community areas. The strongestoverall impression is the large swath of blue stretch<strong>in</strong>g from the South Sidethrough the West Side and up to the northwest.All of these blue areas have very low levels of participation, on average about onehousehold <strong>in</strong> twenty. No community area exhibits any red. The orange areas are along thelakeshore, particularly north of the South Loop, and <strong>in</strong> the north-central part of the city.Hyde Park is the only South Side area with this density; even its neighbor, Kenwood, is <strong>in</strong>the second lowest category. Beverly <strong>in</strong> the south is the <strong>in</strong>termediate yellow category.Map 8 and the satellite maps, 8a, 8b, and 8c, demonstrate how important it is tolook <strong>in</strong> detail at the characteristics of a neighborhood.7 A small number of townships switchcategories between the MSA and CookCounty maps. See footnote 6 for anexplanation.At the level of community areas, it appears that there are no areas as active as thenorth shore suburbs. However, this is not true when we consider census tracts with<strong>in</strong>community areas. Beverly, Hyde Park, Kenwood, the South Loop, the Loop, the NearNorth, L<strong>in</strong>coln Park, and Lakeview all show that there is considerable variation with<strong>in</strong>community areas, with the most active parts of these areas more than match<strong>in</strong>g the level24 <strong>Mapp<strong>in</strong>g</strong> and Model<strong>in</strong>g
Barr<strong>in</strong>gtonPalat<strong>in</strong>eWheel<strong>in</strong>gNorthfieldNew TrierEvanstonHanoverSchaumburgElk GroveMa<strong>in</strong>eNilesLake MichiganNorwood ParkLeyden<strong>Chicago</strong>River ForestOak ParkProvisoRiversideCiceroBerwynLyonsStickneyWorthLemontPalosCalumet6Density of Households Participat<strong>in</strong>gOrlandBremenThornton<strong>in</strong> Larger <strong>Cultural</strong> InstitutionsCook County by Townshipand Census Tract35% and AboveRichBloom26% to 35%14% to 26%8% to 14%Below 8%
Lake Michigan7Density of Households Participat<strong>in</strong>g<strong>in</strong> Larger <strong>Cultural</strong> InstitutionsCity of <strong>Chicago</strong> by Community Area36% and Above27% to 36%20% to 27%9% to 20%Below 9%
of activity <strong>in</strong> the north shore suburbs. The detailed maps of the Near North, Beverly andMorgan Park, and Hyde Park and Kenwood show very high levels of <strong>in</strong>volvement fromcerta<strong>in</strong> sections of these neighborhoods. Indeed, the density and the total <strong>in</strong>volvementof these areas is considerably greater than that of the suburbs.We also exam<strong>in</strong>ed other def<strong>in</strong>itions of arts participation <strong>in</strong> the larger organizations otherthan def<strong>in</strong><strong>in</strong>g it as whether the household appears on the mail<strong>in</strong>g list of one of <strong>Chicago</strong>’slargest arts <strong>in</strong>stitutions. We found that the large <strong>in</strong>stitutions tend to ma<strong>in</strong>ta<strong>in</strong> relativelymore sophisticated records of their transactions with households than did the smallerorganizations. For those organizations it is possible to dist<strong>in</strong>guish among different typesof participation, <strong>in</strong>clud<strong>in</strong>g whether the household has a membership or subscription oreven whether they are donors or board members. Our analysis of this <strong>in</strong>formation<strong>in</strong>dicates that def<strong>in</strong><strong>in</strong>g participation <strong>in</strong> these ways tends to result <strong>in</strong> a more geographicallyconcentrated pattern of participation than shown <strong>in</strong> Map 8. We also f<strong>in</strong>d a moregeographically concentrated pattern of arts participation when we def<strong>in</strong>e participationto be whether the household participates <strong>in</strong> the activities of more than one of the city’slargest organizations.<strong>Mapp<strong>in</strong>g</strong> and Model<strong>in</strong>g 27
Lake Michigan8Density of Households Participat<strong>in</strong>g<strong>in</strong> Larger <strong>Cultural</strong> InstitutionsCity of <strong>Chicago</strong> by Census Tract36% and Above27% to 36%20% to 27%9% to 20%Below 9%
L<strong>in</strong>coln ParkNear North SideWest Town8a, 8b, 8cDensity of Households Participat<strong>in</strong>g<strong>in</strong> Larger <strong>Cultural</strong> InstitutionsNear West SideLoopLake MichiganCity of <strong>Chicago</strong> by Census Tract36% and Above27% to 36%20% to 27%9% to 20%Below 9%8aDetail of Near North SideAshburnAuburn GreshamOaklandKenwoodWash<strong>in</strong>gton HeightsGrand BoulevardBeverlyMount GreenwoodMorgan ParkWash<strong>in</strong>gton ParkHyde ParkWest PullmanWoodlawn8b Detail of Beverly and Morgan Park 8c Detail of Hyde Park and Kenwood
Arts and CultureOrganizations:Who Participates?Relation to Race and EthnicityFor many <strong>Chicago</strong>ans, the geographic distribution of audience participation<strong>in</strong> large arts and cultural organizations will not be surpris<strong>in</strong>g.The lens through which people will see the <strong>in</strong>formation will depend, however, on whichcharacteristics of the communities they focus on. Many will recognize that areas withthe least participation are African-American and Lat<strong>in</strong>o communities. Others will registerthat the areas of highest participation densities are predom<strong>in</strong>antly wealthy, relativelywell-educated communities. In consider<strong>in</strong>g this, it is important to remember that weonly know the composite characteristics of the areas, and not the characteristics of the<strong>in</strong>dividual households.Basic economic analysis would predict that arts participation should rise with household<strong>in</strong>come. Few would be surprised that participation <strong>in</strong> larger arts organizations is higheramong better educated populations. Of greater concern is the possibility that the artsorganizations <strong>in</strong> our sample do not engage African-American and Lat<strong>in</strong>o communitiesat the same rate that they engage other areas <strong>in</strong> the city. If this is <strong>in</strong>deed the case,organizations may wish to devote additional resources and re-evaluate strategies <strong>in</strong>order to engage African-American, Lat<strong>in</strong>o, and and other potential audiences.Consistent with this concern, we observe that areas with high concentrations ofAfrican-Americans and Lat<strong>in</strong>os have among the lowest participation rates <strong>in</strong> large artsorganizations. The most strik<strong>in</strong>g characteristic of the distribution of participation <strong>in</strong>Map 8 is how it appears to mirror the racial and ethnic distribution of the City of <strong>Chicago</strong>.Maps 9a and 9b show the distributions of the African-American and Lat<strong>in</strong>o populationsseparately. The critical illustration is Map 10, which shows the distribution of thecomb<strong>in</strong>ed African-American and Lat<strong>in</strong>o population. In this map, for each census tract <strong>in</strong>red, more than 98 percent of the residents are either African-American or Lat<strong>in</strong>o;approximately one-fifth, or 20 percent, of <strong>Chicago</strong>’s population resides <strong>in</strong> these areas.In the orange areas, between 87 percent and 98 percent of residents are either African-American or Lat<strong>in</strong>o; an additional one-fifth, or 20 percent, of the city’s residents reside <strong>in</strong>these areas. At the other end of the cont<strong>in</strong>uum, census tracts shaded <strong>in</strong> blue also conta<strong>in</strong>one-fifth of the city’s residents. In these sections, less than 20 percent of residents areAfrican-American and Lat<strong>in</strong>o.It is important to recognize that race and ethnicity are not perfectly correlatedwith an area’s level of arts participation.We observe that there are many census tracts <strong>in</strong> the city’s northwest and southwestregions <strong>in</strong> which the percentage of the population that is either African-American orLat<strong>in</strong>o approaches zero, yet these areas also have relatively low participation densities<strong>in</strong> the large arts organizations. Clearly, other factors besides race and ethnicity mustaccount for at least some of the differences <strong>in</strong> arts participation among areas of the city.Predictors of <strong>Participation</strong>One goal of this study is to learn whether factors other than an area’s ethniccomposition account for the apparent tendency for arts participation to behighest <strong>in</strong> predom<strong>in</strong>antly white communities and lowest <strong>in</strong> African-Americanand Lat<strong>in</strong>o communities.30
Lake Michigan9aAfrican-American Population DensityCity of <strong>Chicago</strong> by Census Tract96% and Above26% to 96%4% to 26%1% to 4%Below 1%(Source: U.S. 2000 Census)
Lake Michigan9bLat<strong>in</strong>o Population DensityCity of <strong>Chicago</strong> by Census Tract56% and Above19% to 56%6% to 19%1% to 6%Below 1%(Source: U.S. 2000 Census)
Lake Michigan10Comb<strong>in</strong>ed Population Densityof African-Americans and Lat<strong>in</strong>osCity of <strong>Chicago</strong> by Census Tract98% and Above87% to 98%52% to 87%20% to 52%Below 20%(Source: U.S. 2000 Census)
<strong>Mapp<strong>in</strong>g</strong> <strong>Cultural</strong> <strong>Participation</strong> <strong>in</strong> <strong>Chicago</strong>To better understand these patterns of arts participation, we also analyzed the geographicdistributions of three socioeconomic factors that are known to be associated with artsparticipation: (i) household <strong>in</strong>come, (ii) educational atta<strong>in</strong>ment, and (iii) householdstructure. This third factor takes <strong>in</strong>to account the number of persons <strong>in</strong> the household,the ages of adult household members, whether the household has children, and whetherthe household is headed by an unmarried woman.To motivate our analysis of this question we present measures of the distribution ofhousehold <strong>in</strong>come and educational atta<strong>in</strong>ment by census tract <strong>in</strong> two maps follow<strong>in</strong>gMap 10, which shows the geographic distribution of ethnicity. In Map 11, we identifycommunities accord<strong>in</strong>g to the level of median household <strong>in</strong>come <strong>in</strong> the census tract.Median household <strong>in</strong>come is the level of <strong>in</strong>come for which 50 percent of the households<strong>in</strong> the area have a lower <strong>in</strong>come and 50 percent of the households have a higher <strong>in</strong>come.Areas with annual median household <strong>in</strong>comes greater than $59,000, as <strong>in</strong>dicated <strong>in</strong> redon the map, are concentrated north of downtown along Lake Michigan. By contrast, as<strong>in</strong>dicated by the blue, the lowest median household <strong>in</strong>comes—less than $31,000—areconcentrated on the West Side and <strong>in</strong> parts of the South Side of the city. The correlationbetween arts participation <strong>in</strong> an area and its median household <strong>in</strong>come is apparent whencompar<strong>in</strong>g Map 11 to Map 8.Arts participation is generally high <strong>in</strong> communities with the highest household<strong>in</strong>comes, and it is generally low <strong>in</strong> areas with the lowest <strong>in</strong>comes.This is seen <strong>in</strong> the maps by observ<strong>in</strong>g that the areas that are red <strong>in</strong> one map also tend tobe red <strong>in</strong> the other. Likewise, areas shaded <strong>in</strong> blue <strong>in</strong> one map also tend to be shaded <strong>in</strong>blue <strong>in</strong> the other. However, both these correlations are by no means perfect.Specifically, although there are no low <strong>in</strong>come areas with high arts participationdensities, there are many medium and high <strong>in</strong>come areas that appear to havelow arts participation densities.An example of such an area is <strong>in</strong> the northwest part of the city. There, median <strong>in</strong>comesare relatively high, yet participation <strong>in</strong> large arts organizations is low.Arts participation is generally high <strong>in</strong> communities with high levels ofeducational atta<strong>in</strong>ment, and it is generally low <strong>in</strong> areas with low educationalatta<strong>in</strong>ment.Map 12 shows that arts participation is positively correlated with high levels ofeducational atta<strong>in</strong>ment. One measure that works well, because it is visually evidentand highly correlated with arts participation <strong>in</strong> an area, is the percentage of people witha bachelor’s degree or higher. Many of the areas with high median household <strong>in</strong>comes<strong>in</strong> Map 11 also have relatively large percentages of persons with at least a bachelor’sdegree. In the red areas of Map 12, more than 72 percent of adult residents age 25 andover have a bachelor’s degree or higher. By contrast, the blue areas <strong>in</strong>dicate that fewerthan 19 percent of the population has bachelor’s degrees. Not surpris<strong>in</strong>gly, areas withrelatively high levels of educational atta<strong>in</strong>ment also tend to have high <strong>in</strong>comes. But onceaga<strong>in</strong>, these correlations are not perfect.34 Arts and Culture Organizations: Who Participates?We also f<strong>in</strong>d, but do not show, similar correlations with our measures of householdstructure. Larger households tend to be <strong>in</strong> low <strong>in</strong>come areas with lower artsparticipation densities.
Lake Michigan11Median Household IncomeCity of <strong>Chicago</strong> by Census Tract$59,000 and Above$46,000 to $59,000$39,000 to $46,000$31,000 to $39,000Below $31,000(Source: U.S. 2000 Census)
Lake Michigan12Density of Bachelor’s Degreesamong Adult PopulationCity of <strong>Chicago</strong> by Census Tract72% and Above52% to 72%35% to 52%19% to 35%Below 19%(Source: U.S. 2000 Census)
Model<strong>in</strong>g<strong>Participation</strong>:Does EthnicityStill Matter?As evidenced by Maps 9a, 9b, and 10, <strong>Chicago</strong> is a city that is segmented <strong>in</strong>to many ethnicenclaves. But ethnicity is only one of several <strong>in</strong>dicators related to participation with thelarge arts and cultural organizations.This study shows that there are many white communities unengaged <strong>in</strong> thelarger arts organizations, just as with African-American and Lat<strong>in</strong>o communities.If communities with similar socioeconomic characteristics are compared, will differences<strong>in</strong> participation with the large organizations still be associated with the ethniccomposition of an area’s population?To address this question, we developed a statistical model that associates an area’sarts participation density with measures of its median <strong>in</strong>come, household structure,and educational atta<strong>in</strong>ment. Us<strong>in</strong>g this model, we estimate the average relation betweeneach of our socioeconomic factors and arts participation <strong>in</strong> the large organizations. Forexample, we f<strong>in</strong>d that if we compare areas with similar levels of educational atta<strong>in</strong>mentand household structure, the areas with higher median <strong>in</strong>comes generally have higherlevels of participation <strong>in</strong> the large arts organizations.The ma<strong>in</strong> purpose of our statistical model is to predict what an area’sparticipation density <strong>in</strong> large arts organizations might be if only socioeconomicvariables—and not the community’s racial and ethnic composition—areconsidered <strong>in</strong> predict<strong>in</strong>g participation.The difference between the actual participation density for an area and the participationdensity predicted by the model is a measure of whether the area has unexpectedly high orlow participation <strong>in</strong> large organizations, given its socioeconomic characteristics. If actualparticipation exceeds predicted participation by a large amount, this means that comparedwith other areas with similar socioeconomic characteristics (median household <strong>in</strong>come,educational atta<strong>in</strong>ment, and household structure), this area has an unexpectedly highlevel of arts participation. By contrast, if actual participation is far less than its predictedparticipation, this means that compared with other areas with similar characteristics, thisarea has an unexpectedly low level of arts participation <strong>in</strong> the large organizations.Because we compare each census tract to other census tracts with similar socioeconomiccharacteristics, it is possible for high <strong>in</strong>come areas, such as those along Lake Michiganand north of downtown, to have unexpectedly low levels of arts participation <strong>in</strong> largeorganizations, and for low <strong>in</strong>come areas, such as those <strong>in</strong> the South and far West Sidesof the city, to have unexpectedly high levels of arts participation <strong>in</strong> large organizations.It is important to understand what the f<strong>in</strong>d<strong>in</strong>gs from this analysis represent.To appreciate the use of our statistical model, it is important first to understand themean<strong>in</strong>g of potential results. If we f<strong>in</strong>d that the concentration of African-Americans andLat<strong>in</strong>os <strong>in</strong> an area is essentially uncorrelated with whether the area has either anunexpectedly high or low arts participation density, then we have evidence thatdifferences <strong>in</strong> participation <strong>in</strong> large organizations are largely due to <strong>in</strong>comes, educationalatta<strong>in</strong>ment, household structure, and possibly other unmeasured factors; <strong>in</strong> this scenario,it is not likely due to the community’s ethnic composition. Alternatively, if we f<strong>in</strong>d thathav<strong>in</strong>g unexpectedly low arts participation densities is related to the ethnic compositionof an area, there would be evidence that ethnicity may be a contribut<strong>in</strong>g factor to the levelof participation <strong>in</strong> the large arts organizations <strong>in</strong> <strong>Chicago</strong>.37
<strong>Mapp<strong>in</strong>g</strong> <strong>Cultural</strong> <strong>Participation</strong> <strong>in</strong> <strong>Chicago</strong>Map 13 displays the expected participation <strong>in</strong> large organizations by census tract forthe City of <strong>Chicago</strong>, based on our statistical model. This map shows the geographicdistribution of arts participation that we expect based on an area’s socioeconomiccharacteristics. The relatively close correspondence between the expected and actualpatterns (<strong>in</strong> Map 8) of arts participation <strong>in</strong>dicates that the socioeconomic characteristicsthat we study expla<strong>in</strong> much of the variation <strong>in</strong> arts participation <strong>in</strong> <strong>Chicago</strong>.Although our measures of expected and actual arts participation are similar, they are notthe same. In some areas participation <strong>in</strong> the large organizations is greater than expectedwhile <strong>in</strong> others it is less than expected. For each census tract <strong>in</strong> the City of <strong>Chicago</strong>, weused our statistical model to compute the measure of unexpected arts participation.Map 14 presents the geographic distribution of our measure of unexpected participation<strong>in</strong> <strong>Chicago</strong>’s large arts organizations. The census tracts shaded <strong>in</strong> red are areas withthe highest unexpected participation densities. In other words, after tak<strong>in</strong>g <strong>in</strong>to accountthe socioeconomic characteristics of these areas, we f<strong>in</strong>d that participation <strong>in</strong> the largeorganizations is relatively high. In the orange shaded areas, arts participation is onlysomewhat higher than expected. By contrast, census tracts shaded <strong>in</strong> blue are areas <strong>in</strong>which participation <strong>in</strong> the large organizations is unexpectedly low. The areas shaded <strong>in</strong>yellow represent arts participation densities that are close to the levels that we expectbased on the community’s median <strong>in</strong>come, household structure, and educationalatta<strong>in</strong>ment.The pattern of unexpected levels of arts participation <strong>in</strong> the large organizations is muchless discernable than the patterns observed for actual participation <strong>in</strong> Map 8. Recall thatour earlier f<strong>in</strong>d<strong>in</strong>gs from Map 8 revealed that arts participation densities were the highest<strong>in</strong> communities extend<strong>in</strong>g north along Lake Michigan from downtown and <strong>in</strong> the HydePark and Kenwood area on the South Side along the lake. But <strong>in</strong> Map 14 show<strong>in</strong>gunexpected participation <strong>in</strong> the large organizations, we do not observe that these sameareas systematically have unexpectedly high levels of arts participation.The green and blue shad<strong>in</strong>g <strong>in</strong> some socioeconomically advantaged northsidelakefront areas <strong>in</strong>dicates that levels of participation <strong>in</strong> large organizationsare lower than expected.In comparison with other areas of the city, arts participation <strong>in</strong> these lakefrontcommunities is very high. But, given these areas’ high levels of <strong>in</strong>come and educationalatta<strong>in</strong>ment, and the structure of their households, the expectation is that participation <strong>in</strong>the large organizations would be even greater than its current level.We f<strong>in</strong>d an association between the percentage of African-American residents <strong>in</strong>an area and unexpectedly low arts participation.Although the pattern of unexpected arts participation <strong>in</strong> large organizations is lessdiscernable than the pattern of arts participation shown <strong>in</strong> Map 8, we f<strong>in</strong>d that even afteraccount<strong>in</strong>g for an area’s socioeconomic characteristics, areas with higher percentages ofAfrican-Americans are more likely to have unexpectedly low participation densities <strong>in</strong> thelarge arts organizations. The relationship we observe between our measure of unexpectedarts participation and the percentage of an area’s residents that are African-Americansuggests that when we compare two areas with similar socioeconomic characteristics,if the percentage of African-American residents is 10 percentage po<strong>in</strong>ts larger <strong>in</strong> onearea, then we predict that on average the participation density <strong>in</strong> large arts organizations38 Model<strong>in</strong>g <strong>Participation</strong>: Does Ethnicity Still Matter?
Lake Michigan13Predicted Density of HouseholdsParticipat<strong>in</strong>g <strong>in</strong> Larger <strong>Cultural</strong> InstitutionsCity of <strong>Chicago</strong> by Census Tract36% and Above27% to 36%18% to 27%7% to 18%Below 7%
Lake Michigan14Unexpected Deviations from PredictedDensity of Households Participat<strong>in</strong>g<strong>in</strong> Larger <strong>Cultural</strong> InstitutionsCity of <strong>Chicago</strong> by Census Tract25% and Above9% to 25%-3% to 9%-13% to -3%Below -13%
will be about 5 percent lower <strong>in</strong> the community with the larger share of African-Americanresidents.We f<strong>in</strong>d no such association between the percentage of Lat<strong>in</strong>o residents<strong>in</strong> an area and our measure of unexpected arts participation.These results imply that ethnicity is a factor that can account for some of the lowerrates of arts participation <strong>in</strong> large organizations for predom<strong>in</strong>antly African-Americanareas of the city. However, they do not apply to Lat<strong>in</strong>o areas; <strong>in</strong> these neighborhoods,participation <strong>in</strong> large arts organizations is about what we would expect, given theseareas’ socioeconomic characteristics.Explanations of Patterns <strong>in</strong> Unexpected <strong>Participation</strong>No simple explanation can account for the patterns of variation.Our data shows that areas with higher concentrations of African-Americans are likelyto have lower participation densities <strong>in</strong> the large arts organizations than areas withsimilar socioeconomic characteristics but larger concentrations of whites or Lat<strong>in</strong>os.However, we do f<strong>in</strong>d that there are some predom<strong>in</strong>antly African-American communitieswith unexpectedly high participation densities and others with unexpectedly low artsparticipation densities. They are unexpectedly low <strong>in</strong> the New City, Englewood, and WestEnglewood communities on the South Side of <strong>Chicago</strong>. The census tracts <strong>in</strong> thesecommunities are frequently shaded green and blue, <strong>in</strong>dicat<strong>in</strong>g that arts participation isbelow expected levels. So although these are relatively low <strong>in</strong>come communities, artsparticipation is still lower than we would expect, given their socioeconomic attributes.Conversely, census tracts <strong>in</strong> the predom<strong>in</strong>antly African-American neighborhoods ofAvalon Park, and Calumet Heights community areas to the east, often are shaded <strong>in</strong>yellow, orange, and red. This <strong>in</strong>dicates that these areas have arts participation densitiesthat either match (yellow) or exceed (orange or red) what we would expect based onthese areas’ socioeconomic characteristics. In predom<strong>in</strong>antly African-American areas,differences <strong>in</strong> ethnic composition cannot be a factor account<strong>in</strong>g for these differences <strong>in</strong>our measure of unexpected participation. Moreover, s<strong>in</strong>ce we have taken <strong>in</strong>to accountdifferences <strong>in</strong> these areas’ socioeconomic characteristics, other unmeasured attributesof these areas and the people <strong>in</strong> them are likely at play.Model<strong>in</strong>g <strong>Participation</strong>: Does Ethnicity Still Matter? 41
Ethnic, Diverse, andOther InstitutionsThe previous analysis considers only participation <strong>in</strong> the twelve arts organizationswith revenue more than $8 million. It shows that socioeconomic characteristics aremajor determ<strong>in</strong>ants of participation <strong>in</strong> <strong>Chicago</strong>’s large arts and culture <strong>in</strong>stitutions.Furthermore, over and above these factors, the racial or ethnic composition of thecommunity is related to participation.The objectives of this study also <strong>in</strong>clude exam<strong>in</strong><strong>in</strong>g participation <strong>in</strong> <strong>Chicago</strong>’s otherarts <strong>in</strong>stitutions. A major question is whether these other <strong>in</strong>stitutions reach a differentpopulation than do the largest <strong>in</strong>stitutions. We are <strong>in</strong>terested <strong>in</strong> contrast<strong>in</strong>g thecharacteristics of their audiences with the audiences of the largest <strong>in</strong>stitutions,especially <strong>in</strong> terms of the geographical distribution of the participants.We collected data from forty-n<strong>in</strong>e additional <strong>in</strong>stitutions; sixteen of them werespecifically targeted, the other thirty-three responded to our general <strong>in</strong>vitation toparticipate. However, these forty-n<strong>in</strong>e <strong>in</strong>stitutions do not constitute a representativesample of <strong>Chicago</strong>’s arts <strong>in</strong>stitutions. Therefore, we cannot generalize our f<strong>in</strong>d<strong>in</strong>gsbeyond the specific <strong>in</strong>stitutions <strong>in</strong>cluded.We consider three groups of organizations: those that direct their efforts toward aspecific ethnic population [Ethnic]; those that direct their efforts toward a deliberatelydiverse population [Diverse]; and other smaller <strong>in</strong>stitutions [Other].Def<strong>in</strong>itions:Ethnically/culturally specific <strong>in</strong>stitutions [Ethnic Institutions]: Organizationswhose mission statements explicitly identify their primary purpose asrepresent<strong>in</strong>g and/or target<strong>in</strong>g a particular ethnic or cultural group.Ethnically/culturally diverse <strong>in</strong>stitutions [Diverse Institutions]: Organizationswhose mission statements explicitly identify their primary purpose asrepresent<strong>in</strong>g and/or target<strong>in</strong>g multiple ethnic or cultural groups.Other smaller <strong>in</strong>stitutions [Other Institutions]: Organizations whose budgetsare below $8 million and are neither explicitly Diverse nor Ethnic.Maps 15a, 15b, and 15c present the distributions for <strong>Chicago</strong>. Once aga<strong>in</strong>, red representsthe highest density of participation and blue the lowest. (The <strong>in</strong>stitutions <strong>in</strong> each categoryare listed <strong>in</strong> Appendix I.) It is clear that the audiences <strong>in</strong> these <strong>in</strong>stitutions are distributeddifferently across <strong>Chicago</strong> than the audiences for the larger <strong>in</strong>stitutions displayed <strong>in</strong>Map 8.It is possible, however, that even though the audience distribution is different, theaudiences themselves are not; it is possible that the smaller <strong>in</strong>stitutions simply attractthe part of the audiences of the largest <strong>in</strong>stitutions that live <strong>in</strong> their own areas of<strong>in</strong>fluence. As our database conta<strong>in</strong>s the address of each household, we can checkdirectly whether this is the case.Not only do the diverse and ethnic <strong>in</strong>stitutions engage a different audience thanthe large organizations, but the additional audience they reach is from arelatively untapped population.42
Lake Michigan15aDensity of Households Participat<strong>in</strong>g<strong>in</strong> Sampled Diverse InstitutionsCity of <strong>Chicago</strong> by Census Tract10% and Above6% to 10%4% to 6%2% to 4%Below 2%
Lake Michigan15bDensity of Households Participat<strong>in</strong>g<strong>in</strong> Sampled Ethnic InstitutionsCity of <strong>Chicago</strong> by Census Tract5% and Above3% to 5%2% to 3%1.5% to 2%Below 1.5%
Lake Michigan15cDensity of Households Participat<strong>in</strong>g<strong>in</strong> Sampled Other InstitutionsCity of <strong>Chicago</strong> by Census Tract10% and Above7% to 10%5% to 7%3% to 5%Below 3%
<strong>Mapp<strong>in</strong>g</strong> <strong>Cultural</strong> <strong>Participation</strong> <strong>in</strong> <strong>Chicago</strong>We matched all the addresses of participants <strong>in</strong> the smaller <strong>in</strong>stitutions aga<strong>in</strong>st theaddress records for the large <strong>in</strong>stitutions. For each category—Diverse, Ethnic, and Other—we classified every household as either participat<strong>in</strong>g only <strong>in</strong> that category of <strong>in</strong>stitution oras participat<strong>in</strong>g also <strong>in</strong> a large <strong>in</strong>stitution. The results are shown <strong>in</strong> Tables 1, 2, and 3.Table 1:<strong>Participation</strong> Overlap between Diverse Institutions and Larger <strong>Cultural</strong> InstitutionsOverlap Count %Diverse/Also <strong>in</strong> Larger Institutions 23,000 43Diverse/Not <strong>in</strong> Larger Institutions 30,000 57Totals 53,000 100Table 1 shows that more than half (57 percent) of the households that participate <strong>in</strong> theDiverse <strong>in</strong>stitutions <strong>in</strong> our sample do not also participate <strong>in</strong> the larger <strong>in</strong>stitutions; thusthese <strong>in</strong>stitutions are reach<strong>in</strong>g an additional audience. Map 16 shows the distribution ofthis additional audience. It is mostly on the North Side, away from the lakefront, but withsignificant pockets on the South Side that do not appear <strong>in</strong> the density map for the large<strong>in</strong>stitutions.Table 2:<strong>Participation</strong> Overlap between Ethnic Institutions and Larger <strong>Cultural</strong> InstitutionsOverlap Count %Ethnic/Also <strong>in</strong> Larger Institutions 11,000 27Ethnic/Not <strong>in</strong> Larger Institutions 31,000 73Totals 42,000 100Table 2 shows that <strong>in</strong> the case of Ethnic <strong>in</strong>stitutions, the additional audience is aneven greater proportion of the total. About three quarters (73 percent) of their audiencedoes not participate <strong>in</strong> the larger <strong>in</strong>stitutions. Map 17, which displays the density ofparticipation <strong>in</strong> ethnically specific <strong>in</strong>stitutions, is dramatically different from the generalmap of participation density. The concentrations are on the South Side and the southcentral areas, with relatively little density on the North Side, especially along thelakefront.Other smaller <strong>in</strong>stitutions also tap additional audiences; the location of theseaudiences depends on the nature and location of the <strong>in</strong>stitutions.To put these results <strong>in</strong> context, we look at the audiences for the Other arts organizations<strong>in</strong> our sample. Table 3 shows that, as for Ethnic and Diverse <strong>in</strong>stitutions, the majority(<strong>in</strong> this case, 64 percent) of the audience does not participate <strong>in</strong> the larger organizations.Map 18 shows the geographical distribution of this additional audience. The concentrationsare on the North Side, not by the lake, with pockets of high density <strong>in</strong> the Hyde Park andKenwood and Beverly areas on the South Side.46 Ethnic, Diverse, and Other Institutions
Lake Michigan16Density of Households Participat<strong>in</strong>g<strong>in</strong> Sampled Diverse Institutions, butnot <strong>in</strong> Larger <strong>Cultural</strong> InstitutionsCity of <strong>Chicago</strong> by Census Tract4% and Above3% to 4%2% to 3%1% to 2%Below 1%
Lake Michigan17Density of Households Participat<strong>in</strong>g<strong>in</strong> Sampled Ethnic Institutions, butnot <strong>in</strong> Larger <strong>Cultural</strong> InstitutionsCity of <strong>Chicago</strong> by Census Tract4% and Above2.5% to 4%1.5% to 2.5%1% to 1.5%Below 1%
Lake Michigan18Density of Households Participat<strong>in</strong>g<strong>in</strong> Sampled Other Institutions, butnot <strong>in</strong> Larger <strong>Cultural</strong> InstitutionsCity of <strong>Chicago</strong> by Census Tract4% and Above3% to 4%2% to 3%1% to 2%Below 1%
<strong>Mapp<strong>in</strong>g</strong> <strong>Cultural</strong> <strong>Participation</strong> <strong>in</strong> <strong>Chicago</strong>Table 3:<strong>Participation</strong> Overlap between Other Institutionsand Larger <strong>Cultural</strong> InstitutionsOverlap Count %Other Small/Also <strong>in</strong> Larger Institutions 56,000 36Other Small/Not <strong>in</strong> Larger Institutions 102,000 64Totals 158,000 100Each category of arts organization reaches an additional audience.Across all three categories of organization, therefore, we f<strong>in</strong>d that additional audiencesare reached by the range of <strong>Chicago</strong>’s arts organizations. Though there are some overlapsacross the categories, the major part of each category’s audience is an addition to overallparticipation.The geographic distributions of participation <strong>in</strong> the smaller organizations differ fromthe distribution for the large arts organizations. <strong>Participation</strong> <strong>in</strong> the smaller <strong>in</strong>stitutions<strong>in</strong> our sample is more spread out across the city than is participation <strong>in</strong> the large artsorganizations. This raises the question of whether, if we add together participation <strong>in</strong> thelarge organizations with that of all other organizations, we would f<strong>in</strong>d the same set ofdeterm<strong>in</strong>ants for arts participation. We hope to address that question <strong>in</strong> future research.Overall these data provide a strik<strong>in</strong>g illustration of the specificity of the audiences ofdifferent categories of <strong>in</strong>stitutions, and make it clear that participation <strong>in</strong> the larger<strong>in</strong>stitutions cannot be taken as representative of arts participation <strong>in</strong> general. Whilerecogniz<strong>in</strong>g the great importance of these flagship <strong>in</strong>stitutions, it is also important torecognize the vital role played by <strong>Chicago</strong>’s other <strong>in</strong>stitutions. In future research we hopeto accumulate a more comprehensive data set that will enable us to address the issue ofthe determ<strong>in</strong>ants of arts participation <strong>in</strong> general.50 Ethnic, Diverse, and Other Institutions
ConclusionThe primary focus of this project was on participation <strong>in</strong> <strong>Chicago</strong>’s largest not-for-profitcultural <strong>in</strong>stitutions by the African-American and Lat<strong>in</strong>o communities. A secondary focuswas on participation <strong>in</strong> smaller and more specifically targeted <strong>in</strong>stitutions, to see whetherthey engage a different population than the large <strong>in</strong>stitutions. The data we used werebuilt from the records of the cultural <strong>in</strong>stitutions; each <strong>in</strong>dividual-level piece of data wasan adm<strong>in</strong>istrative record of a transaction between the <strong>in</strong>stitution and an <strong>in</strong>dividual orhousehold.We f<strong>in</strong>d that participation <strong>in</strong> <strong>Chicago</strong>’s largest arts and cultural organizations is highest <strong>in</strong>predom<strong>in</strong>antly white, high <strong>in</strong>come areas of the metropolitan area. Areas with the highestparticipation densities are community areas <strong>in</strong> <strong>Chicago</strong> and townships <strong>in</strong> the suburbs thatare north of downtown border<strong>in</strong>g on Lake Michigan. A few other areas that also haverelatively high rates of arts participation are scattered about Cook County, <strong>in</strong>clud<strong>in</strong>g areaswith more ethnically diverse populations such as Hyde Park on the city’s South Side andOak Park <strong>in</strong> the near western suburbs. In these areas roughly one household <strong>in</strong> twoparticipates <strong>in</strong> some way <strong>in</strong> the city’s largest arts organizations.By contrast, participation rates are low throughout much of the rest of the metropolitanarea. However, they are consistently lowest <strong>in</strong> areas with large percentages of African-American or Lat<strong>in</strong>o households. These areas <strong>in</strong>clude <strong>Chicago</strong>’s South and West Sides aswell as suburban communities <strong>in</strong> Cook County with relatively large m<strong>in</strong>ority populations.In these low participation areas roughly one household <strong>in</strong> twenty participates <strong>in</strong> thecity’s large organizations.Measures of more <strong>in</strong>tensive forms of arts participation reveal even greater geographicconcentration of participation. For example, the geographic distribution of donors tothese organizations is even more concentrated <strong>in</strong> predom<strong>in</strong>antly high <strong>in</strong>come areas thanis the distribution of all forms of participation. Likewise, the proportion of householdsparticipat<strong>in</strong>g <strong>in</strong> more than one organization is higher <strong>in</strong> these areas as well. We plan tocont<strong>in</strong>ue to explore these issues.To many familiar with <strong>Chicago</strong>’s arts community, these participation patterns may notbe surpris<strong>in</strong>g. However, one of our most important f<strong>in</strong>d<strong>in</strong>gs is that socioeconomicattributes are the most important predictors of the density of arts participation. Amongthe characteristics that we considered were an area’s median household <strong>in</strong>come, thepercentages of residents with bachelor’s or master’s degrees, household size, and theage of its adult population. These characteristics of a community or neighborhood canexpla<strong>in</strong> much but not all of the variation <strong>in</strong> arts participation densities among areas <strong>in</strong><strong>Chicago</strong>. As such, ethnicity represents only a part of the picture; socioeconomiccharacteristics are much stronger predictors of who does and does not participate <strong>in</strong>these organizations.There is no earlier benchmark with which to compare the current situation. Thus, wecannot address whether progress is be<strong>in</strong>g made. Indeed, a major purpose of this studyis to provide that basel<strong>in</strong>e for future studies. Currently, however, <strong>Chicago</strong>’s large artsorganizations are not successfully engag<strong>in</strong>g households <strong>in</strong> areas with poor socioeconomicbackgrounds. Both predom<strong>in</strong>antly m<strong>in</strong>ority and predom<strong>in</strong>antly white areas with relativelylow household <strong>in</strong>comes, low levels of educational atta<strong>in</strong>ment, and large householdsparticipate <strong>in</strong> the city’s large arts organizations at relatively low rates. This f<strong>in</strong>d<strong>in</strong>gsuggests that to engage such households, these organizations may have to reconsiderhow they deliver their services, their pric<strong>in</strong>g structure, and the times they make theirservices available to this audience.51
<strong>Mapp<strong>in</strong>g</strong> <strong>Cultural</strong> <strong>Participation</strong> <strong>in</strong> <strong>Chicago</strong>Although our f<strong>in</strong>d<strong>in</strong>gs underscore the importance of an area’s socioeconomiccharacteristics for understand<strong>in</strong>g patterns of arts participation <strong>in</strong> <strong>Chicago</strong>, aneighborhood’s ethnic composition still appears to matter. Even when we comparepredom<strong>in</strong>antly white and African-American communities with similar socioeconomiccharacteristics, we f<strong>in</strong>d that participation rates <strong>in</strong> the city’s largest arts organizationstend to be lower for predom<strong>in</strong>antly African-American communities. We did identify somepredom<strong>in</strong>antly African-American areas <strong>in</strong> which arts participation was much higher thanexpected. However, when an area’s rate of participation <strong>in</strong> large organizations was lowerthan expected, that area was more likely to be predom<strong>in</strong>antly African-American thanpredom<strong>in</strong>antly Lat<strong>in</strong>o or white.When we consider participation with smaller and more targeted arts organizations,we f<strong>in</strong>d a different story. Not only do the diverse and ethnic <strong>in</strong>stitutions tap a differentpopulation, but the audiences they tap are relatively unengaged with the larger<strong>in</strong>stitutions. This f<strong>in</strong>d<strong>in</strong>g holds especially true for the smaller organizations whosemissions target particular ethnic audiences. What is clear is that among the organizations<strong>in</strong> our sample, participation <strong>in</strong> these smaller organizations is more geographicallydispersed than the correspond<strong>in</strong>g distributions of participation for the largerorganizations. Furthermore, communities with predom<strong>in</strong>antly African-American andLat<strong>in</strong>o populations appear to be well represented <strong>in</strong> the audiences of these organizations.An important caveat to the forego<strong>in</strong>g f<strong>in</strong>d<strong>in</strong>g is that most of the area’s small to mediumsizearts organizations (those with revenue under $8 million) are not adequatelyrepresented <strong>in</strong> our sample. Without a larger and more representative sample of theseorganizations, we cannot say for sure whether our f<strong>in</strong>d<strong>in</strong>gs on participation <strong>in</strong> theseorganizations reflect their audience more generally or just the participation patternsfor the smaller organizations represented <strong>in</strong> our sample. We propose to address thisimportant question <strong>in</strong> future research.52 Conclusion
Appendix IPartner<strong>in</strong>g Organizationsby CategoryLarger <strong>Cultural</strong> InstitutionsThe Art Institute of <strong>Chicago</strong>Auditorium Theatre Council<strong>Chicago</strong> Historical Society<strong>Chicago</strong> Shakespeare Theater<strong>Chicago</strong> Symphony Orchestra<strong>Chicago</strong> Theater Group, Inc.(The Goodman Theatre)The Field MuseumJoffrey Ballet of <strong>Chicago</strong>Lyric Opera of <strong>Chicago</strong>Museum of Contemporary ArtMuseum of Science and IndustrySteppenwolf Theatre CompanyDiverse Institutions<strong>Chicago</strong> City Theatre(Joel Hall Dancers & <strong>Center</strong>)<strong>Chicago</strong> <strong>Cultural</strong> <strong>Center</strong> Foundation<strong>Chicago</strong> S<strong>in</strong>foniettaGuild ComplexIll<strong>in</strong>ois Humanities CouncilMerit School of MusicOld Town School of Folk MusicPeople’s Music SchoolSherwood Conservatory of MusicUrban GatewaysEthnic InstitutionsBlack Ensemble TheaterDeeply Rooted ProductionsDuSable Museum of African American HistoryThe HistoryMakersInternational Lat<strong>in</strong>o <strong>Cultural</strong> <strong>Center</strong> of <strong>Chicago</strong>Mexican F<strong>in</strong>e Arts <strong>Center</strong> MuseumSouth Side Community Art <strong>Center</strong>All OthersBeverly Arts <strong>Center</strong><strong>Chicago</strong> (a cappella)<strong>Chicago</strong> Architecture Foundation<strong>Chicago</strong> Artists’ Coalition<strong>Chicago</strong> Children’s Museum<strong>Chicago</strong> Humanities Festival<strong>Chicago</strong> Opera TheaterChristian Youth Theater of <strong>Chicago</strong>Court Theatre, University of <strong>Chicago</strong>David and Alfred Smart Museum of Art,University of <strong>Chicago</strong>DuPage Children’s MuseumEvanston Historical SocietyFirst Folio Shakespeare FestivalFrank Lloyd Wright Preservation TrustHalevi Choral SocietyHarris Theater for Music and DanceHubbard Street Dance <strong>Chicago</strong>Hyde Park Art <strong>Center</strong>McHenry County Music <strong>Center</strong>Museums <strong>in</strong> the ParkMusic Theatre WorkshopNaperville Heritage SocietyOriental Institute, University of <strong>Chicago</strong>Redmoon TheaterThe Renaissance Society at The Universityof <strong>Chicago</strong>Rockefeller Memorial Chapel,University of <strong>Chicago</strong>Scrap Mettle SOULSkokie Valley Orchestral AssociationUnity Temple Restoration FoundationThe University of <strong>Chicago</strong> PresentsVictory Gardens TheaterWilliam Ferris Chorale53
Appendix IILocation of <strong>Chicago</strong> AreaMcHenryLake<strong>Cultural</strong> Organizations••DeKalbKaneCook•• ••••••• •• • •• ••••••••• •DuPage• •••• ••••KendallWillGrundyLocations of OrganizationsRespond<strong>in</strong>g to Request for Data••••••DeKalb••McHenry•••Lake••• •••••••• ••••• •••••••• •• ••• •••••••••Cook•• • •••••• • •••••••• ••• •• ••• •••••• • •••• •••••••••••••• •• • • ••Kane•• • • • • • • • ••• •••••• •••••• • • •• • ••••••• •• •••• ••• ••••••• ••DuPage•••• ••• • • • • ••• ••• ••• • •••••••• ••••••••• • ••••• •••••••Kendall•••WillGrundy•Locations of Organizationsnot Respond<strong>in</strong>g to Request for Data54
Appendix IIIModel<strong>in</strong>g and PredictionTo calculate our measure of unexpected participation, we specified and estimated theparameters of a statistical model that related the participation density <strong>in</strong> artsorganizations for each census tract to several socioeconomic characteristics for thattract.• To account for differences <strong>in</strong> <strong>in</strong>come among areas we used the natural log of themedian household <strong>in</strong>come <strong>in</strong> the tract. We also experimented with us<strong>in</strong>g median<strong>in</strong>come and its square.• To account for educational atta<strong>in</strong>ment we used the percentage, and its square, ofresidents over 25 years of age who had a bachelor’s degree. We also controlled forthe percentage of residents that had a master’s level or higher degree.• To account for the age structure of the census tract we used the percentage ofresidents between the ages of 35 and 49 and between the ages of 50 and 65. We also<strong>in</strong>teracted these two age variables with the percentage of residents with a bachelor’sdegree.• To account for differences <strong>in</strong> household structure among tracts we considered theaverage household size, percentage of households headed by a female with children,percentage of households with children, and percentage of households with onemember. Once we accounted for these variables, the percentage of householdsheaded by a woman with children had no explanatory power <strong>in</strong> the model and so itwas dropped from our analysis.We measured participation <strong>in</strong> our analysis as the natural log of the participation density<strong>in</strong> large organizations. Each of the socioeconomic characteristics was related l<strong>in</strong>early tothis variable. We estimated our statistical model us<strong>in</strong>g the method of least squares. Weconsidered several variations on the model where we <strong>in</strong>cluded or excluded some of thevariables described above. We also alternatively excluded some census tracts from theanalysis depend<strong>in</strong>g on their small size. We weighted the observations by the number ofoccupied households <strong>in</strong> the census tract. F<strong>in</strong>ally, we adjusted downward the participationdensities <strong>in</strong> the downtown Loop community area to account for the relatively largenumber of bus<strong>in</strong>ess addresses from this part of the city <strong>in</strong> our database. The purpose ofestimat<strong>in</strong>g these variations <strong>in</strong> our statistical model was to see whether our f<strong>in</strong>d<strong>in</strong>gs onethnic composition of a community were sensitive to our specification and assumptionsabout the data.The unit of analysis was the census tract. There are 865 such tracts <strong>in</strong> <strong>Chicago</strong>. Becausewe excluded tracts with small numbers of people, we used only 810.55
Appendix IVGlossaryArts participation/audience participation:Individuals who have through an action, or aseries of actions, engaged themselves withone or more of the partner<strong>in</strong>g organizations,result<strong>in</strong>g <strong>in</strong> their name and address be<strong>in</strong>g<strong>in</strong>cluded on a mail<strong>in</strong>g list.Census tracts: The U.S. Census Bureaudef<strong>in</strong>es census tracts to be small, relativelypermanent statistical subdivisions of acounty. They are relatively compact,cont<strong>in</strong>uous land areas. Tract boundariesnormally follow visible features, such asroads, but may follow governmental unitboundaries. They are <strong>in</strong>tended to berelatively homogeneous units with respectto population characteristics, economicstatus, and liv<strong>in</strong>g conditions. Census tractsaverage about 4,000 <strong>in</strong>habitants. (Source:U.S. Census Bureau website)<strong>Chicago</strong> metropolitan statistical area(CMSA): the fourteen-county area that<strong>in</strong>cludes Cook, DeKalb, DuPage, Grundy,Kane, Kendall, Lake, McHenry, and WillCounties <strong>in</strong> Ill<strong>in</strong>ois; Kenosha County <strong>in</strong>Wiscons<strong>in</strong>; and Jasper, Lake, Newton, andPorter Counties <strong>in</strong> Indiana.Community: def<strong>in</strong>ed as either a censustract, which typically consists of approximately4,000 residents; a community area<strong>in</strong> the City of <strong>Chicago</strong>; or a township <strong>in</strong> thesurround<strong>in</strong>g suburbs.Community areas: districts that weredel<strong>in</strong>eated <strong>in</strong> the 1920s to identify areas witha dist<strong>in</strong>ct history and community awareness.Data: records of the study’s partner<strong>in</strong>garts and culture <strong>in</strong>stitutions. Each data po<strong>in</strong>tis an adm<strong>in</strong>istrative record of a transactionbetween the <strong>in</strong>stitution and an <strong>in</strong>dividual orhousehold.Density of participation: a measure of theproportion of households <strong>in</strong> a communitythat participate <strong>in</strong> an arts organization ororganizations. It is def<strong>in</strong>ed as the ratio ofthe number of households that appear <strong>in</strong>the databases of these organizations dividedby the total number of households <strong>in</strong> thecommunity.Diverse <strong>in</strong>stitutions: organizations whosemission statements explicitly identify theirpurpose as represent<strong>in</strong>g and/or target<strong>in</strong>gmultiple ethnic or cultural groups.Educational atta<strong>in</strong>ment: refers to thepercentage of adults <strong>in</strong> an area who are25 or older who have a bachelor’s degree orhigher.Ethnically/culturally specific <strong>in</strong>stitutions:organizations whose mission statementsexplicitly identify their purpose as represent<strong>in</strong>gand/or target<strong>in</strong>g a particular ethnicor cultural group.Household: <strong>in</strong>cludes all the persons whooccupy a hous<strong>in</strong>g unit. A hous<strong>in</strong>g unit is ahouse, an apartment, a mobile home, agroup of rooms, or a s<strong>in</strong>gle room that isoccupied (or if vacant, is <strong>in</strong>tended foroccupancy) as separate liv<strong>in</strong>g quarters.The occupants may be a s<strong>in</strong>gle family, oneperson liv<strong>in</strong>g alone, two or more familiesliv<strong>in</strong>g together, or any other group of relatedor unrelated persons who share liv<strong>in</strong>garrangements. (Source: U.S. Census Bureauwebsite)Larger <strong>in</strong>stitutions: arts and culture<strong>in</strong>stitutions whose total revenue exceeds$8 million.Median household <strong>in</strong>come: an approximatemeasure of the household <strong>in</strong>come of thetypical household <strong>in</strong> an area. It divides thehousehold <strong>in</strong>come distribution <strong>in</strong>to twoequal parts: one-half of the cases fall belowthe median household <strong>in</strong>come, and onehalfabove it. (Source: U.S. Census Bureauwebsite)Mid-size and small <strong>in</strong>stitutions: arts andculture <strong>in</strong>stitutions whose total revenue isunder $8 million.Nonrespondents: those arts and cultureorganizations that did not participate <strong>in</strong>the study.Partner<strong>in</strong>g organizations: those arts andcultural organizations that participated <strong>in</strong>the study by submitt<strong>in</strong>g their mail<strong>in</strong>g lists.56
RecommendedReferencesSurvey ResearchThe Arts Market<strong>in</strong>g <strong>Center</strong>. 1999. Barriers and Motivations to Increased Arts Usageamong Medium and Light Users. <strong>Chicago</strong>: Arts & Bus<strong>in</strong>ess Council of <strong>Chicago</strong>.DiMaggio, Paul and Francie Ostrower. 1992. Race, Ethnicity and <strong>Participation</strong> <strong>in</strong> the Arts:Patterns of <strong>Participation</strong> by Hispanics, Whites, and African Americans <strong>in</strong> SelectedActivities from the 1982 and 1985 Surveys of Public <strong>Participation</strong> <strong>in</strong> the Arts. SantaAna: Seven Locks Press.Hendon, William S. 1990. “The General Public’s <strong>Participation</strong> <strong>in</strong> Art Museums: VisitorsDiffer from Non-Visitors, but Not as Markedly as Case Studies Have Indicated.” TheAmerican Journal of Economics and Sociology 49 (4):439-457.Metro <strong>Chicago</strong> Information <strong>Center</strong> (MCIC). 2005. Arts <strong>Participation</strong> <strong>in</strong> the Metropolitan<strong>Chicago</strong> Region: Grow<strong>in</strong>g Audiences <strong>in</strong> a Region of <strong>Cultural</strong> Over-Achievers. <strong>Chicago</strong>:Metro <strong>Chicago</strong> Information <strong>Center</strong>.National Endowment for the Arts. 1984. Studies of the Arts Public: A Status Report.Research Division, Note 8.— . 1985. Audience Crossover: Media <strong>Participation</strong> and Attend<strong>in</strong>g Live Events. ResearchDivision, Note 12.— . 1986. Age, Desire, and Barriers to Increase Attendance at Perform<strong>in</strong>g Arts Events andArt Museums. Research Division, Note 14.— . 1986. Population Location and the Barriers of ‘Art Form Not Available’ and ‘Too FarTo Go.’ Research Division, Note 18.— . 1986. Public <strong>Participation</strong> <strong>in</strong> the Arts by Urban and Rural Residence. ResearchDivision, Note 18.— . 1987. Public <strong>Participation</strong> <strong>in</strong> the Arts: 1982 and 1985 Compared. Research Division,Note 27.— . 1993. Public <strong>Participation</strong> <strong>in</strong> the Arts: 1982 and 1992. Research Division, Note 50.— . 1994. Demographic Differences <strong>in</strong> Arts Attendance: 1982-1992. Research Division,Note 51.— . 1994. Demographic Differences <strong>in</strong> Arts <strong>Participation</strong> via Broadcast and RecordedMedia: 1982-1992. Research Division, Note 52.— . 1995. Public <strong>Participation</strong> <strong>in</strong> the Arts <strong>in</strong> Regional and Metropolitan Areas, 1982-1992.Research Division, Note 55.— . 1999. “Executive Summary.” 1997 Survey of Public <strong>Participation</strong> <strong>in</strong> the Arts: SummaryReport. Research Division, Report 39:http://www.arts.gov/pub/Researcharts/Summary39.html (accessed July 7, 2004).— . 1999. Demographic Characteristics of Arts Attendance, 1997. Research Division, Note71. http://www.arts.gov/pub/Notes/71.pdf (accessed July 7, 2004).Putnam, Robert D. 1995. “Bowl<strong>in</strong>g Alone: America’s Decl<strong>in</strong><strong>in</strong>g Social Capital.” Journal ofDemocracy 6: 65-77.Theoretical frameworksBalfe, Judith Hugg<strong>in</strong>s and Margaret Wyszomirski. 1990. “The Political Consequences ofNon-<strong>Participation</strong> <strong>in</strong> the Arts.” Paper presented at the annual meet<strong>in</strong>g of theInternational Sociological Association.57
<strong>Mapp<strong>in</strong>g</strong> <strong>Cultural</strong> <strong>Participation</strong> <strong>in</strong> <strong>Chicago</strong>Bergonzi, Louis and Julia Smith. 1996. Effects of Arts Education on <strong>Participation</strong> <strong>in</strong> theArts. National Endowment for the Arts Research Division, Report 36. Santa Ana:Seven Locks Press.Bourdieu, Pierre. 1984. Dist<strong>in</strong>ction: A Social Critique of the Judgment of Taste.Cambridge: Harvard University Press.DiMaggio, Paul. 1996. “Are Art-Museum Visitors Different from Other People? TheRelationship between Attendance and Social and Political Attitudes <strong>in</strong> the UnitedStates.” Poetics 24 (2-4):161-180.Halle, David. 1992. “The Audience for Abstract Art: Class, Culture, and Power.” InCultivat<strong>in</strong>g Differences: Symbolic Boundaries and the Mak<strong>in</strong>g of Inequality, edited byMichele Lamont and Marcel Fournier, 131-151. <strong>Chicago</strong>: University of <strong>Chicago</strong> Press.Jackson, Maria-Rosario, Joaqu<strong>in</strong> Herranz, and Florence Kabwasa-Green. 2003. “Artand Culture <strong>in</strong> Communities: Unpack<strong>in</strong>g <strong>Participation</strong>.” Culture, Creativity, andCommunities Program, <strong>Policy</strong> Brief No. 2. Wash<strong>in</strong>gton: The Urban Institute.http://www.urban.org/UploadedPDF/311006_unpack<strong>in</strong>g_participation.pdf(accessed March 10, 2005).McCarthy, Kev<strong>in</strong>, et al. 2001. “The Perform<strong>in</strong>g Arts <strong>in</strong> a New Era.” Santa Monica: RANDCorporation. http://www.pewtrust.org/pdf/cul_rand.pdf (accessed July 7, 2004).McCarthy, Kev<strong>in</strong>, Elizabeth Ondaatje, and Jennifer Novak. Forthcom<strong>in</strong>g. Arts and Culture<strong>in</strong> the Metropolis: Strategies for Susta<strong>in</strong>ability. Santa Monica: RAND Corporation.Exam<strong>in</strong>ations of arts activities <strong>in</strong> specific localesGrams, Diane and Michael Warr. 2003. Leverag<strong>in</strong>g Assets: How Small Budget ArtsActivities Benefit Neighborhoods. The John D. and Cather<strong>in</strong>e T. MacArthurFoundation.http://www.macfound.org/documents/docs/small_budget_arts_activities.doc(accessed July 7, 2004).Markusen, Ann and David K<strong>in</strong>g. 2003. “The Artistic Dividend: the Arts’ HiddenContributions to Regional Development.” M<strong>in</strong>neapolis: Project on Regionaland Industrial Economics, University of M<strong>in</strong>nesota.http://www.hhh.umn.edu/img/assets/6158/artistic_dividend.pdf (accessed March 7,2006).Stern, Mark J. 1997. “Dimensions of Regional Arts and <strong>Cultural</strong> <strong>Participation</strong>: Individualand Neighborhood Effects on <strong>Participation</strong> <strong>in</strong> the Philadelphia Metropolitan Area.”Social Impact of the Arts Project, Work<strong>in</strong>g Paper #6. University of PennsylvaniaSchool of Social Work. http://www.ssw.upenn.edu/SIAP/wp6txt.with%20tabs.figs.pdf(accessed July 7, 2004).Studies offer<strong>in</strong>g new methods for <strong>in</strong>creas<strong>in</strong>g audience participationLarios, Maria del Carmen. 2002. “Plann<strong>in</strong>g for the Pueblo: Lat<strong>in</strong>o Audience Developmentat the Art Institute of <strong>Chicago</strong>.” Unpublished master’s thesis, School of the ArtInstitute of <strong>Chicago</strong>.Ostrower, Francie. 2003. “<strong>Cultural</strong> Collaborations: Build<strong>in</strong>g Partnerships for Arts<strong>Participation</strong>.” Wash<strong>in</strong>gton: The Urban Institute.http://wallacefoundation.org/NR/rdonlyres/138C1DA0-3E24-41AA-86BB-68BE6CBE01AF/0/<strong>Cultural</strong>Collaborations.pdf (accessed July 7, 2004).58 Recommended ReferencesPeterson, Richard A. 1980. “Arts Audience Statistics and Culture Indicators: A Review ofComplementary Approaches.” Wash<strong>in</strong>gton, D.C.: National Endowment for the Arts.