2010 San Dimas System UWMP - Golden State Water Company
2010 San Dimas System UWMP - Golden State Water Company
2010 San Dimas System UWMP - Golden State Water Company

Create successful ePaper yourself
Turn your PDF publications into a flip-book with our unique Google optimized e-Paper software.
Final Report<strong>2010</strong> Urban <strong>Water</strong> Management Plan<strong>San</strong> <strong>Dimas</strong>Corporate Office630 E. Foothill Blvd.<strong>San</strong> <strong>Dimas</strong> CA 91773August 2011
Final Report<strong>2010</strong> Urban <strong>Water</strong> ManagementPlan—<strong>San</strong> <strong>Dimas</strong>Corporate Office630 E. Foothill Blvd.<strong>San</strong> <strong>Dimas</strong>, CA 91773August 201110850 Gold Center Drive, Suite 350Rancho Cordova, CA 95670
Table of ContentsList of Tables................................................................................................................................ ivList of Figures............................................................................................................................... viList of Appendices........................................................................................................................ viNotice of Adoption....................................................................................................................... viiAbbreviations ............................................................................................................................... ixDefinitions ...................................................................................................................................xiiiChapter 1: Plan Preparation ........................................................................ 1-11.1 Background .........................................................................................1-11.2 <strong>System</strong> Overview ................................................................................1-21.3 Notice of Document Use .....................................................................1-21.4 Public Utility Commission <strong>2010</strong> <strong>Water</strong> Action Plan .............................1-51.5 Agency Coordination and Public Participation ....................................1-51.6 Plan Adoption and Submittal...............................................................1-71.7 <strong>UWMP</strong> Preparation .............................................................................1-81.8 <strong>UWMP</strong> Implementation .......................................................................1-81.9 Content of the <strong>UWMP</strong> .........................................................................1-81.10 Resource Optimization......................................................................1-10Chapter 2: <strong>System</strong> Description ................................................................... 2-12.1 Area.....................................................................................................2-12.2 Demographics .....................................................................................2-12.3 Population, Housing and Employment ................................................2-52.3.1 SCAG Population Projection Development Methodology ........2-52.3.2 Historical and Projected Population .........................................2-52.4 Climate ..............................................................................................2-10Chapter 3: <strong>Water</strong> Use .................................................................................. 3-13.1 Historical <strong>Water</strong> Use............................................................................3-23.2 <strong>Water</strong> Use Targets ..............................................................................3-33.2.1 Baseline Per Capita <strong>Water</strong> Use ...............................................3-43.2.2 Urban <strong>Water</strong> Use Targets ........................................................3-63.2.3 Interim and Compliance <strong>Water</strong> Use Targets ............................3-83.3 Projected <strong>Water</strong> Use ...........................................................................3-83.4 Sales to Other Agencies....................................................................3-133.5 Other <strong>Water</strong> Uses and <strong>System</strong> Losses .............................................3-133.6 Total <strong>Water</strong> Demand .........................................................................3-143.7 Data Provided to Wholesale Agency.................................................3-153.8 Disadvantaged Community <strong>Water</strong> Use Projections ..........................3-16Final Report, <strong>2010</strong> Urban <strong>Water</strong> Management Plan – <strong>San</strong> <strong>Dimas</strong><strong>Golden</strong> <strong>State</strong> <strong>Water</strong> <strong>Company</strong>g:\adminasst\jobs\<strong>2010</strong>\1070001.00_gswc-uwmp\09-reports\9.09-reports\2011-08\grp2b\gswc_sandimas_<strong>2010</strong>_uwmp-final.doci
Table of Contents (cont’d)Chapter 4: <strong>Water</strong> Supply ............................................................................. 4-14.1 <strong>Water</strong> Sources ....................................................................................4-24.2 Purchased <strong>Water</strong> ................................................................................4-34.3 Groundwater .......................................................................................4-44.3.1 Main <strong>San</strong> Gabriel Basin Adjudication.......................................4-54.4 Transfers and Exchanges ...................................................................4-84.5 Planned <strong>Water</strong> Supply Projects and Programs...................................4-84.6 Wholesale Agency Supply Data..........................................................4-94.7 Desalination ......................................................................................4-104.8 Recycled <strong>Water</strong> Plan ........................................................................4-114.8.1 Coordination ..........................................................................4-124.8.2 Wastewater Quantity, Quality, and Current Uses ..................4-124.8.3 Potential and Projected Use ..................................................4-144.8.4 Optimization and Incentives for Recycled <strong>Water</strong> Use............4-15Chapter 5: <strong>Water</strong> Quality............................................................................. 5-15.1 GSWC Measures for <strong>Water</strong> Quality Regulation Compliance ..............5-15.2 <strong>Water</strong> Quality Issues...........................................................................5-15.2.1 Surface <strong>Water</strong> Quality..............................................................5-25.2.2 Groundwater Quality Management..........................................5-25.2.3 Groundwater Quality................................................................5-25.2.4 Distribution <strong>System</strong> <strong>Water</strong> Quality ...........................................5-45.3 Projected <strong>Water</strong> Quality Impacts.........................................................5-5Chapter 6: <strong>Water</strong> Supply Reliability ............................................................ 6-16.1 Reliability of Supply.............................................................................6-16.1.1 Reliability of Purchased <strong>Water</strong> from TVMWD ..........................6-16.1.1.1 Metropolitan Supply Reliability ..............................6-26.1.1.2 TVMWD’s <strong>Water</strong> Supply Reliability .......................6-36.1.2 CIC’s <strong>Water</strong> Supply Reliability .................................................6-46.1.3 Groundwater Supply Reliability................................................6-46.1.4 <strong>San</strong> <strong>Dimas</strong> <strong>System</strong>’s <strong>Water</strong> Supply Reliability.........................6-56.1.5 Factors Resulting in Inconsistency of Supply ..........................6-76.2 Normal <strong>Water</strong> Year Analysis...............................................................6-76.3 Single-Dry-Year Analysis ....................................................................6-86.4 Multiple-Dry-Year Analysis..................................................................6-8Chapter 7:Conservation Program and Demand ManagementMeasures ................................................................................... 7-17.1 Conservation Program Background....................................................7-27.2 Implementation of BMPs/DMMs..........................................................7-47.3 Foundational DMMs............................................................................7-47.3.1 Utility Operations .....................................................................7-47.3.1.1 Conservation Coordinator......................................7-4iiFinal Report, <strong>2010</strong> Urban <strong>Water</strong> Management Plan – <strong>San</strong> <strong>Dimas</strong><strong>Golden</strong> <strong>State</strong> <strong>Water</strong> <strong>Company</strong>g:\adminasst\jobs\<strong>2010</strong>\1070001.00_gswc-uwmp\09-reports\9.09-reports\2011-08\grp2b\gswc_sandimas_<strong>2010</strong>_uwmp-final.doc
Table of Contents (cont’d)7.3.1.2 <strong>Water</strong> Waste Prevention........................................7-47.3.1.3 <strong>Water</strong> Loss Control ................................................7-57.3.1.4 Metering with Commodity Rates for All NewConnections and Retrofit of ExistingConnections...........................................................7-67.3.1.5 Retail Conservation Pricing ...................................7-67.3.1.6 Education...............................................................7-77.3.1.7 Methods Used to Evaluate Effectiveness and<strong>Water</strong> Savings from Foundational BMPs ...............7-87.4 Programmatic DMMs...........................................................................7-87.4.1 Residential DMMs....................................................................7-97.4.1.1 Residential Assistance Programs ..........................7-97.4.1.2 Landscape <strong>Water</strong> Surveys.....................................7-97.4.1.3 High-Efficiency Clothes Washers...........................7-97.4.1.4 <strong>Water</strong>Sense Specification (WSS) Toilets...............7-97.4.1.5 <strong>Water</strong> Sense Specification for ResidentialDevelopment........................................................7-107.4.1.6 Commercial, Industrial, and InstitutionalDMMs ..................................................................7-107.4.1.7 Large Landscape .................................................7-107.5 SBX7-7 Compliance Approach..........................................................7-107.5.1 Consideration of Economic Impacts.......................................7-12Chapter 8: <strong>Water</strong> Shortage Contingency Plan ............................................ 8-18.1 Action Stages ......................................................................................8-18.2 Minimum Supply..................................................................................8-38.3 Catastrophic Supply Interruption Plan.................................................8-48.4 Prohibitions, Penalties, and Consumption Reduction Methods...........8-68.5 Revenue Impacts of Reduced Sales...................................................8-88.6 <strong>Water</strong>-Use Monitoring Procedures....................................................8-10Chapter 9: References................................................................................. 9-1Final Report, <strong>2010</strong> Urban <strong>Water</strong> Management Plan – <strong>San</strong> <strong>Dimas</strong><strong>Golden</strong> <strong>State</strong> <strong>Water</strong> <strong>Company</strong>g:\adminasst\jobs\<strong>2010</strong>\1070001.00_gswc-uwmp\09-reports\9.09-reports\2011-08\grp2b\gswc_sandimas_<strong>2010</strong>_uwmp-final.dociii
Table of Contents (cont’d)List of TablesTable 1-1: Coordination with Agencies................................................................................1-6Table 1-2: Summary of <strong>UWMP</strong> Chapters and Corresponding Provisions of theCalifornia <strong>Water</strong> Code ........................................................................................1-9Table 2-1: <strong>San</strong> <strong>Dimas</strong> <strong>System</strong> Historical Population ...........................................................2-6Table 2-2: <strong>San</strong> <strong>Dimas</strong> <strong>System</strong> Historical and Projected Population....................................2-9Table 2-3: Monthly Average Climate Data Summary for <strong>San</strong> <strong>Dimas</strong> <strong>System</strong> ...................2-11Table 3-1: Historical <strong>Water</strong> Use (ac-ft/yr) by Customer Type..............................................3-3Table 3-2: Base Period Ranges ..........................................................................................3-5Table 3-3: 1997-<strong>2010</strong> Base Daily Use Calculation..............................................................3-5Table 3-4: 10-Year Average Base Daily Per Capita <strong>Water</strong> Use ..........................................3-6Table 3-5: 5-Year Average Base Daily Per Capita <strong>Water</strong> Use ............................................3-6Table 3-6: 2020 <strong>Water</strong> Use Target Method 1 Calculation Summary...................................3-7Table 3-7: 2020 <strong>Water</strong> Use Target Method 3 Calculation Summary...................................3-7Table 3-8: Minimum 2020 Reduction...................................................................................3-8Table 3-9: SBX7-7 <strong>Water</strong> Use Reduction Targets (gpcd) ...................................................3-8Table 3-10: <strong>Water</strong> Use Factors for the <strong>San</strong> <strong>Dimas</strong> <strong>System</strong>.................................................3-10Table 3-11: Projections of the Number of Metered Service Connections and <strong>Water</strong>Use for the <strong>San</strong> <strong>Dimas</strong> <strong>System</strong> ........................................................................3-12Table 3-12: Sales to Other Agencies in ac-ft/yr...................................................................3-13Table 3-13: Additional <strong>Water</strong> Uses and Losses in ac-ft/yr...................................................3-13Table 3-14: Projected Total <strong>Water</strong> Demand and SBX7-7 Compliance Projections inac-ft/yr ..............................................................................................................3-14Table 3-15: Summary of <strong>San</strong> <strong>Dimas</strong> <strong>System</strong> Data Provided to TVMWD in ac-ft/yr ............3-15Table 3-16: Low-Income Projected <strong>Water</strong> Demands in ac-ft/yr...........................................3-16Table 4-1: Current and Planned <strong>Water</strong> Supplies for the <strong>San</strong> <strong>Dimas</strong> <strong>System</strong> in ac-ft/yr ......4-3Table 4-2: Main <strong>San</strong> Gabriel Basin Groundwater Pumping Rights .....................................4-6Table 4-3: Well Name and Capacity....................................................................................4-7Table 4-4: Groundwater Pumping History by <strong>San</strong> <strong>Dimas</strong> <strong>System</strong> (2005 to <strong>2010</strong>) inac-ft ....................................................................................................................4-7Table 4-5: Projected Groundwater Pumping Amounts by <strong>San</strong> <strong>Dimas</strong> <strong>System</strong> to 2035in ac/ft.................................................................................................................4-8Table 4-6: Transfer and Exchange Opportunities................................................................4-8Table 4-7: Future <strong>Water</strong> Supply Projects in ac-ft.................................................................4-9Table 4-8: Existing and Planned Wholesale Sources in ac-ft/yr..........................................4-9Table 4-9: Reliability of Wholesale Supply for Year 2035 in ac-ft/yr..................................4-10Table 4-10: Factors Affecting Wholesale Supply.................................................................4-10Table 4-11: Summary of Opportunities for <strong>Water</strong> Desalination ...........................................4-11Table 4-12: Role of Participating Agencies in the Development of the Recycled <strong>Water</strong>Plan ..................................................................................................................4-12Table 4-13: Estimates of Existing and Projected Wastewater Collection andTreatment in ac-ft/yr (mgd) for the <strong>San</strong> <strong>Dimas</strong> <strong>System</strong> ....................................4-13ivFinal Report, <strong>2010</strong> Urban <strong>Water</strong> Management Plan – <strong>San</strong> <strong>Dimas</strong><strong>Golden</strong> <strong>State</strong> <strong>Water</strong> <strong>Company</strong>g:\adminasst\jobs\<strong>2010</strong>\1070001.00_gswc-uwmp\09-reports\9.09-reports\2011-08\grp2b\gswc_sandimas_<strong>2010</strong>_uwmp-final.doc
Table of Contents (cont’d)Table 4-14: Estimates of Existing and Projected Disposal of Non-RecycledWastewater in ac-ft/yr (mgd) for the <strong>San</strong> <strong>Dimas</strong> <strong>System</strong>..................................4-14Table 4-15: Existing Recycled <strong>Water</strong> Use in the <strong>San</strong> <strong>Dimas</strong> <strong>System</strong>..................................4-14Table 4-16: Potential Future Recycled <strong>Water</strong> Uses in ac-ft/yr.............................................4-15Table 4-17: Projected Future Recycled <strong>Water</strong> Use in Service Area in ac-ft/yr ....................4-15Table 4-18: Comparison of Recycled <strong>Water</strong> Uses—Year 2005 Projections versus<strong>2010</strong> Actual.......................................................................................................4-15Table 4-19: Methods to Encourage Recycled <strong>Water</strong> Use and the Resulting ProjectedUse in ac-ft/yr ...................................................................................................4-15Table 5-1: Summary of Assessment....................................................................................5-4Table 5-2: Summary of Projected <strong>Water</strong> Supply Changes Due to <strong>Water</strong> QualityIssues in ac-ft/yr .................................................................................................5-5Table 6-1: Supply Reliability for the <strong>San</strong> <strong>Dimas</strong> <strong>System</strong> for Year 2035 in ac-ft/yr...............6-6Table 6-2: Basis of <strong>Water</strong> Year Data ...................................................................................6-7Table 6-3: Factors Resulting in Inconsistency of Supply .....................................................6-7Table 6-4: Comparison of Projected Normal Year Supply and Demand .............................6-7Table 6-5: Comparison of Projected Supply and Demand for Single-Dry Year...................6-8Table 6-6: Projected Multiple-Dry Year <strong>Water</strong> Supply and Demand Assessment...............6-9Table 7-1: CUWCC BMP and <strong>UWMP</strong> DMMs Organization and Names .............................7-3Table 7-2: <strong>Water</strong> Loss Control Evaluation Summary...........................................................7-6Table 7-3: Outreach Activities..............................................................................................7-7Table 7-4: School Education Activities ................................................................................7-8Table 8-1: <strong>Water</strong> Supply Shortage Stages and Conditions .................................................8-2Table 8-2: Three-Year Estimated Minimum <strong>Water</strong> Supply in ac-ft/yr ..................................8-4Table 8-3: Summary of Actions for Catastrophic Events .....................................................8-5Table 8-4: Summary of Mandatory Prohibitions ..................................................................8-6Table 8-5: Summary of Penalties and Charges for Excessive Use .....................................8-7Table 8-6: Summary of Consumption Reduction Methods ..................................................8-8Table 8-7: Summary of Actions and Conditions that Impact Revenue ................................8-9Table 8-8: Summary of Actions and Conditions that Impact Expenditures..........................8-9Table 8-9: Proposed Measures to Overcome Revenue Impacts.........................................8-9Table 8-10: Proposed Measures to Overcome Expenditure Impacts ....................................8-9Table 8-11: <strong>Water</strong>-Use Monitoring Mechanisms .................................................................8-10Final Report, <strong>2010</strong> Urban <strong>Water</strong> Management Plan – <strong>San</strong> <strong>Dimas</strong><strong>Golden</strong> <strong>State</strong> <strong>Water</strong> <strong>Company</strong>g:\adminasst\jobs\<strong>2010</strong>\1070001.00_gswc-uwmp\09-reports\9.09-reports\2011-08\grp2b\gswc_sandimas_<strong>2010</strong>_uwmp-final.docv
Table of Contents (cont’d)List of FiguresFigure 1-1: <strong>San</strong> <strong>Dimas</strong> <strong>System</strong> Location Map ......................................................................1-3Figure 2-1: <strong>San</strong> <strong>Dimas</strong> <strong>System</strong> Service Area .......................................................................2-3Figure 2-2: <strong>San</strong> <strong>Dimas</strong> <strong>System</strong> Service Area with Census Tract Boundary .........................2-7Figure 2-3: Historical and Projected Population, Household and Employment Growthwithin the <strong>San</strong> <strong>Dimas</strong> <strong>System</strong>...........................................................................2-10Figure 2-4: Monthly Average Precipitation at Pomona Station Based on 100-YearHistorical Data ..................................................................................................2-12Figure 3-1: Historical Number of Metered Service Connections and <strong>Water</strong> Use..................3-2Figure 3-2: Historical and Projected Number of Metered Service Connections ...................3-9Figure 3-3: Historical <strong>Water</strong> Use and Future <strong>Water</strong> Use Projections ...................................3-9Figure 3-4: Projected <strong>Water</strong> Use by Customer Type..........................................................3-11Figure 3-5: Total <strong>Water</strong> Demand ........................................................................................3-15List of AppendicesAppendix AAppendix BAppendix CAppendix DAppendix EAppendix FAppendix GAppendix HAppendix IAppendix JUrban <strong>Water</strong> Management Planning ActPublic Hearing Notices, Notifications and Meeting MinutesCouncil Annual Reports for Demand Management MeasuresCPUC <strong>Water</strong> Conservation and Rationing Rules and RegulationsDMM Supporting DocumentsGroundwater Basin <strong>Water</strong> Rights Stipulation/JudgmentSummary of Population Based on Census DataDocumentation of Submittal to Library, Cities and CountiesDocumentation of <strong>Water</strong> Use Projections SubmittalUrban <strong>Water</strong> Management Plan ChecklistviFinal Report, <strong>2010</strong> Urban <strong>Water</strong> Management Plan – <strong>San</strong> <strong>Dimas</strong><strong>Golden</strong> <strong>State</strong> <strong>Water</strong> <strong>Company</strong>g:\adminasst\jobs\<strong>2010</strong>\1070001.00_gswc-uwmp\09-reports\9.09-reports\2011-08\grp2b\gswc_sandimas_<strong>2010</strong>_uwmp-final.doc
Notice of AdoptionA meeting to solicit public comments on the <strong>2010</strong> Urban <strong>Water</strong> Management Plan for the<strong>Golden</strong> <strong>State</strong> <strong>Water</strong> <strong>Company</strong> <strong>San</strong> <strong>Dimas</strong> <strong>System</strong> was held on July 19, 2011 at 6 p.m. at the<strong>San</strong> <strong>Dimas</strong> Community Center in <strong>San</strong> <strong>Dimas</strong>, California. Notice of this meeting was published inaccordance with Section 6066 of the Government Code in the <strong>San</strong> Gabriel Valley Tribune onMay 17, 22, and June 15, 2011.Copies of the Urban <strong>Water</strong> Management Plan were made available to the public at the <strong>Golden</strong><strong>State</strong> <strong>Water</strong> <strong>Company</strong> Customer Service Office in <strong>San</strong> <strong>Dimas</strong>, California at least one week priorto the public hearing.<strong>Golden</strong> <strong>State</strong> <strong>Water</strong> <strong>Company</strong>, hereby, adopts the <strong>2010</strong> Urban <strong>Water</strong> Management Plan for the<strong>San</strong> <strong>Dimas</strong> <strong>System</strong>.William C. GedneyVice President, Asset Management<strong>Golden</strong> <strong>State</strong> <strong>Water</strong> <strong>Company</strong>August 31, 2011Final Report, <strong>2010</strong> Urban <strong>Water</strong> Management Plan – <strong>San</strong> <strong>Dimas</strong><strong>Golden</strong> <strong>State</strong> <strong>Water</strong> <strong>Company</strong>g:\adminasst\jobs\<strong>2010</strong>\1070001.00_gswc-uwmp\09-reports\9.09-reports\2011-08\grp2b\gswc_sandimas_<strong>2010</strong>_uwmp-final.docvii
THIS PAGE INTENTIONALLY BLANKviiiFinal Report, <strong>2010</strong> Urban <strong>Water</strong> Management Plan – <strong>San</strong> <strong>Dimas</strong><strong>Golden</strong> <strong>State</strong> <strong>Water</strong> <strong>Company</strong>g:\adminasst\jobs\<strong>2010</strong>\1070001.00_gswc-uwmp\09-reports\9.09-reports\2011-08\grp2b\gswc_sandimas_<strong>2010</strong>_uwmp-final.doc
Abbreviationsac-ftac-ft/yr or AFYActAMRAWWABMPsCal EMACAL Green CodeccfCDPHCICCIICIMISCOGCouncil or CUWCCCPUCCRADMMDOFDSCDWFDWRDWR Guidebookacre-feetacre-feet per yearUrban <strong>Water</strong> Management Planning Actautomatic meter readingAmerican <strong>Water</strong> Works Associationbest management practicesCalifornia Emergency Management AgencyCalifornia Green Building Standards Codehundred cubic feetCalifornia Department of Public HealthCovina Irrigating <strong>Company</strong>commercial, industrial, institutionalCalifornia Irrigation Management Information <strong>System</strong>Council of GovernmentsCalifornia Urban <strong>Water</strong> Conservation CouncilCalifornia Public Utilities CommissionColorado River AqueductDemand Management MeasureDepartment of FinanceDiscovery Science Centerdry weather flowDepartment of <strong>Water</strong> Resources (California)Guidebook to Assist <strong>Water</strong> Suppliers in the Preparation of a<strong>2010</strong> Urban <strong>Water</strong> Management PlanFinal Report, <strong>2010</strong> Urban <strong>Water</strong> Management Plan – <strong>San</strong> <strong>Dimas</strong><strong>Golden</strong> <strong>State</strong> <strong>Water</strong> <strong>Company</strong>g:\adminasst\jobs\<strong>2010</strong>\1070001.00_gswc-uwmp\09-reports\9.09-reports\2011-08\grp2b\gswc_sandimas_<strong>2010</strong>_uwmp-final.docix
ERPEToGACGISgpcdgpdgpmGSWCHCDHECWHETILIIRPLACSDMAFMCLMetropolitanMFmgdMOUmslN/ANAICSO&MOSYpCi/LEmergency Response PlanevapotranspirationGranular Activated CarbonGeographic Information <strong>System</strong>gallons per capita daygallons per dayU.S. gallons per minute<strong>Golden</strong> <strong>State</strong> <strong>Water</strong> <strong>Company</strong>Housing and Community Developmenthigh efficiency clothes washershigh efficiency toiletsinfrastructure leakage indexIntegrated Resources Plan<strong>San</strong>itation Districts of Los Angeles Countymillion acre-feet per yearmaximum contaminant levelMetropolitan <strong>Water</strong> District of Southern Californiamulti-familymillion gallons per daymemorandum of understanding (regarding urban waterconservation in California)mean sea levelnot available, not applicableNorth American Industry Classification <strong>System</strong>operation and maintenanceoperating safe yieldpicoCuries per literxFinal Report, <strong>2010</strong> Urban <strong>Water</strong> Management Plan – <strong>San</strong> <strong>Dimas</strong><strong>Golden</strong> <strong>State</strong> <strong>Water</strong> <strong>Company</strong>g:\adminasst\jobs\<strong>2010</strong>\1070001.00_gswc-uwmp\09-reports\9.09-reports\2011-08\grp2b\gswc_sandimas_<strong>2010</strong>_uwmp-final.doc
RAPRHNARTPResource Action ProgramsRegional Housing Needs AllocationRegional Transportation PlanSBX7-7 Senate Bill X7-7, The <strong>Water</strong> Conservation Act of 2009SCAGSDSDWASFSMUDSWPTAFTDSTOCTVMWDUpper DistrictUSEPA<strong>UWMP</strong>VOCsWAPWLCDWRCCWRPWSAPWSDM PlanWSSWYSouthern California Association of GovernmentsScience DiscoverSafe Drinking <strong>Water</strong> Actsingle-familySacramento Municipal Utility District<strong>State</strong> <strong>Water</strong> Projectthousand acre-feet per yeartotal dissolved solidstotal organic carbonThree Valleys Municipal <strong>Water</strong> DistrictUpper <strong>San</strong> Gabriel Valley Municipal <strong>Water</strong> DistrictU.S. Environmental Protection AgencyUrban <strong>Water</strong> Management Planvolatile organic compounds<strong>Water</strong> Action Plan<strong>Water</strong> Loss Control DepartmentWestern Regional Climate Centerwater reclamation plant<strong>Water</strong> Supply Allocation Plan<strong>Water</strong> Surplus and Drought Management Plan<strong>Water</strong>Sense Specificationwater yearFinal Report, <strong>2010</strong> Urban <strong>Water</strong> Management Plan – <strong>San</strong> <strong>Dimas</strong><strong>Golden</strong> <strong>State</strong> <strong>Water</strong> <strong>Company</strong>g:\adminasst\jobs\<strong>2010</strong>\1070001.00_gswc-uwmp\09-reports\9.09-reports\2011-08\grp2b\gswc_sandimas_<strong>2010</strong>_uwmp-final.docxi
THIS PAGE INTENTIONALLY BLANKxiiFinal Report, <strong>2010</strong> Urban <strong>Water</strong> Management Plan – <strong>San</strong> <strong>Dimas</strong><strong>Golden</strong> <strong>State</strong> <strong>Water</strong> <strong>Company</strong>g:\adminasst\jobs\<strong>2010</strong>\1070001.00_gswc-uwmp\09-reports\9.09-reports\2011-08\grp2b\gswc_sandimas_<strong>2010</strong>_uwmp-final.doc
DefinitionsChapter 2, Part 2.6, Division 6 of the California <strong>Water</strong> Code provides definitions for theconstruction of the Urban <strong>Water</strong> Management Plans. Appendix A contains the full text of theUrban <strong>Water</strong> Management Planning Act.CHAPTER 2. DEFINITIONSSection 10611. Unless the context otherwise requires, the definitions of this chapter govern the construction ofthis part.Section 10611.5. “Demand management” means those water conservation measures, programs, andincentives that prevent the waste of water and promote the reasonable and efficient use and reuse of availablesupplies.Section 10612. “Customer” means a purchaser of water from a water supplier who uses the water for municipalpurposes, including residential, commercial, governmental, and industrial uses.Section 10613. “Efficient use” means those management measures that result in the most effective use ofwater so as to prevent its waste or unreasonable use or unreasonable method of use.Section 10614. “Person” means any individual, firm, association, organization, partnership, business, trust,corporation, company, public agency, or any agency of such an entity.Section 10615. “Plan” means an urban water management plan prepared pursuant to this part. A plan shalldescribe and evaluate sources of supply, reasonable and practical efficient uses, and reclamation and demandmanagement activities. The components of the plan may vary according to an individual community or area’scharacteristics and its capabilities to efficiently use and conserve water. The plan shall address measures forresidential, commercial, governmental, and industrial water demand management as set forth in Article 2(commencing with Section 10630) of Chapter 3. In addition, a strategy and time schedule for implementationshall be included in the plan.Section 10616. “Public agency” means any board, commission, county, city and county, city, regional agency,district, or other public entity.Section 10616.5. “Recycled water” means the reclamation and reuse of wastewater for beneficial use.Section 10617. “Urban water supplier” means a supplier, either publicly or privately owned, providing water formunicipal purposes either directly or indirectly to more than 3,000 customers or supplying more than3,000 acre-feet of water annually. An urban water supplier includes a supplier or contractor for water,regardless of the basis of right, which distributes or sells for ultimate resale to customers. This part applies onlyto water supplied from public water systems subject to Chapter 4 (commencing with Section 116275) of Part 12of Division 104 of the Health and Safety Code.Final Report, <strong>2010</strong> Urban <strong>Water</strong> Management Plan – <strong>San</strong> <strong>Dimas</strong><strong>Golden</strong> <strong>State</strong> <strong>Water</strong> <strong>Company</strong>g:\adminasst\jobs\<strong>2010</strong>\1070001.00_gswc-uwmp\09-reports\9.09-reports\2011-08\grp2b\gswc_sandimas_<strong>2010</strong>_uwmp-final.docxiii
THIS PAGE INTENTIONALLY BLANKxivFinal Report, <strong>2010</strong> Urban <strong>Water</strong> Management Plan – <strong>San</strong> <strong>Dimas</strong><strong>Golden</strong> <strong>State</strong> <strong>Water</strong> <strong>Company</strong>g:\adminasst\jobs\<strong>2010</strong>\1070001.00_gswc-uwmp\09-reports\9.09-reports\2011-08\grp2b\gswc_sandimas_<strong>2010</strong>_uwmp-final.doc
Chapter 1: Plan Preparation1.1 BackgroundThis Urban <strong>Water</strong> Management Plan (<strong>UWMP</strong>) has been prepared for the <strong>Golden</strong> <strong>State</strong> <strong>Water</strong><strong>Company</strong> (GSWC) <strong>San</strong> <strong>Dimas</strong> <strong>System</strong> in compliance with Division 6, Part 2.6, of the California<strong>Water</strong> Code, Sections 10608 through 10657 as last amended by Senate Bill No. 7 (SBX7-7), the<strong>Water</strong> Conservation Act of 2009. The original bill requiring preparation of an <strong>UWMP</strong> wasenacted in 1983. SBX7-7, which became law in November 2009, requires increased emphasison water demand management and requires the state to achieve a 20 percent reduction inurban per capita water use by December 31, 2020.Urban water suppliers having more than 3,000 service connections or water use of more than3,000 acre-feet per year (ac-ft/yr) for retail or wholesale are required to submit a <strong>UWMP</strong> every5 years to the California Department of <strong>Water</strong> Resources (DWR). The <strong>UWMP</strong> typically must besubmitted by December 31 of years ending in 0 and 5, however SBX7-7 extended the <strong>UWMP</strong>deadline to July 1, 2011 to provide for development by DWR of required evaluation methodologiesfor determining conservation goals. GSWC prepared an <strong>UWMP</strong> for the <strong>San</strong> <strong>Dimas</strong> <strong>System</strong> in1985, 1990, 1995, 2000, and 2005. This <strong>2010</strong> <strong>UWMP</strong> is an update to the 2005 plan.GSWC water use targets for the <strong>San</strong> <strong>Dimas</strong> <strong>System</strong> were developed based on ComplianceMethod 1 as described by SBX7-7 and supplemental guidance from DWR.The portion of the Urban <strong>Water</strong> Management Planning Act (Act) that describes the purpose andintent of the <strong>UWMP</strong> states and declares the following:Section 10610.2.(a) The Legislature finds and declares all of the following:(1) The waters of the state are a limited and renewable resource subject to ever-increasing demands.(2) The conservation and efficient use of urban water supplies are of statewide concern; however, theplanning for that use and the implementation of those plans can best be accomplished at the locallevel.(3) A long-term, reliable supply of water is essential to protect the productivity of California’s businessesand economic climate.(4) As part of its long-range planning activities, every urban water supplier should make every effort toensure the appropriate level of reliability in its water service sufficient to meet the needs of itsvarious categories of customers during normal, dry, and multiple dry water years.(5) Public health issues have been raised over a number of contaminants that have been identified incertain local and imported water supplies.(6) Implementing effective water management strategies, including groundwater storage projects andrecycled water projects, may require specific water quality and salinity targets for meetinggroundwater basins water quality objectives and promoting beneficial use of recycled water.(7) <strong>Water</strong> quality regulations are becoming an increasingly important factor in water agencies’ selectionof raw water sources, treatment alternatives, and modifications to existing treatment facilities.(8) Changes in drinking water quality standards may also impact the usefulness of water supplies andmay ultimately impact supply reliability.(9) The quality of source supplies can have a significant impact on water management strategies andsupply reliability.(b)This part is intended to provide assistance to water agencies in carrying out their long-term resourceplanning responsibilities to ensure adequate water supplies to meet existing and future demands forwater.Final Report, <strong>2010</strong> Urban <strong>Water</strong> Management Plan – <strong>San</strong> <strong>Dimas</strong> Page 1-1<strong>Golden</strong> <strong>State</strong> <strong>Water</strong> <strong>Company</strong>g:\adminasst\jobs\<strong>2010</strong>\1070001.00_gswc-uwmp\09-reports\9.09-reports\2011-08\grp2b\gswc_sandimas_<strong>2010</strong>_uwmp-final.doc
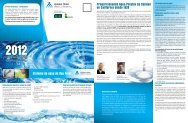
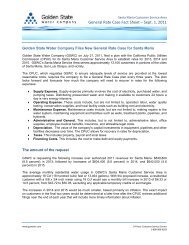
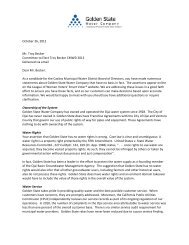
Section 10610.4. The Legislature finds and declares that it is the policy of the state as follows:(a) The management of urban water demands and efficient use of water shall be actively pursued to protectboth the people of the state and their water resources.(b) The management of urban water demands and efficient use of urban water supplies shall be a guidingcriterion in public decisions.(c) Urban water suppliers shall be required to develop water management plans to actively pursue theefficient use of available supplies.1.2 <strong>System</strong> OverviewGSWC is an investor-owned public utility company which owns 38 water systems throughoutCalifornia regulated by the California Public Utilities Commission (CPUC). This <strong>UWMP</strong> has beenprepared for the <strong>San</strong> <strong>Dimas</strong> <strong>System</strong>.Located in Los Angeles County at the foothills of the <strong>San</strong> Gabriel Mountains, the <strong>San</strong> <strong>Dimas</strong><strong>System</strong> serves the City of <strong>San</strong> <strong>Dimas</strong>, portions of the cities of La Verne, Walnut, Covina, and aportion of the adjacent unincorporated area of Los Angeles County. The service area is primarilycharacterized by residential land use, with some commercial and industrial land use. Figure 1-1illustrates the location of the <strong>San</strong> <strong>Dimas</strong> <strong>System</strong>.1.3 Notice of Document UseGSWC is committed to implementation of the projects, plans, and discussions provided withinthis document. However, it is important to note that execution of the plan is contingent upon theregulatory limitations and approval of the CPUC and other state agencies. Additionally, thisdocument merely presents the water supply, reliability, and conservation programs known andin effect at the time of adoption of this plan.Page 1-2Final Report, <strong>2010</strong> Urban <strong>Water</strong> Management Plan – <strong>San</strong> <strong>Dimas</strong><strong>Golden</strong> <strong>State</strong> <strong>Water</strong> <strong>Company</strong>g:\adminasst\jobs\<strong>2010</strong>\1070001.00_gswc-uwmp\09-reports\9.09-reports\2011-08\grp2b\gswc_sandimas_<strong>2010</strong>_uwmp-final.doc
¯1MilesImage Source: ESRIPath: Z:\Projects\GSWC\Events\20110518_Figs\MXD\<strong>San</strong><strong>Dimas</strong>\Fig1-1.mxdLegend<strong>San</strong> <strong>Dimas</strong> CSALos Angeles County³0 45 90<strong>San</strong> <strong>Dimas</strong> <strong>System</strong>Kennedy/Jenks Consultants<strong>Golden</strong> <strong>State</strong> <strong>Water</strong> <strong>Company</strong><strong>2010</strong> Urban <strong>Water</strong> Management Plan<strong>San</strong> <strong>Dimas</strong> <strong>System</strong>Location MapK/J 1070001*00August 2011MilesFigure 1-1
THIS PAGE INTENTIONALLY BLANKPage 1-4Final Report, <strong>2010</strong> Urban <strong>Water</strong> Management Plan – <strong>San</strong> <strong>Dimas</strong><strong>Golden</strong> <strong>State</strong> <strong>Water</strong> <strong>Company</strong>g:\adminasst\jobs\<strong>2010</strong>\1070001.00_gswc-uwmp\09-reports\9.09-reports\2011-08\grp2b\gswc_sandimas_<strong>2010</strong>_uwmp-final.doc
1.4 Public Utility Commission <strong>2010</strong> <strong>Water</strong> Action PlanThe CPUC adopted the 2005 <strong>Water</strong> Action Plan (WAP) in December 2005 and an updated<strong>2010</strong> WAP in October <strong>2010</strong>. The WAP is a general policy document, and specificimplementation of policies and programs, along with modifications to CPUC ratemaking policies,and other programs including conservation, long-term planning, water quality and droughtmanagement programs are ongoing.The purpose of the <strong>2010</strong> WAP update was to establish renewed focus on the followingelements:1. Maintain the highest standards of water quality;2. Promote water infrastructure investment;3. Strengthen water conservation programs to a level comparable to those of energy utilities;4. Streamline CPUC regulatory decision-making;5. Set rates that balance investment, conservation, and affordability; and6. Assist low-income ratepayers.GSWC has been actively involved with the CPUC in suggesting optimal approaches to theWAP. In particular, the GSWC has suggested specific implementation measures andmodifications to certain CPUC rate setting practices so that regulated utilities are able as apractical matter to achieve the policy objectives of the WAP. These efforts are intended toinclude further investment in local resource optimization, reduced reliance on imported supplies,enhanced conservation, and intensification of company-wide efforts to optimize water resourcemix, including planned water supply projects and programs to meet the long-term water supplyneeds of GSWC’s customers.1.5 Agency Coordination and Public ParticipationThe <strong>2010</strong> <strong>UWMP</strong> requirements for agency coordination include specific timetables andrequirements as presented in this chapter. The required elements of the Act are as follows:Section 10620.(d) (2) Each urban water supplier shall coordinate the preparation of its plan with other appropriateagencies in the area, including other water suppliers that share a common source, watermanagement agencies, and relevant public agencies, to the extent practicable.Section 10621.(b) Every urban water supplier required to prepare a plan pursuant to this part shall, at least 60 days prior tothe public hearing on the plan required by Section 10642, notify any city or county within which thesupplier provides water supplies that the urban water supplier will be reviewing the plan and consideringamendments or changes to the plan. The urban water supplier may consult with, and obtain commentsfrom, any city or county that receives notice pursuant to this subdivision.Section 10635.(b) The urban water supplier shall provide that portion of its urban water management plan preparedpursuant to this article to any city or county within which it provides water supplies no later than 60 daysafter the submission of its urban water management plan.Final Report, <strong>2010</strong> Urban <strong>Water</strong> Management Plan – <strong>San</strong> <strong>Dimas</strong> Page 1-5<strong>Golden</strong> <strong>State</strong> <strong>Water</strong> <strong>Company</strong>g:\adminasst\jobs\<strong>2010</strong>\1070001.00_gswc-uwmp\09-reports\9.09-reports\2011-08\grp2b\gswc_sandimas_<strong>2010</strong>_uwmp-final.doc
Section 10642. Each urban water supplier shall encourage the active involvement of diverse social, cultural,and economic elements of the population within the service area prior to and during the preparation of the plan.Prior to adopting a plan, the urban water supplier shall make the plan available for public inspection and shallhold a public hearing thereon. Prior to the hearing, notice of the time and place of hearing shall be publishedwithin the jurisdiction of the publicly owned water supplier pursuant to Section 6066 of the Government Code.The urban water supplier shall provide notice of the time and place of hearing to any city or county within whichthe supplier provides water supplies. A privately owned water supplier shall provide an equivalent notice withinits service area.Table 1-1 lists the agencies with which coordination occurred while preparing this <strong>2010</strong> <strong>UWMP</strong>.The initial coordination included the distribution of letter notification and request for informationas indicated in Table 1-1 followed by telephone correspondence as necessary to obtainsupporting data for the preparation of the <strong>UWMP</strong>. Table 1-1 also provides a checklist ofagencies that have been provided the notifications and access to the documents.Table 1-1:Coordination with AgenciesAgencyContacted forAssistanceParticipated in<strong>UWMP</strong> DevelopmentCommented on theDraftAttended PublicMeetingsReceived Copy ofthe DraftSent Notice of Intentto AdoptNot Involved/No InformationSouthern California Association ofGovernmentsCity of Covina City of Glendora City of La Verne City of <strong>San</strong> <strong>Dimas</strong> City of Walnut County of Los Angeles City of Anaheim Walnut Valley <strong>Water</strong> District Three Valleys Municipal <strong>Water</strong>District Los Angeles County <strong>San</strong>itationDistrictNote:This table is based on DWR’s Guidebook to Assist <strong>Water</strong> Suppliers in the Preparation of a <strong>2010</strong> Urban <strong>Water</strong> ManagementPlan (DWR Guidebook) Table 1.Page 1-6Final Report, <strong>2010</strong> Urban <strong>Water</strong> Management Plan – <strong>San</strong> <strong>Dimas</strong><strong>Golden</strong> <strong>State</strong> <strong>Water</strong> <strong>Company</strong>g:\adminasst\jobs\<strong>2010</strong>\1070001.00_gswc-uwmp\09-reports\9.09-reports\2011-08\grp2b\gswc_sandimas_<strong>2010</strong>_uwmp-final.doc
1.6 Plan Adoption and SubmittalPublic participation and plan adoption requirements are detailed in the following sections of theAct:Section 10621.(c) The amendments to, or changes in, the plan shall be adopted and filed in the manner set forth in Article 3(commencing with Section 10640)Section 10642. After the hearing, the plan shall be adopted as prepared or as modified after the hearing.Section 10644.(a) An urban water supplier shall submit to the department, the California <strong>State</strong> Library, and any city orcounty within which the supplier provides water supplies a copy of its plan no later than 30 days afteradoption. Copies of amendments or changes to the plans shall be submitted to the department, theCalifornia <strong>State</strong> Library, and any city or county within which the supplier provides water supplies within30 days after adoption.Section 10645. Not later than 30 days after filing a copy of its plan with the department, the urban watersupplier and the department shall make the plan available for public review during normal business hours.A public hearing to review the <strong>2010</strong> <strong>San</strong> <strong>Dimas</strong> <strong>System</strong> <strong>UWMP</strong> was held on July 19, 2011 at the<strong>San</strong> <strong>Dimas</strong> Community Center in <strong>San</strong> <strong>Dimas</strong>, California. This public session was held for reviewand comment on the draft <strong>UWMP</strong> before approval by GSWC. Legal public notices for the publichearing and availability of the plan for review and comment were published in advance in thelocal newspapers in accordance with Government Code Section 6066. Notifications were alsoposted to GSWC’s website (www.gswater.com).In addition, notifications of preparation of the plan were provided to cities and counties withinwhich GSWC provides water at least 60 days in advance of the public hearing as required bythe Act. Copies of the draft plan were available to the public for review at GSWC’s <strong>San</strong> <strong>Dimas</strong>office and posted on GSWC’s website. Appendix B contains the following:• Copy of the public hearing notice from the local newspaper,• Screen capture of website posting of public hearing notice,• Notifications and follow-up correspondence provided to cities and counties, and• Meeting minutes from the public hearing pertaining to the <strong>UWMP</strong>.The final <strong>UWMP</strong>, as adopted by GSWC, will be submitted to DWR, the California <strong>State</strong> Library,and cities and counties within which GSWC provides water within 30 days of adoption. Likewise,copies of any amendments or changes to the plan will be provided to the aforementionedentities within 30 days. This plan includes all information necessary to meet the requirements ofCalifornia <strong>Water</strong> Code Division 6, Part 2.6 (Urban <strong>Water</strong> Management Planning). Adoptedcopies of this plan will be made available to the public at GSWC’s <strong>San</strong> <strong>Dimas</strong> Customer ServiceOffice no later than 30 days after submitting the final <strong>UWMP</strong> to DWR.Final Report, <strong>2010</strong> Urban <strong>Water</strong> Management Plan – <strong>San</strong> <strong>Dimas</strong> Page 1-7<strong>Golden</strong> <strong>State</strong> <strong>Water</strong> <strong>Company</strong>g:\adminasst\jobs\<strong>2010</strong>\1070001.00_gswc-uwmp\09-reports\9.09-reports\2011-08\grp2b\gswc_sandimas_<strong>2010</strong>_uwmp-final.doc
1.7 <strong>UWMP</strong> PreparationGSWC prepared this <strong>UWMP</strong> with the assistance of its consultant, Kennedy/Jenks Consultants,as permitted by the following section of the Act:Section 10620.(e) The urban water supplier may prepare the plan with its own staff, by contract, or in cooperation with othergovernmental agencies.During the preparation of the <strong>UWMP</strong>, documents that have been prepared over the years byGSWC and other entities were reviewed and information from those documents incorporated,as applicable, into this <strong>UWMP</strong>. The list of references is provided in Chapter 9.The adopted plan is available for public review at GSWC’s <strong>San</strong> <strong>Dimas</strong> Office as required bySection 10645. Copies of the plan were submitted to DWR, cities and counties within theservice area, the <strong>State</strong> Library, and other applicable institutions within 30 days of adoption asrequired by Section 10644. Appendix H includes copies of the transmittals included with theadopted plan as supporting documentation.1.8 <strong>UWMP</strong> ImplementationSection 10643. An urban water supplier shall implement its plan adopted pursuant to this chapter inaccordance with the schedule set forth in its plan.GSWC is committed to the implementation of this <strong>UWMP</strong> concurrent with the scheduledactivities identified herein as required by Section 10643 of the Act. Each system is managedthrough GSWC District offices and is afforded staff with appropriate regulatory approval toproperly plan and implement responses identified in this document and other key planningefforts to proactively address water supply reliability challenges. Furthermore, each region ofGSWC has a conservation coordinator that oversees the implementation of DemandManagement Measures through GSWC participation in the California Urban <strong>Water</strong>Conservation Council’s (Council) Memorandum of Understanding (MOU).1.9 Content of the <strong>UWMP</strong>This <strong>UWMP</strong> addresses all subjects required by Section 10631 of the Act as defined bySection 10630, which permits “levels of water management planning commensurate with thenumbers of customers served and the volume of water supplied.” All applicable sections of theAct are discussed in this <strong>UWMP</strong>, with chapters of the <strong>UWMP</strong> and DWR Guidebook Checklistcross-referenced against the corresponding provision of the Act in Table 1-2. Also, a completedcopy of the <strong>2010</strong> Urban <strong>Water</strong> Management Plan Checklist organized by subject is included asAppendix J.Page 1-8Final Report, <strong>2010</strong> Urban <strong>Water</strong> Management Plan – <strong>San</strong> <strong>Dimas</strong><strong>Golden</strong> <strong>State</strong> <strong>Water</strong> <strong>Company</strong>g:\adminasst\jobs\<strong>2010</strong>\1070001.00_gswc-uwmp\09-reports\9.09-reports\2011-08\grp2b\gswc_sandimas_<strong>2010</strong>_uwmp-final.doc
Table 1-2:Summary of <strong>UWMP</strong> Chapters and Corresponding Provisions of the California <strong>Water</strong> CodeChapterCorresponding Provisions of the <strong>Water</strong> CodeDWRGuidebookChecklistNo.Chapter 1: Plan Preparation 10642 Public participation 55 and 5610643 Plan implementation 5810644 Plan filing 5910645 Public review availability 6010620 (a)–(e)10621 (a)–(c)Coordination with other agencies;document preparationCity and county notification; due date;review46 and 5410621 (c) <strong>UWMP</strong> adoption 7 and 5710620 (f) Resource optimization 5Chapter 2: <strong>System</strong> Description10631 (a)Area, demographics, population, andclimate8-12Chapter 3: <strong>Water</strong> Use 10608 Urban water use targets 110631 (e), (k) <strong>Water</strong> use, data sharing 25 and 3410631 (k) Data to wholesaler 33Chapter 4: <strong>Water</strong> Supply10631 (b), (d), (h),(k)<strong>Water</strong> sources, transfers and exchanges,supply projects, data sharing13-21, 24,30, 3310631 (i) Desalination 3110633 Recycled water 44-51Chapter 5: <strong>Water</strong> Quality 10634 <strong>Water</strong> quality impacts on reliability 52Chapter 6: <strong>Water</strong> SupplyReliability10631 (c) (1)<strong>Water</strong> supply reliability and vulnerability toseasonal or climactic shortage2210631 (c) (2)Factors resulting in inconsistency ofsupply2310635 (a)Reliability during normal, dry, andmultiple-dry years53Chapter 7: Conservation Programand Demand ManagementMeasures10631 (f)–(g), (j),10631.5,10608.26 (a),10608.36Conservation Program, DMMs and SBX7-7 water use reduction plan2, 26-29,32Chapter 8: <strong>Water</strong> ShortageContingency Plan10632 <strong>Water</strong> shortage contingency plan 35-43Final Report, <strong>2010</strong> Urban <strong>Water</strong> Management Plan – <strong>San</strong> <strong>Dimas</strong> Page 1-9<strong>Golden</strong> <strong>State</strong> <strong>Water</strong> <strong>Company</strong>g:\adminasst\jobs\<strong>2010</strong>\1070001.00_gswc-uwmp\09-reports\9.09-reports\2011-08\grp2b\gswc_sandimas_<strong>2010</strong>_uwmp-final.doc
1.10 Resource OptimizationSection 10620(f) of the Act asks urban water suppliers to evaluate water management tools andoptions to maximize water resources and minimize the need for purchased water from otherregions. GSWC understands the limited nature of water supply in California and is committed tooptimizing its available water resources. This commitment is demonstrated through GSWC’suse of water management tools throughout the company to promote the efficient use of watersupplies from local sources, wherever feasible. Additionally, GSWC takes efforts to procurelocal reliable water supplies wherever feasible and cost effective. GSWC is a regular participantin regional water resources planning efforts, and has developed internal company waterresource plans and robust water conservation programs.GSWC has implemented a water conservation program, deployed through each region of thecompany. In an effort to expand the breadth of offered programs, GSWC partners withwholesale suppliers, energy utilities, and other agencies that support water conservationprograms.Page 1-10Final Report, <strong>2010</strong> Urban <strong>Water</strong> Management Plan – <strong>San</strong> <strong>Dimas</strong><strong>Golden</strong> <strong>State</strong> <strong>Water</strong> <strong>Company</strong>g:\adminasst\jobs\<strong>2010</strong>\1070001.00_gswc-uwmp\09-reports\9.09-reports\2011-08\grp2b\gswc_sandimas_<strong>2010</strong>_uwmp-final.doc
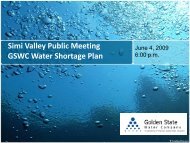
Chapter 2: <strong>System</strong> DescriptionChapter 2 summarizes the <strong>San</strong> <strong>Dimas</strong> <strong>System</strong>’s service area and presents an analysis ofavailable demographics, population growth projections, and climate data to provide the basis forestimating future water requirements.The water system description requirements are detailed in the following section of the Act:Section 10631(a) Describe the service area of the supplier, including current and projected population, climate, and otherdemographic factors affecting the supplier’s water management planning. The projected populationestimates shall be based upon data from the state, regional, or local service agency populationprojections within the service area of the urban water supplier and shall be in five-year increments to20 years or as far as data is available.2.1 AreaThe <strong>San</strong> <strong>Dimas</strong> <strong>System</strong> is located in Los Angeles County and serves the City of <strong>San</strong> <strong>Dimas</strong>,portions of the Cities of La Verna, Walnut, Covina, and a portion of the adjacent unincorporatedarea of Los Angeles County. The system is located in the eastern portion of the <strong>San</strong> GabrielValley at the foothills of the <strong>San</strong> Gabriel Mountains. The service area boundary includesdeveloped and underdeveloped land area to the north east of <strong>San</strong> <strong>Dimas</strong> <strong>System</strong>. Figure 2-1illustrates the service area of the <strong>San</strong> <strong>Dimas</strong> <strong>System</strong>. The service area is primarily characterizedby residential land use, with some commercial and industrial land use.2.2 DemographicsThe City of <strong>San</strong> <strong>Dimas</strong> was chosen as demographically representative of the <strong>San</strong> <strong>Dimas</strong><strong>System</strong>. According to 2000 U.S. Census Data, the median age of <strong>San</strong> <strong>Dimas</strong>’ residents is37.3 years. <strong>San</strong> <strong>Dimas</strong> has an average household size of 2.78 and a median household incomeof approximately $62,885 in 1999 dollars or $82,128 in <strong>2010</strong> dollars.As detailed in the City of <strong>San</strong> <strong>Dimas</strong>’ Housing Element (General Plan 2002), residentialdevelopment represents the predominant land use in <strong>San</strong> <strong>Dimas</strong>. The General Plan and <strong>System</strong>map also indicates that build-out has nearly been reached in the areas feasible for residential ornon-residential development. <strong>San</strong> <strong>Dimas</strong> has areas of hillside land that may be able toaccommodate individual residential development. However, the difficulty and cost ofconstructing infrastructure within the rugged terrain may limit the viability of housing tracts andfuture large residential developments.In the future, the City of <strong>San</strong> <strong>Dimas</strong> has indicated that redevelopment projects includingaffordable multi-family housing units may potentially be implemented within the <strong>San</strong> <strong>Dimas</strong>existing service area.Final Report, <strong>2010</strong> Urban <strong>Water</strong> Management Plan – <strong>San</strong> <strong>Dimas</strong> Page 2-1<strong>Golden</strong> <strong>State</strong> <strong>Water</strong> <strong>Company</strong>g:\adminasst\jobs\<strong>2010</strong>\1070001.00_gswc-uwmp\09-reports\9.09-reports\2011-08\grp2b\gswc_sandimas_<strong>2010</strong>_uwmp-final.doc
THIS PAGE INTENTIONALLY BLANKPage 2-2Final Report, <strong>2010</strong> Urban <strong>Water</strong> Management Plan – <strong>San</strong> <strong>Dimas</strong><strong>Golden</strong> <strong>State</strong> <strong>Water</strong> <strong>Company</strong>g:\adminasst\jobs\<strong>2010</strong>\1070001.00_gswc-uwmp\09-reports\9.09-reports\2011-08\grp2b\gswc_sandimas_<strong>2010</strong>_uwmp-final.doc
210%&'(·|}þ57Path: Z:\Projects\GSWC\Events\20110518_Figs\MXD\<strong>San</strong><strong>Dimas</strong>\Fig2-1.mxdImage Source: ESRILegend<strong>San</strong> <strong>Dimas</strong> <strong>System</strong> BoundaryCity Boundary%&'(10³0 2,500 5,000FeetKennedy/Jenks Consultants<strong>Golden</strong> <strong>State</strong> <strong>Water</strong> <strong>Company</strong><strong>2010</strong> Urban <strong>Water</strong> Management Plan<strong>San</strong> <strong>Dimas</strong> <strong>System</strong>Service AreaK/J 1070001*00August 2011Figure 2-1
THIS PAGE INTENTIONALLY BLANKPage 2-4Final Report, <strong>2010</strong> Urban <strong>Water</strong> Management Plan – <strong>San</strong> <strong>Dimas</strong><strong>Golden</strong> <strong>State</strong> <strong>Water</strong> <strong>Company</strong>g:\adminasst\jobs\<strong>2010</strong>\1070001.00_gswc-uwmp\09-reports\9.09-reports\2011-08\grp2b\gswc_sandimas_<strong>2010</strong>_uwmp-final.doc
2.3 Population, Housing and EmploymentPopulation, housing, and employment projections were developed for the <strong>San</strong> <strong>Dimas</strong> <strong>System</strong>using the Southern California Association of Governments (SCAG) population, housing andemployment data. SCAG recently updated its projections for population, household, andemployment growth through the year 2035 using the 2008 “Integrated Growth Forecasting”process used in the 2008 Regional Transportation Plan (2008 RTP). SCAG’s methodology isdescribed below, followed by the derivation of population projections for the <strong>San</strong> <strong>Dimas</strong> <strong>System</strong>.Previous and current projections utilize 2000 U.S. Census Data.SCAG is currently in the process of developing its 2012 Regional Transportation Plan (2012RTP) which will utilize a new population projection model on <strong>2010</strong> Census data. In certaincases, growth rates using these preliminary data are significantly reduced from the 2008 model.The population, household, and employment projections in this document use the adopted 2008RTP data. Future <strong>UWMP</strong> updates will be able to utilize 2012 RTP projections as well as <strong>2010</strong>Census data.2.3.1 SCAG Population Projection Development MethodologyPopulation, housing, and employment data are derived from the 2000 U.S. Census, which formsa baseline for local data projections. SCAG applies a statistical cohort-component model andthe headship rate to the 2000 U.S. Census data for regional, county, and householddemographic projections. To evaluate the <strong>San</strong> <strong>Dimas</strong> <strong>System</strong>, SCAG data was used in censustract form, the smallest geographic division of data that SCAG provides. SCAG projectssubcounty and census tract demographic trends using the housing unit method.The Integrated Growth Forecasting process uses a variety of estimates and projections from thefederal and state governments. Sources include the U.S. Department of Labor, InternalRevenue Service (IRS), U.S. Citizenship and Immigration Services, U.S. Department of Healthand Human Services, California Department of Finance (DOF), California EmploymentDevelopment Department, and information received through the Intergovernmental Reviewprocess. A detailed explanation of the population projection process can be found in theadopted SCAG 2008 Regional Transportation Plan, Growth Forecast Report for SCAG.2.3.2 Historical and Projected PopulationSCAG-derived census-tract projections were used to determine historical and projectedpopulation from 1997 to 2035. The <strong>San</strong> <strong>Dimas</strong> <strong>System</strong> service area boundaries often containmultiple census tracts, many of which have boundaries that do not coincide exactly with servicearea boundaries. The population projection analysis consisted of superimposing service areaboundaries over census tract boundaries, identifying the applicable overlapping census tracts,and developing a percentage estimate for each overlapping area. For a census tract100 percent within the service area boundaries, it was assumed that 100 percent of theassociated census tract population data was applicable to the <strong>San</strong> <strong>Dimas</strong> <strong>System</strong>. For areaswhere the overlap was not exact, the area of overlap as a percentage was applied to the data todevelop an estimate of applicable population. Appendix G, Table G-1 lists the census tracts witha corresponding estimate of what percent of each tract lies within the <strong>San</strong> <strong>Dimas</strong> <strong>System</strong>. It wastypically assumed that the various types of housing and employment within a census tract aredistributed uniformly within all parts of that census tract, unless maps indicated non-uniformconcentrations. In these cases, population estimates were either increased or decreased asapplicable to match the existing land use. Appendix G, Table G-2 contains all of the SCAG’sFinal Report, <strong>2010</strong> Urban <strong>Water</strong> Management Plan – <strong>San</strong> <strong>Dimas</strong> Page 2-5<strong>Golden</strong> <strong>State</strong> <strong>Water</strong> <strong>Company</strong>g:\adminasst\jobs\<strong>2010</strong>\1070001.00_gswc-uwmp\09-reports\9.09-reports\2011-08\grp2b\gswc_sandimas_<strong>2010</strong>_uwmp-final.doc
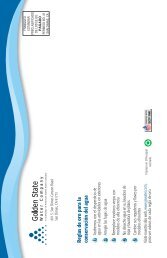
historic and projected demographic data for each census tract number from 2005 through 2035.Figure 2-2 details the census tracts within the <strong>San</strong> <strong>Dimas</strong> <strong>System</strong>.Annual estimates of historical population between 1997 and <strong>2010</strong> required for SBX7-7 areprovided in Table 2-1. The population estimates were developed following DWR TechnicalMethodology 2: Service Area Population. GSWC is considered a Category 2 water supplierbecause they maintain a Geographic Information <strong>System</strong> (GIS) of their service area. The perconnectionmethodology described in Appendix A of Technical Methodology 2 was used sinceannual estimates of direct service area population from SCAG or other local governmentagencies were not available. This method estimates annual population by anchoring the ratio ofyear 2000 residential connections to the year 2000 U.S. Census population. This ratio was thenlinearly scaled to active residential connections data to estimate population for the non-censusyears in which water supply data were available: 1997 through <strong>2010</strong>. The residential billingcategory includes traditional single-family residential connections; however since GSWC doesnot have a specific multi-family billing category that only encompasses the apartmentcomplexes and other types of multi-family housing units, the ratio of year 2000 U.S. Censustotal population per residential connections was used for projecting population growth.Table 2-1:Year<strong>San</strong> <strong>Dimas</strong> <strong>System</strong> Historical PopulationService Area Population1997 55,6701998 55,5341999 55,6102000 55,853 (1)2001 56,0552002 56,3242003 56,3972004 56,3242005 56,3742006 56,3432007 56,2862008 56,2072009 56,180<strong>2010</strong> 56,416Note:1. Population for year 2000 from 2005 <strong>UWMP</strong>.Page 2-6Final Report, <strong>2010</strong> Urban <strong>Water</strong> Management Plan – <strong>San</strong> <strong>Dimas</strong><strong>Golden</strong> <strong>State</strong> <strong>Water</strong> <strong>Company</strong>g:\adminasst\jobs\<strong>2010</strong>\1070001.00_gswc-uwmp\09-reports\9.09-reports\2011-08\grp2b\gswc_sandimas_<strong>2010</strong>_uwmp-final.doc
400203400303400203210%&'(400302401202·|}þ 57401311400304400302403801403802403721401312401500403702403703Path: Z:\Projects\GSWC\Events\20110518_Figs\MXD\<strong>San</strong><strong>Dimas</strong>\Fig2-2.mxdImage Source: ESRILegend<strong>San</strong> <strong>Dimas</strong> <strong>System</strong> Boundary403500403405Census Tract Boundary within Service AreaCity Boundary401302³0 2,500 5,000Feet%&'( 10Kennedy/Jenks Consultants<strong>Golden</strong> <strong>State</strong> <strong>Water</strong> <strong>Company</strong><strong>2010</strong> Urban <strong>Water</strong> Management Plan<strong>San</strong> <strong>Dimas</strong> <strong>System</strong>Service Area withCensus Tract BoundaryK/J 1070001*00August 2011Figure 2-2
THIS PAGE INTENTIONALLY BLANKPage 2-8Final Report, <strong>2010</strong> Urban <strong>Water</strong> Management Plan – <strong>San</strong> <strong>Dimas</strong><strong>Golden</strong> <strong>State</strong> <strong>Water</strong> <strong>Company</strong>g:\adminasst\jobs\<strong>2010</strong>\1070001.00_gswc-uwmp\09-reports\9.09-reports\2011-08\grp2b\gswc_sandimas_<strong>2010</strong>_uwmp-final.doc
As concluded from analysis of SCAG demographic data, the <strong>San</strong> <strong>Dimas</strong> <strong>System</strong> has anestimated population of 56,416 in <strong>2010</strong> and is expected to reach 76,769 by 2035. A summary ofhistoric and projected population, households, and employment within the <strong>San</strong> <strong>Dimas</strong> <strong>System</strong>(based on SCAG data) is presented in Table 2-2 and illustrated in Figure 2-3. To ensureconsistency between the historical and projected population data required for this plan,projections for 2015 through 2035 were adjusted relative to the <strong>2010</strong> population benchmarkusing the appropriate SCAG percentage growth rates in each category. For this reason, SCAGprojections after 2000 for the Census Tracts do not correlate precisely with the estimatesincluded in this plan.Table 2-2:<strong>San</strong> <strong>Dimas</strong> <strong>System</strong> Historical and Projected PopulationYearService AreaPopulationService AreaHouseholdService AreaEmploymentDataSource2005 56,374 18,357 20,750 GSWC<strong>2010</strong> 56,416 18,983 21,573 GSWC2015 59,017 20,017 22,234 SCAG2020 63,473 21,870 22,676 SCAG2025 68,131 23,374 23,192 SCAG2030 72,557 24,788 23,741 SCAG2035 76,769 25,923 24,272 SCAGNotes:1. This table is based on the DWR Guidebook Table 2.2. Dashed line represents division between historic and projected data.3. Growth rates for population, household and employment are based on SCAG projections.In summary, from 2005 to <strong>2010</strong> the <strong>San</strong> <strong>Dimas</strong> population increased 0.1 percent, which is agrowth rate of approximately 0.03 percent per year. By 2035, population is expected to increaseby a total of 36 percent, from 56,416 in <strong>2010</strong> to 76,769 in 2035, which is a 1.4 percent growthrate per year. The number of households is expected to grow 37 percent during the sameperiod, which equates to an annual household growth rate of 1.5 percent. Employment isexpected to grow 13 percent during the same period, which equates to an annual employmentgrowth rate of 0.5 percent. Areas with the highest projected growth increases are also the areasthat will see the largest increase in water use. SCAG’s demographic analysis does not projectany planned residential developments for future years. Based on <strong>San</strong> <strong>Dimas</strong>’ <strong>System</strong> map thereis not much land area available for future growth.Final Report, <strong>2010</strong> Urban <strong>Water</strong> Management Plan – <strong>San</strong> <strong>Dimas</strong> Page 2-9<strong>Golden</strong> <strong>State</strong> <strong>Water</strong> <strong>Company</strong>g:\adminasst\jobs\<strong>2010</strong>\1070001.00_gswc-uwmp\09-reports\9.09-reports\2011-08\grp2b\gswc_sandimas_<strong>2010</strong>_uwmp-final.doc
90,000Population / Households / Employment80,00070,00060,00050,00040,00030,00020,00010,00002000 2005 <strong>2010</strong> 2015 2020 2025 2030 2035 2040YearPopulation Household EmploymentFigure 2-3:Historical and Projected Population, Household and Employment Growth within the <strong>San</strong> <strong>Dimas</strong> <strong>System</strong>2.4 Climate<strong>San</strong> <strong>Dimas</strong> <strong>System</strong> has cool, humid winters and warm, dry summers. Western Regional ClimateCenter (WRCC) has maintained 30 years of historical climate records for selected citiesthroughout the West. WRCC does not have a station at <strong>San</strong> <strong>Dimas</strong>, so the Pomona station,which is 7 miles from <strong>San</strong> <strong>Dimas</strong>, was utilized for the climate data analysis. The WRCC’swebsite (www.wrcc.dri.edu) has climate records for the past 110 years for the Pomona station.Table 2-3 presents the average climate summary based on the 110-year historical climate dataat Pomona, representing for the <strong>San</strong> <strong>Dimas</strong> <strong>System</strong>.In the winter, the lowest average monthly temperature is approximately 38 degrees Fahrenheit.The highest average monthly temperature reaches approximately 91 degrees Fahrenheit in thesummer. Figure 2-4 presents the monthly average precipitation based on 110-year historicaldata. The rainy season is typically from November to April. Monthly precipitation during thewinter months ranges from 1 to 4 inches. Low humidity occurs in the summer months from Mayto October. The moderately hot and dry weather during the summer months typically results inmoderately high water demand.Similar to the WRCC in the <strong>San</strong> <strong>Dimas</strong> <strong>System</strong>, the California Irrigation ManagementInformation <strong>System</strong> (CIMIS) website (http://www.cimis.water.ca.gov) tracks and maintainsrecords of ETo for selected cities. ETo statistics used for this system also come from thePomona station, which is the closest station (4 miles) to the <strong>San</strong> <strong>Dimas</strong> <strong>System</strong>. ETo is astandard measurement of environmental parameters that affect the water use of plants. ETo isgiven in inches per day, month, or year and is an estimate of the evapotranspiration from a largefield of well-watered, cool-season grass that is 4- to 7-inches tall. The monthly average ETo isPage 2-10Final Report, <strong>2010</strong> Urban <strong>Water</strong> Management Plan – <strong>San</strong> <strong>Dimas</strong><strong>Golden</strong> <strong>State</strong> <strong>Water</strong> <strong>Company</strong>g:\adminasst\jobs\<strong>2010</strong>\1070001.00_gswc-uwmp\09-reports\9.09-reports\2011-08\grp2b\gswc_sandimas_<strong>2010</strong>_uwmp-final.doc
presented in inches in Table 2-3. As the table indicates, a greater quantity of water isevaporated during July and August in correlation to high temperatures and low humidity, whichmay result in high water demand.Table 2-3:Monthly Average Climate Data Summary for <strong>San</strong> <strong>Dimas</strong> <strong>System</strong>MonthStandard MonthlyAverage ETo (2)(inches)Average Temperature(degrees Fahrenheit)Average Total Rainfall(inches) Max MinJanuary 1.9 3.62 65.4 38.0February 2.2 3.54 67.7 40.2March 3.6 2.85 70.1 42.2April 4.6 1.23 74.1 45.5May 5.2 0.35 77.8 49.9June 5.9 0.10 84.1 53.4July 6.5 0.01 91.1 57.6August 6.4 0.07 91.1 57.9September 4.9 0.27 88.4 55.1October 3.3 0.77 80.7 49.7November 2.3 1.57 73.3 42.5December 1.8 2.73 66.4 38.3Note:Evapotranspiration (ETo) from http://www.cimis.water.ca.gov/cimis/welcom.jsp.Final Report, <strong>2010</strong> Urban <strong>Water</strong> Management Plan – <strong>San</strong> <strong>Dimas</strong> Page 2-11<strong>Golden</strong> <strong>State</strong> <strong>Water</strong> <strong>Company</strong>g:\adminasst\jobs\<strong>2010</strong>\1070001.00_gswc-uwmp\09-reports\9.09-reports\2011-08\grp2b\gswc_sandimas_<strong>2010</strong>_uwmp-final.doc
4.03.5Monthly Average Precipitation (inches)3.02.52.01.51.00.50.0Jan Feb Mar Apr May Jun Jul Aug Sep Oct Nov DecMonthFigure 2-4:Monthly Average Precipitation at Pomona Station Based on 100-Year Historical DataPage 2-12Final Report, <strong>2010</strong> Urban <strong>Water</strong> Management Plan – <strong>San</strong> <strong>Dimas</strong><strong>Golden</strong> <strong>State</strong> <strong>Water</strong> <strong>Company</strong>g:\adminasst\jobs\<strong>2010</strong>\1070001.00_gswc-uwmp\09-reports\9.09-reports\2011-08\grp2b\gswc_sandimas_<strong>2010</strong>_uwmp-final.doc
Chapter 3: <strong>Water</strong> UseSection 10631(e) of the Act requires that an evaluation of water use be performed for the<strong>San</strong> <strong>Dimas</strong> <strong>System</strong>. The Act states the following:Section 10631.(e) (1) Quantify, to the extent records are available, past and current water use, over the same five-yearincrements described in subdivision (a), and projected water use, identifying the uses among waterusesectors including, but not necessarily limited to, all of the following uses:(A) Single-family residential(B) Multifamily(C) Commercial(D) Industrial(E) Institutional and governmental(F) Landscape(G) Sales to other agencies(H) Saline water intrusion barriers, groundwater recharge, or conjunctive use, or any combinationthereof(I) Agricultural.(2) The water-use projections shall be in the same five-year increments described in subdivision (a).In addition, Section 10631(k) directs urban water suppliers to provide existing and projectedwater-use information to wholesale agencies from which water deliveries are obtained. The Actstates the following:Section 10631.(k) Urban water suppliers that rely upon a wholesale agency for a source of water, shall provide thewholesale agency with water-use projections from that agency for that source of water in five-yearincrements to 20 years or as far as data is available. The wholesale agency shall provide information tothe urban water supplier for inclusion in the urban water supplier’s plan that identifies and quantifies, tothe extent practicable, the existing and planned sources of water as required by subdivision (b), availablefrom the wholesale agency to the urban water supplier over the same five-year increments, and duringvarious water-year types in accordance with subdivision (c). An urban water supplier may rely upon watersupply information provided by the wholesale agency in fulfilling the plan informational requirements ofsubdivisions (b) and (c).In conjunction with projecting total water demand, each urban water retail supplier must developurban water use targets and an interim urban water use target in accordance with SBX7-7.SBX7-7 amends the Act requiring statewide water savings of 20 percent by the year 2020. Thebill sets specific methods for calculating both the baseline water usage and water use targets ingallons per capita day (gpcd).Final Report, <strong>2010</strong> Urban <strong>Water</strong> Management Plan – <strong>San</strong> <strong>Dimas</strong> Page 3-1<strong>Golden</strong> <strong>State</strong> <strong>Water</strong> <strong>Company</strong>g:\adminasst\jobs\<strong>2010</strong>\1070001.00_gswc-uwmp\09-reports\9.09-reports\2011-08\grp2b\gswc_sandimas_<strong>2010</strong>_uwmp-final.doc
2002Section 10608.20(e) states the following:Section 10608.20.(e)An urban retail water supplier shall include in its urban water management plan required pursuant toPart 2.6 (commencing with Section 10610) due in <strong>2010</strong> the baseline daily per capita water use, urbanwater use target, interim urban water use target, and compliance daily per capita water use, along withthe bases for determining those estimates, including references to supporting data.This chapter presents an analysis of water use data with the resulting projections for futurewater needs and water use targets in accordance with SBX7-7 for the <strong>San</strong> <strong>Dimas</strong> <strong>System</strong>.3.1 Historical <strong>Water</strong> UseHistorical water use data from 1994 to <strong>2010</strong> were analyzed in order to provide an overview ofhistorical water usage for the <strong>San</strong> <strong>Dimas</strong> <strong>System</strong>. Figure 3-1 shows the historical number ofmetered service connections and water use for the <strong>San</strong> <strong>Dimas</strong> <strong>System</strong> from 1994 through <strong>2010</strong>.17,00016,00016,000<strong>Water</strong> Use (ac-ft/yr)15,00014,00013,00012,00011,00020012000Year19991998199719961995199419932011<strong>2010</strong>200920082007200620052004200315,75015,50015,250Service Connections15,000<strong>Water</strong> Use (ac-ft/yr)Active Number of ConnectionsFigure 3-1:Historical Number of Metered Service Connections and <strong>Water</strong> UseFigure 3-1 shows a decline in water use beginning in 2007 with an approximate 18 percentdecline from 2008 to <strong>2010</strong>. Review of similar data from other systems suggests the decline inwater use has been widespread and is not isolated to the <strong>San</strong> <strong>Dimas</strong> <strong>System</strong>. The recentdecline in water use is not yet fully understood, but may be a result of several factors including:several years of cool summers, a statewide drought that forced mandatory water reductions andconservation in many areas, and an economic downturn that has caused many businesses toclose and increased housing vacancies.Page 3-2Final Report, <strong>2010</strong> Urban <strong>Water</strong> Management Plan – <strong>San</strong> <strong>Dimas</strong><strong>Golden</strong> <strong>State</strong> <strong>Water</strong> <strong>Company</strong>g:\adminasst\jobs\<strong>2010</strong>\1070001.00_gswc-uwmp\09-reports\9.09-reports\2011-08\grp2b\gswc_sandimas_<strong>2010</strong>_uwmp-final.doc
The customer billing data for the system consists of annual water sales data. The water salesdata was sorted by customer type using the assigned North American Industry Classification<strong>System</strong> (NAICS) codes. Then, the sorted water sales data were further grouped into thefollowing seven categories: single-family, multi-family, industrial, commercial,institutional/government, landscape, and other. Table 3-1 shows the historical water use bycustomer type.Table 3-1:Historical <strong>Water</strong> Use (ac-ft/yr) by Customer TypeYEARAgricultureCommercialIndustrialInstitutional/GovernmentLandscapeMulti-FamilyOtherSingle-Family1994 11 1,484 190 567 1,485 582 3 8,038 12,3601995 12 2,337 519 1094 1,295 717 5 8,655 14,6341996 12 1,753 169 928 1,503 766 5 8,399 13,5351997 11 1,620 154 884 1,567 818 5 8,654 13,7131998 10 1,574 193 798 1,245 721 4 7,298 11,8431999 13 2,213 180 899 1,653 867 2 8,174 14,0012000 12 2,501 242 957 1,713 862 3 8,246 14,5362001 9 2,133 207 909 1,660 827 9 7,780 13,5342002 9 2,196 224 983 1,721 834 8 8,206 14,1812003 8 2,192 206 810 1,507 857 5 7,750 13,3352004 5 1,793 190 798 1,682 855 6 7,997 13,3262005 1 2,039 186 785 1,513 773 9 7,546 12,8522006 1 2,536 228 737 1,702 791 2 7,857 13,8542007 1 2,381 199 798 1,772 774 4 8,275 14,2042008 1 2,278 162 836 1,645 725 3 7,670 13,3202009 1 2,027 161 762 1,484 692 2 6,990 12,119<strong>2010</strong> 1 1,930 204 684 1,234 653 2 6,377 11,085Total3.2 <strong>Water</strong> Use TargetsThis section includes documentation of the water use targets commensurate with enactment ofSBX7-7. The <strong>2010</strong> <strong>UWMP</strong> update is the first in which such targets have been required to bedocumented. The projected water use for each urban retail water supplier is required to bereduced by a total of up to 20 percent by the year 2020 from a calculated baseline gpcd asFinal Report, <strong>2010</strong> Urban <strong>Water</strong> Management Plan – <strong>San</strong> <strong>Dimas</strong> Page 3-3<strong>Golden</strong> <strong>State</strong> <strong>Water</strong> <strong>Company</strong>g:\adminasst\jobs\<strong>2010</strong>\1070001.00_gswc-uwmp\09-reports\9.09-reports\2011-08\grp2b\gswc_sandimas_<strong>2010</strong>_uwmp-final.doc
equired by SBX7-7. The steps described throughout this section follow the guidelinemethodologies developed by DWR over the past year, as documented in Section D of theGuidebook to Assist Urban <strong>Water</strong> Suppliers to Prepare a <strong>2010</strong> Urban <strong>Water</strong> Management Plan(DWR Guidebook) issued March 2011. The three overall steps to determine the 2020 water usetarget are as follows:• Step 1 – Calculate the baseline per capita water use, using the required methodologies.• Step 2 – Calculate the per capita reduction using at least one of the four methodologies(including the minimum reduction target – which is a provision included to ensure allagencies achieve a minimum level of water savings).• Step 3 – Select the target reduction methodology and set interim (2015) and compliance(2020) water use targets. The chosen methodology is an option of the water supplier andmay be changed in 2015.The Act now stipulates that the state shall review the progress made towards reaching thestatewide water savings targets as reported in the 2015 <strong>UWMP</strong> updates. Currently, no singleurban water supplier is required to conserve more than 20 percent, however there areprovisions in the law that could require additional conservation after 2015 if it is found that theprogram is not on track to reach 20 percent statewide water savings by 2020.3.2.1 Baseline Per Capita <strong>Water</strong> UseThe first step in the process of determining the water use target is calculation of the baseline percapita water use (baseline gpcd). In order to calculate the baseline gpcd, service areapopulation within the <strong>San</strong> <strong>Dimas</strong> <strong>System</strong> was estimated and compared to actual water userecords. The following three baseline gpcd calculations identified in SBX7-7 were evaluated forthe <strong>San</strong> <strong>Dimas</strong> <strong>System</strong>:• Baseline Method 1 – Average water use over a continuous 10-year period ending no earlierthan December 31, 2004 and no later than December 31, <strong>2010</strong>.• Baseline Method 2 – For retailers with at least 10 percent of 2008 demand served byrecycled water (either retail-or wholesale-provided), this calculation may be extended toinclude an additional 5 years ending no earlier than December 31, 2004 and no later thanDecember 31, <strong>2010</strong>.• Baseline Method 3 – Estimate of average gross water use reported in gpcd and calculatedover a continuous 5-year period ending no earlier than December 31, 2007 and no later thanDecember 31, <strong>2010</strong>.The Baseline Methods 1 and 3 were evaluated using water supply data for the years endingDecember 31, 1997 through December 31, <strong>2010</strong>. The base water use was calculated for eachyear commencing with 1997 as this was the first year with production data records available.The <strong>San</strong> <strong>Dimas</strong> system does not currently receive recycled water; therefore Baseline Method 2is not applicable. Table 3-3 below presents the base period ranges, total water deliveries andthe volume of recycled water delivered in 2008; these data are used to determine the number ofyears that can be included in the base period range. Also shown are the actual start and endyears for the selected base period range.Page 3-4Final Report, <strong>2010</strong> Urban <strong>Water</strong> Management Plan – <strong>San</strong> <strong>Dimas</strong><strong>Golden</strong> <strong>State</strong> <strong>Water</strong> <strong>Company</strong>g:\adminasst\jobs\<strong>2010</strong>\1070001.00_gswc-uwmp\09-reports\9.09-reports\2011-08\grp2b\gswc_sandimas_<strong>2010</strong>_uwmp-final.doc
Table 3-2:Base Period RangesBase Parameter Value Units10-yearbaseperiod5-yearbaseperiod2008 total water deliveries 13,454 Ac-ft2008 total volume of delivered recycledwater2008 recycled water as a percent oftotal deliveries0 Ac-ft0 PercentNumber of years in base period 10 YearsYear beginning base period range 1997Year ending base period range 2006Number of years in base period 5 YearsYear beginning base period range 2003Year ending base period range 2007Note:Table format based on DWR Guidebook Table 13.The average annual daily per capita water use in gpcd from 1997 through <strong>2010</strong> is provided inTable 3-3. The gallons per day calculation includes potable water entering the distributionsystem.Table 3-3:1997-<strong>2010</strong> Base Daily Use CalculationCalendarYearDistribution<strong>System</strong> PopulationGallons / DayDaily per Capita<strong>Water</strong> Use, gpcd1997 55,670 13,282,694 2391998 55,534 11,549,030 2081999 55,610 13,233,465 2382000 55,853 13,306,387 2382001 56,055 12,938,896 2312002 56,324 13,795,837 2452003 56,397 12,854,319 2282004 56,324 13,308,863 2362005 56,374 12,654,150 2242006 56,343 12,569,509 2232007 56,286 12,601,847 2242008 56,207 12,011,395 2142009 56,180 11,728,792 209<strong>2010</strong> 56,416 10,642,286 189Notes:1. Table format based on DWR Guidebook Tables 14 and 15.2. Usage in units of ccf/year provided by GSWC.Final Report, <strong>2010</strong> Urban <strong>Water</strong> Management Plan – <strong>San</strong> <strong>Dimas</strong> Page 3-5<strong>Golden</strong> <strong>State</strong> <strong>Water</strong> <strong>Company</strong>g:\adminasst\jobs\<strong>2010</strong>\1070001.00_gswc-uwmp\09-reports\9.09-reports\2011-08\grp2b\gswc_sandimas_<strong>2010</strong>_uwmp-final.doc
The 10-year averages available for GSWC to select are presented in Table 3-4; and the 5-yearaverages are shown in Table 3-5. The 1997-2006 10-year and 2003-2007 5-year average basedaily gpcd usages of 231 and 227 gpcd were respectively selected.Table 3-4: 10-Year Average Base DailyPer Capita <strong>Water</strong> Use10-Year PeriodAverage Base Daily PerCapita <strong>Water</strong> Use (gpcd)1997-2006 2311998-2007 2301999-2008 2302000-2009 2272001-<strong>2010</strong> 222Table 3-5: 5-Year Average Base DailyPer Capita <strong>Water</strong> UseAverage Base Daily Per5-Year Period Capita <strong>Water</strong> Use (gpcd)2003-2007 2272004-2008 2242005-2009 2192006-<strong>2010</strong> 2123.2.2 Urban <strong>Water</strong> Use TargetsRetail suppliers must identify their urban water use targets by utilizing one of four compliancemethods identified in SBX7-7. The four urban water use target development methods are asfollows:• Compliance Method 1 – 80 percent of baseline gpcd water use.• Compliance Method 2 – The sum of the following performance standards: indoor residentialuse (provisional standard set at 55 gpcd); plus landscape use, including dedicated andresidential meters or connections equivalent to the <strong>State</strong> Model Landscape Ordinance(70 percent of reference ETo; plus 10 percent reduction in baseline commercial, industrialinstitutional (CII) water use by 2020.• Compliance Method 3 – 95 percent of the applicable state hydrologic region target asidentified in the 2020 Conservation Plan (DWR, <strong>2010</strong>).• Compliance Method 4 – A provisional method identified and developed by DWR through apublic process released February 16, 2011 which aims to achieve a cumulative statewidePage 3-6Final Report, <strong>2010</strong> Urban <strong>Water</strong> Management Plan – <strong>San</strong> <strong>Dimas</strong><strong>Golden</strong> <strong>State</strong> <strong>Water</strong> <strong>Company</strong>g:\adminasst\jobs\<strong>2010</strong>\1070001.00_gswc-uwmp\09-reports\9.09-reports\2011-08\grp2b\gswc_sandimas_<strong>2010</strong>_uwmp-final.doc
20 percent reduction. This method assumes water savings will be obtained through meteringof unmetered water connections and achieving water conservation measures in three wateruse categories: (1) indoor residential, (2) landscape, water loss and water uses and (3) CII.GSWC elected to evaluate Compliance Methods 1 and 3 for selecting urban water use targetsfor the <strong>2010</strong> plan. The following section provides an explanation of the target calculations and asummary of the interim and compliance water use targets-7.Compliance Method 1 Calculation SummaryThe Compliance Method 1 2020 water use target was calculated by multiplying the base dailygpcd by 80 percent. A 20 percent reduction in baseline water use would require reduction of46 gpcd by 2020, as shown in Table 3-6. The 2015 interim target would be 208 gpcd with a2020 water use target of 185 gpcd.Table 3-6:2020 <strong>Water</strong> Use Target Method 1 Calculation SummaryDescriptionBaseline2015Interim Target2020 ComplianceTargetPer Capita <strong>Water</strong> Use (gpcd) 231 208 185Percent Reduction N/A 10% 20%Compliance Method 3 Calculation SummaryThe Compliance Method 3 2020 water use target was calculated by multiplying the respectivehydrologic region target by 95 percent. The <strong>San</strong> <strong>Dimas</strong> <strong>System</strong> is located in the South Coastregion (Region 4), which has a hydrologic region target of 149 gpcd and a baseline water use of180 gpcd. Ninety-five (95) percent of the Region 4 hydrologic region target results in a 2020water use target of 142 gpcd. Since the baseline of 231 gpcd is greater than 95 percent of thehydrologic regional target of 142 gpcd, a review of the minimum reduction target is not triggeredper the DWR methodologies.Table 3-7 presents the results of the Method 3 calculation:Table 3-7:2020 <strong>Water</strong> Use Target Method 3 Calculation Summary2020DescriptionBaseline2015 InterimTargetComplianceTargetPer Capita <strong>Water</strong> Use (gpcd) 231 186 142Percent Reduction n/a 19% 39%Minimum Compliance Reduction Target<strong>System</strong>s with a 5-year baseline per capita water use of greater than 100 gpcd must calculate aminimum water use reduction, which the 2020 water use target cannot exceed. The minimumwater use reduction compliance target is 95 percent of the 5-year rolling average base daily perFinal Report, <strong>2010</strong> Urban <strong>Water</strong> Management Plan – <strong>San</strong> <strong>Dimas</strong> Page 3-7<strong>Golden</strong> <strong>State</strong> <strong>Water</strong> <strong>Company</strong>g:\adminasst\jobs\<strong>2010</strong>\1070001.00_gswc-uwmp\09-reports\9.09-reports\2011-08\grp2b\gswc_sandimas_<strong>2010</strong>_uwmp-final.doc
capita water use (ending no earlier than December 31, 2007, and no later than December 31,<strong>2010</strong>). By this method, the minimum 2020 water use target for the <strong>San</strong> <strong>Dimas</strong> <strong>System</strong> is216 gpcd, as presented in Table 3-8 below:Table 3-8:Minimum 2020 ReductionDescription5-YrAverage2015InterimTarget2020 ComplianceTargetMinimum Allowable 2020 Target (gpcd) 227 221 2163.2.3 Interim and Compliance <strong>Water</strong> Use TargetsThe interim and compliance water use targets are provided per Section 10608.20(e) of the Act.Since both the Methods 1 and 3 compliance targets are less than the minimum reduction;compliance Method 1 was selected by GSWC for the <strong>San</strong> <strong>Dimas</strong> <strong>System</strong>. As a result, Table 3-9shows the 2020 SBX7-7 compliance target for the <strong>San</strong> <strong>Dimas</strong> <strong>System</strong> is 185 gpcd and the 2015interim water use target is 208 gpcd. The implementation plan for achieving these targets isdescribed in Section 4.8, Recycled <strong>Water</strong> and Chapter 7, Demand Management Measures.Table 3-9:SBX7-7 <strong>Water</strong> Use Reduction Targets (gpcd)Baseline2015 InterimTarget2020 ComplianceTarget231 208 1853.3 Projected <strong>Water</strong> UseGrowth projections for the number of service connections and volume of water use werecalculated for the year 2015 through 2035, in 5-year increments. Future water demands wereestimated using two different methods, a population-based approach and a historical-trendapproach, in order to present a projection range reflecting the inherent uncertainty in growthtrends. Additionally, demand projections are provided showing a scenario where the <strong>San</strong> <strong>Dimas</strong><strong>System</strong> fully meets water use target reductions by 2020 for comparison to current per capitawater use trends. Detailed descriptions of how the population-based and historical-trendprojections were calculated are provided below.The range established between these two approaches is intended as supplemental information;all connection and demand estimates use the population-based growth rate projections whichare higher and provide a more conservative estimate of future water use. The historical-trendprojections are provided as ancillary information only.Figure 3-2 shows the historical and projected number of metered service connections for the<strong>San</strong> <strong>Dimas</strong> <strong>System</strong> from 1994 through 2035. Figure 3-3 shows the historical and projectedwater use for the <strong>San</strong> <strong>Dimas</strong> <strong>System</strong> from 1994 until 2035.Page 3-8Final Report, <strong>2010</strong> Urban <strong>Water</strong> Management Plan – <strong>San</strong> <strong>Dimas</strong><strong>Golden</strong> <strong>State</strong> <strong>Water</strong> <strong>Company</strong>g:\adminasst\jobs\<strong>2010</strong>\1070001.00_gswc-uwmp\09-reports\9.09-reports\2011-08\grp2b\gswc_sandimas_<strong>2010</strong>_uwmp-final.doc
22,000Number of Active Connections21,00020,00019,00018,00017,00016,00015,0001990 2000 <strong>2010</strong> 2020 2030YearHistorical Number of Connections Population-Based Projections Historical-Trend ProjectionsFigure 3-2:Historical and Projected Number of Metered Service Connections18,00017,000HistoricalProjected<strong>Water</strong> Use (ac-ft/yr)16,00015,00014,00013,00012,00011,0001990 1995 2000 2005 <strong>2010</strong> 2015 2020 2025 2030 2035YearHistorical <strong>Water</strong> Use Population-Based Projections Historical-Trend ProjectionsFigure 3-3:Historical <strong>Water</strong> Use and Future <strong>Water</strong> Use ProjectionsHistorical water use records from 2000 through <strong>2010</strong> were analyzed to generate estimates offuture water demands.<strong>Water</strong> use factors were then developed for the <strong>2010</strong> <strong>UWMP</strong>’s projection of future water use. Awater use factor was calculated for each category in order to quantify the average water usedper metered connection. For a given customer type, the unit water use factor is calculated asthe total water sales for the category divided by the number of active service connections forthat category. The unit water use factors for each customer type were averaged over the dataFinal Report, <strong>2010</strong> Urban <strong>Water</strong> Management Plan – <strong>San</strong> <strong>Dimas</strong> Page 3-9<strong>Golden</strong> <strong>State</strong> <strong>Water</strong> <strong>Company</strong>g:\adminasst\jobs\<strong>2010</strong>\1070001.00_gswc-uwmp\09-reports\9.09-reports\2011-08\grp2b\gswc_sandimas_<strong>2010</strong>_uwmp-final.doc
ange from 2000 through <strong>2010</strong> in order to obtain a representative water use factor fordetermining water demand projections by customer type. Table 3-10 presents the water usefactors calculated for each customer category.Table 3-10:<strong>Water</strong> Use Factors for the <strong>San</strong> <strong>Dimas</strong> <strong>System</strong>Account CategorySingleFamilyMulti-FamilyCommercialIndustrialInstitutional/GovernmentLandscapeAgricultureOther (2)<strong>Water</strong> Use(1) 0.53 3.29 4.55 2.48 5.89 3.94 1.56 0.81FactorNotes:1. Based on customer water use data for calendar years 2000-<strong>2010</strong>.2. Other accounts for any service connections not included in any other category, including idle or inactiveconnections.The population-based water use projections are based on the population and housing growthrates described in Chapter 2. SCAG household projections were used to determine the growthin single-family and multi-family service connections for the years 2015, 2020, 2025, 2030, and2035. For example, the percent growth rate in households from the year <strong>2010</strong> to year 2015 wasmultiplied by the number of residential service connections in <strong>2010</strong> to obtain a projection of thenumber of connections in the year 2015. Similarly, employment growth projections were used todetermine the growth for commercial, industrial, institutional/government, landscape, andagriculture service connections. The population-based projected water use was then calculatedby multiplying the number of projected active service connections for each customer categoryby the corresponding customer average water use factor calculated above.The historical-trend water use projections are based on a linear projection of the historicalnumber of metered service connections. The average growth rate established by this historicaltrend was applied to the number of connections in each customer category to project the futurenumber of service connections. The historical-trend projected water use was then calculated bymultiplying the number of projected active service connections for each customer category withthe corresponding customer average water use factor calculated above.Figure 3-4 shows the population based water use projections by customer type. The populationbasedprojections of the number of service connections, and the resulting water demand, areprovided in Table 3-11.Page 3-10Final Report, <strong>2010</strong> Urban <strong>Water</strong> Management Plan – <strong>San</strong> <strong>Dimas</strong><strong>Golden</strong> <strong>State</strong> <strong>Water</strong> <strong>Company</strong>g:\adminasst\jobs\<strong>2010</strong>\1070001.00_gswc-uwmp\09-reports\9.09-reports\2011-08\grp2b\gswc_sandimas_<strong>2010</strong>_uwmp-final.doc
<strong>Water</strong> Use (ac-ft/yr)18,00016,00014,00012,00010,0008,0006,0004,0002,00002005 <strong>2010</strong> 2015 2020 2025 2030 2035YearAgricultureOtherLandscapeInstitutional /GovernmentIndustrialCommercialMulti FamilySingleFamilyFigure 3-4:Projected <strong>Water</strong> Use by Customer TypeFinal Report, <strong>2010</strong> Urban <strong>Water</strong> Management Plan – <strong>San</strong> <strong>Dimas</strong> Page 3-11<strong>Golden</strong> <strong>State</strong> <strong>Water</strong> <strong>Company</strong>g:\adminasst\jobs\<strong>2010</strong>\1070001.00_gswc-uwmp\09-reports\9.09-reports\2011-08\grp2b\gswc_sandimas_<strong>2010</strong>_uwmp-final.doc
Table 3-11:Projections of the Number of Metered Service Connections and <strong>Water</strong> Use for the <strong>San</strong> <strong>Dimas</strong> <strong>System</strong>Accounts by TypeYearProjectionTypeSingle-FamilyMulti-familyCommercialIndustrialInstitutional/GovernmentLandscapeAgricultureOther (3)TotalNo. ofAccounts2005 (2) <strong>Water</strong> Use(ac-ft)14,612 215 484 77 138 411 3 5 15,9457,546 773 2,039 186 785 1,513 1 9 12,852<strong>2010</strong>2015202020252030No. ofAccounts<strong>Water</strong> Use(ac-ft)No. ofAccounts<strong>Water</strong> Use(ac-ft)No. ofAccounts<strong>Water</strong> Use(ac-ft)No. ofAccounts<strong>Water</strong> Use(ac-ft)No. ofAccounts<strong>Water</strong> Use(ac-ft)14,622 216 483 93 151 402 3 5 15,9756,377 653 1,930 204 684 1,234 1 2 11,08515,419 228 498 96 156 415 4 6 16,8228,146 749 2,264 238 919 1,636 6 5 13,96316,847 249 508 98 159 423 4 6 18,2948,898 818 2,310 243 937 1,668 6 5 14,88518,005 266 520 100 163 433 4 6 19,4979,511 874 2,364 248 960 1,707 6 5 15,67519,094 283 532 103 167 443 4 6 20,63210,086 930 2,419 256 984 1,746 6 5 16,4322035No. ofAccounts<strong>Water</strong> Use(ac-ft)19,968 295 544 105 170 453 4 6 21,54510,545 970 2,474 261 1,002 1,786 6 5 17,049Notes:1. This table is based on the DWR Guidebook Tables 3 through 7.2. Based on calendar year.3. Other accounts for any service connections not included in any other category, including idle or inactive connections.4. All connections are metered.Page 3-12Final Report, <strong>2010</strong> Urban <strong>Water</strong> Management Plan – <strong>San</strong> <strong>Dimas</strong><strong>Golden</strong> <strong>State</strong> <strong>Water</strong> <strong>Company</strong>g:\adminasst\jobs\<strong>2010</strong>\1070001.00_gswc-uwmp\09-reports\9.09-reports\2011-08\grp2b\gswc_sandimas_<strong>2010</strong>_uwmp-final.doc
3.4 Sales to Other AgenciesThere are no sales to other agencies for the <strong>San</strong> <strong>Dimas</strong> <strong>System</strong>; therefore, Table 3-12 hasintentionally been left blank.Table 3-12:Sales to Other Agencies in ac-ft/yr<strong>Water</strong> Distributed 2005 (2) <strong>2010</strong> 2015 2020 2025 2030 2035N/A N/A N/A N/A N/A N/A N/A N/ANotes:1. This table is based on the DWR Guidebook Table 9.2. Based on calendar year.3.5 Other <strong>Water</strong> Uses and <strong>System</strong> LossesIn order to estimate total water demand, other water uses, as well as any water lost duringconveyance, must be added to the customer demand. California regulation requires watersuppliers to quantify any additional water uses not included as a part of water use by customertype. There are no other water uses in addition to those already reported in the <strong>San</strong> <strong>Dimas</strong><strong>System</strong>.<strong>System</strong> losses must be incorporated when projecting total water demand. <strong>System</strong> losses (alsoknown as non-revenue water) are defined as the difference between annual water productionand annual sales. Included are system losses due to leaks, reservoir overflows, or inaccuratemeters, and other water used in operations such as system flushing and filter backwashingGSWC does not tabulate system losses separately from other water uses; such as operations.In the <strong>San</strong> <strong>Dimas</strong> <strong>System</strong>, from 2000 through <strong>2010</strong>, system water losses have averagedapproximately 6.2 percent of the total production; therefore, this rate was incorporated intowater demand projections. Table 3-13 provides a summary of projected system losses for waterin the <strong>San</strong> <strong>Dimas</strong> <strong>System</strong>.Table 3-13:Additional <strong>Water</strong> Uses and Losses in ac-ft/yr<strong>Water</strong>-Use Type 2005 (2) <strong>2010</strong> 2015 2020 2025 2030 2035Other <strong>Water</strong> Uses N/A N/A N/A N/A N/A N/A N/AUnaccounted-for <strong>System</strong>(3) 1,322 837 866 923 972 1,019 1,058LossesTotal 1,322 837 866 923 972 1,019 1,058Notes:1. This table is based on the DWR Guidebook Table 10.2. Based on calendar year.3. Includes system losses due to leaks, reservoir overflows, and inaccurate meters, as well as water used in operations.Final Report, <strong>2010</strong> Urban <strong>Water</strong> Management Plan – <strong>San</strong> <strong>Dimas</strong> Page 3-13<strong>Golden</strong> <strong>State</strong> <strong>Water</strong> <strong>Company</strong>g:\adminasst\jobs\<strong>2010</strong>\1070001.00_gswc-uwmp\09-reports\9.09-reports\2011-08\grp2b\gswc_sandimas_<strong>2010</strong>_uwmp-final.doc
3.6 Total <strong>Water</strong> DemandAs described above, other water uses, as well as any water lost during conveyance, must beadded to the customer demand in order to project total water demand for the <strong>San</strong> <strong>Dimas</strong><strong>System</strong>. Although there are no other water uses contributing to the total water demand in the<strong>San</strong> <strong>Dimas</strong> <strong>System</strong>, other water uses and system water losses must be incorporated into thetotal water demand. Table 3-14 summarizes the projections of water sales, other water usesand system losses, and total water demand through the year 2035.The projected water sales and system losses were added to estimate the total baseline waterdemand shown in Table 3-14. The baseline demand projections below do not include water usereductions due to additional implementation of future DMMs or other conservation activities.Baseline demands are used for supply reliability evaluation purposes throughout this <strong>UWMP</strong> forestimates of water supplies that may be required to meet system demands for the next25 years. Figure 3-5 shows the projected total water demand through 2035.Projected water demands assuming SBX7-7 compliance are also provided in Table 3-14 forreference purposes; assuming full compliance with the SBX7-7 interim and 2020 water usereduction targets. SBX7-7 compliance water demands were calculated by multiplying theprojected population by the applicable water use target. Future water use that is exempt fromSBX7-7, such as industrial process water or direct reuse recycled water is not included in thisprojection.Table 3-14:Projected Total <strong>Water</strong> Demand and SBX7-7 Compliance Projections in ac-ft/yrSBX7-7 Compliance ProjectionsYear (2)Projected <strong>Water</strong>SalesOther <strong>Water</strong>Uses and<strong>System</strong> LossesTotal Baseline<strong>Water</strong> Demand<strong>Water</strong> SavingsTotal <strong>Water</strong>Demand withSavings2005 12,852 1,322 14,174 0 N/A<strong>2010</strong> 11,085 837 11,922 0 N/A2015 13,963 866 14,829 1,078 13,7502020 14,885 923 15,809 2,655 13,1532025 15,675 972 16,648 2,529 14,1192030 16,432 1,019 17,451 2,415 15,0362035 17,049 1,058 18,107 2,198 15,909Notes:1. This table is based on the DWR Guidebook Table 11.2. Based on calendar year.Page 3-14Final Report, <strong>2010</strong> Urban <strong>Water</strong> Management Plan – <strong>San</strong> <strong>Dimas</strong><strong>Golden</strong> <strong>State</strong> <strong>Water</strong> <strong>Company</strong>g:\adminasst\jobs\<strong>2010</strong>\1070001.00_gswc-uwmp\09-reports\9.09-reports\2011-08\grp2b\gswc_sandimas_<strong>2010</strong>_uwmp-final.doc
Total <strong>Water</strong> Demand(ac-ft/yr)21,00018,00015,00012,0009,0006,0003,00002005 <strong>2010</strong> 2015 2020 2025 2030 2035YearTotal <strong>Water</strong> Demand Baseline Total <strong>Water</strong> Demand with SBx7-7 ComplianceFigure 3-5:Total <strong>Water</strong> Demand3.7 Data Provided to Wholesale AgencyGSWC provided the following projected water use data in late <strong>2010</strong> to Three Valleys Municipal<strong>Water</strong> District and Covina Irrigating <strong>Company</strong>, its wholesale water suppliers for the <strong>San</strong> <strong>Dimas</strong><strong>System</strong>, as summarized in Table 3-15. Since the preliminary projections were submitted in<strong>2010</strong>, GSWC has refined projections by integrating actual <strong>2010</strong> water usage and supply data.As a result, the projections shown in Table 3-15 below do not agree with the demandspresented in other chapters of this <strong>UWMP</strong>. As required per Section 10631(k) the supportingdocumentation providing the water use projections to the wholesale agency is included inAppendix I.Table 3-15:Summary of <strong>San</strong> <strong>Dimas</strong> <strong>System</strong> Data Provided to TVMWD in ac-ft/yrWholesalerContractedVolume <strong>2010</strong> 2015 2020 2025 2030 2035TVMWD N/A 11,636 12,319 13,365 14,255 15,105 15,815CovinaIrrigating<strong>Company</strong>N/A 60 60 60 60 60 60Note:This table is based on the DWR Guidebook Table 12.Final Report, <strong>2010</strong> Urban <strong>Water</strong> Management Plan – <strong>San</strong> <strong>Dimas</strong> Page 3-15<strong>Golden</strong> <strong>State</strong> <strong>Water</strong> <strong>Company</strong>g:\adminasst\jobs\<strong>2010</strong>\1070001.00_gswc-uwmp\09-reports\9.09-reports\2011-08\grp2b\gswc_sandimas_<strong>2010</strong>_uwmp-final.doc
3.8 Disadvantaged Community <strong>Water</strong> Use ProjectionsSection 10631.1 (a). Include projected water use for single-family and multi-family residential housing neededfor lower income households, as identified in the housing element of any city, county, or city and county in theservice area of the supplier.Senate Bill 1087 requires that water use projections of a <strong>UWMP</strong> include the projected water usefor single-family and multi-family residential housing for lower income households as identifiedin the housing element of any city, county, or city and county in the service area of the supplier.Housing elements rely on the Regional Housing Needs Allocation (RHNA) generated by the<strong>State</strong> Department of Housing and Community Development (HCD) to allocate the regional needfor housing to the regional Council of Governments (COG) (or a HCD for cities and counties notcovered by a COG) for incorporation into housing element updates. Before the housing elementis due, the HCD determines the total regional housing need for the next planning period for eachregion in the state and allocates that need. The COGs then allocate to each local jurisdiction its“fair share” of the RHNA, broken down by income categories; very low, low, moderate, andabove moderate, over the housing element’s planning period.The County of Los Angeles last updated its housing element in 2006. A lower income house isdefined as 80 percent median income, adjusted for family size. The County’s housing elementidentifies the target number of low-income households in the County from 2006 to 2013 as 15.7percent and very low-income households as 24.7 percent. However, it is unknown whatpercentage of the low-income and very low-income households are within GSWC’s <strong>San</strong> <strong>Dimas</strong>service area. For this reason, it is not possible to project water use for lower income householdsseparately from overall residential demand. However, to remain consistent with the intent of theSB-1087 legislation and to comply with the <strong>UWMP</strong> Act, an effort has been made to identifythose water use projections for future single and multi-family households based on theaggregate percentage of both the low-income and very low-income categories. 40 percent wasused to estimate the lower income demand projections as shown in Table 3-16 below.Table 3-16:Low-Income Projected <strong>Water</strong> Demands in ac-ft/yr2015 2020 2025 2030 2035Single-Family Residence 714 1,018 1,266 1,498 1,684Multi-Family Residence 39 67 90 112 128Total 753 1,085 1,355 1,610 1,812Note:This table is based on the DWR Guidebook Table 8.Page 3-16Final Report, <strong>2010</strong> Urban <strong>Water</strong> Management Plan – <strong>San</strong> <strong>Dimas</strong><strong>Golden</strong> <strong>State</strong> <strong>Water</strong> <strong>Company</strong>g:\adminasst\jobs\<strong>2010</strong>\1070001.00_gswc-uwmp\09-reports\9.09-reports\2011-08\grp2b\gswc_sandimas_<strong>2010</strong>_uwmp-final.doc
GSWC will not deny or conditionally approve water services, or reduce the amount of servicesapplied for by a proposed development that includes housing units affordable to lower incomehouseholds unless one of the following occurs:• GSWC specifically finds that it does not have sufficient water supply.• GSWC is subject to a compliance order issued by the <strong>State</strong> Department of Public Healththat prohibits new water connections.• The applicant has failed to agree to reasonable terms and conditions relating to theprovision of services.Final Report, <strong>2010</strong> Urban <strong>Water</strong> Management Plan – <strong>San</strong> <strong>Dimas</strong> Page 3-17<strong>Golden</strong> <strong>State</strong> <strong>Water</strong> <strong>Company</strong>g:\adminasst\jobs\<strong>2010</strong>\1070001.00_gswc-uwmp\09-reports\9.09-reports\2011-08\grp2b\gswc_sandimas_<strong>2010</strong>_uwmp-final.doc
THIS PAGE INTENTIONALLY BLANKPage 3-18Final Report, <strong>2010</strong> Urban <strong>Water</strong> Management Plan – <strong>San</strong> <strong>Dimas</strong><strong>Golden</strong> <strong>State</strong> <strong>Water</strong> <strong>Company</strong>g:\adminasst\jobs\<strong>2010</strong>\1070001.00_gswc-uwmp\09-reports\9.09-reports\2011-08\grp2b\gswc_sandimas_<strong>2010</strong>_uwmp-final.doc
Chapter 4: <strong>Water</strong> SupplyA detailed evaluation of water supply is required by the Act. Sections 10631 (b) through (d) and(h) of the Act state the following:Section 10631.(b) Identify and quantify, to the extent practicable, the existing and planned sources of water available to thesupplier over the same five-year increments described in subdivision (a). If groundwater is identified as anexisting or planned source of water available to the supplier, all of the following information shall beincluded in the plan:(1) A copy of any groundwater management plan adopted by the urban water supplier, including plansadopted pursuant to Part 2.75 (commencing with Section 10750), or any other specific authorizationfor groundwater management.(2) A description of any groundwater basin or basins from which the urban water supplier pumpsgroundwater. For those basins for which a court or the board has adjudicated the rights to pumpgroundwater, a copy of the order or decree adopted by the court or the board and a description ofthe amount of groundwater the urban water supplier has the legal right to pump under the order ordecree. For basins that have not been adjudicated, information as to whether the department hasidentified the basin or basins as overdrafted or has projected that the basin will become overdraftedif present management conditions continue, in the most current official departmental bulletin thatcharacterizes the condition of the groundwater basin, and a detailed description of the efforts beingundertaken by the urban water supplier to eliminate the long-term overdraft condition.(3) A detailed description and analysis of the location, amount, and sufficiency of groundwater pumpedby the urban water supplier for the past five years. The description and analysis shall be based oninformation that is reasonably available, including, but not limited to, historic use records.(4) A detailed description and analysis of the amount and location of groundwater that is projected to bepumped by the urban water supplier. The description and analysis shall be based on informationthat is reasonably available, including, but not limited to, historic use records.(c) (1) Describe the reliability of the water supply and vulnerability to seasonal or climatic shortage, to theextent practicable, and provide data for each of the following:(A) An average water year.(B) A single dry water year.(C) Multiple dry water years.(2) For any water source that may not be available at a consistent level of use, given specific legal,environmental, water quality, or climatic factors, describe plans to supplement or replace thatsource with alternative sources or water demand management measures, to the extent practicable.(d) Describe the opportunities for exchanges or transfers of water on a short-term or long-term basis.(h) Include a description of all water supply projects and water supply programs that may be undertaken bythe urban water supplier to meet the total projected water use as established pursuant to subdivision (a)of Section 10635. The urban water supplier shall include a detailed description of expected future projectsand programs, other than the demand management programs identified pursuant to paragraph (1) ofsubdivision (f), that the urban water supplier may implement to increase the amount of the water supplyavailable to the urban water supplier in average, single dry, and multiple dry water years. The descriptionshall identify specific projects and include a description of the increase in water supply that is expected tobe available from each project. The description shall include an estimate with regard to theimplementation timeline for each project or program.This chapter addresses the water supply sources of the <strong>San</strong> <strong>Dimas</strong> <strong>System</strong>. The followingchapter provides details in response to those requirements of this portion of the Act.Final Report, <strong>2010</strong> Urban <strong>Water</strong> Management Plan – <strong>San</strong> <strong>Dimas</strong> Page 4-1<strong>Golden</strong> <strong>State</strong> <strong>Water</strong> <strong>Company</strong>g:\adminasst\jobs\<strong>2010</strong>\1070001.00_gswc-uwmp\09-reports\9.09-reports\2011-08\grp2b\gswc_sandimas_<strong>2010</strong>_uwmp-final.doc
4.1 <strong>Water</strong> SourcesThe <strong>Golden</strong> <strong>State</strong> <strong>Water</strong> <strong>Company</strong> (GSWC) obtains its water supply for the <strong>San</strong> <strong>Dimas</strong> <strong>System</strong>from local groundwater from the Main <strong>San</strong> Gabriel Groundwater Basin (Basin), purchased waterfrom the Three Valleys Municipal <strong>Water</strong> District (TVMWD), and local surface water from theCovina Irrigating <strong>Company</strong> (CIC). TVMWD obtains its imported water supply from theMetropolitan <strong>Water</strong> District of Southern California (Metropolitan). The CIC diverts surface waterfrom the <strong>San</strong> Gabriel River. In addition, GSWC also diverts untreated surface water from <strong>San</strong><strong>Dimas</strong> Canyon Creek for use as golf course irrigation.As described in Section 4.3.1, if demands for groundwater increase beyond the allocated OSYfor the <strong>San</strong> <strong>Dimas</strong> <strong>System</strong>, GSWC can either obtain additional water rights or purchasereplenishment water. <strong>Water</strong> rights may be obtained by purchasing or leasing existing rights fromother producers in the basin. Groundwater pumping in excess of rights is permitted whenreplaced in kind with available replenishment water that is purchased from the Basin’sresponsible agency. TVMWD is the responsible agency for the portion of the Basin from whichgroundwater is pumped from the <strong>San</strong> <strong>Dimas</strong> <strong>System</strong>s.Table 4-1 below, summarizes the approximate amount of water supplied from each source inacre-feet per year. GSWC’s water supply is projected to increase by about 52 percent from<strong>2010</strong> to 2035 to meet the associated projected water demands, with the majority of this demandbeing met by purchased water from TVMWD. This water supply summary is based on ananalysis of groundwater supply and information included in the <strong>2010</strong> <strong>UWMP</strong>s prepared byTVMWD and CIC. The planned supplies from the surface diversion are based on averagesupplies between 2005 and <strong>2010</strong>. Groundwater makes up between 18 and 31 percent of theavailable water supply, whereas the purchased water is between 67 and 79 percent. Thesurface diversion source is about three percent of available supply.There is currently one project in place to use recycled water within the <strong>San</strong> <strong>Dimas</strong> <strong>System</strong>.GSWC has recently signed a contract with Forest Lawn Cemetery to use recycled waterprovided by California <strong>State</strong> Polytechnic University (Cal-Poly) for irrigation on their Covina Hillsfacility. GSWC will provide potable water as a back-up supply (see Section 4.8.3). GSWCpresently provides potable water for irrigation of Forest Lawn Covina Hills. There are no otherplans or uses of recycled water for the <strong>San</strong> <strong>Dimas</strong> system. The potential for additional futurerecycled water use is described in Section 4.8.Page 4-2Final Report, <strong>2010</strong> Urban <strong>Water</strong> Management Plan – <strong>San</strong> <strong>Dimas</strong><strong>Golden</strong> <strong>State</strong> <strong>Water</strong> <strong>Company</strong>g:\adminasst\jobs\<strong>2010</strong>\1070001.00_gswc-uwmp\09-reports\9.09-reports\2011-08\grp2b\gswc_sandimas_<strong>2010</strong>_uwmp-final.doc
Table 4-1:Current and Planned <strong>Water</strong> Supplies for the <strong>San</strong> <strong>Dimas</strong> <strong>System</strong> in ac-ft/yrSource <strong>2010</strong> (1) 2015 2020 2025 2030 2035Purchased water from TVMWD 7,967 10,963 11,943 12,782 13,585 14,241Purchased water from CIC 34 60 60 60 60 60Groundwater (2) 3,730 3,306 3,306 3,306 3,306 3,306Surface Diversion 190 500 500 500 500 500Recycled water 0 0 0 0 0 0Total 11,922 14,829 15,809 16,648 17,451 18,107Notes:1. <strong>2010</strong> water supplies are based on actual production records.2. 2015-2035 groundwater projections are based on projected use in the Main <strong>San</strong> Gabriel Groundwater Basin assuming the FY2009-<strong>2010</strong> OSY of 190,000 ac-ft.3. Table format based on DWR Guidebook Table 16.This water supply summary is based on GSWC’s groundwater management strategy for the<strong>San</strong> <strong>Dimas</strong> <strong>System</strong>, and information provided by TVMWD and CIC. Each water supply source issummarized below and discussed in greater detail in the following sections. <strong>Water</strong> demandprojections are documented in Chapter 3. A discussion of the reliability of all sources of watersupply is provided in Chapter 6.Groundwater: Currently, the <strong>San</strong> <strong>Dimas</strong> <strong>System</strong>’s groundwater is pumped from a total of eightactive groundwater wells located in the adjudicated Main <strong>San</strong> Gabriel Basin. These wells have acurrent total active capacity of 7,227 acre-feet per year (ac-ft/yr). Between 2005 and <strong>2010</strong>, theactual production averaged 3,760 ac-ft/yr.Purchased water: Includes purchased water from TVMWD and CIC.GSWC also has rights to divert 500 ac-ft/yr of surface water from <strong>San</strong> <strong>Dimas</strong> Canyon Creek.This water can either be diverted directly from the creek or added to the <strong>Company</strong>’sgroundwater pumping rights within the Main <strong>San</strong> Gabriel Basin.4.2 Purchased <strong>Water</strong>The TVMWD is a member agency of the Metropolitan <strong>Water</strong> District (Metropolitan) providingtreated water to several agencies, including GSWC. Covina Irrigating <strong>Company</strong> obtains its waterfrom surface water diversions from the <strong>San</strong> Gabriel River and groundwater pumped from theMain <strong>San</strong> Gabriel Basin. Additional details regarding TVMWD’s and CIC’s water supplies can befound each respective agency’s <strong>2010</strong> <strong>UWMP</strong>. <strong>Water</strong> purchased from the TVMWD (with threeconnections) and CIC (with one connection) is delivered to the <strong>San</strong> <strong>Dimas</strong> <strong>System</strong> through thefollowing:• Baseline connection with TVMWD with a design capacity of 2,800 gallons per minute (gpm).• PM-7 connection with TVMWD with a design capacity of 6,750 gpm.Final Report, <strong>2010</strong> Urban <strong>Water</strong> Management Plan – <strong>San</strong> <strong>Dimas</strong> Page 4-3<strong>Golden</strong> <strong>State</strong> <strong>Water</strong> <strong>Company</strong>g:\adminasst\jobs\<strong>2010</strong>\1070001.00_gswc-uwmp\09-reports\9.09-reports\2011-08\grp2b\gswc_sandimas_<strong>2010</strong>_uwmp-final.doc
• PM-16 connection with TVMWD with a design capacity of 9,000 gpm.• Covina (CIC) connection with a design capacity of 1,200 gpm.These connections have a combined active design capacity of 19,750 gpm. Total connectioncapacity with TVMWD accounts for 18,550 gpm and with CIC for 1,200 gpm. All waterpurchased by GSWC through the baseline connection is treated at TVMWD’s Miramar <strong>Water</strong>Treatment Plant. The Miramar <strong>Water</strong> Treatment Plant has a capacity of 38 mgd.TVMWD uses a tiered rate structure for delivering water to its retail member agencies, includingGSWC. The <strong>San</strong> <strong>Dimas</strong> and Claremont <strong>System</strong>s have a combined allocation of 13,166 ac-ft/yrof TVMWD Tier 1 water for <strong>2010</strong>. The tiered program allocates to each retail member agency aspecific quantity of import water at a set rate for the calendar year. Any consumption over theTier 1 allocation will incur Tier 2 rates, which are significantly higher. The individual Tier 1allocations were initially developed based on average annual import water use during the10-year period prior to the start of the tier program 9 years ago. Currently, the tiered approachonly affects the price of water, not its availability.Historically, GSWC has purchased a small portion of its water supply from CIC for the<strong>San</strong> <strong>Dimas</strong> <strong>System</strong>. The average supply from CIC has been 500 ac-ft/yr between 2005 and<strong>2010</strong>, but will likely be reduced and continue at approximately 60 ac-ft/yr. GSWC owns 66shares in CIC which entitles GSWC to approximately 65 ac-ft/yr of CIC water supply. To obtainwater in excess of this amount, GSWC must either lease shares from other shareholders orpurchase surplus water from the CIC.In addition, GSWC has the following four emergency connections:• Connection with the City of La Verne with a design capacity of 1,000 gpm.• Connection with the City of Glendora with a design capacity of 1,000 gpm.• Connection with the City of Covina with a design capacity of 1,000 gpm.• Connection with the Walnut Valley <strong>Water</strong> District with a design capacity of 1,000 gpm.Emergency connections are available in the event that the primary sources of supply are lost orunavailable for any reason. The emergency connections cannot be used for normal operations.4.3 GroundwaterA brief description of the Main <strong>San</strong> Gabriel Basin (Main Basin), including the groundwatersupplies available to GSWC is provided below. Additional information can be found in thereferences cited in these sections.The Main <strong>San</strong> Gabriel Basin has a surface area of approximately 154,000 acres (241 squaremiles). It is bounded by the Raymond fault and the contact between Quaternary sediments andconsolidated basement rocks of the <strong>San</strong> Gabriel Mountains on the north, by the Repetto,Merced, and Puente Hills on the south and west, and by the Chino and <strong>San</strong> Jose faults on theeast.Page 4-4Final Report, <strong>2010</strong> Urban <strong>Water</strong> Management Plan – <strong>San</strong> <strong>Dimas</strong><strong>Golden</strong> <strong>State</strong> <strong>Water</strong> <strong>Company</strong>g:\adminasst\jobs\<strong>2010</strong>\1070001.00_gswc-uwmp\09-reports\9.09-reports\2011-08\grp2b\gswc_sandimas_<strong>2010</strong>_uwmp-final.doc
<strong>Water</strong>-bearing units in the Main <strong>San</strong> Gabriel Basin are alluvium and the <strong>San</strong> Pedro Formation.The alluvium consists of Pleistocene and Holocene deposits with a total thickness ranging from40 feet to over 4,000 feet. The Holocene alluvium consists of alluvial fans and stream depositsand is approximately 100 feet in thickness (DWR, 2004). The Pleistocene alluvium forms mostof the productive water-bearing deposits in the basin and consists mainly of unsorted, angular tosub-rounded sedimentary deposits ranging from gravels near the <strong>San</strong> Gabriel Mountains tosands and silts in the central and western parts of the basin (DWR, 2004). The Pleistocenealluvium varies in thickness from 40 feet in the north to 4,100 feet in the central portion of thebasin (DWR, 2004). The <strong>San</strong> Pedro formation also bears fresh water and consists ofinterbedded marine sand, gravel, and silt. The maximum thickness of the <strong>San</strong> Pedro formationis approximate 2,000 feet. (DWR, 2004)Estimates of the hydraulic conductivities in the basin range from 270 feet per day (ft/d) for gravelto 0.001 ft/d for clay (CH2M HILL, 1986). <strong>San</strong>d and gravel was estimated to have a hydraulicconductivity of 135 ft/d and sandy clay being 10 ft/d (CH2M HILL, 1986). These values ofhydraulic conductivities are an estimate based on aquifer test and boring log descriptions of thesediments.Groundwater levels have historically fluctuated in the basin. Since 1993, the water levels for theBaldwin Park Key Well have varied about from an elevation high of 272 feet to a historic low in2009 of 189.2 feet (Upper District, <strong>2010</strong>). The Main <strong>San</strong> Gabriel Basin <strong>Water</strong>master(<strong>Water</strong>master) reported in <strong>2010</strong> that the groundwater levels in the Baldwin Park Key Well havebeen just above the lower value of the operating range of storage for the groundwater basin at204.2 feet as of June 26, <strong>2010</strong>. One foot of elevation change of the Key Well is roughly equal toa change in water storage of 8,000 ac-ft. The total storage capacity of the <strong>San</strong> Gabriel Basin isestimated to be about 8.6 million ac-ft (<strong>Water</strong>master, 2011). The historic high groundwaterelevation was measured in 1916 at 329.1 feet at which time the Main <strong>San</strong> Gabriel Basin storagewas estimated at 8.7 million ac-ft. The historic low groundwater elevation was 189.2 feet in 2009when the Main <strong>San</strong> Gabriel Basin storage was estimated at 7.6 million ac-ft.4.3.1 Main <strong>San</strong> Gabriel Basin AdjudicationIn 1973, the right to use groundwater from the <strong>San</strong> Gabriel Valley Basin was adjudicated in thecase Upper <strong>San</strong> Gabriel Valley Municipal <strong>Water</strong> District vs. City of Alhambra, et al (SuperiorCourt, County of Los Angeles, Case no. 924128, Appendix F). During the adjudication process,the safe yield of the basin was studied to help assign prescriptive pumping rights. The totalprescriptive pumping right for the Main <strong>San</strong> Gabriel Basin was established at 197,634 ac-ft. Thisprescriptive right was only used during the adjudication to determine the baseline share ofpumping rights for each water producer in the basin.The Main <strong>San</strong> Gabriel Basin <strong>Water</strong>master regulates groundwater production within the basin.Each year the <strong>Water</strong>master determines the operating safe yield (OSY) for the basin, which maybe larger or smaller than the total prescriptive right of 197,634 ac-ft. The <strong>Water</strong>master performshydrologic balance calculations to assess the groundwater conditions in the Main <strong>San</strong> GabrielBasin. The hydrologic assessments are based on an evaluation of groundwater levels in theBasin, determination of the previous year’s recharge and extraction activities, estimates of thecurrent year’s recharges and extractions, water quality, historic and current rainfall data, and theavailability of imported water. The OSY has historically fluctuated to account for wet or dryconditions in the basin, accommodating the availability of imported water that may be needed tosupplement local water supplies and recharge of the basin.Final Report, <strong>2010</strong> Urban <strong>Water</strong> Management Plan – <strong>San</strong> <strong>Dimas</strong> Page 4-5<strong>Golden</strong> <strong>State</strong> <strong>Water</strong> <strong>Company</strong>g:\adminasst\jobs\<strong>2010</strong>\1070001.00_gswc-uwmp\09-reports\9.09-reports\2011-08\grp2b\gswc_sandimas_<strong>2010</strong>_uwmp-final.doc
The OSY is the amount of water that can be pumped from the basin before the <strong>Water</strong>masterimposes a “Replacement <strong>Water</strong> Assessment” to replenish the basin with imported water. GSWCmay pump groundwater in excess of the OSY as long as it pays the Replacement <strong>Water</strong>Assessment. Each water right holder is assigned a set percentage of the OSY annually.Because the OSY is recalculated each fiscal year (FY), the actual amount of water GSWC canpump free of the replenishment assessment can vary annually. Since the basin was adjudicatedin 1973, the OSY has ranged from a low of 140,000 ac-ft (FY 1991 – 1992) to a high of240,000 ac-ft (FY’s 2005 – 2007).<strong>Water</strong> pumped in excess of the OSY is managed by TVMWD, the applicable responsibleagency, which is determined by geographic and political boundaries under terms of theJudgment. TVMWD is responsible for ensuring that the basin is not overdrawn in any givenyear, i.e. that total groundwater production equals OSY water rights plus replenishment water.Replenishment water must be available to allow pumping in excess of the OSY. For the pasttwo years, replenishment water has not been available for recharge in the basin. Theresponsible parties have implemented cyclic storage agreements to provide replenishmentwater supplies during periods of reduced imported water availability. Additional descriptions ofgroundwater supply reliability and cyclic storage are provided in Chapter 6.GSWC has pumping rights to 1.73984 percent of the groundwater in the Main <strong>San</strong> GabrielGroundwater Basin for the <strong>San</strong> <strong>Dimas</strong> <strong>System</strong>. The OSY was established at 210,000 ac-ft/yr inMay 2011 for FY 2011-12 which means GSWC’s current pumping right is 3,654 ac-ft/yr.However, since the OSY is set annually by the <strong>Water</strong>master, it was conservatively assumed thatthe long-term average OSY will be equal to 190,000 ac-ft/yr for a pumping right of 3,306 ac-ft/yr.This total could be increased by purchasing or leasing additional water rights from otherpumpers in the Basin. Furthermore, the adjudication for the Main <strong>San</strong> Gabriel Basin permitsproducers to carry over water rights from previous years and to pump more than their share ofthe OSY, provided they pay a replenishment fee for all excess production. GSWC’s total shareof the Main <strong>San</strong> Gabriel Basin OSY for the <strong>San</strong> <strong>Dimas</strong> <strong>System</strong> has varied from 2,436 ac-ft/yr to4,176 ac-ft/yr. This range reflects the low and high of the OSY since the basin was adjudicatedand includes 500 ac-ft/yr of rights that can be used from either surface water or groundwater.The historic low, high, and current operating safe yield for the Main <strong>San</strong> Gabriel Basin areshown in Table 4-2Table 4-2:Main <strong>San</strong> Gabriel Basin Groundwater Pumping RightsCondition/Time PeriodOperating Safe Yield (ac-ft/yr)GSWC Pumping Rights (1)(ac-ft/yr)Historic Low OSY (FY 1991 – 1992) 140,000 2,436Historic High OSY (FY 2005 – 2007) 240,000 4,176Current OSY (FY 2011 – 2012) 210,000 3,654Notes:1. GSWC pumping right is equal to 1.73984 percent of the OSY for the <strong>San</strong> <strong>Dimas</strong> <strong>System</strong>.2. OSY is reassessed on an annual basis.GSWC currently operates eight active wells in the Main <strong>San</strong> Gabriel Basin, as listed inTable 4-3. Well production capacity is provided in terms of instantaneous capacity in gpm andannual yield in ac-ft/yr for the <strong>San</strong> <strong>Dimas</strong> <strong>System</strong>. The total normal year well capacity forGSWC’s <strong>San</strong> <strong>Dimas</strong> <strong>System</strong> is 4,480 gpm (7,227 ac-ft/yr).Page 4-6Final Report, <strong>2010</strong> Urban <strong>Water</strong> Management Plan – <strong>San</strong> <strong>Dimas</strong><strong>Golden</strong> <strong>State</strong> <strong>Water</strong> <strong>Company</strong>g:\adminasst\jobs\<strong>2010</strong>\1070001.00_gswc-uwmp\09-reports\9.09-reports\2011-08\grp2b\gswc_sandimas_<strong>2010</strong>_uwmp-final.doc
Table 4-3:Well Name and CapacityWell NameCurrent WellCapacity(gpm) (1)Current WellCapacity(ac-ft/yr)Artesia No. 3 250 403Baseline No. 3 650 1,048Baseline No. 4 650 1,048Columbia Reservoir No. 4 400 645Columbia No. 6 430 694Highway No. 1 650 1,048Highway No. 2 1,000 1,613Malone No. 1 450 726Total Capacity 4,480 7,227Note:1. Estimated annual average current well production capacity isprovided; actual and design instantaneous pumping capacity may begreater for each well.Table 4-4 shows the pumping history for the <strong>San</strong> <strong>Dimas</strong> <strong>System</strong> for calendar years 2005through <strong>2010</strong>. From 2005 to <strong>2010</strong>, groundwater represented between 14 and 38 percent of thetotal water supply for the <strong>San</strong> <strong>Dimas</strong> <strong>System</strong>. The remaining water supply is obtained frompurchased or surface water.Table 4-4:Groundwater Pumping History by <strong>San</strong> <strong>Dimas</strong> <strong>System</strong> (2005 to <strong>2010</strong>) in ac-ftBasin NameMetered orUnmetered 2005 2006 2007 2008 2009 <strong>2010</strong>Main <strong>San</strong> Gabriel Metered 1,958 4,372 5,365 3,783 3,353 3,730Percent of Total<strong>Water</strong> SupplyNotes:1. Table format based on DWR Guidebook Table 18.2. Years are reported in calendar years (January 1 – December 31).14% 31% 38% 28% 26% 31%The projected groundwater pumping volumes for the <strong>San</strong> <strong>Dimas</strong> <strong>System</strong> through 2035 aresummarized in Table 4-5. If needed, the <strong>San</strong> <strong>Dimas</strong> <strong>System</strong>’s share of the OSY could beincreased through the purchase or lease of pumping rights from other producers in the Main<strong>San</strong> Gabriel Basin. The adjudication for the Main <strong>San</strong> Gabriel Basin also permits a producer topump more than its share of the OSY if replenishment water is available and if the producerpays a replenishment fee for all production in excess of the allocated rights.Final Report, <strong>2010</strong> Urban <strong>Water</strong> Management Plan – <strong>San</strong> <strong>Dimas</strong> Page 4-7<strong>Golden</strong> <strong>State</strong> <strong>Water</strong> <strong>Company</strong>g:\adminasst\jobs\<strong>2010</strong>\1070001.00_gswc-uwmp\09-reports\9.09-reports\2011-08\grp2b\gswc_sandimas_<strong>2010</strong>_uwmp-final.doc
Table 4-5:Projected Groundwater Pumping Amounts by <strong>San</strong> <strong>Dimas</strong> <strong>System</strong> to 2035 in ac/ftBasin Name <strong>2010</strong> 2015 2020 2025 2030 2035Main <strong>San</strong> Gabriel 3,730 3,306 3,306 3,306 3,306 3,306Percent of Total <strong>Water</strong> Supply 31% 22% 21% 20% 19% 18%Notes:1. Table format based on DWR Guidebook Table 19.2. Years are reported in calendar years (January 1 – December 31).4.4 Transfers and ExchangesGSWC has historically transferred groundwater rights for its holdings in the Main <strong>San</strong> GabrielBasin between the <strong>San</strong> <strong>Dimas</strong> District and the <strong>San</strong> Gabriel District. Additionally, if GSWC’sactual need for groundwater exceeds its share of the OSY, GSWC can lease availablegroundwater rights from other producers in the basin to increase their allowed pumping. GSWChas the ability to obtain leases for additional groundwater in the Main <strong>San</strong> Gabriel Basinannually, on an as-needed basis, following an evaluation of the economic benefits to their ratepayers.There are no specifically identified transfer and/or exchange opportunities in the <strong>San</strong> <strong>Dimas</strong><strong>System</strong> at this time; therefore, Table 4-6 has been left blank.Table 4-6:Transfer and Exchange OpportunitiesSource TransferAgencyTransfer orExchangeShort TermProposedQuantitiesLong-TermProposedQuantitiesGSWC N/A N/A N/A N/A N/ANote:Table format based on DWR Guidebook Table 20.4.5 Planned <strong>Water</strong> Supply Projects and ProgramsThere are no planned water supply projects and programs directly within the <strong>San</strong> <strong>Dimas</strong> <strong>System</strong>at this time; however, GSWC is exploring water supply opportunities in other areas that could beused to augment local and imported resource needs. GSWC, as a part of its normalmaintenance and operations, will construct new wells, pipelines, and treatment systems asneeded as a part of its ongoing Capital Investment Program to maintain its supply and meetdistribution system requirements.A potential long-term water supply transfer opportunity that GSWC is evaluating is the CadizValley <strong>Water</strong> Conservation, Recovery and Storage Project (Cadiz Project). The project isdesigned to capture and conserve thousands of acre-feet of native groundwater currently beinglost to evaporation through an aquifer system beneath Cadiz’s property in eastern <strong>San</strong>Bernardino County, California. By implementing established groundwater managementpractices, the project will create a new, sustainable annual water supply for project participants.In addition, the project offers storage capacity that can be used by participants to carry-over – or“bank” – annual supplies, without the high rates of evaporative loss suffered by local surfacereservoirs.Page 4-8Final Report, <strong>2010</strong> Urban <strong>Water</strong> Management Plan – <strong>San</strong> <strong>Dimas</strong><strong>Golden</strong> <strong>State</strong> <strong>Water</strong> <strong>Company</strong>g:\adminasst\jobs\<strong>2010</strong>\1070001.00_gswc-uwmp\09-reports\9.09-reports\2011-08\grp2b\gswc_sandimas_<strong>2010</strong>_uwmp-final.doc
The Cadiz Project will produce up to 50,000 ac-ft/yr for fifty years. GSWC is one of five entitiesthat have expressed an interest in receiving water from the project. In 2009, GSWC signed aletter of intent to purchase up to 5,000 ac-ft/yr and committed to paying a share of the cost ofthe project’s environmental evaluation. GSWC continues to evaluate the economics andtechnical feasibility of this project. Table 4-7 shows the potential water supply that could beprovided by the Cadiz Project.Table 4-7:Future <strong>Water</strong> Supply Projects in ac-ftMultiple-Dry YearsProject Name Normal Year Single-Dry Year Year 1 Year 2 Year 3Cadiz Project 5,000 5,000 5,000 5,000 5,000Note:This table is based on the DWR Guidebook Table 26.4.6 Wholesale Agency Supply DataTVMWD, in conjunction with GSWC and other TVMWD customers as well as with Metropolitan,has planned water supply projects to increase reliability within its service area. Details of theseplans can be found in TVMWD’s <strong>2010</strong> Urban <strong>Water</strong> Management Plan. In addition to theexisting imported water supplies received from Metropolitan, TVMWD plans to increase watersupplies through various plans including cyclic groundwater storage agreements andconjunctive use programs.The TVMWD’s <strong>2010</strong> <strong>UWMP</strong> finds that the region is continuing to improve its water reliability bydesigning programs to protect and ensure water quality, maximize local supplies (localgroundwater, surface water, and recycled water), promote conservation, increase storagecapacity, encourage recycled water use and meet its demands during shortages. TVMWD’s<strong>2010</strong> <strong>UWMP</strong> suggests that TVMWD has a water service plan that will provide 100 percentreliable service to its customers for the next 25 years.Table 4-8:Existing and Planned Wholesale Sources in ac-ft/yrWholesalerSourcesContractedVolume <strong>2010</strong> 2015 2020 2025 2030 2035TVMWD 7,967 10,963 11,943 12,782 13,585 14,241CIC 34 60 60 60 60 60Note:This table is based on DWR Guidebook Table 17.Table 4-9 demonstrates the reliability of wholesale water supply to meet annual water demandof the <strong>San</strong> <strong>Dimas</strong> <strong>System</strong>. The table includes a single-dry year and multiple-dry year suppliesfor 2035. As previously noted, the available supply from TVMWD is higher than the supplyneeded to meet demands during various hydrologic conditions. TVMWD is assured byMetropolitan of 100 percent reliability to meet the water demand through 2035.Final Report, <strong>2010</strong> Urban <strong>Water</strong> Management Plan – <strong>San</strong> <strong>Dimas</strong> Page 4-9<strong>Golden</strong> <strong>State</strong> <strong>Water</strong> <strong>Company</strong>g:\adminasst\jobs\<strong>2010</strong>\1070001.00_gswc-uwmp\09-reports\9.09-reports\2011-08\grp2b\gswc_sandimas_<strong>2010</strong>_uwmp-final.doc
Table 4-9:Reliability of Wholesale Supply for Year 2035 in ac-ft/yrWholesalerAverage /Multiple-Dry <strong>Water</strong> YearsNormal <strong>Water</strong>Year Supply Single-Dry Year 1 Year 2 Year 3TVMWD 14,589 14,589 14,589 14,589 14,589PercentNormalNote:Table format based on DWR Guidebook Table 31.100 100 100 100Table 4-10 lists factors affecting wholesale supply for the <strong>San</strong> <strong>Dimas</strong> <strong>System</strong>. Metropolitanplans on 100 percent supply reliability to TVMWD, which in turn provides 100 percent reliabilityof supply to the <strong>San</strong> <strong>Dimas</strong> <strong>System</strong>.Table 4-10:Factors Affecting Wholesale SupplyName of Supply Legal Environmental <strong>Water</strong> Quality ClimaticTVMWD N/A N/A N/A N/ANote:Table format based on DWR Guidebook Table 29.4.7 DesalinationThis section presents a discussion of opportunities to use desalinated water as a supplementalfuture water supply source for the <strong>San</strong> <strong>Dimas</strong> <strong>System</strong>. Section 10631(i) of the Act requires anevaluation of desalination opportunities within the <strong>San</strong> <strong>Dimas</strong> <strong>System</strong>. The Act states thefollowing:Section 10631(i) Describe the opportunities for development of desalinated water, including, but not limited to, oceanwater, brackish water, and groundwater, as a long-term supply.Wholesalers providing water to the <strong>San</strong> <strong>Dimas</strong> <strong>System</strong> are actively pursuing seawaterdesalination projects. <strong>Water</strong> produced by these desalination projects would increase the totalavailable water supply for the wholesalers and would, in-turn, improve the reliability of watersupply for the <strong>San</strong> <strong>Dimas</strong> <strong>System</strong>. However, it is not possible at this point to quantify the amountof desalinated water that will be available for the GSWC’s <strong>San</strong> <strong>Dimas</strong> <strong>System</strong>. The followingdiscussion summarizes the desalination plans of water wholesalers. Metropolitan and itsmember agencies, including the Three Valleys Municipal <strong>Water</strong> District (TVMWD) viewseawater desalination as a component of a diversified water supply portfolio. Recent andcontinuous breakthroughs in membrane technology have helped to reduce desalination costs,leading to the consideration of desalination among the alternative resource options outlined inMetropolitan’s <strong>2010</strong> Integrated Resources Plan (IRP) Update. This updated plan describes adiversified regional strategy to include recycled water, groundwater recharge, and seawaterdesalination in its portfolio of methods to ensure robust water supply reliability. In 2001,Metropolitan established the Seawater Desalination Program to encourage its member agenciesto develop desalination projects, and in the 2004 IRP Update established a target goal of up toPage 4-10Final Report, <strong>2010</strong> Urban <strong>Water</strong> Management Plan – <strong>San</strong> <strong>Dimas</strong><strong>Golden</strong> <strong>State</strong> <strong>Water</strong> <strong>Company</strong>g:\adminasst\jobs\<strong>2010</strong>\1070001.00_gswc-uwmp\09-reports\9.09-reports\2011-08\grp2b\gswc_sandimas_<strong>2010</strong>_uwmp-final.doc
150,000 ac-ft/yr of desalination capacity from its retailers by 2025. This is an importantcomponent of the total estimated water supply production for the region.Metropolitan is also involved in efforts to assess current desalination projects and to compareproject features and applicability to Southern California. Furthermore, Metropolitan, inassociation with member agencies, is involved in assessing established and emergingdesalination treatment technologies, pretreatment alternatives, and brine disposal issues, aswell as the permitting and regulatory approvals associated with the delivery of desalinatedseawater to regional and local distribution systems.TVMWD is land locked without direct access to the ocean and therefore does not viewdesalination as a practical nor economically feasible water supply option at this time.Additionally, seawater intrusion has not affected TVMWD’s groundwater basins, so recoveryand desalination of brackish groundwater is not a viable potential water resource. Althoughsome of TVMWD’s wells do have high levels of total dissolved solids (TDS), the expense andcomplexity of desalters has precluded their application for these wells.Table 4-11 provides a summary of opportunities for water desalination. As noted above, thefuture desalination projects of Metropolitan member agencies will collectively increase thereliability of water supply for the region. However, the exact quantity that will be available to theGSWC’s <strong>San</strong> <strong>Dimas</strong> <strong>System</strong> is not known at this time.Source of <strong>Water</strong>Table 4-11:Summary of Opportunities for <strong>Water</strong> DesalinationYield(ac-ft/yr) Start Date Type of Use OtherSeawater (Metropolitan) (1) 150,000 2025 Municipal N/ANote:1. Desalinated water available thru Metropolitan may benefit <strong>San</strong> <strong>Dimas</strong> indirectly through wholesaler TVMWD.4.8 Recycled <strong>Water</strong> PlanThis chapter covers Section 10633 which details the requirements of the Recycled <strong>Water</strong> Planthat are included in the Act. The Act states the following:Section 10633. The plan shall provide, to the extent available, information on recycled water and its potentialfor use as a water source in the service area of the urban water supplier. The preparation of the plan shall becoordinated with local water, wastewater, groundwater, and planning agencies that operate within thesupplier’s service area and shall include all of the following:(a) A description of the wastewater collection and treatment systems in the supplier’s service area, includinga quantification of the amount of wastewater collected and treated and the methods of wastewaterdisposal.(b) A description of the recycled water currently being used in the supplier’s service area, including, but notlimited to, the type, place, and quantity of use.(c) A description and quantification of the potential uses of recycled water, including, but not limited to,agricultural irrigation, landscape irrigation, wildlife habitat enhancement, wetlands, industrial reuse,groundwater recharge, and other appropriate uses, and a determination with regard to the technical andeconomic feasibility of serving those uses.(d) The projected use of recycled water within the supplier’s service area at the end of 5, 10, 15, and20 years, and a description of the actual use of recycled water in comparison to uses previously projectedpursuant to this subdivision.Final Report, <strong>2010</strong> Urban <strong>Water</strong> Management Plan – <strong>San</strong> <strong>Dimas</strong> Page 4-11<strong>Golden</strong> <strong>State</strong> <strong>Water</strong> <strong>Company</strong>g:\adminasst\jobs\<strong>2010</strong>\1070001.00_gswc-uwmp\09-reports\9.09-reports\2011-08\grp2b\gswc_sandimas_<strong>2010</strong>_uwmp-final.doc
(e)(f)A description of actions, including financial incentives, which may be taken to encourage the use ofrecycled water, and the projected results of these actions in terms of acre feet of, recycled water used peryear.A plan for optimizing the use of recycled water in the supplier’s service area, including actions to facilitatethe installation of dual distribution systems, to promote recirculating uses, to facilitate the increased useof treated wastewater that meets recycled water standards, and to overcome any obstacles to achievingthat increased use.4.8.1 CoordinationTable 4-12 summarizes the role of the agencies that participated in the development of recycledwater plans that affect the <strong>San</strong> <strong>Dimas</strong> <strong>System</strong> of the <strong>Golden</strong> <strong>State</strong> <strong>Water</strong> <strong>Company</strong> (GSWC).Table 4-12:Role of Participating Agencies in the Development of the Recycled <strong>Water</strong> PlanParticipating Agencies<strong>Water</strong> agenciesWastewater agenciesGroundwater agenciesPlanning agenciesRole in Plan DevelopmentGSWC works closely with the Los Angeles County <strong>San</strong>itationDistrict (LACSD) in planning a potential recycled waterdistribution system and identifying potential recycled watercustomers. The LACSD, acting as the recycled water wholesaler,would lead the way in implementing the recycled water plan anddistribution network.The LACSD provides a reliable supply of recycled water thatmeets California recycled water quality standards set forth in Title22 of the California Code of Regulations.Not applicable for this <strong>System</strong>.Los Angeles County <strong>San</strong>itation District plays a key role inconducting data and customer assessments, as well as analyzingcommunity and economic impacts.4.8.2 Wastewater Quantity, Quality, and Current UsesWastewater in the <strong>San</strong> <strong>Dimas</strong> area is collected by gravity sewers and lift stations owned by thecities of <strong>San</strong> <strong>Dimas</strong>, Covina, La Verne, and Walnut, as well as by the <strong>San</strong>itation Districts of LosAngeles County (LACSD). The wastewater is transported through trunk sewers to LACSD’s <strong>San</strong>Jose Creek and Whittier Narrows <strong>Water</strong> Reclamation Plants (WRP).The <strong>San</strong> Jose Creek WRP provides primary, secondary, and tertiary treatment for an averagedry weather flow (DWF) of 100 million gallons of wastewater per day (mgd). The plant serves alargely residential population of approximately one million people. About 35 mgd of treatedeffluent from <strong>San</strong> Jose Creek WRP is reused at 17 different sites. The recycled water isprimarily used for groundwater recharge, and agricultural and landscape irrigation. Theremaining effluent (65 mgd) is discharged into the <strong>San</strong> Gabriel River (LACSD, 2011).The Whittier Narrows WRP provides primary, secondary, and tertiary treatment for an averageDWF of 15 mgd. The plant serves a population of approximately 150,000 people. According tothe LACSD, nearly all of the treated effluent is reused as groundwater recharge into the RioHondo and <strong>San</strong> Gabriel Coastal Spreading Grounds or for irrigation at an adjacent nursery. Anyremaining effluent is discharged into the <strong>San</strong> Gabriel River (LACSD, 2011).Page 4-12Final Report, <strong>2010</strong> Urban <strong>Water</strong> Management Plan – <strong>San</strong> <strong>Dimas</strong><strong>Golden</strong> <strong>State</strong> <strong>Water</strong> <strong>Company</strong>g:\adminasst\jobs\<strong>2010</strong>\1070001.00_gswc-uwmp\09-reports\9.09-reports\2011-08\grp2b\gswc_sandimas_<strong>2010</strong>_uwmp-final.doc
Because the Whittier Narrows and <strong>San</strong> Jose Creek WRPs treat wastewater for a largerpopulation than exists in the <strong>San</strong> <strong>Dimas</strong> <strong>System</strong>, an estimated per capita wastewater generationfactor was used to calculate the volume of wastewater generated by GSWC’s customers in <strong>San</strong><strong>Dimas</strong>. Based on the populations served and the average wastewater treatment rates for the<strong>San</strong> Jose Creek and Whittier Narrows WRPs as detailed above, the average per capitawastewater generation factor for both of these WRPs is 100 gallons per person per day. Thisfactor was used to estimate existing and projected volumes of wastewater collected and treatedin the <strong>San</strong> <strong>Dimas</strong> <strong>System</strong> as summarized in Table 4-13.Because all of the effluent from Whittier Narrows and <strong>San</strong> Jose Creek WRPs is treated to meetTitle 22 recycled water standards, 100 percent of the treated effluent is included in Table 4-13as meeting such standards. However, out of the combined wastewater effluent (115 mgd) fromthese two treatment plants, 50 mgd (43 percent) of the treated water is actively reusedthroughout the region. Therefore, the assumption is that 43 percent of the treated wastewaterthat is collected in the <strong>San</strong> <strong>Dimas</strong> <strong>System</strong> is recycled while the remaining 57 percent isdischarged into the unlined portions of the <strong>San</strong> Gabriel River. Although the majority of the waterthat is discharged into the <strong>San</strong> Gabriel River will contribute to groundwater recharge through theriverbed, LACSD does not consider this an active recycled water use. Table 4-14 lists theestimates of existing and projected volumes of treated effluent collected from the <strong>San</strong> <strong>Dimas</strong><strong>System</strong> that will be discharged into the <strong>San</strong> Gabriel River.Although much of the wastewater generated in the <strong>San</strong> <strong>Dimas</strong> <strong>System</strong> is recycled, all of theexisting reuse sites are elsewhere in the LACSD system, and there are no existing uses ofrecycled water within the boundaries of the <strong>San</strong> <strong>Dimas</strong> service area. Therefore, Table 4-15 hasintentionally been left blank.Table 4-13:Estimates of Existing and Projected Wastewater Collection and Treatment in ac-ft/yr (mgd)for the <strong>San</strong> <strong>Dimas</strong> <strong>System</strong>2005 (3) <strong>2010</strong> (3) 2015 2020 2025 2030 2035Projectedpopulation in 56,374 56,416 59,017 63,473 68,131 72,557 76,769service area (2)Wastewatercollected and 6,315treated in (5.64 mgd)service area (4)6,319(5.64 mgd)6,611(5.90 mgd)7,110(6.35 mgd)7,632(6.81 mgd)8,127(7.26 mgd)8,599(7.68 mgd)Quantity thatmeets recycledwater standard6,315(5.64 mgd)6,319(5.64 mgd)6,611(5.90 mgd)7,110(6.35 mgd)7,632(6.81 mgd)8,127(7.26 mgd)Notes:1. This table is based on the DWR Guidebook Table 21.2. For population projections see Section 2.3.3. Based on actual year.4. Volumes of wastewater collected and treated are estimated based on the per capita generation factor. WW = population x100 gal/day.8,599(7.68 mgd)Final Report, <strong>2010</strong> Urban <strong>Water</strong> Management Plan – <strong>San</strong> <strong>Dimas</strong> Page 4-13<strong>Golden</strong> <strong>State</strong> <strong>Water</strong> <strong>Company</strong>g:\adminasst\jobs\<strong>2010</strong>\1070001.00_gswc-uwmp\09-reports\9.09-reports\2011-08\grp2b\gswc_sandimas_<strong>2010</strong>_uwmp-final.doc
Table 4-14:Estimates of Existing and Projected Disposal of Non-Recycled Wastewater in ac-ft/yr (mgd)for the <strong>San</strong> <strong>Dimas</strong> <strong>System</strong>Method ofDisposal Treatment Level 2005 (2) <strong>2010</strong> (2) 2015 2020 2025 2030 2035River DischargeTertiary3,569(3.19)3,572(3.19)3,737(3.34)4,019(3.59)4,314(3.85)4,594(4.10)4,860(4.34)Notes:1. This table is based on the DWR Guidebook Table 22.2. Based on actual year.3. Volumes of effluent discharged are estimated. For a description of the methodology, refer to the text.Type of UseTable 4-15:Existing Recycled <strong>Water</strong> Use in the <strong>San</strong> <strong>Dimas</strong> <strong>System</strong>Treatment Level<strong>2010</strong> Use(ac-ft/yr)N/A N/A N/A4.8.3 Potential and Projected UseThe <strong>San</strong> Jose Creek and Whittier Narrows WRPs are too far downstream to economicallyprovide reclaimed water to the <strong>San</strong> <strong>Dimas</strong> <strong>System</strong>. The Pomona WRP is closer to the <strong>San</strong><strong>Dimas</strong> <strong>System</strong>; however, most of the output from the Pomona WRP is currently used at otherexisting recycled water sites which are not part of the <strong>San</strong> <strong>Dimas</strong> <strong>System</strong>.However, LACSD has identified a potential to use water from the Pomona WRP to irrigate theForest Lawn Covina Hills Cemetery, which is within GSWC’s <strong>San</strong> <strong>Dimas</strong> <strong>System</strong>. Forest Lawnand LACSD are in the process of developing the infrastructure to extend recycled waterdistribution lines from the California <strong>State</strong> Polytechnic University campus. The project isexpected to be operational in 2012, with a projected usage rate starting at 340 ac-ft/yr. As thecemetery is gradually developed, recycled water use will also gradually increase to 880 acrefeetper year at final build-out, projected for 2160. This translates into an annual linear increasein recycled water use of 3.65 ac-ft/yr. Thus, the projected use for 2015 is equal to 340 + 3.65x3= 351 ac-ft/yr. Potential and projected recycled water use for the Forest Lawn Covina Hillscemetery are presented in Table 4-16 and Table 4-17, respectively. No other potential recycledwater users have been identified within the boundaries of the GSWC <strong>San</strong> <strong>Dimas</strong> <strong>System</strong>.However, if and when LACSD is able to implement any other recycled water project in the <strong>San</strong><strong>Dimas</strong> <strong>System</strong>, GSWC will support the project by encouraging recycled water use among itscustomers where feasible. In the 2005 <strong>UWMP</strong> for the <strong>San</strong> <strong>Dimas</strong> <strong>System</strong>, there were noprojections of recycled water for the year <strong>2010</strong>, so Table 4-18 has intentionally been left blank.Page 4-14Final Report, <strong>2010</strong> Urban <strong>Water</strong> Management Plan – <strong>San</strong> <strong>Dimas</strong><strong>Golden</strong> <strong>State</strong> <strong>Water</strong> <strong>Company</strong>g:\adminasst\jobs\<strong>2010</strong>\1070001.00_gswc-uwmp\09-reports\9.09-reports\2011-08\grp2b\gswc_sandimas_<strong>2010</strong>_uwmp-final.doc
Table 4-16:Potential Future Recycled <strong>Water</strong> Uses in ac-ft/yrType ofUse Treatment Level Description Feasibility 2015 2020 2025 2030 2035LandscapeIrrigationTertiaryForest LawnCemeteryNote:This table is based on the DWR Guidebook Table 23.High 351 369 387 406 424Table 4-17:Projected Future Recycled <strong>Water</strong> Use in Service Area in ac-ft/yrType of Use 2015 2020 2025 2030 2035Landscape Irrigation 351 369 387 406 424Table 4-18:Comparison of Recycled <strong>Water</strong> Uses—Year 2005 Projections versus <strong>2010</strong> ActualType of Use 2005 Projection for <strong>2010</strong> <strong>2010</strong> Actual UseN/A N/A N/ANote:This table is based on the DWR Guidebook Table 24.4.8.4 Optimization and Incentives for Recycled <strong>Water</strong> UseSince there is no existing use of recycled water and no plans in place to provide recycled waterwithin the <strong>San</strong> <strong>Dimas</strong> <strong>System</strong> beyond the project already in progress for Forest Lawn, there arecurrently no actions by which GSWC is encouraging the use of recycled water. Therefore, Table4-19 is not applicable for this system and has been intentionally left blank.As owner and operator of the <strong>San</strong> Jose Creek, Whittier Narrows, and Pomona WRPs, theLACSD is responsible for determining the technical and economic feasibility of supplyingrecycled water to the <strong>San</strong> <strong>Dimas</strong> <strong>System</strong>. Extension of the recycled water lines within the <strong>San</strong><strong>Dimas</strong> <strong>System</strong> would also be the responsibility of LACSD. If and when LACSD decides toimplement a recycled water project in the <strong>San</strong> <strong>Dimas</strong> area, GSWC will support the project byencouraging recycled water use among its customers where feasible.Table 4-19:Methods to Encourage Recycled <strong>Water</strong> Use and the Resulting Projected Use in ac-ft/yrActions <strong>2010</strong> 2015 2020 2025 2030N/A N/A N/A N/A N/A N/ANote:This table is based on the DWR Guidebook Table 25.Final Report, <strong>2010</strong> Urban <strong>Water</strong> Management Plan – <strong>San</strong> <strong>Dimas</strong> Page 4-15<strong>Golden</strong> <strong>State</strong> <strong>Water</strong> <strong>Company</strong>g:\adminasst\jobs\<strong>2010</strong>\1070001.00_gswc-uwmp\09-reports\9.09-reports\2011-08\grp2b\gswc_sandimas_<strong>2010</strong>_uwmp-final.doc
THIS PAGE INTENTIONALLY BLANKPage 4-16Final Report, <strong>2010</strong> Urban <strong>Water</strong> Management Plan – <strong>San</strong> <strong>Dimas</strong><strong>Golden</strong> <strong>State</strong> <strong>Water</strong> <strong>Company</strong>g:\adminasst\jobs\<strong>2010</strong>\1070001.00_gswc-uwmp\09-reports\9.09-reports\2011-08\grp2b\gswc_sandimas_<strong>2010</strong>_uwmp-final.doc
Chapter 5: <strong>Water</strong> QualitySection 10634 of the Act requires an analysis of water quality issues and their impact to supplyreliability. The Act states as follows:Section 10634. The plan shall include information, to the extent practicable, relating to the quality of existingsources of water available to the supplier over the same five-year increments as described in subdivision (a) ofSection 10631 and the manner in which water quality affects water management strategies and supplyreliability.5.1 GSWC Measures for <strong>Water</strong> Quality Regulation ComplianceTo facilitate full compliance with water quality laws and regulations, GSWC maintains anEnvironmental Quality Department that has independent lines of reporting authority within theorganization. The Environmental Quality Department is headed by a company officer specificallyassigned to oversee and manage the company’s environmental and water quality programs.The Vice President of Environmental Quality has a staff of three managers, including two <strong>Water</strong>Quality Managers. The <strong>Water</strong> Quality Managers, in turn, manage a staff of <strong>Water</strong> QualityEngineers and Technicians that are assigned to district offices. Each district office is assignedone <strong>Water</strong> Quality Engineer and at least one <strong>Water</strong> Quality Technician to provide direct supportto the local drinking water systems within the district.The District <strong>Water</strong> Quality Engineer is the main point of contact for the California Department ofPublic Health (CDPH) as well as other regulatory agencies. The <strong>Water</strong> Quality Engineer also isresponsible for coordinating compliance measures through scheduling required samplecollection, preparing water quality related plans, maintaining a water quality database, providingtraining to operations, maintaining a cross connection control program, and preparing andsubmitting monitoring reports, permit applications and other regulatory related correspondence.As a whole, the Environmental Quality Department monitors and participates in theimplementation of new water quality related laws and regulations. Through routine departmentmeetings and training, the District <strong>Water</strong> Quality Engineers are kept up to date with changingwater quality regulations and related technology. These efforts contribute towards maintaining apool of trained water quality professionals that can be utilized throughout the company. Thisprovides the company the ability to respond to a wide variety of water quality issues oremergencies.5.2 <strong>Water</strong> Quality IssuesThe drinking water quality of the <strong>San</strong> <strong>Dimas</strong> <strong>System</strong> must comply with the Safe Drinking <strong>Water</strong>Act (SDWA), which is composed of primary and secondary drinking water standards regulatedby the U.S. Environmental Protection Agency and CDPH. <strong>Water</strong> Quality sampling is performedat each well and within the distribution system to ensure compliance with the regulatorystandards.Final Report, <strong>2010</strong> Urban <strong>Water</strong> Management Plan – <strong>San</strong> <strong>Dimas</strong> Page 5-1<strong>Golden</strong> <strong>State</strong> <strong>Water</strong> <strong>Company</strong>g:\adminasst\jobs\<strong>2010</strong>\1070001.00_gswc-uwmp\09-reports\9.09-reports\2011-08\grp2b\gswc_sandimas_<strong>2010</strong>_uwmp-final.doc
5.2.1 Surface <strong>Water</strong> QualityTreated surface water purchased from Metropolitan <strong>Water</strong> District, Three Valleys Municipal<strong>Water</strong> District (TVMWD) and the Covina Irrigating <strong>Company</strong> (CIC) enters the <strong>San</strong> <strong>Dimas</strong><strong>System</strong> through inter-connections. Metropolitan, TVMWD, and CIC are responsible for meetingall drinking water standards as water leaves their surface water treatment plants, and at all interconnectionswith the <strong>San</strong> <strong>Dimas</strong> <strong>System</strong>.5.2.2 Groundwater Quality ManagementSignificant groundwater contamination in the Main <strong>San</strong> Gabriel Basin has resulted fromindustrial solvents known as volatile organic compounds (VOCs) and agricultural practiceswhich contribute nitrates to the groundwater. In an effort to create a coordinated response to thegroundwater contamination issue and to minimize impacts to groundwater supply, Main Basinwater agencies adopted a joint resolution in 1989. This resolution assigned the Main Basin<strong>Water</strong>master the responsibility of developing and maintaining a 5-Year <strong>Water</strong> Quality andSupply Plan, subject to review by the Los Angeles Regional <strong>Water</strong> Quality Control Board. Theobjective of the 5-Year Plan is to coordinate cleanup projects, and ensure that pumping doesnot lead to degradation of water quality in the Main Basin. The Upper <strong>San</strong> Gabriel ValleyMunicipal <strong>Water</strong> District (Upper District) also maintains a basin wide groundwater qualitymanagement and remediation plan (Upper District, <strong>2010</strong>). As a result of these coordinatedefforts by the Main Basin <strong>Water</strong>master and Upper District, groundwater quality is carefullymonitored and activities are regulated to ensure that the effect of contamination on watersuppliers, including GSWC, is minimized.5.2.3 Groundwater QualityTable 5-1 summarizes water quality issues and recommendations for wells within the <strong>San</strong><strong>Dimas</strong> <strong>System</strong>. The groundwater wells in the system meet all current California Title 22 drinkingwater standards before water is delivered to customers. The following discussion relates tocontaminants with MCLs that are either existing or have been proposed by the USEPA and/orCDPH.Drinking water regulations pertaining to emerging contaminants of concern, such as chromium(VI), nitrosamines, and VOCs, and potential revisions to existing regulations are closelymonitored by GSWC’s Environmental Quality Department. The appropriate sampling and actionwill be taken on any affected water supply sources as monitoring requirements, new or revisedMCLs are promulgated by the USEPA or CDPH. It is anticipated that it will take approximately 2to 5 years from official adoption of a new or revised MCL to implement wellhead treatment oralternative approach for a source, including all steps from procuring CPUC funding approval toplanning, permitting, design, and construction. There is typically adequate time allotted fromregulatory approval to promulgation of a new drinking water standard to address localizedtreatment requirements; therefore no direct impacts to water supply reliability from future waterquality regulations are anticipated at this time.Strategies for treating groundwater in the <strong>San</strong> <strong>Dimas</strong> <strong>System</strong> are designed to meet state andfederal regulations. All equipment is regularly maintained by GSWC personnel, and any failuresare immediately addressed, resulting in minimal disruption to water supply.Portions of the basin are impacted by contaminants from past agricultural practices, andimproper waste disposal. The contaminants consist primarily of nitrate and perchlorate. ThePage 5-2Final Report, <strong>2010</strong> Urban <strong>Water</strong> Management Plan – <strong>San</strong> <strong>Dimas</strong><strong>Golden</strong> <strong>State</strong> <strong>Water</strong> <strong>Company</strong>g:\adminasst\jobs\<strong>2010</strong>\1070001.00_gswc-uwmp\09-reports\9.09-reports\2011-08\grp2b\gswc_sandimas_<strong>2010</strong>_uwmp-final.doc
water system has been able to compensate for the loss of contaminated wells and maintain itsextractions from the basin by upgrading equipment at existing well sites, drilling a replacementwell, and making other system improvements.Nitrate. Five of the eight active wells have elevated nitrate concentrations for which blending orion exchange treatment is being implemented to lower concentrations to less than 80 percent ofthe MCL.Perchlorate. Perchlorate has impacted three wells for which ion exchange treatment is beingused.Radon. Radon has been detected in all of the wells in the system. Radon levels have beenreported in the range of 140 to 1,059 pCi/L. In 1999, the USEPA has proposed a radon MCL at300 pCi/L, with an alternative standard of 4,000 pCi/L if the state has an approved MultimediaMitigation program to reduce the indoor radon risk from soil and rocks underneath homes andbuildings. While the proposed radon rule has not proceeded to promulgation, the effect of theproposed radon MCL would be widespread in groundwater wells throughout California.Groundwater production from many wells in this system will be impacted if the radon MCL is setat 300 pCi/L. Best available technologies for radon removal include Packed Tower Aeration(PTA) and Granular Activated Carbon (GAC). Due to some critical operation concerns with theuse of GAC, PTA is the most common and effective method for radon removal. Installation oftreatment facilities at some of the well sites in this system may be problematic due to lack ofavailable space for treatment equipment. It is expected the state will develop an approvedMultimedia Mitigation program thus allow the alternative MCL standard. If an MCL ispromulgated, Multimedia mitigation would be recommended for these wells.Final Report, <strong>2010</strong> Urban <strong>Water</strong> Management Plan – <strong>San</strong> <strong>Dimas</strong> Page 5-3<strong>Golden</strong> <strong>State</strong> <strong>Water</strong> <strong>Company</strong>g:\adminasst\jobs\<strong>2010</strong>\1070001.00_gswc-uwmp\09-reports\9.09-reports\2011-08\grp2b\gswc_sandimas_<strong>2010</strong>_uwmp-final.doc
Table 5-1:Summary of AssessmentWellCurrentWellCapacity(gpm) (1) Status <strong>Water</strong> QualityIssue/ConcernExisting TreatmentRecommendationsArtesia No. 3 250 Active NitratePerchlorate;RadonBaseline No. 3 650 Active NitratePerchlorate;RadonBaseline No. 4 650 Active NitratePerchlorate;RadonColumbia No. 4 400 Active NitratePerchlorate;RadonColumbia No. 6 430 Active NitratePerchlorate;RadonHighway No. 1 650 Active NitratePerchlorate;RadonIon ExchangeIon ExchangeIon ExchangeIon ExchangeIon ExchangeIon ExchangeContinue Treatment;future multimediamitigation (radon)Continue Treatment;future multimediamitigation (radon)Continue Treatment;future multimediamitigation (radon)Continue Treatment;future multimediamitigation (radon)Continue Treatment;future multimediamitigation (radon)Continue Treatment;future multimediamitigation (radon)Highway No. 2 1,000 Active None NoneMalone 450 Active Nitrate (lessthan MCL);RadonBlendingFuture multimediamitigation (radon)Note:1. Estimated annual average current well production capacity is provided; actual and design instantaneous pumping capacity maybe greater for each well.5.2.4 Distribution <strong>System</strong> <strong>Water</strong> QualityDistribution system water quality monitoring is performed for several water quality parameters inthe <strong>San</strong> <strong>Dimas</strong> <strong>System</strong>, including general physical parameters, presence of coliform bacteria,disinfectant and disinfection by-product levels. Corrosivity of the water is monitored bymeasuring lead and copper levels at customer water taps. The <strong>San</strong> <strong>Dimas</strong> <strong>System</strong> utilizes anapproved Sample Siting Plan for the collection, recording, and reporting of all bacteriologicalanalyses. All monitoring parameters and levels currently meet drinking water standards. Theability to continue to meet these standards is not expected to change in the foreseeable future.The <strong>San</strong> <strong>Dimas</strong> <strong>System</strong> has also established an aggressive cross-connection control programto reduce the hazard associated with backflow and back-siphonage. These programs arerequired to comply with CDPH regulations on <strong>Water</strong>works Standards and Cross ConnectionControl.Page 5-4Final Report, <strong>2010</strong> Urban <strong>Water</strong> Management Plan – <strong>San</strong> <strong>Dimas</strong><strong>Golden</strong> <strong>State</strong> <strong>Water</strong> <strong>Company</strong>g:\adminasst\jobs\<strong>2010</strong>\1070001.00_gswc-uwmp\09-reports\9.09-reports\2011-08\grp2b\gswc_sandimas_<strong>2010</strong>_uwmp-final.doc
5.3 Projected <strong>Water</strong> Quality ImpactsIf the water system loses additional wells because of groundwater contamination (Table 5-2),evaluations will be made to determine the feasibility of treatment options and/or drilling newwells.Table 5-2:Summary of Projected <strong>Water</strong> Supply Changes Due to <strong>Water</strong> Quality Issues in ac-ft/yr<strong>Water</strong> Source <strong>2010</strong> 2015 2020 2025 2030 2035Artesia No. 2 (Destroyed) (723) 0 0 0 0 0Artesia No. 3 0 0 0 0 0 0Baseline No. 3 0 0 0 0 0 0Baseline No. 4 0 0 0 0 0 0City (removed from system) (361) 0 0 0 0 0Columbia No. 4 0 0 0 0 0 0Columbia No. 6 0 0 0 0 0 0Highway 0 0 0 0 0 0Highway No. 2 (new well) 0 1,613 0 0 0 0Malone 0 0 0 0 0 0Note:Table format based on DWR Guidebook Table 30.Final Report, <strong>2010</strong> Urban <strong>Water</strong> Management Plan – <strong>San</strong> <strong>Dimas</strong> Page 5-5<strong>Golden</strong> <strong>State</strong> <strong>Water</strong> <strong>Company</strong>g:\adminasst\jobs\<strong>2010</strong>\1070001.00_gswc-uwmp\09-reports\9.09-reports\2011-08\grp2b\gswc_sandimas_<strong>2010</strong>_uwmp-final.doc
THIS PAGE INTENTIONALLY BLANKPage 5-6Final Report, <strong>2010</strong> Urban <strong>Water</strong> Management Plan – <strong>San</strong> <strong>Dimas</strong><strong>Golden</strong> <strong>State</strong> <strong>Water</strong> <strong>Company</strong>g:\adminasst\jobs\<strong>2010</strong>\1070001.00_gswc-uwmp\09-reports\9.09-reports\2011-08\grp2b\gswc_sandimas_<strong>2010</strong>_uwmp-final.doc
Chapter 6: <strong>Water</strong> Supply ReliabilitySections 10631 and 10635 of the Act require that an assessment of water supply reliability forvarious climatic conditions be undertaken. The Act states:Section 10631.(c) (1) Describe the reliability of the water supply and vulnerability to seasonal or climatic shortage, to theextent practicable, and provide data for each of the following:(A) An average water year.(B) A single dry water year.(C) Multiple dry water years.(2) For any water source that may not be available at a consistent level of use, given specific legal,environmental, water quality, or climatic factors, describe plans to supplement or replace thatsource with alternative sources or water demand management measures, to the extent practicable.Section 10635.(a) Every urban water supplier shall include, as part of its urban water management plan, an assessment ofthe reliability of its water service to its customers during normal, dry, and multiple dry water years. Thiswater supply and demand assessment shall compare the total water supply sources available to thewater supplier with the total projected water use over the next 20 years, in five-year increments, for anormal water year, a single dry water year, and multiple dry water years. The water service reliabilityassessment shall be based upon the information compiled pursuant to Section 10631, including availabledata from state, regional, or local agency population projections within the service area of the urban watersupplier.6.1 Reliability of SupplyThe <strong>San</strong> <strong>Dimas</strong> <strong>System</strong> obtains its water supply from four sources, purchased water fromTVMWD and CIC, surface water diversions, and groundwater from the Main <strong>San</strong> GabrielGroundwater Basin. Therefore, conditions in local and distant areas can impact the reliability ofsupplies. The following discussion summarizes the reliability of GSWC’s water supply sources.In general, GSWC’s supply is expected to be 100 percent reliable through 2035. This reliabilityis a result of:• Projected reliability of TVMWD as a member of Metropolitan, which intends to provide100 percent reliability to member agencies such as TVMWD,• Reliable water supply from CIC,• Reliable water source from surface water diversion from <strong>San</strong> <strong>Dimas</strong> Canyon Creek, and• GSWC’s share of the OSY in the Main <strong>San</strong> Gabriel Groundwater Basin.6.1.1 Reliability of Purchased <strong>Water</strong> from TVMWDTVMWD, the local imported water wholesaler, is largely a pass-through entity which obtainsnearly all its imported water from Metropolitan, directly or indirectly. Metropolitan’s resourcemanagement plans are intended to optimize the use of its available resources during surplusesand shortages to minimize the probability of severe shortages and eliminate the possibility ofextreme shortages and shortage allocations.Final Report, <strong>2010</strong> Urban <strong>Water</strong> Management Plan – <strong>San</strong> <strong>Dimas</strong> Page 6-1<strong>Golden</strong> <strong>State</strong> <strong>Water</strong> <strong>Company</strong>g:\adminasst\jobs\<strong>2010</strong>\1070001.00_gswc-uwmp\09-reports\9.09-reports\2011-08\grp2b\gswc_sandimas_<strong>2010</strong>_uwmp-final.doc
6.1.1.1 Metropolitan Supply ReliabilityThis section presents a brief discussion of the source reliability of Metropolitan’s primary watersupply sources: imported water supply from the Colorado River and the <strong>State</strong> <strong>Water</strong> Project,and Metropolitan’s plans to ensure a reliable water supply into the future. Metropolitan maintainsa diverse portfolio of water sources including surface water supply, aquifer recharge andrecovery, desalination, and recycled water. The two primary components of Metropolitan’s watersupplies are also the most variable:• Colorado River Supply: Metropolitan owns and operates the Colorado River Aqueduct(CRA), which connects the Colorado River to the Metropolitan regional distribution system.The CRA has a capacity of 1.25 Million AFY (MAF) to transport Metropolitan’s currentcontracted entitlement of 550 Thousand AFY (TAF) of Colorado River water. Metropolitanalso holds a priority for an additional 662 TAF and 180 TAF when surplus flows areavailable.• <strong>State</strong> <strong>Water</strong> Project (SWP) Supply: The original <strong>State</strong> <strong>Water</strong> Project Contract called for anultimate delivery capacity of 4.2 MAF, with Metropolitan holding a contract for 1.9 MAF.Since that time there have been significant challenges to meeting those delivery goals.DWR released a <strong>Water</strong> Allocation Analysis in <strong>2010</strong> that has resulted in a Metropolitanestimated reduction in SWP supplies of 150 – 200 TAF for <strong>2010</strong> (Metropolitan DraftRegional <strong>UWMP</strong>, <strong>2010</strong>).As a result of the inherent uncertainty in Colorado River and SWP supplies given varioushydrologic, environmental, and legal considerations, Metropolitan has undertaken severalplanning initiatives, summarized below, to broaden its water resources reliability. Metropolitanhas documented that consistent with Section 4202 of its Administrative Code, the agency isprepared to provide its member agencies with adequate supplies of water to meet expandingand increasing needs in the years ahead. When additional water resources are required to meetincreasing needs, Metropolitan has stated that it will be prepared to deliver such supplies. In its<strong>2010</strong> Regional Urban <strong>Water</strong> Management Plan, Section II.4, Metropolitan also states that as aresult of investments made in supply and storage, it has identified a resource management planthat should result in 100 percent reliability for non-discounted non-interruptible demands through2035.• Integrated Resources Plan Updates (IRP): Metropolitan’s IRP updates completed in 1996,and updated in 2004 and <strong>2010</strong>, included assessments of potential future regional demandprojections based upon anticipated population and economic growth as well as conservationpotential. The IRP also includes regional supply strategies and implementation plans tobetter manage resources, meet anticipated demand, and ensure overall system reliability.Metropolitan intends to implement the <strong>2010</strong> IRP to further support member agency localresource development as well as to investigate generating its own local resources fordistribution to member agencies. The development of local resources, as well as thefurthering of existing conservation goals to meet the <strong>Water</strong> Conservation Act of 2009targets, is anticipated to provide a supply buffer for member agencies to rely upon in timesof drought and long-term climatic changes.• 1999 <strong>Water</strong> Surplus and Drought Management Plan (WSDM): The WSDM provides thepolicy guidance to manage the region’s water supplies to achieve the reliability goals of theIRP. This is achieved by integrating the operating activities of surplus and shortage suppliesthrough a series of stages and principles.Page 6-2Final Report, <strong>2010</strong> Urban <strong>Water</strong> Management Plan – <strong>San</strong> <strong>Dimas</strong><strong>Golden</strong> <strong>State</strong> <strong>Water</strong> <strong>Company</strong>g:\adminasst\jobs\<strong>2010</strong>\1070001.00_gswc-uwmp\09-reports\9.09-reports\2011-08\grp2b\gswc_sandimas_<strong>2010</strong>_uwmp-final.doc
• 2008 <strong>Water</strong> Supply Allocation Plan (WSAP): The WSAP includes the specific formula forcalculating member agency supply allocations and the key implementation elements neededfor administering the allocation. The need for the WSAP arose after the 2008 Bay-Deltabiological opinions and rulings that limited SWP supplies to its contractors includingMetropolitan. The WSAP formula seeks to balance the impacts of a shortage at the retaillevel while maintaining equity on the wholesale level for shortages of Metropolitan suppliesup to 50 percent.Since the 2008 Bay-Delta reductions, Metropolitan has been using the WSAP formulas tocontend with the reduction in available imported supplies implementing a Stage 2 (Regional10 percent reduction in supply allocation) of the WSAP from July 2009 to April 2011. Duringsuch allocations, Metropolitan institutes severe financial penalties should an entity requestsupply over their reduced allocation. This in effect, limits supply at the retail level. Although it isanticipated that the WSAP will continue to be in effect in the near–term, Metropolitan states inits <strong>2010</strong> Draft <strong>UWMP</strong> that there will be sufficient supply to meet member agency demands insingle and multiple-dry years from 2015 through 2035. However, this is assuming thatMetropolitan storage levels are at or above average levels prior to those cycles, and keyprograms come to fruition as assumed by Metropolitan in their projections. For example,Metropolitan assumes that a Delta conveyance solution will be in place by 2022. Also,Metropolitan has indicated that there is a 50 percent probability that storage levels will be lowerthan the assumption used. Based on the recent WSAP allocations and regulatory restrictions inthe Delta, GSWC’s conservative assumption is that Metropolitan’s projections in their <strong>2010</strong> Draft<strong>UWMP</strong> may not be 100 percent reliable in all cases.6.1.1.2 TVMWD’s <strong>Water</strong> Supply ReliabilityIn addition to Metropolitan’s reliability initiatives, TVMWD has taken important steps over thepast decade to reduce the vulnerability to extended drought or other potential threats. Use oflocal groundwater, regional surface water and local recycled water are the major sources ofTVMWD’s water supply in addition to imported water supplies from Metropolitan. Furthermore,TVMWD’s conjunctive use projects foster efficient use of imported water and optimize theinterdependence of groundwater storage and imported supplies. Conjunctive use assists withresource availability during times of drought. TVMWD is increasing reliability within its servicearea by maximizing existing water resources, diversifying the water resource mix over the next25 years. The potential additional sources available to the <strong>San</strong> <strong>Dimas</strong> <strong>System</strong> include:• Increased local conservation and water recycling,• Improvements in the reliability of imported supplies,• Increased regional surplus storage, and• Increased conjunctive-use groundwater programs.• TVMWD’s dependence on traditional sources of water (groundwater and imported) willcontinue to decrease with the expansion of these alternative resources (see TVMWD’s <strong>2010</strong><strong>UWMP</strong> for details).Final Report, <strong>2010</strong> Urban <strong>Water</strong> Management Plan – <strong>San</strong> <strong>Dimas</strong> Page 6-3<strong>Golden</strong> <strong>State</strong> <strong>Water</strong> <strong>Company</strong>g:\adminasst\jobs\<strong>2010</strong>\1070001.00_gswc-uwmp\09-reports\9.09-reports\2011-08\grp2b\gswc_sandimas_<strong>2010</strong>_uwmp-final.doc
6.1.2 CIC’s <strong>Water</strong> Supply ReliabilityAccording to the CIC’s <strong>2010</strong> <strong>UWMP</strong>, the reliability of CIC’s various sources (surface waterdiversion and groundwater) is primarily dependent upon the management of the Main Basin. IfCIC’s annual groundwater right in the Main Basin is exceeded, CIC relies on the availability ofsupplemental imported water used to replace the annual extraction in excess of the annual right.CIC states that in most instances, including during drought years, water stored in the <strong>San</strong>Gabriel Reservoir and Morris Reservoir is available for surface diversion (CIC, 2011). For thesereasons, it is assumed CIC’s relatively small water supply to GSWC is 100 percent reliable.6.1.3 Groundwater Supply ReliabilityGSWC’s <strong>San</strong> <strong>Dimas</strong> <strong>System</strong> has a total share of 1.73984 percent of the total annual OSY of theMain <strong>San</strong> Gabriel Basin. Under the Main <strong>San</strong> Gabriel Basin Judgment the <strong>Water</strong>master isresponsible for managing the groundwater levels at the Baldwin Park Key Well. The Judgmentstates that the <strong>Water</strong>master shall not spread replenishment water when the groundwater level atthe Key Well exceeds 250 feet msl. The Judgment also states that the <strong>Water</strong>master shallspread replacement water necessary to maintain the water level elevation above 200 feet msl.During the period of management under the Judgment, significant drought events haveoccurred from 1969 to 1977, 1983 to 1991, and 1998 to 2004. In each drought cycle the Main<strong>San</strong> Gabriel Basin was managed to maintain groundwater levels. Based on historicmanagement practices, all pumpers from the Main <strong>San</strong> Gabriel Basin are expected to haveadequate supply over the next 25 years under single year and multiple year drought periods(TVMWD, 2011). The TVMWD’s <strong>UWMP</strong> provides basin-wide details concerning the reliability ofthe Main <strong>San</strong> Gabriel Basin.GSWC and other water producers participate with the responsible agency, TVMWD, to ensurethat the OSY is available to the pumpers in the Main <strong>San</strong> Gabriel Basin. The TVMWD has acyclic storage agreement with Metropolitan and the Main Basin <strong>Water</strong>master. Cyclic storageaccounts have been used to increase storage in the basin since 1975. Metropolitan pre-deliversreplenishment water to the Basin and later sells the stored water to the water districts at areduced rate. Metropolitan can store up to 40,000 ac-ft of water for the TVMWD. Currently,Metropolitan has 11,200 ac-ft of water in storage for TVMWD (Main <strong>San</strong> Gabriel Basin<strong>Water</strong>master <strong>2010</strong>).The Main <strong>San</strong> Gabriel Groundwater Basin’s pumping and reliability is subject to the OSYestablished each fiscal year by the <strong>Water</strong>master and the availability of replenishment water.Long-term cyclic storage provides a mechanism that allows the responsible agency to establisha buffer during droughts and periods of reduced OSY by allowing for storage recharge watersduring times of available import supplies. Recharge in the basin occurs from percolation ofprecipitation, return flow of applied water, some septic system discharges, and stream flow.Recharge through streams and spreading basins is generated from runoff from surroundingmountains and imported water from the <strong>State</strong> <strong>Water</strong> Project and the Colorado River. TheTVMWD also continues to evaluate alternatives to augment Metropolitan’s imported supply,such as implementation of recycled water programs.There are pending amendments to the Judgment that would enhance groundwater reliability inthe basin. The <strong>Water</strong>master has determined that its 1973 Judgment may require changes toreflect the current conditions and allow the <strong>Water</strong>master more flexibility in securing necessarysupplemental supplies. The <strong>Water</strong>master expects proposed changes to be finalized andsubmitted to the Los Angeles Superior Court for approval after FY <strong>2010</strong>-11 (<strong>Water</strong>master <strong>2010</strong>).Page 6-4Final Report, <strong>2010</strong> Urban <strong>Water</strong> Management Plan – <strong>San</strong> <strong>Dimas</strong><strong>Golden</strong> <strong>State</strong> <strong>Water</strong> <strong>Company</strong>g:\adminasst\jobs\<strong>2010</strong>\1070001.00_gswc-uwmp\09-reports\9.09-reports\2011-08\grp2b\gswc_sandimas_<strong>2010</strong>_uwmp-final.doc
Some of the key proposed changes that would enhance basin groundwater reliability andreduce vulnerability to droughts and uncertain imported supplies include:• Storage and export – allow for outside water to be stored and exported by agreement with<strong>Water</strong>master;• Recycled water – remove the limit on recycled water that can be recharged in one year;• Key Well – eliminate the 250-foot upper limit at the Key Well for spreading imported water;• Assessments – provide a means for the <strong>Water</strong>master to levy assessments to supportendeavors such as pre-purchasing Replacement <strong>Water</strong>, development of new supplementalwater resources (such as the recycled water recharge project), and to buy supplementalwater that may become available unexpectedly or on short notice.6.1.4 <strong>San</strong> <strong>Dimas</strong> <strong>System</strong>’s <strong>Water</strong> Supply ReliabilitySupply reliability for the <strong>San</strong> <strong>Dimas</strong> <strong>System</strong> depends upon the reliability of purchased waterfrom TVMWD and CIC and local groundwater pumping from the Main <strong>San</strong> Gabriel GroundwaterBasin, as discussed above.Table 6-1 presents water supply projections for purchased and groundwater sources during anormal year, single-dry year, and multiple-dry years for the <strong>San</strong> <strong>Dimas</strong> <strong>System</strong>. The normalyearsupply represents the expected supply under average hydrologic conditions, the dry-yearsupply represents the expected supply under the single driest hydrologic year, and the multipledryyear supply represents the expected supply during a period of three consecutive dry years.The results, prepared by Metropolitan, show the region’s ability to respond in future years undera repeat of the 1990-1992 hydrology, that is, in the case of multiple-dry years. The results showthat the region can provide reliable water supplies under a series of multiple-dry years. A similaranalysis using the historic hydrology of 1977, the single driest hydrologic year to date, showsthat the region can provide reliable water supplies under a single-dry year.As described above, imported water supplies from TVMWD and CIC are expected to be100 percent reliable to meet demands. Therefore, the purchased water supply projections for anormal water year, single-dry year, and multiple-dry years are taken as the 2035 projection,which is equivalent to the imported water demand projected for 2035. It is assumed that thesingle-dry year and multiple-dry year supplies are the same as those for the normal yearsbecause TVMWD and CIC have stated that they will meet their retailer’s projected demandsunder all anticipated hydrologic conditions. Moreover, the single-dry year and multiple-dry yearavailable supplies are significantly higher than the projected supplies required to meet thedemands.Metropolitan and TVMWD have indicated their plans to continue to implement projects to ensurethe imported water demands can be met under normal, single-dry year, and multiple-dry years.As discussed above, Metropolitan intends to provide 100 percent supply reliability to TVMWD,which in turn will provide 100 percent reliability of imported water supply to the <strong>San</strong> <strong>Dimas</strong><strong>System</strong>.Under the Main <strong>San</strong> Gabriel Basin Judgment, the <strong>Water</strong>master adjusts the OSY annually toaccount for fluctuations in groundwater availability in the Basin. The objective is to ensure thatall pumpers, including GSWC, will have adequate supply to meet their demands during normalyear, single-dry year, and multiple-dry year periods. Replenishment water is used to replace theFinal Report, <strong>2010</strong> Urban <strong>Water</strong> Management Plan – <strong>San</strong> <strong>Dimas</strong> Page 6-5<strong>Golden</strong> <strong>State</strong> <strong>Water</strong> <strong>Company</strong>g:\adminasst\jobs\<strong>2010</strong>\1070001.00_gswc-uwmp\09-reports\9.09-reports\2011-08\grp2b\gswc_sandimas_<strong>2010</strong>_uwmp-final.doc
water pumped beyond a pumper’s share of the OSY and to maintain groundwater levels in theKey Well above 200 feet msl. The replenishment water for the Main <strong>San</strong> Gabriel Basin will beimported water from Metropolitan supplied by TVMWD. Metropolitan has provided its memberagencies with a reliability analysis for imported water supplies under all hydrologic conditions,which indicates Metropolitan’s plan to provide 100 percent reliability though 2035 (Metropolitan,<strong>2010</strong>).Table 6-1:Supply Reliability for the <strong>San</strong> <strong>Dimas</strong> <strong>System</strong> for Year 2035 in ac-ft/yrSourceNormal<strong>Water</strong> YearMultiple-Dry <strong>Water</strong> YearsSingle-Dry<strong>Water</strong> Year Year 1 Year 2 Year 3Purchased water, TVMWD 14,241 14,241 14,241 14,241 14,241Purchased water, CIC 60 60 60 60 60Groundwater, Main <strong>San</strong> GabrielBasin 3,306 3,306 3,306 3,306 3,306Surface Diversion 500 500 500 500 500Total 18,107 18,107 18,107 18,107 18,107Percent of Normal 100% 100% 100% 100%Note:Table format based on DWR Guidebook Table 28.Table 6-2 lists single-dry year and multiple-dry year periods for both groundwater andpurchased water supplies. The single-dry year and multiple-dry year periods are based onTVMWD’s (which are based on Metropolitan’s) analysis on the lowest average precipitation for asingle year and the lowest average precipitation for a consecutive multiple-year period,respectively. Utilizing the computer model that considers over 80 years of historical records foreach water source, Metropolitan has indicated that 1977 is the single-dry year and the years of1990, 1991 and 1992 are representative of the driest three consecutive years for Metropolitansupplies. TVMWD has determined that it can meet projected water demands for imported waterand groundwater for these years, so the supply is equal to the projected demands.The climatic vulnerability for the groundwater supply is only based on the change of the OSY ofthe Main <strong>San</strong> Gabriel Groundwater Basin. The <strong>San</strong> Gabriel Basin <strong>Water</strong>master adjusts the OSYannually to account for fluctuations in groundwater availability in the <strong>San</strong> Gabriel Basin. Annualreductions from 2005 to 2009 in the <strong>San</strong> Gabriel Basin OSY have placed the OSY at170,000 ac-ft/yr for the <strong>2010</strong>/2011 water year, however for the 2011/2012 water year the OSYwas increased to 210,000 ac-ft/yr. Groundwater level management in the Main <strong>San</strong> GabrielBasin by the <strong>Water</strong>master will help increase reliability of the groundwater supply. Estimates ofthe supply reliability for the <strong>San</strong> <strong>Dimas</strong> <strong>System</strong> also are derived from historical values (1999through <strong>2010</strong>) of the operating safe yield.The <strong>San</strong> <strong>Dimas</strong> <strong>System</strong> has pumped between 1,958 ac-ft/yr and 5,347 ac-ft/yr for the past5 years. It is projected the <strong>San</strong> <strong>Dimas</strong> <strong>System</strong> will pump annual amounts of approximately3,306 ac-ft/yr between <strong>2010</strong> and 2035.Page 6-6Final Report, <strong>2010</strong> Urban <strong>Water</strong> Management Plan – <strong>San</strong> <strong>Dimas</strong><strong>Golden</strong> <strong>State</strong> <strong>Water</strong> <strong>Company</strong>g:\adminasst\jobs\<strong>2010</strong>\1070001.00_gswc-uwmp\09-reports\9.09-reports\2011-08\grp2b\gswc_sandimas_<strong>2010</strong>_uwmp-final.doc
Table 6-2:Basis of <strong>Water</strong> Year Data<strong>Water</strong> Year Type Base Year(s) Historical SequenceNormal <strong>Water</strong> Year N/A (1)Single-Dry <strong>Water</strong> Year 1977Multiple-Dry <strong>Water</strong> Years 1990-1992Notes:1. Normal <strong>Water</strong> Year calculated from median precipitation from WY 1922 – WY 2004.2. Table format based on DWR Guidebook Table 27.1922-20046.1.5 Factors Resulting in Inconsistency of SupplyTable 6-3 presents factors that could potentially result in inconsistency of supply for the <strong>San</strong><strong>Dimas</strong> <strong>System</strong>. As described above, GSWC’s groundwater rights are adjudicated and its leaserights are contractual.Groundwater extractions in the <strong>San</strong> Gabriel Basin are regulated by the <strong>Water</strong>master. Annually,the <strong>Water</strong>master establishes basin-wide pumping limits based on local hydrologic conditionsand groundwater levels within the basins. The <strong>Water</strong>master may raise or lower pumping limitsannually in the <strong>San</strong> Gabriel Basin.Table 6-3:Factors Resulting in Inconsistency of SupplyName of Supply Legal Environmental <strong>Water</strong> Quality ClimaticTVMWD and CIC N/A N/A N/A N/AGroundwater, Main <strong>San</strong>Gabriel Groundwater BasinNotes:1. Table format based on DWR Guidebook Table 29.2. N/A – Not Applicable.N/A N/A N/A N/A6.2 Normal <strong>Water</strong> Year AnalysisTable 6-4 summarizes the service reliability assessment for a normal water year based on watersupply and water demand projections for the <strong>San</strong> <strong>Dimas</strong> <strong>System</strong>.Table 6-4:Comparison of Projected Normal Year Supply and Demand2015 2020 2025 2030 2035<strong>Water</strong> Supply Total (ac-ft/yr) 14,829 15,809 16,648 17,451 18,107<strong>Water</strong> Demand Total (ac-ft/yr) 14,829 15,809 16,648 17,451 18,107Difference (supply minus demand) 0 0 0 0 0Difference as Percent of Supply 0% 0% 0% 0% 0%Difference as Percent of Demand 0% 0% 0% 0% 0%Note:Table format based on DWR Guidebook Table 32.Final Report, <strong>2010</strong> Urban <strong>Water</strong> Management Plan – <strong>San</strong> <strong>Dimas</strong> Page 6-7<strong>Golden</strong> <strong>State</strong> <strong>Water</strong> <strong>Company</strong>g:\adminasst\jobs\<strong>2010</strong>\1070001.00_gswc-uwmp\09-reports\9.09-reports\2011-08\grp2b\gswc_sandimas_<strong>2010</strong>_uwmp-final.doc
6.3 Single-Dry-Year AnalysisTable 6-5 demonstrates the reliability of water supplies to meet projected annual waterdemands for the <strong>San</strong> <strong>Dimas</strong> <strong>System</strong> in a single-dry year.Table 6-5:Comparison of Projected Supply and Demand for Single-Dry Year2015 2020 2025 2030 2035Supply Total (ac-ft/yr) 14,829 15,809 16,648 17,451 18,107Demand Total (ac-ft/yr) 14,829 15,809 16,648 17,451 18,107Difference (supply minus demand) 0 0 0 0 0Difference as Percent of Supply 0% 0% 0% 0% 0%Difference as Percent of Demand 0% 0% 0% 0% 0%Note:Table format based on DWR Guidebook Table 33.6.4 Multiple-Dry-Year AnalysisTable 6-6 presents the projected multiple-dry year water supply and demand assessment for the<strong>San</strong> <strong>Dimas</strong> <strong>System</strong>. It is assumed that the multiple-dry year water supplies are the same asthose for the normal years because Metropolitan (through TVMWD) intends to meet projectedpurchased demands under all anticipated hydrologic conditions. The third year of the multipledryyear water supply projection represents the end of each 3-year multiple-dry year period asrequired for the multiple-dry year analysis. TVMWD and CIC have determined that they canmeet projected water demands for multiple-dry years, so the water supply is projected to equalthe demand.Table 6-6 demonstrates that the water supplies are sufficient to meet the projected waterdemand for each multiple-dry year period because:• TVMWD and CIC have determined that they can meet projected water demands for themultiple-dry year periods (see Chapter 3), and;• Groundwater from the Main <strong>San</strong> Gabriel Groundwater Basin is expected to be 100 percentreliable in multiple-dry years.It should be noted that the active connection capacity to deliver purchased water is significantlyhigher than the projected purchased water supply that is needed to meet these demands.Therefore, the purchased water supply is generally expected to be much greater than theexpected projected water demands during multiple-dry years.In summary, GSWC, Metropolitan, CIC and TVMWD have implemented and will continue toimplement projects to ensure the purchased water demands can be met under normal year,single-dry year, and multiple-dry years.Page 6-8Final Report, <strong>2010</strong> Urban <strong>Water</strong> Management Plan – <strong>San</strong> <strong>Dimas</strong><strong>Golden</strong> <strong>State</strong> <strong>Water</strong> <strong>Company</strong>g:\adminasst\jobs\<strong>2010</strong>\1070001.00_gswc-uwmp\09-reports\9.09-reports\2011-08\grp2b\gswc_sandimas_<strong>2010</strong>_uwmp-final.doc
Table 6-6:Projected Multiple-Dry Year <strong>Water</strong> Supply and Demand AssessmentYearSupply(ac-ft/yr)Demand(ac-ft/yr)DifferenceDifference asPercent ofSupplyDifference asPercent ofDemand201120122013 13,666 13,666 0 0% 0%2014 14,247 14,247 0 0% 0%2015 14,829 14,829 0 0% 0%201620172018 15,417 15,417 0 0% 0%2019 15,613 15,613 0 0% 0%2020 15,809 15,809 0 0% 0%202120222023 16,312 16,312 0 0% 0%2024 16,480 16,480 0 0% 0%2025 16,648 16,648 0 0% 0%202620272028 17,130 17,130 0 0% 0%2029 17,290 17,290 0 0% 0%2030 17,451 17,451 0 0% 0%203120322033 17,844 17,844 0 0% 0%2034 17,976 17,976 0 0% 0%2035 18,107 18,107 0 0% 0%Notes:1. This assessment is based on the 3-year multiple-dry year period ending in 2015, 2020, 2025, 2030, and 2035.2. Table format based on DWR Guidebook Table 34.Final Report, <strong>2010</strong> Urban <strong>Water</strong> Management Plan – <strong>San</strong> <strong>Dimas</strong> Page 6-9<strong>Golden</strong> <strong>State</strong> <strong>Water</strong> <strong>Company</strong>g:\adminasst\jobs\<strong>2010</strong>\1070001.00_gswc-uwmp\09-reports\9.09-reports\2011-08\grp2b\gswc_sandimas_<strong>2010</strong>_uwmp-final.doc
THIS PAGE INTENTIONALLY BLANKPage 6-10Final Report, <strong>2010</strong> Urban <strong>Water</strong> Management Plan – <strong>San</strong> <strong>Dimas</strong><strong>Golden</strong> <strong>State</strong> <strong>Water</strong> <strong>Company</strong>g:\adminasst\jobs\<strong>2010</strong>\1070001.00_gswc-uwmp\09-reports\9.09-reports\2011-08\grp2b\gswc_sandimas_<strong>2010</strong>_uwmp-final.doc
Chapter 7: Conservation Program and Demand ManagementMeasuresThis Chapter addresses the water conservation requirements of the Act for the <strong>San</strong> <strong>Dimas</strong><strong>System</strong> and includes a summary of current and planned Demand Management Measure (DMM)implementation and an overview of the proposed program for compliance with SBX7-7, whichrequires 20 percent statewide reduction in urban water use by 2020. The DMM portions of theAct state the following:Section 10631.(f) Provide a description of the supplier’s water demand management measures. This description shallinclude all of the following:(1) A description of each water demand management measure that is currently being implemented, orscheduled for implementation, including the steps necessary to implement any proposed measures,including, but not limited to, all of the following:(A) <strong>Water</strong> survey programs for single-family residential and multifamily residential customers.(B) Residential plumbing retrofit.(C) <strong>System</strong> water audits, leak detection, and repair.(D) Metering with commodity rates for all new connections and retrofit of existing connections.(E) Large landscape conservation programs and incentives.(F) High-efficiency washing machine rebate programs.(G) Public information programs.(H) School education programs.(I) Conservation programs for commercial, industrial, and institutional accounts.(J) Wholesale agency programs.(K) Conservation pricing.(L) <strong>Water</strong> conservation coordinator.(M) <strong>Water</strong> waste prohibition.(N) Residential ultra-low-flush (ULF) toilet replacement programs.(2) A schedule of implementation for all water demand management measures proposed or describedin the plan.(3) A description of the methods, if any, that the supplier will use to evaluate the effectiveness of waterdemand management measures implemented or described under the plan.(4) An estimate, if available, of existing conservation savings on water use within the supplier’s servicearea, and the effect of the savings on the supplier’s ability to further reduce demand.(g) An evaluation of each water demand management measure listed in paragraph (1) of subdivision (f) thatis not currently being implemented or scheduled for implementation. In the course of the evaluation, firstconsideration shall be given to water demand management measures, or combination of measures, thatoffer lower incremental costs than expanded or additional water supplies. This evaluation shall do all ofthe following:(1) Take into account economic and noneconomic factors, including environmental, social, health,customer impact, and technological factors.(2) Include a cost-benefit analysis, identifying total benefits and total costs.(3) Include a description of funding available to implement any planned water supply project that wouldprovide water at a higher unit cost.(4) Include a description of the water supplier’s legal authority to implement the measure and efforts towork with other relevant agencies to ensure the implementation of the measure and to share thecost of implementation.(j) For purposes of this part, urban water suppliers that are members of the California Urban <strong>Water</strong>Conservation Council shall be deemed in compliance with the requirements of subdivisions (f) and (g) byFinal Report, <strong>2010</strong> Urban <strong>Water</strong> Management Plan – <strong>San</strong> <strong>Dimas</strong> Page 7-1<strong>Golden</strong> <strong>State</strong> <strong>Water</strong> <strong>Company</strong>g:\adminasst\jobs\<strong>2010</strong>\1070001.00_gswc-uwmp\09-reports\9.09-reports\2011-08\grp2b\gswc_sandimas_<strong>2010</strong>_uwmp-final.doc
complying with all the provisions of the “Memorandum of Understanding Regarding Urban <strong>Water</strong>Conservation in California,” dated December 10, 2008, as it may be amended, and by submitting theannual reports required by Section 6.2 of that memorandum.7.1 Conservation Program BackgroundIn 1991, GSWC became a signatory to the MOU regarding water conservation in California anda member of the CUWCC, establishing a firm commitment to the implementation of the BestManagement Practices (BMPs) or DMMs. The CUWCC is a consensus-based partnership ofagencies and organizations concerned with water supply and conservation of natural resourcesin California. By becoming a signatory, GSWC committed to implement a specific set of locallycost-effective conservation practices in its service areas. In order to facilitate efficient BMPreporting for GSWC across service areas spread throughout California, several BMP “ReportingUnits” were established. The <strong>San</strong> <strong>Dimas</strong> BMP Reporting Unit is equivalent to the <strong>San</strong> <strong>Dimas</strong><strong>System</strong>.As an investor-owned utility, GSWC’s ability to obtain funding and implement conservationprograms is contingent on approval of the General Rate Case by the CPUC. GSWC is currentlyin the process of reviewing and revising its existing conservation program as follows:• In 2011, GSWC will be submitting a General Rate Case with the CPUC which will facilitatefurther development of cost-effective conservation programs, including compliance withSBX7-7.• Subject to funding approval for each rate making area, GSWC will conduct a baseline wateruse efficiency assessment of each of its districts to identify opportunities for cost-effectiveconservation. Results of the baseline assessment will be available by 2013 and will enableGSWC to define programs that target water savings in specific areas and meet DMMrequirements.• To the extent practicable, a companywide conservation program will then be implemented.Varying levels of program implementation will be scaled as appropriate for each districtdepending on funding availability, local wholesaler and regional participation levels, andSBX7-7 targets.The MOU and associated BMPs were revised by the CUWCC in 2008, which is equated to theDMMs per Section 10631(j) of the Act. The revised BMPs now contain a category of“Foundational BMPs” that signatories are, for the first time and with few exceptions, expected toimplement as a matter of their regular course of business. These include Utility Operations(metering, water loss control, pricing, conservation coordinator, wholesale agency assistanceprograms, and water waste ordinances) and Public Education (public outreach and schooleducation programs). The remaining BMPs are called Programmatic BMPs and are divided intoResidential, Large Landscape, and CII categories. These revisions are reflected in theCUWCC’s BMP reporting database starting with reporting year 2009. The revised BMPorganization is also reflected in the <strong>2010</strong> <strong>UWMP</strong>’s DMM compliance requirements. A summaryof the DMMs described in the Act and the current CUWCC BMP organization is presented inTable 7-1 for reference.Page 7-2Final Report, <strong>2010</strong> Urban <strong>Water</strong> Management Plan – <strong>San</strong> <strong>Dimas</strong><strong>Golden</strong> <strong>State</strong> <strong>Water</strong> <strong>Company</strong>g:\adminasst\jobs\<strong>2010</strong>\1070001.00_gswc-uwmp\09-reports\9.09-reports\2011-08\grp2b\gswc_sandimas_<strong>2010</strong>_uwmp-final.doc
Table 7-1:CUWCC BMP and <strong>UWMP</strong> DMMs Organization and NamesCUWCC BMP Organization and Names (2009 MOU)<strong>UWMP</strong> DMMsType Category BMP # BMP name DMM # DMM nameFoundationalProgrammaticOperationsPracticesEducationProgramsResidentialCommercial,Industrial, andInstitutional1.1.1 Conservation Coordinator L<strong>Water</strong> conservationcoordinator1.1.2 <strong>Water</strong> Waste Prevention M <strong>Water</strong> waste prohibition1.1.3Wholesale AgencyAssistance Programs1.2 <strong>Water</strong> Loss Control C1.31.42.12.2Metering with CommodityRates for All NewConnections and Retrofitof Existing ConnectionsRetail ConservationPricingPublic InformationProgramsSchool EducationPrograms3.1 Residential assistanceprogram3.2 Landscape water survey A3.33.44High-Efficiency ClothesWashing MachineFinancial IncentivePrograms<strong>Water</strong>SenseSpecification (WSS)toiletsCommercial, Industrial,and InstitutionalLandscape 5 Landscape EJDKGHABFNIWholesale agencyprograms<strong>System</strong> water audits, leakdetection, and repairMetering with commodityrates for all newconnections and retrofit ofexisting connectionsConservation pricingPublic informationprogramsSchool educationprograms<strong>Water</strong> survey programs forsingle-family residentialand multi-family residentialcustomers (1)Residential plumbingretrofit<strong>Water</strong> survey programs forsingle-family residentialand multi-family residentialcustomers (1)High-efficiency washingmachine rebate programsResidential ultra-low-flushtoilet replacementprogramsConservation programs forcommercial, industrial, andinstitutional accountsLarge landscapeconservation programsand incentivesNote:1. Components of DMM A (<strong>Water</strong> survey programs for single-family residential and multi-family residential customers) appliesto both BMP 3.1 (Residential assistance program) and BMP 3.2 (Landscape water survey).Final Report, <strong>2010</strong> Urban <strong>Water</strong> Management Plan – <strong>San</strong> <strong>Dimas</strong> Page 7-3<strong>Golden</strong> <strong>State</strong> <strong>Water</strong> <strong>Company</strong>g:\adminasst\jobs\<strong>2010</strong>\1070001.00_gswc-uwmp\09-reports\9.09-reports\2011-08\grp2b\gswc_sandimas_<strong>2010</strong>_uwmp-final.doc
7.2 Implementation of BMPs/DMMsThis section provides a description of the various programs and conservation activitiesimplemented in the <strong>San</strong> <strong>Dimas</strong> <strong>System</strong>. Signatories to the MOU are permitted by <strong>Water</strong> CodeSection 10631(j) to include their biennial CUWCC BMP reports in an <strong>UWMP</strong> to meet therequirements of the DMMs sections of the <strong>UWMP</strong> Act if the agency is meeting all provisions ofthe MOU. The <strong>San</strong> <strong>Dimas</strong> <strong>System</strong> CUWCC BMP coverage report for 2009 through <strong>2010</strong> isincluded as Appendix C and supplements the summary of BMP implementation activitiesprovided in this chapter.GSWC is progressing towards implementing all Foundational BMPs required in the revisedMOU and <strong>UWMP</strong> Act. The Programmatic BMPs are currently being implemented through thegpcd compliance option for the <strong>San</strong> <strong>Dimas</strong> Reporting Unit. The SBX7-7 conservation goals andproposed implementation plans are discussed further in Section 7.5.GSWC plans to continue to implement and track conservation programs for the <strong>San</strong> <strong>Dimas</strong>Reporting Unit. GSWC also partners on conservation activities with its wholesale watersuppliers, including Metropolitan, and TVMWD. GSWC’s customers are eligible for of a numberof conservation programs offered by Metropolitan, providing water savings to GSWC. Examplesof programs offered by wholesale suppliers that are available to customers include High-Efficiency Clothes Washers (HECW) rebates, CII programs and rebates, and High-EfficiencyToilets (HET) rebates.7.3 Foundational DMMs7.3.1 Utility Operations7.3.1.1 Conservation CoordinatorThis BMP is implemented. GSWC maintains a fully staffed Conservation Department with acompanywide <strong>Water</strong> Use Efficiency Manager, <strong>Water</strong> Conservation Analyst and one <strong>Water</strong>Conservation Coordinator for each of the three regions to administer conservation programsand support wholesaler programs which includes the <strong>San</strong> <strong>Dimas</strong> <strong>System</strong>. GSWC also employsa number of consultants to support program development and implementation.7.3.1.2 <strong>Water</strong> Waste PreventionAlthough GSWC does not have rule-making authority, it supports member agencies and localcities in efforts to adopt ordinances that will reduce water waste. This BMP is implementedthrough CPUC-approved rules provided in Appendix D, including: Rule No. 14.1, the <strong>Water</strong>Conservation and Rationing Plan, Rule 11, Discontinuance and Restoration of Service.CPUC’s methodology for water utilities to implement Rule 14.1 is documented in StandardPractice U-40-W, “Instructions for <strong>Water</strong> Conservation, Rationing, and Service ConnectionMoratoria.” Rule No. 14.1 sets forth water use violation fines, charges for removal of flowrestrictors, and the period during which mandatory conservation and rationing measures will bein effect. <strong>Water</strong> conservation restrictions include:• Use of potable water for more than minimal landscaping.• Use through a broken or defective water meter.Page 7-4Final Report, <strong>2010</strong> Urban <strong>Water</strong> Management Plan – <strong>San</strong> <strong>Dimas</strong><strong>Golden</strong> <strong>State</strong> <strong>Water</strong> <strong>Company</strong>g:\adminasst\jobs\<strong>2010</strong>\1070001.00_gswc-uwmp\09-reports\9.09-reports\2011-08\grp2b\gswc_sandimas_<strong>2010</strong>_uwmp-final.doc
• Use of potable water which results in flooding or runoff in gutters or streets.• Use of potable water for washing private cars or commercial aircrafts, cars, buses, boats, ortrailers, except at a fixed location where water is properly maintained to avoid wasteful use.• Use of potable water for washing buildings, structures, driveways, street cleaning or otherhard-surfaced areas.• Use of potable water to irrigate turf, lawns, gardens or ornamental landscaping.• Use of potable water for construction purposes.• Use of potable water for filling or refilling of swimming pools.Rule No. 20 (approved in 1978) discourages wasteful use of water and promotes use of watersaving devices. The stated purpose of the rule is to “ensure that water resources available tothe utility are put to a reasonable beneficial use and that the benefits of the utility's water supplyand service extend to the largest number of persons." Together, Rules 11, 14.1 and 20 prohibitnegligent or wasteful use of water, create a process for mandatory conservation and rationing,and promote the use of water saving devices.7.3.1.3 <strong>Water</strong> Loss ControlUnaccounted for water losses are monitored by the <strong>Water</strong> Loss Control Department (WLCD) byreviewing the <strong>Water</strong> Audit program’s survey results. If the amount of unaccounted for waterexceeds the established tolerance levels, a Leak Detection Audit is performed. This isconducted by the <strong>Water</strong> Loss Control Technician with the most current leak detectiontechnology, a Sonic Leak Detection Sound Amplification Instrument. To pinpoint leaks, thetechnician conducts a comprehensive survey of the system by making physical contact with allavailable main line valves, hydrant valves and all service connections.For calendar year 2009, GSWC implemented the American <strong>Water</strong> Works Association (AWWA)M36 Standard <strong>Water</strong> Audit methodology. The approach consists of a component analysis ofleaks for designation into “revenue” and “non-revenue” categories and an economic analysis ofrecoverable loss. Results of the analysis, which are included in Appendix E, show aninfrastructure leakage index (ILI) of 0.06.Before the AWWA Standard <strong>Water</strong> Audit M36 methodology was implemented, prescreening forwater losses was conducted by comparing the total volume of water sales and other verifiableuses against the total water supply into the system. A full audit was triggered if the total salesand verifiable uses was less than 90 percent of the total supply (i.e., unaccounted-for-waterexceeded 10 percent). Table 7-2 summarizes prescreening results.Final Report, <strong>2010</strong> Urban <strong>Water</strong> Management Plan – <strong>San</strong> <strong>Dimas</strong> Page 7-5<strong>Golden</strong> <strong>State</strong> <strong>Water</strong> <strong>Company</strong>g:\adminasst\jobs\<strong>2010</strong>\1070001.00_gswc-uwmp\09-reports\9.09-reports\2011-08\grp2b\gswc_sandimas_<strong>2010</strong>_uwmp-final.doc
Table 7-2:<strong>Water</strong> Loss Control Evaluation SummaryReport YearPrescreenCompletedPrescreenResult2006 No --2007 Yes 94.5%2008 Yes 99.5%2009 Yes 92.9%Note:<strong>2010</strong> Data Not applicable; M36 method implemented.Implementation Steps and ScheduleEffective <strong>2010</strong>, GSWC will continue to complete the Standard Audit and <strong>Water</strong> Balanceworksheets following the AWWA M36 protocol for the next 4 years, taking measurable steps toimprove data accuracy while cost-effectively reducing non-revenue water through repair of leaksand other measures. The water audit for calendar year <strong>2010</strong> will be completed by mid-2011.GSWC used version 3.0 of the AWWA <strong>Water</strong> Audit software for its initial evaluation, and will usethe current software for <strong>2010</strong> and all future evaluations. The current version includes metrics forevaluating the validity of the data. GSWC already has a work order system in place thatdocuments leak locations and repair history.7.3.1.4 Metering with Commodity Rates for All New Connections and Retrofit ofExisting ConnectionsAll customers of the <strong>San</strong> <strong>Dimas</strong> <strong>System</strong> are metered and billed by volume on a monthly basis. Ameter maintenance and repair plan has been submitted to the CUWCC. In addition, GSWCfollows the requirements of CPUC General Order 103-A which prescribes minimum watersystem design, operation and maintenance standards for water utilities includes requirementsfor calibrating, testing frequency, and replacing water meters.7.3.1.5 Retail Conservation PricingAll metered customers in the <strong>San</strong> <strong>Dimas</strong> <strong>System</strong> are charged volumetrically. In addition,effective December <strong>2010</strong>, GSWC has implemented a third tier of conservation pricing ratestructure for residential customers, as approved by the CPUC for Region III, including the <strong>San</strong><strong>Dimas</strong> <strong>System</strong> customers. The current rate structure for residential customers has a fixedcharge as well as volumetric escalating pricing tiers, depending on customer usage. Nonresidentialcustomers have a fixed charge and a fixed volumetric charge. Implementation of thisrevised pricing policy is the result of GSWC’s collaboration with CPUC to implementconservation tiered rates for residential customers of investor-owned utilities. Tiered rates areconsistent with the CPUC’s <strong>Water</strong> Action Plan.Implementation Steps and Schedule2009 and <strong>2010</strong> volumetric and fixed price revenue data for the <strong>San</strong> <strong>Dimas</strong> Reporting Unit aresummarized in the BMP Coverage Report located in Appendix C. Since <strong>2010</strong>, GSWC has beenadding third tier pricing structures and increasing volumetric charges. In <strong>2010</strong>, volumetricPage 7-6Final Report, <strong>2010</strong> Urban <strong>Water</strong> Management Plan – <strong>San</strong> <strong>Dimas</strong><strong>Golden</strong> <strong>State</strong> <strong>Water</strong> <strong>Company</strong>g:\adminasst\jobs\<strong>2010</strong>\1070001.00_gswc-uwmp\09-reports\9.09-reports\2011-08\grp2b\gswc_sandimas_<strong>2010</strong>_uwmp-final.doc
evenue consisted of 63.1% of <strong>San</strong> <strong>Dimas</strong> Reporting Unit’s total revenue which is on track tomeet the 2012 MOU goal of 70%.As previously discussed, GSWC will be submitting a General Rate Case filing to the CPUC in2011, which includes a proposed rate increase for volumetric charges for Region III customers.If approved, this rate increase will allow GSWC to increase volumetric revenues and progresstowards fulfilling the requirements of the Retail Conservation Pricing BMP by 2015.7.3.1.6 EducationPublic Information ProgramsPublic information programs for <strong>San</strong> <strong>Dimas</strong> <strong>System</strong> customers. For <strong>2010</strong>, GSWC had an annualbudget of $3,982 for public education and outreach. GSWC provides marketing and outreachmaterials to their customers by issuing press releases, publishing quarterly newsletters andusing door tags and bill inserts. Customers can learn about rebates and other conservationprograms on GSWC’s website, which provides links to Metropolitan’s website for detailedinformation. Outreach activities completed between 2006 and <strong>2010</strong> are summarized inTable 7-3.Table 7-3:Outreach ActivitiesItem 2006 2007 2008 2009 <strong>2010</strong>Contacts with the Media/PaidAdvertising3 5 3 4 4Bill Inserts / Newsletters / Brochures 2 3 2 4 4Bill showing water usage incomparison to previous year's usageYes Yes Yes Yes YesDemonstration Garden Tours 0 0 0 0 0Special Events, Media Events 5 3 1 0 0Speaker's Bureau 3 1 1 0 0Program to coordinate with othergovernment agencies, industry,public interest groups and mediaYes Yes Yes Yes YesSchool Education ProgramsGSWC sponsors a school education program in <strong>San</strong> <strong>Dimas</strong> <strong>System</strong> elementary schools asimplemented by The Discovery Science Center, with a <strong>2010</strong> annual budget of $19,000.Students learn about conservation practices and receive a free conservation kit that includes awater survey, 1.5-gpm low-flow shower head, 1.5-gpm kitchen sink aerator and 1.0-gpmbathroom aerators, leak detection dye tablets, a watering gauge, and step-by-step instructions.The students are given homework assignment to complete a water audit form and replaceinefficient showerheads and aerators with water-saving devices provided in the kit. The programhas been a very effective way for GSWC to reach a large number of customers and educatestudents, who in turn educate their parents about water efficiency practices and low-flowplumbing devices.Final Report, <strong>2010</strong> Urban <strong>Water</strong> Management Plan – <strong>San</strong> <strong>Dimas</strong> Page 7-7<strong>Golden</strong> <strong>State</strong> <strong>Water</strong> <strong>Company</strong>g:\adminasst\jobs\<strong>2010</strong>\1070001.00_gswc-uwmp\09-reports\9.09-reports\2011-08\grp2b\gswc_sandimas_<strong>2010</strong>_uwmp-final.doc
Results from the program are tracked, and a comprehensive Program Summary Report isgenerated at the end of each school year. This report documents the estimated reduction inwater usage that was achieved through the retrofits and provides data on the percentage ofstudents who participated in the program. Table 7-4 provides a summary of programparticipation results between 2006 and <strong>2010</strong>.Table 7-4:School Education Activities2006 2007 2008 2009 <strong>2010</strong>Presentations 13 4 2 - -Grade 4 th – 12 th 4 th – 6 th 4 th – 6 th - -Number of students 548 440 713 336 1227In addition to the DSC and partnering with wholesalers and other public agencies, GSWCimplements Resource Action Programs (RAP) and the Science Discover (SD) program. Duringthe 2009/<strong>2010</strong> school year, GSWC conducted school conservation education programs for anestimated 15,525 students companywide.7.3.1.7 Methods Used to Evaluate Effectiveness and <strong>Water</strong> Savings from FoundationalBMPsEffective implementation of the Foundational BMPs is critical to ensuring the long-term successof GSWC’s conservation efforts. GSWC will utilize quantitative methods to assess theeffectiveness of each BMP, to the extent practicable. The effectiveness of the <strong>Water</strong> WastePrevention and <strong>Water</strong> Loss Control BMPs can be measured, in part, by completing the annualM36 water loss audits and documenting the year-over-year change in unaccounted-for water aswell as the number of repair projects completed. GSWC will track the impact of newconservation pricing by using its upgraded billing system to carefully monitor consumption ofresidential customers.The effectiveness of implementing Public Education BMPs will be measured by tracking thenumber of public outreach events and education programs where customers receive informationon conservation. A successful public information program should encourage customers to takeadvantage of conservation incentives being offered by GSWC and Metropolitan asProgrammatic DMMs.There are no direct estimates of water savings applicable to the Foundational BMPs; however,these measures will continue to contribute to reducing the <strong>San</strong> <strong>Dimas</strong> <strong>System</strong>’s demand.7.4 Programmatic DMMsGSWC intends to continue to comply with the MOU using the gpcd compliance approach for the<strong>San</strong> <strong>Dimas</strong> <strong>System</strong>. The baseline gpcd is equal to the average annual potable water gpcd forthe years 1997 through 2006. This approach requires the purveyor to submit biennial gpcdtarget reports to the CUWCC. The biennial targets are computed by multiplying the agency’sbaseline gpcd by the applicable reduced target, as a percentage. The targets will graduallydecrease to 82 percent of the baseline in 2018. This approach allows the purveyor to choosewhich programs they would like to implement, as long as the combined water savingsattributable to these programs is sufficient to meet their biennial gpcd targets. The gpcdPage 7-8Final Report, <strong>2010</strong> Urban <strong>Water</strong> Management Plan – <strong>San</strong> <strong>Dimas</strong><strong>Golden</strong> <strong>State</strong> <strong>Water</strong> <strong>Company</strong>g:\adminasst\jobs\<strong>2010</strong>\1070001.00_gswc-uwmp\09-reports\9.09-reports\2011-08\grp2b\gswc_sandimas_<strong>2010</strong>_uwmp-final.doc
compliance option water savings targets are comparable to those required by SBX7-7, asdetailed in Section 7.5.Once the pending rate case is approved by the CPUC, GSWC will develop a prioritized wateruse efficiency program and implementation schedule for all customer service areas in thecompany, focusing on systems with the highest SBX7-7 water use reduction targets and thosewhere specific conservation activities can be implemented that are locally cost-effective.The gpcd compliance option does not require specific implementation plans for eachprogrammatic BMP, and the following descriptions of current program offerings are provided forinformation purposes only. <strong>Water</strong> savings estimates are also not available for each program, asimplementation levels have not been defined under the gpcd compliance option requirements.Most of the Programmatic DMMs described below for the <strong>San</strong> <strong>Dimas</strong> <strong>System</strong> are implementedby Metropolitan. Additional detailed description of Metropolitan’s programs can be found inMetropolitan’s <strong>2010</strong> <strong>UWMP</strong>.7.4.1 Residential DMMs7.4.1.1 Residential Assistance ProgramsGSWC has an audit program targeting high-use single-family (SF) and multi-family (MF)customers. GSWC identifies these customers based on billing data, and contacts them to offerfree audits. Audits are also offered to walk-in customers at the local customer service areaoffice. Additional home audits are conducted as part of the school education program(Section 7.3.1.6). Low-flow devices are available for free to customers at the GSWC office andare distributed to students as part of the free conservation kits they receive in the schooleducation program.7.4.1.2 Landscape <strong>Water</strong> SurveysGSWC identifies high-water use SF and MF customers throughout the company and contactsthem to offer free landscape water audits. To date, customers have not requested these audits.7.4.1.3 High-Efficiency Clothes WashersGSWC customers are eligible to participate in the HECW rebate program administered byMetropolitan, which has been available since 2003. Metropolitan has supplemented its HECWrebate using state or federal grants whenever possible. The water efficiency of clothes washersis represented by the “water factor,” which is a measure of the amount of water used to wash astandard load of laundry. Washers with a lower water factor save more water. Metropolitan hascontinued to transform the market by changing its program requirement to lower water factors.The program eligibility requirement is currently set at water factor 4.0, which saves over 10,000gallons per year per washer over a conventional top loading washer. GSWC does not contributefunds to the HECW rebate program. The GSWC webpage for <strong>San</strong> <strong>Dimas</strong> advertises the rebatesand provides a link to the Metropolitan website for full program details.7.4.1.4 <strong>Water</strong>Sense Specification (WSS) Toilets<strong>San</strong> <strong>Dimas</strong> <strong>System</strong> customers have been eligible to participate in the High Efficiency Toilet(HET) rebate program administered by Metropolitan since 1998, including ultra-low-flush toiletrebates. Currently, Metropolitan only provides funding for high-efficiency toilets (1.28 gallons perflush or less), which use 20 percent less than ultra-low-flush toilets (1.6 gallons per flush). Ultralow-flushtoilets are the current standard defined by the plumbing code. Metropolitan uses theFinal Report, <strong>2010</strong> Urban <strong>Water</strong> Management Plan – <strong>San</strong> <strong>Dimas</strong> Page 7-9<strong>Golden</strong> <strong>State</strong> <strong>Water</strong> <strong>Company</strong>g:\adminasst\jobs\<strong>2010</strong>\1070001.00_gswc-uwmp\09-reports\9.09-reports\2011-08\grp2b\gswc_sandimas_<strong>2010</strong>_uwmp-final.doc
EPA’s <strong>Water</strong>Sense list of tested toilets in its programs as qualifying models. The GSWCwebpage for <strong>San</strong> <strong>Dimas</strong> advertises the rebates and provides a link to the Metropolitan websitefor full details.7.4.1.5 <strong>Water</strong> Sense Specification for Residential DevelopmentIntegration of WSS fixtures for new development will be accelerated by the <strong>2010</strong> CaliforniaGreen Building Standards Code (CAL Green Code), which became effective in January 2011.The CAL Green Code sets mandatory green building measures, including a 20 percentreduction in indoor water use, as well as dedicated meter requirements and regulationsaddressing landscape irrigation and design. Local jurisdictions, at a minimum, must adopt themandatory measures; the CAL Green Code also identifies voluntary measures that set a higherstandard of efficiency for possible adoption.7.4.1.6 Commercial, Industrial, and Institutional DMMsThe Commercial, Industrial, and Institutional BMPs are implemented by Metropolitan on behalfof GSWC. <strong>San</strong> <strong>Dimas</strong> <strong>System</strong> customers are eligible to participate in Metropolitan’s CIIprogram, Save <strong>Water</strong>, Save-A-Buck Program for Southern California businesses. Those whoqualify are eligible for rebates to help encourage water efficiency and conservation. Devicesavailable for rebates include: high efficiency toilets, zero water and ultra-low water urinals,connectionless food steamers air-cooled ice machines (Tier III), cooling tower and pHconductivity controllers, water brooms, and dry vacuum pumps. Additionally, the Save-A-Buckprogram offers rebates for outdoor landscaping equipment such as: weather based irrigationcontrollers, central computer irrigation controllers, rotating spray nozzles retrofits, and highefficiency large rotary nozzle retrofits.7.4.1.7 Large LandscapeGSWC’s landscape program consists of identifying and contacting high-use customers,providing information and offering water use surveys, voluntary water use budgets, andlandscape training. While the program is available to all customers free of charge, none havechosen to participate. The introduction of tiered rates in late 2009 is expected to generateincreased participation as is the funding mechanism that will allow for increased resources forprogram marketing.7.5 SBX7-7 Compliance ApproachThe SBX7-7 water use baseline for the <strong>San</strong> <strong>Dimas</strong> system is 231 gpcd and the 2020compliance goal is 185 gpcd as documented in Chapter 3. The CUWCC gpcd complianceoption requires 18 percent water use reduction by 2018 (see Appendix C for detailedcalculations), which is consistent with the SBX7-7 20 percent water savings by 2020 target. Forthis reason, the same compliance strategy will be implemented to meet both SBX7-7 and theMOU targets.Several factors have contributed to a rapid reduction in gpcd over the past few years including:the economic recession, recent mild climate conditions, implementation of a residential tieredconservation pricing structure and other conservation measures. Overall, these factors havecontributed to a 12 percent decline in per capita water use over the past 3 years from 214 gpcdin 2008 to an estimated 189 gpcd in <strong>2010</strong>. The <strong>San</strong> <strong>Dimas</strong> <strong>System</strong> currently is on track tosatisfy its SBX7-7 and MOU goals and GSWC will focus on maintaining these savings over thenext 10 years.Page 7-10Final Report, <strong>2010</strong> Urban <strong>Water</strong> Management Plan – <strong>San</strong> <strong>Dimas</strong><strong>Golden</strong> <strong>State</strong> <strong>Water</strong> <strong>Company</strong>g:\adminasst\jobs\<strong>2010</strong>\1070001.00_gswc-uwmp\09-reports\9.09-reports\2011-08\grp2b\gswc_sandimas_<strong>2010</strong>_uwmp-final.doc
However, if the gpcd begins to increase to previous levels, GSWC’s ongoing commitment tocomplying with the Council MOU and implementation of all BMPs should provide sufficient watersavings to meet the 46 gpcd water savings required. GSWC will assess implementation of asuite of programs over the next 2 to 3 years to meet conservation targets companywide,potentially providing further reductions. Implementation levels and specific program offerings willvary by system depending on system goals, existing programs, demographics, and hydrologiccharacteristics.GSWC is developing a companywide approach that will include assessment of options such asaccelerating the current programs, and adding additional programmatic, regulatory andinformation-based activities to meet the requirements of SBX7-7. This systematic approach mayallow GSWC to do more with less, in essence, administering over all conservation programoperations from a centralized location while allowing local resources for direct implementation ofBMPs and other water savings practices. Funding for all conservation activities is subject toapproval by the CPUC before programs can be implemented. A number of the programs thatwill be considered by GSWC to meet SBX7-7 requirements combine financial incentives,regulations, and information elements that build on current activities. Specific programs thatmay be implemented by 2014 on a company-wide basis include:Conservation PricingGSWC is in the process of filing a General Rate Case application to increase volumetriccharges for residential and CII metered customers in its systems. If approved, increased tieredrates for residential and uniform rates for CII accounts are expected to significantly increasewater savings and participation in conservation incentive programs in many of GSWC’ssystems.Financial IncentivesOngoing and/or additional financial incentives may be offered directly to customers by GSWC orin partnership with other agencies:1. HECWs rebates: Clothes washer rebates are already being implemented by SMUD onbehalf of GSWC and will continue to provide measurable water savings.2. Zero and low-flow urinal rebates: Rebates would include CII fixtures such as zeroconsumption and ultra-low volume urinals as well as CII specific HETs.3. Expansion of fixture rebates to CII and MF customers in all systems: currently, the toiletrebate programs are only available to CII and MF customers in select systems. GSWC willevaluate expansion of the programs to all customers and there will be increased focus onmarketing to large Home Owner Association accounts.4. Larger variety of fixture rebates: this may include hot water distribution tanks, pressurizedwater brooms and high-pressure spray nozzles.5. Cash-for-grass rebates: Customers will be provided with an incentive of up to $0.5 persquare-foot of turf removed and replaced with landscape appropriate plants. The program isbeing considered for both residential and CII customers; it is currently being offered in selectGSWC systems.Final Report, <strong>2010</strong> Urban <strong>Water</strong> Management Plan – <strong>San</strong> <strong>Dimas</strong> Page 7-11<strong>Golden</strong> <strong>State</strong> <strong>Water</strong> <strong>Company</strong>g:\adminasst\jobs\<strong>2010</strong>\1070001.00_gswc-uwmp\09-reports\9.09-reports\2011-08\grp2b\gswc_sandimas_<strong>2010</strong>_uwmp-final.doc
6. Expansion of large landscape program: GSWC will evaluate the effectiveness of the currentlandscape program and making adjustments depending on the results. If the program isfound to be successful at meeting reduction targets, the program may be accelerated andmore devices will be offered, such as precision nozzles.Building Code/New StandardsAlthough it does not have regulatory authority, GSWC supports adoption of new buildingstandards, beyond those currently in code to enhance conservation. If all current code changesthat improve the efficiency of fixtures and design are implemented, it could account for up to60 percent of the expected reduction in demand. Some of the changes proposed will becaptured in the CAL Green Code, adopted January 2011 as well as SB407 (Plumbing Retrofiton Resale) and standard updates for toilets and washers that are being phased in.Information/TrackingInformation and tracking represents a new element to the existing programs focusing oncollecting and processing information and ensuring that the programs are on track to meet thegoals. These activities will also help in program design by providing more robust informationabout customers and their water use patterns. The immediate priorities include:1. Automatic Meter Reading (AMR): GSWC will continue to implement and utilize AMR in itssystems as a priority to obtain real time data for water usage and identify customer-sideleaks. This information can also help GSWC monitor the impacts of existing programs, makeadjustments where necessary and develop new programs.2. <strong>Water</strong> Use Tracking Tools: Another priority, GSWC will consider plans to design anddevelop database tracking tools for water savings associated with its conservation plans andincrease flexibility in adding or changing program elements.7.5.1 Consideration of Economic ImpactsSince funding for all conservation activities is subject to approval by the CPUC before programscan be implemented, the economic impacts of complying with SBX7-7 have not yet been fullydetermined. However, an economic analysis to help develop programs that avoid placingdisproportionate burdens on any single sector will be prepared during development of theSBX7-7 water use efficiency program. The annual costs associated with implementing alltraditional CUWCC programmatic BMPs cannot be determined because it represents thecombined efforts of TVMWD and GSWC, where funding levels, incentives and particularmeasures change from year to year. To continue benefiting customers, GSWC will takeadvantage of applicable partnership programs that will make conservation programs moreefficient and cost effective.Page 7-12Final Report, <strong>2010</strong> Urban <strong>Water</strong> Management Plan – <strong>San</strong> <strong>Dimas</strong><strong>Golden</strong> <strong>State</strong> <strong>Water</strong> <strong>Company</strong>g:\adminasst\jobs\<strong>2010</strong>\1070001.00_gswc-uwmp\09-reports\9.09-reports\2011-08\grp2b\gswc_sandimas_<strong>2010</strong>_uwmp-final.doc
Chapter 8: <strong>Water</strong> Shortage Contingency PlanSection 10632 of the Act details the requirements of the water-shortage contingency analysis.The Act states the following:Section 10632. The plan shall provide an urban water-shortage contingency analysis that includes each of thefollowing elements that are within the authority of the urban water supplier:(a) Stages of action to be undertaken by the urban water supplier in response to water supply shortages,including up to a 50 percent reduction in water supply, and an outline of specific water supply conditions,which are applicable to each stage.(b) An estimate of the minimum water supply available during each of the next three water years based onthe driest three-year historic sequence for the agency’s water supply.(c) Actions to be undertaken by the urban water supplier to prepare for, and implement during, a catastrophicinterruption of water supplies including, but not limited to, a regional power outage, an earthquake, orother disaster.(d) Additional, mandatory prohibitions against specific water-use practices during water shortages, including,but not limited to, prohibiting the use of potable water for street cleaning.(e) Consumption reduction methods in the most restrictive stages. Each urban water supplier may use anytype of consumption reduction methods in its water shortage contingency analysis that would reducewater use, are appropriate for its area, and have the ability to achieve a water-use reduction consistentwith up to a 50 percent reduction in water supply.(f) Penalties or charges for excessive use, where applicable.(g) An analysis of the impacts of each of the actions and conditions described in subdivisions (a) to (f),inclusive, on the revenues and expenditures of the urban water supplier, and proposed measures toovercome those impacts, such as the development of reserves and rate adjustments.(h) A draft water shortage contingency resolution or ordinance.(i) A mechanism for determining actual reductions in water use pursuant to the urban water shortagecontingency analysis.This chapter documents GSWC’s <strong>Water</strong> Shortage Contingency Plan for the <strong>San</strong> <strong>Dimas</strong> <strong>System</strong>per requirements of Section 10632 of the Act. The <strong>Water</strong> Shortage Contingency Plan is basedon Rule No. 14.1 Mandatory <strong>Water</strong> Conservation, Restrictions and Ratings Program adopted byGSWC and on file with CPUC. Appendix D contains the full text of the rule.The purpose of the <strong>Water</strong> Shortage Contingency Plan is to provide a plan of action to befollowed during the various stages of a water shortage. The plan includes the followingelements: action stages, estimate of minimum supply available, actions to be implementedduring a catastrophic interruption of water supplies, prohibitions, penalties and consumptionreduction methods, revenue impacts of reduced sales, and water use monitoring procedures.8.1 Action StagesThe Act requires documentation of actions to be undertaken during a water shortage. GSWChas developed actions to be undertaken in response to water supply shortages, including up toa 50 percent reduction in water supply. Implementation of the actions is dependent uponapproval of the CPUC, especially for implementing mandatory water use restriction. CPUC hasjurisdiction over GSWC because GSWC is an investor-owned water utility. Section 357 of theCalifornia <strong>Water</strong> Code requires that suppliers subject to regulation by the CPUC secure itsFinal Report, <strong>2010</strong> Urban <strong>Water</strong> Management Plan – <strong>San</strong> <strong>Dimas</strong> Page 8-1<strong>Golden</strong> <strong>State</strong> <strong>Water</strong> <strong>Company</strong>g:\adminasst\jobs\<strong>2010</strong>\1070001.00_gswc-uwmp\09-reports\9.09-reports\2011-08\grp2b\gswc_sandimas_<strong>2010</strong>_uwmp-final.doc
approval before imposing water consumption regulations and restrictions required by watersupply shortage emergencies.GSWC has grouped the actions to be taken during a water shortage into four stages, I throughIV, that are based on the water supply conditions. Table 8-1 describes the water supplyshortage stages and conditions. The stages will be implemented during water supply shortagesaccording to shortage level, ranging from 5 percent shortage in Stage I to 50 percent shortagein Stage IV. A water shortage declaration will be made by the American <strong>State</strong> <strong>Water</strong> <strong>Company</strong>Board. The water shortage stage determination during a water supply shortage will be made bythe Regional Vice President Customer Service.Table 8-1:<strong>Water</strong> Supply Shortage Stages and ConditionsStage No. <strong>Water</strong> Shortage Supply Conditions Shortage PercentI Minimum 5 - 10II Moderate 10 - 20III Severe 20 - 35IV Critical 35 - 50Note:This table is based on the DWR Guidebook Table 35.The actions to be undertaken during each stage include, but are not limited to, the following:Stage I (5 - 10 percent shortage) – <strong>Water</strong> alert conditions are declared and voluntaryconservation is encouraged. The drought situation is explained to the public and governmentalbodies. GSWC explains the possible subsequent water shortage stages in order to forecastpossible future actions for the customer base. The activities performed by GSWC during thisstage include, but are not limited to:• Public information campaign consisting of distribution of literature, speaking engagements,website updates, bill inserts, and conversation messages printed in local newspapers• Educational programs in area schools• Conservation Hotline, a toll-free number with trained Conservation Representatives toanswer customer questions about conservation and water use efficiencyStage II (10 - 20 percent shortage) – Stage II will include actions undertaken in Stage I. Inaddition, GSWC may propose voluntary conservation allotments and/or require mandatoryconservation rules. The severity of actions depends upon the percent shortage. The level ofvoluntary or mandatory water use reduction requested from the customers is also based on theseverity. It needs to be noted that prior to implementation of any mandatory reductions, GSWCmust obtain approval from CPUC. If necessary, GSWC may also support passage of droughtordinances by appropriate governmental agencies.Page 8-2Final Report, <strong>2010</strong> Urban <strong>Water</strong> Management Plan – <strong>San</strong> <strong>Dimas</strong><strong>Golden</strong> <strong>State</strong> <strong>Water</strong> <strong>Company</strong>g:\adminasst\jobs\<strong>2010</strong>\1070001.00_gswc-uwmp\09-reports\9.09-reports\2011-08\grp2b\gswc_sandimas_<strong>2010</strong>_uwmp-final.doc
Stage III (20 - 35 percent shortage) – Stage III is a severe shortage that entails or includesallotments and mandatory conservation rules. This phase becomes effective upon notificationby the GSWC that water usage is to be reduced by a mandatory percentage. GSWCimplements mandatory reductions after receiving approval from CPUC. Rate changes areimplemented to penalize excess usage. <strong>Water</strong> use restrictions are put into effect, i.e. prohibiteduses can include restrictions of daytime hours for watering, excessive watering resulting ingutter flooding, using a hose without a shutoff device, use of non-recycling fountains, washingdown sidewalks or patios, unrepaired leaks, etc. GSWC monitors production weekly forcompliance with necessary reductions. Use of flow restrictors is implemented if abusivepractices are documented.Stage IV (35 - 50 percent shortage) – This is a critical shortage that includes all steps taken inprior stages regarding allotments and mandatory conservation. All activities are intensified andproduction is monitored daily by GSWC for compliance with necessary reductions.8.2 Minimum SupplyThe Act requires an estimate of the minimum water supply available during each of the nextthree water years based on the driest three-year historic sequence for GSWC’s existing watersupply sources.Table 8-2 summarizes the minimum volume of water available from each existing source duringthe next three-years based on multiple-dry water years and normal water year. The driest threeyearhistoric sequence is provided in Chapter 6. The water supply quantities for 2011 to 2013are calculated by linearly interpolating between the projected water supplies of <strong>2010</strong> and 2015for normal years. The water supplies for <strong>2010</strong> and 2015 are presented in Chapter 4.It is assumed that the multiple-dry year supplies will be the same as those for the normal yearsbecause purchased water will meet that portion of projected water demands under allanticipated hydrologic conditions.GSWC’s supply is expected to be 100 percent reliable from 2011 to 2013. This reliability is aresult of:• The projected reliability of TVMWD as members of Metropolitan, which expects to be100 percent reliable,• a reliable water supply from CIC,• a reliable water source from surface water diversion from <strong>San</strong> <strong>Dimas</strong> Canyon Creek and,• GSWC’s share of the Operating Safe Yield (OSY) in the Main <strong>San</strong> Gabriel GroundwaterBasin (see Chapters 4 and 6 for details).The TVMWD’s potential resources that add the reliability for the <strong>San</strong> <strong>Dimas</strong> <strong>System</strong> include:• Increased local conservation and water recycling,• improvements in the reliability of imported supplies,• increased regional surplus storage capacity, and• increased conjunctive-use groundwater programs.Final Report, <strong>2010</strong> Urban <strong>Water</strong> Management Plan – <strong>San</strong> <strong>Dimas</strong> Page 8-3<strong>Golden</strong> <strong>State</strong> <strong>Water</strong> <strong>Company</strong>g:\adminasst\jobs\<strong>2010</strong>\1070001.00_gswc-uwmp\09-reports\9.09-reports\2011-08\grp2b\gswc_sandimas_<strong>2010</strong>_uwmp-final.doc
Table 8-2:Three-Year Estimated Minimum <strong>Water</strong> Supply in ac-ft/yrSource 2011 2012 2013<strong>2010</strong>Average YearPurchased water from TVMWD/ CIC8,697 9,278 9,860 8,002Groundwater 3,806 3,806 3,806 3,920Recycled water - - - 0Total 12,503 13,084 13,666 11,922Note:This table is based on the DWR Guidebook Table 31.8.3 Catastrophic Supply Interruption PlanThe Act requires documentation of actions to be undertaken by the water supplier to preparefor, and implement during, a catastrophic interruption of water supplies. A catastrophicinterruption constitutes a proclamation of a water shortage and could result from any event(either natural or man-made) that causes a water shortage severe enough to classify as either aStage III or Stage IV water supply shortage condition.In order to prepare for catastrophic events, GSWC has prepared an Emergency Response Plan(ERP) in accordance with other state and federal regulations. The purpose of this plan is todesign actions necessary to minimize the impacts of supply interruptions due to catastrophicevents.The ERP coordinates overall company response to a disaster in any and all of its districts. Inaddition, the ERP requires each district to have a local disaster plan that coordinatesemergency responses with other agencies in the area. The ERP also provides details on actionsto be undertaken during specific catastrophic events. Table 8-3 provides a summary of actionscross-referenced against specific catastrophes for three of the most common possiblecatastrophic events: regional power outage, earthquake, and malevolent acts.In addition to specific actions to be undertaken during a catastrophic event, GSWC performsmaintenance activities, such as annual inspections for earthquake safety, and budgets for spareitems, such as auxiliary generators, to prepare for potential events.Page 8-4Final Report, <strong>2010</strong> Urban <strong>Water</strong> Management Plan – <strong>San</strong> <strong>Dimas</strong><strong>Golden</strong> <strong>State</strong> <strong>Water</strong> <strong>Company</strong>g:\adminasst\jobs\<strong>2010</strong>\1070001.00_gswc-uwmp\09-reports\9.09-reports\2011-08\grp2b\gswc_sandimas_<strong>2010</strong>_uwmp-final.doc
Possible CatastropheTable 8-3:Summary of Actions for Catastrophic EventsSummary of ActionsRegional power outage • Isolate areas that will take the longest to repair and/or present a publichealth threat. Arrange to provide emergency water.• Establish water distribution points and ration water if necessary.• If water service is restricted, attempt to provide potable water tankersor bottled water to the area.• Make arrangements to conduct bacteriological tests, in order todetermine possible contamination.• Utilize backup power supply to operate pumps in conjunction withelevated storage.Earthquake • Assess the condition of the water supply system.• Complete the damage assessment checklist for reservoirs, watertreatment plants, wells and boosters, system transmission anddistribution.• Coordinate with Cal EMA utilities group or fire district to identifyimmediate fire fighting needs.• Isolate areas that will take the longest to repair and/or present a publichealth threat. Arrange to provide emergency water.• Prepare report of findings, report assessed damages, advise as tomaterials of immediate need and identify priorities including hospitals,schools and other emergency operation centers.• Take actions to preserve storage.• Determine any health hazard of the water supply and issue any “Boil<strong>Water</strong> Order” or “Unsafe <strong>Water</strong> Alert” notification to the customers, ifnecessary.• Cancel the order or alert information after completing comprehensivewater quality testing.• Make arrangements to conduct bacteriological tests, in order todetermine possible contamination.Malevolent acts • Assess threat or actual intentional contamination of the water system.• Notify local law enforcement to investigate the validity of the threat.• Get notification from public health officials if potential watercontamination• Determine any health hazard of the water supply and issue any “Boil<strong>Water</strong> Order” or “Unsafe <strong>Water</strong> Alert” notification to the customers, ifnecessary.• Assess any structural damage from an intentional act.• Isolate areas that will take the longest to repair and or present a publichealth threat. Arrange to provide emergency water.Final Report, <strong>2010</strong> Urban <strong>Water</strong> Management Plan – <strong>San</strong> <strong>Dimas</strong> Page 8-5<strong>Golden</strong> <strong>State</strong> <strong>Water</strong> <strong>Company</strong>g:\adminasst\jobs\<strong>2010</strong>\1070001.00_gswc-uwmp\09-reports\9.09-reports\2011-08\grp2b\gswc_sandimas_<strong>2010</strong>_uwmp-final.doc
8.4 Prohibitions, Penalties, and Consumption ReductionMethodsThe Act requires an analysis of mandatory prohibitions, penalties, and consumption reductionmethods against specific water use practices which may be considered excessive during watershortages. Given that GSWC is an investor-owned entity, it does not have the authority to passany ordinance enacting specific prohibitions or penalties. In order to enact or rescind anyprohibitions or penalties, GSWC would seek approval from CPUC to enact or rescind RuleNo. 14.1, Mandatory Conservation and Rationing, which is included in Appendix D. When RuleNo. 14.1 has expired or is not in effect, mandatory conservation and rationing measures will notbe in force.Rule No. 14.1 details the various prohibitions and sets forth water use violation fines, chargesfor removal of flow restrictors, as well as establishes the period during which mandatoryconservation and rationing measures will be in effect. The prohibitions on various wasteful wateruses, include, but are not limited to, the hose washing of sidewalks and driveways using potablewater, and cleaning for filling decorative fountains. Table 8-4 summarizes the variousprohibitions and the stages during which the prohibition becomes mandatory.Table 8-4:Summary of Mandatory ProhibitionsUncorrected plumbing leaksExamples of Prohibitions<strong>Water</strong>ing which results in flooding or run-off in gutters,waterways, patios, driveway, or streetsWashing aircraft, cars, buses, boats, trailers, or other vehicleswithout a positive shut-off nozzle on the outlet end of the hoseWashing buildings, structures, sidewalks, walkways, driveways,patios, parking lots, tennis courts, or other hard-surfaced areas ina manner which results in excessive run-offIrrigation of non-permanent agricultureUse of water for street watering with trucks or for constructionpurposes unless no other source of water or other method canbe usedUse of water for decorative fountains or the filling or topping offof decorative lakes or pondsFilling or refilling of swimming poolsNote:This table is based on the DWR Guidebook Table 36.Stage When ProhibitionBecomes MandatoryII, III, IVII, III, IVII, III, IVII, III, IVII, III, IVII, III, IVII, III, IVII, III, IVIn addition to prohibitions during water supply shortage events requiring a voluntary ormandatory program, GSWC will make available to its customers water conservation kits asrequired by GSWC’s Rule No. 20. GSWC will notify all customers of the availability ofconservation kits.Page 8-6Final Report, <strong>2010</strong> Urban <strong>Water</strong> Management Plan – <strong>San</strong> <strong>Dimas</strong><strong>Golden</strong> <strong>State</strong> <strong>Water</strong> <strong>Company</strong>g:\adminasst\jobs\<strong>2010</strong>\1070001.00_gswc-uwmp\09-reports\9.09-reports\2011-08\grp2b\gswc_sandimas_<strong>2010</strong>_uwmp-final.doc
In addition to prohibitions, Rule No. 14.1 provides penalties and charges for excessive wateruse. The enactment of these penalties and charges is contingent on approval of Rule 14.1implementation by the CPUC. When the rule is in effect, violators receive one verbal and onewritten warning after which a flow-restricting device may be installed in the violator’s service fora reduction of up to 50 percent of normal flow or 6 ccf per month, whichever is greater.Table 8-5 summarizes the penalties and charges and the stage during which they take effect.Table 8-5:Penalties or ChargesSummary of Penalties and Charges for Excessive UseStage When PenaltyTakes EffectPenalties for not reducing consumptionCharges for excess useFlat fine; Charge per unit over allotmentFlow restrictionTermination of serviceNote:This table is based on the DWR Guidebook Table 38.III, IVIII, IVIII, IVIII, IVIII, IVIn addition to prohibitions and penalties, GSWC can use other consumption reduction methodsto reduce water use up to 50 percent. Based on the requirements of the Act, Table 8-6summarizes the methods that can be used by GSWC in order to enforce a reduction inconsumption, where necessary.Final Report, <strong>2010</strong> Urban <strong>Water</strong> Management Plan – <strong>San</strong> <strong>Dimas</strong> Page 8-7<strong>Golden</strong> <strong>State</strong> <strong>Water</strong> <strong>Company</strong>g:\adminasst\jobs\<strong>2010</strong>\1070001.00_gswc-uwmp\09-reports\9.09-reports\2011-08\grp2b\gswc_sandimas_<strong>2010</strong>_uwmp-final.doc
Table 8-6:Summary of Consumption Reduction MethodsConsumption ReductionMethodStage When MethodTakes EffectProjected ReductionPercentageDemand reduction program All Stages N/AReduce pressure in water lines;Flow restrictionRestrict building permits; Restrictfor only priority usesIII, IVII, III, IVN/AN/AUse prohibitions II, III, IV N/A<strong>Water</strong> shortage pricing; Per capitaallotment by customer typeII, IVN/APlumbing fixture replacement All Stages N/AVoluntary rationing II N/AMandatory rationing III, IV N/AIncentives to reduce waterconsumption; Excess use penaltyIII, IVN/A<strong>Water</strong> conservation kits All Stages N/AEducation programs All Stages N/APercentage reduction by customertypeNote:This table is based on the DWR Guidebook Table 37.III, IVN/A8.5 Revenue Impacts of Reduced SalesSection 10632(g) of the Act requires an analysis of the impacts of each of the actions taken forconservation and water restriction on the revenues and expenditures of the water supplier.Because GSWC is an investor-owned water utility and, as such, is regulated by the CPUC, theCPUC authorizes it to establish memorandum accounts to track expenses and revenueshortfalls caused by both mandatory rationing and voluntary conservation efforts. Utilities withCPUC-approved water management plans are authorized to implement a surcharge to recoverrevenue shortfalls recorded in their drought memorandum accounts. Table 8-7 provides asummary of actions with associated revenue reductions; while Table 8-8 provides a summary ofactions and conditions that impact expenditures. Table 8-9 summarizes the proposed measuresto overcome revenue impacts. Table 8-10 provides a summary of the proposed measures toovercome expenditure impacts.Page 8-8Final Report, <strong>2010</strong> Urban <strong>Water</strong> Management Plan – <strong>San</strong> <strong>Dimas</strong><strong>Golden</strong> <strong>State</strong> <strong>Water</strong> <strong>Company</strong>g:\adminasst\jobs\<strong>2010</strong>\1070001.00_gswc-uwmp\09-reports\9.09-reports\2011-08\grp2b\gswc_sandimas_<strong>2010</strong>_uwmp-final.doc
Table 8-7:TypeSummary of Actions and Conditions that Impact RevenueAnticipated Revenue ReductionReduced salesRecovery of revenues with CPUC-approvedsurchargeReduction in revenue will be based on the decline inwater sales and the corresponding quantity tariff rateHigher rates may result in further decline in waterusage and further reduction in revenueTable 8-8:CategoryIncreased staff costIncreased O&M costSummary of Actions and Conditions that Impact ExpendituresAnticipated CostSalaries and benefits for new hires required toadminister and implement water shortage programOperating and maintenance costs associated withalternative sources of water supplyIncreased cost of supply and treatmentPurchase and treatment costs of new water supplyTable 8-9:Names of MeasuresObtain CPUC-approved surchargePenalties for excessive water useProposed Measures to Overcome Revenue ImpactsSummary of EffectsAllows for recovery of revenue shortfalls brought on by watershortage programObtain CPUC approval to use penalties to offset portion ofrevenue shortfallTable 8-10:Names of MeasuresObtain CPUC-approved surchargePenalties for excessive water useProposed Measures to Overcome Expenditure ImpactsSummary of EffectsAllows for recovery of increased expenditures brought on bywater shortage programObtain CPUC approval to use penalties to offset portion ofincreased expendituresFinal Report, <strong>2010</strong> Urban <strong>Water</strong> Management Plan – <strong>San</strong> <strong>Dimas</strong> Page 8-9<strong>Golden</strong> <strong>State</strong> <strong>Water</strong> <strong>Company</strong>g:\adminasst\jobs\<strong>2010</strong>\1070001.00_gswc-uwmp\09-reports\9.09-reports\2011-08\grp2b\gswc_sandimas_<strong>2010</strong>_uwmp-final.doc
8.6 <strong>Water</strong>-Use Monitoring ProceduresThe Act asks for an analysis of mechanisms for determining actual reduction in water use whenthe <strong>Water</strong> Shortage Contingency Plan is in effect. Table 8-11 lists the possible mechanismsused by GSWC to monitor water use and the quality of data expected.Table 8-11:<strong>Water</strong>-Use Monitoring MechanismsMechanisms for Determining Actual ReductionsCustomer meter readingsProduction meter readingsType and Quality of Data ExpectedHourly/daily/monthly water consumption data for aspecific user depending on frequency of readingsHourly/daily/monthly water production depending onfrequency of readings; correlates to water use plussystem lossesIn addition to the specific actions that GSWC can undertake to verify level of conservation,GSWC can monitor long-term water use through regular bi-monthly meter readings, which giveGSWC the ability to flag exceptionally high usage for verification of water loss or abuse.Page 8-10Final Report, <strong>2010</strong> Urban <strong>Water</strong> Management Plan – <strong>San</strong> <strong>Dimas</strong><strong>Golden</strong> <strong>State</strong> <strong>Water</strong> <strong>Company</strong>g:\adminasst\jobs\<strong>2010</strong>\1070001.00_gswc-uwmp\09-reports\9.09-reports\2011-08\grp2b\gswc_sandimas_<strong>2010</strong>_uwmp-final.doc
Chapter 9: ReferencesCalifornia Department of <strong>Water</strong> Resources (DWR). 2011. Guidebook to Assist <strong>Water</strong> Suppliersto Prepare a <strong>2010</strong> Urban <strong>Water</strong> Management Plan. March 2011.California Department of <strong>Water</strong> Resources (DWR). <strong>Water</strong> Use and Efficiency Branch. Divisionof <strong>State</strong>wide Integrated <strong>Water</strong> Management. Methodologies for Calculating Baseline andCompliance Urban Per Capita <strong>Water</strong> Use. February 2011.California Department of <strong>Water</strong> Resources (DWR). <strong>2010</strong>. 20x2020 <strong>Water</strong> Conservation Plan.February <strong>2010</strong>.California Department of <strong>Water</strong> Resources (DWR). 2003. California’s Groundwater:Bulletin 118-2003. < http://www.water.ca.gov/groundwater/bulletin118/gwbasin_maps_descriptions.cfm >California Urban <strong>Water</strong> Management Council (Council). <strong>2010</strong>. Memorandum of UnderstandingRegarding Urban <strong>Water</strong> Conservation in California. As Amended June 09.Los Angeles City. Department of City Planning. City of Los Angeles Housing Element 2006 -2014. Los Angeles: 2008.Los Angeles County <strong>San</strong>itation District. Wastewater Facilities. 2011.Los Angeles County <strong>San</strong>itation District. 2005. Recycled <strong>Water</strong> User Manual. February.Metropolitan <strong>Water</strong> District of Southern California (Metropolitan). <strong>Water</strong> Resource ManagementGroup. 2011. <strong>2010</strong> Regional Urban <strong>Water</strong> Management Plan. June <strong>2010</strong>.Southern California Association of Governments (SCAG) Projections. 2008. Growth Forecast..Three Valleys Municipal <strong>Water</strong> District. Urban <strong>Water</strong> Management Plan <strong>2010</strong>. Claremont: <strong>2010</strong>.<strong>UWMP</strong>. 2005. Urban <strong>Water</strong> Management Plan for <strong>San</strong> <strong>Dimas</strong> Customer Service Area.CH2M HILL. December 2005.Western Regional Climate Center (WRCC). 2008. Period of Record Monthly Climate Summary..Final Report, <strong>2010</strong> Urban <strong>Water</strong> Management Plan – <strong>San</strong> <strong>Dimas</strong> Page 9-1<strong>Golden</strong> <strong>State</strong> <strong>Water</strong> <strong>Company</strong>g:\adminasst\jobs\<strong>2010</strong>\1070001.00_gswc-uwmp\09-reports\9.09-reports\2011-08\grp2b\gswc_sandimas_<strong>2010</strong>_uwmp-final.doc
THIS PAGE INTENTIONALLY BLANKPage 9-2Final Report, <strong>2010</strong> Urban <strong>Water</strong> Management Plan – <strong>San</strong> <strong>Dimas</strong><strong>Golden</strong> <strong>State</strong> <strong>Water</strong> <strong>Company</strong>g:\adminasst\jobs\<strong>2010</strong>\1070001.00_gswc-uwmp\09-reports\9.09-reports\2011-08\grp2b\gswc_sandimas_<strong>2010</strong>_uwmp-final.doc
Appendix AUrban <strong>Water</strong> Management Planning Act
CALIFORNIA WATER CODE DIVISION 6PART 2.6. URBAN WATER MANAGEMENT PLANNINGAll California Codes have been updated to include the <strong>2010</strong> Statutes.CHAPTER 1. GENERAL DECLARATION AND POLICY 10610-10610.4CHAPTER 2. DEFINITIONS 10611-10617CHAPTER 3. URBAN WATER MANAGEMENT PLANSArticle 1. General Provisions 10620-10621Article 2. Contents of Plans 10630-10634Article 2.5. <strong>Water</strong> Service Reliability 10635Article 3. Adoption and Implementation of Plans 10640-10645CHAPTER 4. MISCELLANEOUS PROVISIONS 10650-10656WATER CODESECTION 10610-10610.410610. This part shall be known and may be cited as the "Urban<strong>Water</strong> Management Planning Act."10610.2. (a) The Legislature finds and declares all of thefollowing:(1) The waters of the state are a limited and renewable resourcesubject to ever-increasing demands.(2) The conservation and efficient use of urban water supplies areof statewide concern; however, the planning for that use and theimplementation of those plans can best be accomplished at the locallevel.(3) A long-term, reliable supply of water is essential to protectthe productivity of California's businesses and economic climate.(4) As part of its long-range planning activities, every urbanwater supplier should make every effort to ensure the appropriatelevel of reliability in its water service sufficient to meet theneeds of its various categories of customers during normal, dry, andmultiple dry water years.(5) Public health issues have been raised over a number ofcontaminants that have been identified in certain local and importedwater supplies.(6) Implementing effective water management strategies, includinggroundwater storage projects and recycled water projects, may requirespecific water quality and salinity targets for meeting groundwaterbasins water quality objectives and promoting beneficial use ofrecycled water.(7) <strong>Water</strong> quality regulations are becoming an increasinglyimportant factor in water agencies' selection of raw water sources,treatment alternatives, and modifications to existing treatmentfacilities.(8) Changes in drinking water quality standards may also impactthe usefulness of water supplies and may ultimately impact supplyreliability.(9) The quality of source supplies can have a significant impactCalifornia Urban <strong>Water</strong> Management Planning Act Page 1<strong>2010</strong>
on water management strategies and supply reliability.(b) This part is intended to provide assistance to water agenciesin carrying out their long-term resource planning responsibilities toensure adequate water supplies to meet existing and future demandsfor water.10610.4. The Legislature finds and declares that it is the policyof the state as follows:(a) The management of urban water demands and efficient use ofwater shall be actively pursued to protect both the people of thestate and their water resources.(b) The management of urban water demands and efficient use ofurban water supplies shall be a guiding criterion in publicdecisions.(c) Urban water suppliers shall be required to develop watermanagement plans to actively pursue the efficient use of availablesupplies.WATER CODESECTION 10611-1061710611. Unless the context otherwise requires, the definitions ofthis chapter govern the construction of this part.10611.5. "Demand management" means those water conservationmeasures, programs, and incentives that prevent the waste of waterand promote the reasonable and efficient use and reuse of availablesupplies.10612. "Customer" means a purchaser of water from a water supplierwho uses the water for municipal purposes, including residential,commercial, governmental, and industrial uses.10613. "Efficient use" means those management measures that resultin the most effective use of water so as to prevent its waste orunreasonable use or unreasonable method of use.10614. "Person" means any individual, firm, association,organization, partnership, business, trust, corporation, company,public agency, or any agency of such an entity.10615. "Plan" means an urban water management plan preparedpursuant to this part. A plan shall describe and evaluate sources ofsupply, reasonable and practical efficient uses, reclamation anddemand management activities. The components of the plan may varyaccording to an individual community or area's characteristics andits capabilities to efficiently use and conserve water. The planshall address measures for residential, commercial, governmental, andindustrial water demand management as set forth in Article 2(commencing with Section 10630) of Chapter 3. In addition, a strategyand time schedule for implementation shall be included in the plan.10616. "Public agency" means any board, commission, county, cityCalifornia Urban <strong>Water</strong> Management Planning Act Page 2<strong>2010</strong>
and county, city, regional agency, district, or other public entity.10616.5. "Recycled water" means the reclamation and reuse ofwastewater for beneficial use.10617. "Urban water supplier" means a supplier, either publicly orprivately owned, providing water for municipal purposes eitherdirectly or indirectly to more than 3,000 customers or supplying morethan 3,000 acre-feet of water annually. An urban water supplierincludes a supplier or contractor for water, regardless of the basisof right, which distributes or sells for ultimate resale tocustomers. This part applies only to water supplied from public watersystems subject to Chapter 4 (commencing with Section 116275) ofPart 12 of Division 104 of the Health and Safety Code.WATER CODESECTION 10620-1062110620. (a) Every urban water supplier shall prepare and adopt anurban water management plan in the manner set forth in Article 3(commencing with Section 10640).(b) Every person that becomes an urban water supplier shall adoptan urban water management plan within one year after it has become anurban water supplier.(c) An urban water supplier indirectly providing water shall notinclude planning elements in its water management plan as provided inArticle 2 (commencing with Section 10630) that would be applicableto urban water suppliers or public agencies directly providing water,or to their customers, without the consent of those suppliers orpublic agencies.(d) (1) An urban water supplier may satisfy the requirements ofthis part by participation in areawide, regional, watershed, orbasinwide urban water management planning where those plans willreduce preparation costs and contribute to the achievement ofconservation and efficient water use.(2) Each urban water supplier shall coordinate the preparation ofits plan with other appropriate agencies in the area, including otherwater suppliers that share a common source, water managementagencies, and relevant public agencies, to the extent practicable.(e) The urban water supplier may prepare the plan with its ownstaff, by contract, or in cooperation with other governmentalagencies.(f) An urban water supplier shall describe in the plan watermanagement tools and options used by that entity that will maximizeresources and minimize the need to import water from other regions.10621. (a) Each urban water supplier shall update its plan at leastonce every five years on or before December 31, in years ending infive and zero.(b) Every urban water supplier required to prepare a plan pursuantto this part shall, at least 60 days prior to the public hearing onthe plan required by Section 10642, notify any city or county withinwhich the supplier provides water supplies that the urban waterCalifornia Urban <strong>Water</strong> Management Planning Act Page 3<strong>2010</strong>
supplier will be reviewing the plan and considering amendments orchanges to the plan. The urban water supplier may consult with, andobtain comments from, any city or county that receives noticepursuant to this subdivision.(c) The amendments to, or changes in, the plan shall be adoptedand filed in the manner set forth in Article 3 (commencing withSection 10640).WATER CODESECTION 10630-1063410630. It is the intention of the Legislature, in enacting thispart, to permit levels of water management planning commensurate withthe numbers of customers served and the volume of water supplied.10631. A plan shall be adopted in accordance with this chapter thatshall do all of the following:(a) Describe the service area of the supplier, including currentand projected population, climate, and other demographic factorsaffecting the supplier's water management planning. The projectedpopulation estimates shall be based upon data from the state,regional, or local service agency population projections within theservice area of the urban water supplier and shall be in five-yearincrements to 20 years or as far as data is available.(b) Identify and quantify, to the extent practicable, the existingand planned sources of water available to the supplier over the samefive-year increments described in subdivision (a). If groundwater isidentified as an existing or planned source of water available tothe supplier, all of the following information shall be included inthe plan:(1) A copy of any groundwater management plan adopted by the urbanwater supplier, including plans adopted pursuant to Part 2.75(commencing with Section 10750), or any other specific authorizationfor groundwater management.(2) A description of any groundwater basin or basins from whichthe urban water supplier pumps groundwater. For those basins forwhich a court or the board has adjudicated the rights to pumpgroundwater, a copy of the order or decree adopted by the court orthe board and a description of the amount of groundwater the urbanwater supplier has the legal right to pump under the order or decree.For basins that have not been adjudicated, information as to whetherthe department has identified the basin or basins as overdrafted orhas projected that the basin will become overdrafted if presentmanagement conditions continue, in the most current officialdepartmental bulletin that characterizes the condition of thegroundwater basin, and a detailed description of the efforts beingundertaken by the urban water supplier to eliminate the long-termoverdraft condition.(3) A detailed description and analysis of the location, amount,and sufficiency of groundwater pumped by the urban water supplier forthe past five years. The description and analysis shall be based oninformation that is reasonably available, including, but not limitedto, historic use records.California Urban <strong>Water</strong> Management Planning Act Page 4<strong>2010</strong>
(4) A detailed description and analysis of the amount and locationof groundwater that is projected to be pumped by the urban watersupplier. The description and analysis shall be based on informationthat is reasonably available, including, but not limited to, historicuse records.(c) (1) Describe the reliability of the water supply andvulnerability to seasonal or climatic shortage, to the extentpracticable, and provide data for each of the following:(A) An average water year.(B) A single dry water year.(C) Multiple dry water years.(2) For any water source that may not be available at a consistentlevel of use, given specific legal, environmental, water quality, orclimatic factors, describe plans to supplement or replace thatsource with alternative sources or water demand management measures,to the extent practicable.(d) Describe the opportunities for exchanges or transfers of wateron a short-term or long-term basis.(e) (1) Quantify, to the extent records are available, past andcurrent water use, over the same five-year increments described insubdivision (a), and projected water use, identifying the uses amongwater use sectors, including, but not necessarily limited to, all ofthe following uses:(A) Single-family residential.(B) Multifamily.(C) Commercial.(D) Industrial.(E) Institutional and governmental.(F) Landscape.(G) Sales to other agencies.(H) Saline water intrusion barriers, groundwater recharge, orconjunctive use, or any combination thereof.(I) Agricultural.(2) The water use projections shall be in the same five-yearincrements described in subdivision (a).(f) Provide a description of the supplier's water demandmanagement measures. This description shall include all of thefollowing:(1) A description of each water demand management measure that iscurrently being implemented, or scheduled for implementation,including the steps necessary to implement any proposed measures,including, but not limited to, all of the following:(A) <strong>Water</strong> survey programs for single-family residential andmultifamily residential customers.(B) Residential plumbing retrofit.(C) <strong>System</strong> water audits, leak detection, and repair.(D) Metering with commodity rates for all new connections andretrofit of existing connections.(E) Large landscape conservation programs and incentives.(F) High-efficiency washing machine rebate programs.(G) Public information programs.(H) School education programs.(I) Conservation programs for commercial, industrial, andinstitutional accounts.California Urban <strong>Water</strong> Management Planning Act Page 5<strong>2010</strong>
(J) Wholesale agency programs.(K) Conservation pricing.(L) <strong>Water</strong> conservation coordinator.(M) <strong>Water</strong> waste prohibition.(N) Residential ultra-low-flush toilet replacement programs.(2) A schedule of implementation for all water demand managementmeasures proposed or described in the plan.(3) A description of the methods, if any, that the supplier willuse to evaluate the effectiveness of water demand management measuresimplemented or described under the plan.(4) An estimate, if available, of existing conservation savings onwater use within the supplier's service area, and the effect of thesavings on the supplier's ability to further reduce demand.(g) An evaluation of each water demand management measure listedin paragraph (1) of subdivision (f) that is not currently beingimplemented or scheduled for implementation. In the course of theevaluation, first consideration shall be given to water demandmanagement measures, or combination of measures, that offer lowerincremental costs than expanded or additional water supplies. Thisevaluation shall do all of the following:(1) Take into account economic and noneconomic factors, includingenvironmental, social, health, customer impact, and technologicalfactors.(2) Include a cost-benefit analysis, identifying total benefitsand total costs.(3) Include a description of funding available to implement anyplanned water supply project that would provide water at a higherunit cost.(4) Include a description of the water supplier's legal authorityto implement the measure and efforts to work with other relevantagencies to ensure the implementation of the measure and to share thecost of implementation.(h) Include a description of all water supply projects and watersupply programs that may be undertaken by the urban water supplier tomeet the total projected water use as established pursuant tosubdivision (a) of Section 10635. The urban water supplier shallinclude a detailed description of expected future projects andprograms, other than the demand management programs identifiedpursuant to paragraph (1) of subdivision (f), that the urban watersupplier may implement to increase the amount of the water supplyavailable to the urban water supplier in average, single-dry, andmultiple-dry water years. The description shall identify specificprojects and include a description of the increase in water supplythat is expected to be available from each project. The descriptionshall include an estimate with regard to the implementation timelinefor each project or program.(i) Describe the opportunities for development of desalinatedwater, including, but not limited to, ocean water, brackish water,and groundwater, as a long-term supply.(j) For purposes of this part, urban water suppliers that aremembers of the California Urban <strong>Water</strong> Conservation Council shall bedeemed in compliance with the requirements of subdivisions (f) and(g) by complying with all the provisions of the "Memorandum ofUnderstanding Regarding Urban <strong>Water</strong> Conservation in California,"California Urban <strong>Water</strong> Management Planning Act Page 6<strong>2010</strong>
dated December 10, 2008, as it may be amended, and by submitting theannual reports required by Section 6.2 of that memorandum.(k) Urban water suppliers that rely upon a wholesale agency for asource of water shall provide the wholesale agency with water useprojections from that agency for that source of water in five-yearincrements to 20 years or as far as data is available. The wholesaleagency shall provide information to the urban water supplier forinclusion in the urban water supplier's plan that identifies andquantifies, to the extent practicable, the existing and plannedsources of water as required by subdivision (b), available from thewholesale agency to the urban water supplier over the same five-yearincrements, and during various water-year types in accordance withsubdivision (c). An urban water supplier may rely upon water supplyinformation provided by the wholesale agency in fulfilling the planinformational requirements of subdivisions (b) and (c).10631.1. (a) The water use projections required by Section 10631shall include projected water use for single-family and multifamilyresidential housing needed for lower income households, as defined inSection 50079.5 of the Health and Safety Code, as identified in thehousing element of any city, county, or city and county in theservice area of the supplier.(b) It is the intent of the Legislature that the identification ofprojected water use for single-family and multifamily residentialhousing for lower income households will assist a supplier incomplying with the requirement under Section 65589.7 of theGovernment Code to grant a priority for the provision of service tohousing units affordable to lower income households.10631.5. (a) (1) Beginning January 1, 2009, the terms of, andeligibility for, a water management grant or loan made to an urbanwater supplier and awarded or administered by the department, stateboard, or California Bay-Delta Authority or its successor agencyshall be conditioned on the implementation of the water demandmanagement measures described in Section 10631, as determined by thedepartment pursuant to subdivision (b).(2) For the purposes of this section, water management grants andloans include funding for programs and projects for surface water orgroundwater storage, recycling, desalination, water conservation,water supply reliability, and water supply augmentation. This sectiondoes not apply to water management projects funded by the federalAmerican Recovery and Reinvestment Act of 2009 (Public Law 111-5).(3) Notwithstanding paragraph (1), the department shall determinethat an urban water supplier is eligible for a water management grantor loan even though the supplier is not implementing all of thewater demand management measures described in Section 10631, if theurban water supplier has submitted to the department for approval aschedule, financing plan, and budget, to be included in the grant orloan agreement, for implementation of the water demand managementmeasures. The supplier may request grant or loan funds to implementthe water demand management measures to the extent the request isconsistent with the eligibility requirements applicable to the watermanagement funds.(4) (A) Notwithstanding paragraph (1), the department shallCalifornia Urban <strong>Water</strong> Management Planning Act Page 7<strong>2010</strong>
determine that an urban water supplier is eligible for a watermanagement grant or loan even though the supplier is not implementingall of the water demand management measures described in Section10631, if an urban water supplier submits to the department forapproval documentation demonstrating that a water demand managementmeasure is not locally cost effective. If the department determinesthat the documentation submitted by the urban water supplier fails todemonstrate that a water demand management measure is not locallycost effective, the department shall notify the urban water supplierand the agency administering the grant or loan program within 120days that the documentation does not satisfy the requirements for anexemption, and include in that notification a detailed statement tosupport the determination.(B) For purposes of this paragraph, "not locally cost effective"means that the present value of the local benefits of implementing awater demand management measure is less than the present value of thelocal costs of implementing that measure.(b) (1) The department, in consultation with the state board andthe California Bay-Delta Authority or its successor agency, and aftersoliciting public comment regarding eligibility requirements, shalldevelop eligibility requirements to implement the requirement ofparagraph (1) of subdivision (a). In establishing these eligibilityrequirements, the department shall do both of the following:(A) Consider the conservation measures described in the Memorandumof Understanding Regarding Urban <strong>Water</strong> Conservation in California,and alternative conservation approaches that provide equal or greaterwater savings.(B) Recognize the different legal, technical, fiscal, andpractical roles and responsibilities of wholesale water suppliers andretail water suppliers.(2) (A) For the purposes of this section, the department shalldetermine whether an urban water supplier is implementing all of thewater demand management measures described in Section 10631 based oneither, or a combination, of the following:(i) Compliance on an individual basis.(ii) Compliance on a regional basis. Regional compliance shallrequire participation in a regional conservation program consistingof two or more urban water suppliers that achieves the level ofconservation or water efficiency savings equivalent to the amount ofconservation or savings achieved if each of the participating urbanwater suppliers implemented the water demand management measures. Theurban water supplier administering the regional program shallprovide participating urban water suppliers and the department withdata to demonstrate that the regional program is consistent with thisclause. The department shall review the data to determine whetherthe urban water suppliers in the regional program are meeting theeligibility requirements.(B) The department may require additional information for anydetermination pursuant to this section.(3) The department shall not deny eligibility to an urban watersupplier in compliance with the requirements of this section that isparticipating in a multiagency water project, or an integratedregional water management plan, developed pursuant to Section 75026of the Public Resources Code, solely on the basis that one or more ofCalifornia Urban <strong>Water</strong> Management Planning Act Page 8<strong>2010</strong>
the agencies participating in the project or plan is notimplementing all of the water demand management measures described inSection 10631.(c) In establishing guidelines pursuant to the specific fundingauthorization for any water management grant or loan program subjectto this section, the agency administering the grant or loan programshall include in the guidelines the eligibility requirementsdeveloped by the department pursuant to subdivision (b).(d) Upon receipt of a water management grant or loan applicationby an agency administering a grant and loan program subject to thissection, the agency shall request an eligibility determination fromthe department with respect to the requirements of this section. Thedepartment shall respond to the request within 60 days of therequest.(e) The urban water supplier may submit to the department copiesof its annual reports and other relevant documents to assist thedepartment in determining whether the urban water supplier isimplementing or scheduling the implementation of water demandmanagement activities. In addition, for urban water suppliers thatare signatories to the Memorandum of Understanding Regarding Urban<strong>Water</strong> Conservation in California and submit biennial reports to theCalifornia Urban <strong>Water</strong> Conservation Council in accordance with thememorandum, the department may use these reports to assist intracking the implementation of water demand management measures.(f) This section shall remain in effect only until July 1, 2016,and as of that date is repealed, unless a later enacted statute, thatis enacted before July 1, 2016, deletes or extends that date.10631.7. The department, in consultation with the California Urban<strong>Water</strong> Conservation Council, shall convene an independent technicalpanel to provide information and recommendations to the departmentand the Legislature on new demand management measures, technologies,and approaches. The panel shall consist of no more than sevenmembers, who shall be selected by the department to reflect abalanced representation of experts. The panel shall have at leastone, but no more than two, representatives from each of thefollowing: retail water suppliers, environmental organizations, thebusiness community, wholesale water suppliers, and academia. Thepanel shall be convened by January 1, 2009, and shall report to theLegislature no later than January 1, <strong>2010</strong>, and every five yearsthereafter. The department shall review the panel report and includein the final report to the Legislature the department'srecommendations and comments regarding the panel process and thepanel's recommendations.10632. (a) The plan shall provide an urban water shortagecontingency analysis that includes each of the following elementsthat are within the authority of the urban water supplier:(1) Stages of action to be undertaken by the urban water supplierin response to water supply shortages, including up to a 50 percentreduction in water supply, and an outline of specific water supplyconditions that are applicable to each stage.(2) An estimate of the minimum water supply available during eachof the next three water years based on the driest three-year historicCalifornia Urban <strong>Water</strong> Management Planning Act Page 9<strong>2010</strong>
sequence for the agency's water supply.(3) Actions to be undertaken by the urban water supplier toprepare for, and implement during, a catastrophic interruption ofwater supplies including, but not limited to, a regional poweroutage, an earthquake, or other disaster.(4) Additional, mandatory prohibitions against specific water usepractices during water shortages, including, but not limited to,prohibiting the use of potable water for street cleaning.(5) Consumption reduction methods in the most restrictive stages.Each urban water supplier may use any type of consumption reductionmethods in its water shortage contingency analysis that would reducewater use, are appropriate for its area, and have the ability toachieve a water use reduction consistent with up to a 50 percentreduction in water supply.(6) Penalties or charges for excessive use, where applicable.(7) An analysis of the impacts of each of the actions andconditions described in paragraphs (1) to (6), inclusive, on therevenues and expenditures of the urban water supplier, and proposedmeasures to overcome those impacts, such as the development ofreserves and rate adjustments.(8) A draft water shortage contingency resolution or ordinance.(9) A mechanism for determining actual reductions in water usepursuant to the urban water shortage contingency analysis.(b) Commencing with the urban water management plan update dueDecember 31, 2015, for purposes of developing the water shortagecontingency analysis pursuant to subdivision (a), the urban watersupplier shall analyze and define water features that areartificially supplied with water, including ponds, lakes, waterfalls,and fountains, separately from swimming pools and spas, as definedin subdivision (a) of Section 115921 of the Health and Safety Code.10633. The plan shall provide, to the extent available, informationon recycled water and its potential for use as a water source in theservice area of the urban water supplier. The preparation of theplan shall be coordinated with local water, wastewater, groundwater,and planning agencies that operate within the supplier's servicearea, and shall include all of the following:(a) A description of the wastewater collection and treatmentsystems in the supplier's service area, including a quantification ofthe amount of wastewater collected and treated and the methods ofwastewater disposal.(b) A description of the quantity of treated wastewater that meetsrecycled water standards, is being discharged, and is otherwiseavailable for use in a recycled water project.(c) A description of the recycled water currently being used inthe supplier's service area, including, but not limited to, the type,place, and quantity of use.(d) A description and quantification of the potential uses ofrecycled water, including, but not limited to, agriculturalirrigation, landscape irrigation, wildlife habitat enhancement,wetlands, industrial reuse, groundwater recharge, indirect potablereuse, and other appropriate uses, and a determination with regard tothe technical and economic feasibility of serving those uses.(e) The projected use of recycled water within the supplier'sCalifornia Urban <strong>Water</strong> Management Planning Act Page 10<strong>2010</strong>
service area at the end of 5, 10, 15, and 20 years, and a descriptionof the actual use of recycled water in comparison to uses previouslyprojected pursuant to this subdivision.(f) A description of actions, including financial incentives,which may be taken to encourage the use of recycled water, and theprojected results of these actions in terms of acre-feet of recycledwater used per year.(g) A plan for optimizing the use of recycled water in thesupplier's service area, including actions to facilitate theinstallation of dual distribution systems, to promote recirculatinguses, to facilitate the increased use of treated wastewater thatmeets recycled water standards, and to overcome any obstacles toachieving that increased use.10634. The plan shall include information, to the extentpracticable, relating to the quality of existing sources of wateravailable to the supplier over the same five-year increments asdescribed in subdivision (a) of Section 10631, and the manner inwhich water quality affects water management strategies and supplyreliability.WATER CODESECTION 1063510635. (a) Every urban water supplier shall include, as part of itsurban water management plan, an assessment of the reliability of itswater service to its customers during normal, dry, and multiple drywater years. This water supply and demand assessment shall comparethe total water supply sources available to the water supplier withthe total projected water use over the next 20 years, in five-yearincrements, for a normal water year, a single dry water year, andmultiple dry water years. The water service reliability assessmentshall be based upon the information compiled pursuant to Section10631, including available data from state, regional, or local agencypopulation projections within the service area of the urban watersupplier.(b) The urban water supplier shall provide that portion of itsurban water management plan prepared pursuant to this article to anycity or county within which it provides water supplies no later than60 days after the submission of its urban water management plan.(c) Nothing in this article is intended to create a right orentitlement to water service or any specific level of water service.(d) Nothing in this article is intended to change existing lawconcerning an urban water supplier's obligation to provide waterservice to its existing customers or to any potential futurecustomers.California Urban <strong>Water</strong> Management Planning Act Page 11<strong>2010</strong>
WATER CODESECTION 10640-1064510640. Every urban water supplier required to prepare a planpursuant to this part shall prepare its plan pursuant to Article 2(commencing with Section 10630).The supplier shall likewise periodically review the plan asrequired by Section 10621, and any amendments or changes required asa result of that review shall be adopted pursuant to this article.10641. An urban water supplier required to prepare a plan mayconsult with, and obtain comments from, any public agency or stateagency or any person who has special expertise with respect to waterdemand management methods and techniques.10642. Each urban water supplier shall encourage the activeinvolvement of diverse social, cultural, and economic elements of thepopulation within the service area prior to and during thepreparation of the plan. Prior to adopting a plan, the urban watersupplier shall make the plan available for public inspection andshall hold a public hearing thereon. Prior to the hearing, notice ofthe time and place of hearing shall be published within thejurisdiction of the publicly owned water supplier pursuant to Section6066 of the Government Code. The urban water supplier shall providenotice of the time and place of hearing to any city or county withinwhich the supplier provides water supplies. A privately owned watersupplier shall provide an equivalent notice within its service area.After the hearing, the plan shall be adopted as prepared or asmodified after the hearing.10643. An urban water supplier shall implement its plan adoptedpursuant to this chapter in accordance with the schedule set forth inits plan.10644. (a) An urban water supplier shall submit to the department,the California <strong>State</strong> Library, and any city or county within which thesupplier provides water supplies a copy of its plan no later than 30days after adoption. Copies of amendments or changes to the plansshall be submitted to the department, the California <strong>State</strong> Library,and any city or county within which the supplier provides watersupplies within 30 days after adoption.(b) The department shall prepare and submit to the Legislature, onor before December 31, in the years ending in six and one, a reportsummarizing the status of the plans adopted pursuant to this part.The report prepared by the department shall identify the exemplaryelements of the individual plans. The department shall provide a copyof the report to each urban water supplier that has submitted itsplan to the department. The department shall also prepare reports andprovide data for any legislative hearings designed to consider theeffectiveness of plans submitted pursuant to this part.(c) (1) For the purpose of identifying the exemplary elements ofthe individual plans, the department shall identify in the reportthose water demand management measures adopted and implemented byspecific urban water suppliers, and identified pursuant to SectionCalifornia Urban <strong>Water</strong> Management Planning Act Page 12<strong>2010</strong>
10631, that achieve water savings significantly above the levelsestablished by the department to meet the requirements of Section10631.5.(2) The department shall distribute to the panel convened pursuantto Section 10631.7 the results achieved by the implementation ofthose water demand management measures described in paragraph (1).(3) The department shall make available to the public the standardthe department will use to identify exemplary water demandmanagement measures.10645. Not later than 30 days after filing a copy of its plan withthe department, the urban water supplier and the department shallmake the plan available for public review during normal businesshours.California Urban <strong>Water</strong> Management Planning Act Page 13<strong>2010</strong>
WATER CODESECTION 10650-1065610650. Any actions or proceedings to attack, review, set aside,void, or annul the acts or decisions of an urban water supplier onthe grounds of noncompliance with this part shall be commenced asfollows:(a) An action or proceeding alleging failure to adopt a plan shallbe commenced within 18 months after that adoption is required bythis part.(b) Any action or proceeding alleging that a plan, or action takenpursuant to the plan, does not comply with this part shall becommenced within 90 days after filing of the plan or amendmentthereto pursuant to Section 10644 or the taking of that action.10651. In any action or proceeding to attack, review, set aside,void, or annul a plan, or an action taken pursuant to the plan by anurban water supplier on the grounds of noncompliance with this part,the inquiry shall extend only to whether there was a prejudicialabuse of discretion. Abuse of discretion is established if thesupplier has not proceeded in a manner required by law or if theaction by the water supplier is not supported by substantialevidence.10652. The California Environmental Quality Act (Division 13(commencing with Section 21000) of the Public Resources Code) doesnot apply to the preparation and adoption of plans pursuant to thispart or to the implementation of actions taken pursuant to Section10632. Nothing in this part shall be interpreted as exempting fromthe California Environmental Quality Act any project that wouldsignificantly affect water supplies for fish and wildlife, or anyproject for implementation of the plan, other than projectsimplementing Section 10632, or any project for expanded or additionalwater supplies.10653. The adoption of a plan shall satisfy any requirements ofstate law, regulation, or order, including those of the <strong>State</strong> <strong>Water</strong>Resources Control Board and the Public Utilities Commission, for thepreparation of water management plans or conservation plans;provided, that if the <strong>State</strong> <strong>Water</strong> Resources Control Board or thePublic Utilities Commission requires additional informationconcerning water conservation to implement its existing authority,nothing in this part shall be deemed to limit the board or thecommission in obtaining that information. The requirements of thispart shall be satisfied by any urban water demand management planprepared to meet federal laws or regulations after the effective dateof this part, and which substantially meets the requirements of thispart, or by any existing urban water management plan which includesthe contents of a plan required under this part.10654. An urban water supplier may recover in its rates the costsincurred in preparing its plan and implementing the reasonable waterconservation measures included in the plan. Any best water managementpractice that is included in the plan that is identified in theCalifornia Urban <strong>Water</strong> Management Planning Act Page 14<strong>2010</strong>
"Memorandum of Understanding Regarding Urban <strong>Water</strong> Conservation inCalifornia" is deemed to be reasonable for the purposes of thissection.10655. If any provision of this part or the application thereof toany person or circumstances is held invalid, that invalidity shallnot affect other provisions or applications of this part which can begiven effect without the invalid provision or application thereof,and to this end the provisions of this part are severable.10656. An urban water supplier that does not prepare, adopt, andsubmit its urban water management plan to the department inaccordance with this part, is ineligible to receive funding pursuantto Division 24 (commencing with Section 78500) or Division 26(commencing with Section 79000), or receive drought assistance fromthe state until the urban water management plan is submitted pursuantto this article.California Urban <strong>Water</strong> Management Planning Act Page 15<strong>2010</strong>
Appendix BPublic Hearing Notices, Notifications, and Meeting Minutes(Meeting Minutes to Be Included in Final <strong>UWMP</strong>)
May 17, 2011City of CovinaMichael A. MarquezCommunity Development Director125 E. College StreetCovina, CA 91723Subject:Notification of Public Hearing for the <strong>2010</strong> Urban <strong>Water</strong> Management Plan (<strong>UWMP</strong>)<strong>Golden</strong> <strong>State</strong> <strong>Water</strong> <strong>Company</strong> – <strong>San</strong> <strong>Dimas</strong>, Claremont, <strong>San</strong> Gabriel and SouthArcadia <strong>Water</strong> <strong>System</strong>s.Dear Michael:<strong>Golden</strong> <strong>State</strong> <strong>Water</strong> <strong>Company</strong> (GSWC) is providing you this notice pursuant to <strong>Water</strong> Code,section 10621, subdivision (b) of the Act, which requires an urban water supplier to notify anycity or county within which it provides water that it is reviewing its plan and considering changesto the plan for the following water systems:<strong>San</strong> <strong>Dimas</strong>, Claremont, <strong>San</strong> Gabriel and South ArcadiaThe <strong>UWMP</strong>’s will be available for public review prior to the public hearing and can be reviewedduring normal business hours. Please call 1-800-999-4033 to make an appointment to view theplan at:<strong>San</strong> <strong>Dimas</strong> Customer Service Office121 Exchange Place<strong>San</strong> <strong>Dimas</strong>, CA 91773<strong>San</strong> Gabriel Customer Service Center110 East Live OakArcadia, CA 91006Claremont Customer Service Center689 West Foothill Blvd., Suite DClaremont, CA 91711
A public hearing to solicit comments on the draft <strong>UWMP</strong> will be held at 6:00 p.m., onTuesday, July 19, 2011 and take place at:<strong>San</strong> <strong>Dimas</strong> Community Center201 E. Bonita Avenue<strong>San</strong> <strong>Dimas</strong>, CA 91773If you have any questions please contact me at (916) 853-3612.Very truly yours,GOLDEN STATE WATER COMPANYErnest A. GislerPlanning Manager
May 17, 2011City of La VerneHal FredericksenCommunity Development Director3660 D StreetLa Verne, CA 91723Subject:Notification of Public Hearing for the <strong>2010</strong> Urban <strong>Water</strong> Management Plan (<strong>UWMP</strong>)<strong>Golden</strong> <strong>State</strong> <strong>Water</strong> <strong>Company</strong> – <strong>San</strong> <strong>Dimas</strong>, Claremont, <strong>San</strong> Gabriel and SouthArcadia <strong>Water</strong> <strong>System</strong>s.Dear Hal:<strong>Golden</strong> <strong>State</strong> <strong>Water</strong> <strong>Company</strong> (GSWC) is providing you this notice pursuant to <strong>Water</strong> Code,section 10621, subdivision (b) of the Act, which requires an urban water supplier to notify anycity or county within which it provides water that it is reviewing its plan and considering changesto the plan for the following water systems:<strong>San</strong> <strong>Dimas</strong>, Claremont, <strong>San</strong> Gabriel and South ArcadiaThe <strong>UWMP</strong>’s will be available for public review prior to the public hearing and can be reviewedduring normal business hours. Please call 1-800-999-4033 to make an appointment to view theplan at:<strong>San</strong> <strong>Dimas</strong> Customer Service Office121 Exchange Place<strong>San</strong> <strong>Dimas</strong>, CA 91773<strong>San</strong> Gabriel Customer Service Center110 East Live OakArcadia, CA 91006Claremont Customer Service Center689 West Foothill Blvd., Suite DClaremont, CA 91711
A public hearing to solicit comments on the draft <strong>UWMP</strong> will be held at 6:00 p.m., onTuesday, July 19, 2011 and take place at:<strong>San</strong> <strong>Dimas</strong> Community Center201 E. Bonita Avenue<strong>San</strong> <strong>Dimas</strong>, CA 91773If you have any questions please contact me at (916) 853-3612.Very truly yours,GOLDEN STATE WATER COMPANYErnest A. GislerPlanning Manager
May 17, 2011City of <strong>San</strong> <strong>Dimas</strong>Dan ColemanPlanning Manager245 East Bonita Avenue<strong>San</strong> <strong>Dimas</strong>, CA 91773Subject:Notification of Public Hearing for the <strong>2010</strong> Urban <strong>Water</strong> Management Plan (<strong>UWMP</strong>)<strong>Golden</strong> <strong>State</strong> <strong>Water</strong> <strong>Company</strong> – <strong>San</strong> <strong>Dimas</strong>, Claremont, <strong>San</strong> Gabriel and SouthArcadia <strong>Water</strong> <strong>System</strong>s.Dear Dan:<strong>Golden</strong> <strong>State</strong> <strong>Water</strong> <strong>Company</strong> (GSWC) is providing you this notice pursuant to <strong>Water</strong> Code,section 10621, subdivision (b) of the Act, which requires an urban water supplier to notify anycity or county within which it provides water that it is reviewing its plan and considering changesto the plan for the following water systems:<strong>San</strong> <strong>Dimas</strong>, Claremont, <strong>San</strong> Gabriel and South ArcadiaThe <strong>UWMP</strong>’s will be available for public review prior to the public hearing and can be reviewedduring normal business hours. Please call 1-800-999-4033 to make an appointment to view theplan at:<strong>San</strong> <strong>Dimas</strong> Customer Service Office121 Exchange Place<strong>San</strong> <strong>Dimas</strong>, CA 91773<strong>San</strong> Gabriel Customer Service Center110 East Live OakArcadia, CA 91006Claremont Customer Service Center689 West Foothill Blvd., Suite DClaremont, CA 91711
A public hearing to solicit comments on the draft <strong>UWMP</strong> will be held at 6:00 p.m., onTuesday, July 19, 2011 and take place at:<strong>San</strong> <strong>Dimas</strong> Community Center201 E. Bonita Avenue<strong>San</strong> <strong>Dimas</strong>, CA 91773If you have any questions please contact me at (916) 853-3612.Very truly yours,GOLDEN STATE WATER COMPANYErnest A. GislerPlanning Manager
May 17, 2011City of WalnutTom WienerDirector of Community Development21201 La Puente RoadWalnut, CA 91789Subject:Notification of Public Hearing for the <strong>2010</strong> Urban <strong>Water</strong> Management Plan (<strong>UWMP</strong>)<strong>Golden</strong> <strong>State</strong> <strong>Water</strong> <strong>Company</strong> – <strong>San</strong> <strong>Dimas</strong>, Claremont, <strong>San</strong> Gabriel and SouthArcadia <strong>Water</strong> <strong>System</strong>s.Dear Tom:<strong>Golden</strong> <strong>State</strong> <strong>Water</strong> <strong>Company</strong> (GSWC) is providing you this notice pursuant to <strong>Water</strong> Code,section 10621, subdivision (b) of the Act, which requires an urban water supplier to notify anycity or county within which it provides water that it is reviewing its plan and considering changesto the plan for the following water systems:<strong>San</strong> <strong>Dimas</strong>, Claremont, <strong>San</strong> Gabriel and South ArcadiaThe <strong>UWMP</strong>’s will be available for public review prior to the public hearing and can be reviewedduring normal business hours. Please call 1-800-999-4033 to make an appointment to view theplan at:<strong>San</strong> <strong>Dimas</strong> Customer Service Office121 Exchange Place<strong>San</strong> <strong>Dimas</strong>, CA 91773<strong>San</strong> Gabriel Customer Service Center110 East Live OakArcadia, CA 91006Claremont Customer Service Center689 West Foothill Blvd., Suite DClaremont, CA 91711
A public hearing to solicit comments on the draft <strong>UWMP</strong> will be held at 6:00 p.m., onTuesday, July 19, 2011 and take place at:<strong>San</strong> <strong>Dimas</strong> Community Center201 E. Bonita Avenue<strong>San</strong> <strong>Dimas</strong>, CA 91773If you have any questions please contact me at (916) 853-3612.Very truly yours,GOLDEN STATE WATER COMPANYErnest A. GislerPlanning Manager
May 17, 2011County of Los AngelesRichard BrudcknerDirector Department of Regional Planning320 West Temple StreetLos Angeles, CA 900121Subject:Notification of Public Hearing for the <strong>2010</strong> Urban <strong>Water</strong> Management Plan (<strong>UWMP</strong>)<strong>Golden</strong> <strong>State</strong> <strong>Water</strong> <strong>Company</strong> – <strong>San</strong> <strong>Dimas</strong> <strong>System</strong>Dear Richard:<strong>Golden</strong> <strong>State</strong> <strong>Water</strong> <strong>Company</strong> (GSWC) is providing you this notice pursuant to <strong>Water</strong> Code,section 10621, subdivision (b) of the Act, which requires an urban water supplier to notify anycity or county within which it provides water that it is reviewing its plan and considering changesto the plan for the following water system: <strong>San</strong> <strong>Dimas</strong>. The <strong>UWMP</strong> will be available for publicreview prior to the public hearing and can be reviewed during normal business hours. Pleasecall 1-800-999-4033 to make an appointment to view the plan at:<strong>San</strong> <strong>Dimas</strong> Customer Service Office121 Exchange Place<strong>San</strong> <strong>Dimas</strong>, CA 91773A public hearing to solicit comments on the draft <strong>UWMP</strong> will be held at 6:00 p.m., onTuesday, July 19, 2011 and take place at:<strong>San</strong> <strong>Dimas</strong> Community Center201 E. Bonita Avenue<strong>San</strong> <strong>Dimas</strong>, CA 91773If you have any questions please contact me at (916) 853-3612.Very truly yours,GOLDEN STATE WATER COMPANYErnest A. GislerPlanning Manager
May 17, 2011Country of Los AngelesRichard BrudcknerDirector Department of Regional Planning320 West Temple StreetLos Angeles, CA 90012Subject:Notification of Public Hearing for the <strong>2010</strong> Urban <strong>Water</strong> Management Plan (<strong>UWMP</strong>)<strong>Golden</strong> <strong>State</strong> <strong>Water</strong> <strong>Company</strong> – <strong>San</strong> <strong>Dimas</strong>, Claremont, <strong>San</strong> Gabriel and SouthArcadia <strong>Water</strong> <strong>System</strong>s.Dear Richard:<strong>Golden</strong> <strong>State</strong> <strong>Water</strong> <strong>Company</strong> (GSWC) is providing you this notice pursuant to <strong>Water</strong> Code,section 10621, subdivision (b) of the Act, which requires an urban water supplier to notify anycity or county within which it provides water that it is reviewing its plan and considering changesto the plan for the following water systems:<strong>San</strong> <strong>Dimas</strong>, Claremont, <strong>San</strong> Gabriel and South ArcadiaThe <strong>UWMP</strong>’s will be available for public review prior to the public hearing and can be reviewedduring normal business hours. Please call 1-800-999-4033 to make an appointment to view theplan at:<strong>San</strong> <strong>Dimas</strong> Customer Service Office121 Exchange Place<strong>San</strong> <strong>Dimas</strong>, CA 91773<strong>San</strong> Gabriel Customer Service Center110 East Live OakArcadia, CA 91006Claremont Customer Service Center689 West Foothill Blvd., Suite DClaremont, CA 91711
A public hearing to solicit comments on the draft <strong>UWMP</strong> will be held at 6:00 p.m., onTuesday, July 19, 2011 and take place at:<strong>San</strong> <strong>Dimas</strong> Community Center201 E. Bonita Avenue<strong>San</strong> <strong>Dimas</strong>, CA 91773If you have any questions please contact me at (916) 853-3612.Very truly yours,GOLDEN STATE WATER COMPANYErnest A. GislerPlanning Manager
<strong>San</strong> <strong>Dimas</strong> Community Service Area -- <strong>Golden</strong> <strong>State</strong> <strong>Water</strong> <strong>Company</strong> -- California <strong>Water</strong>...http://www.gswater.com/csa_homepages/san_dimas.htmlPage 1 of 36/13/2011Home | Contact Us | Site MapSearchCustomer Service Home PageFind Local Office InformationPayment OptionsUnderstanding Your BillHow to Read Your MeterDefinitions and TerminologyFrequently Asked QuestionsNew Customer BrochureFind Local Office Information » <strong>San</strong> <strong>Dimas</strong><strong>San</strong> <strong>Dimas</strong> Customer Service AreaAreas ServicedThis Customer Service Area serves approximately 15,900 customers in portions ofCharter Oaks, Covina, Glendora, La Verne, <strong>San</strong> <strong>Dimas</strong>, and WalnutOffice Location<strong>San</strong> <strong>Dimas</strong> CSA121 Exchange Place<strong>San</strong> <strong>Dimas</strong>, CA 9177324 hour Customer Service and Emergency800-999-4033 (24 hours, 7 days a week)877-933-9533 (TTY hearing impaired)Email: customerservice@gswater.comUrban <strong>Water</strong> Management PlanPublic Meeting Notice<strong>Golden</strong> <strong>State</strong> <strong>Water</strong> <strong>Company</strong> (GSWC) is in the process of updating its existing Urban<strong>Water</strong> Management Plan and is seeking public input. The plan is expected to beavailable for review one week prior to the meeting date.See public notice for more information.<strong>Golden</strong> <strong>State</strong> <strong>Water</strong> <strong>Company</strong> (GSWC) Files a Cost of Capital ApplicationA Cost of Capital application was filed May 2, 2011 with the the California Public UtilitiesCommission (CPUC). The CPUC regulates GSWC to ensure adequate levels of serviceare provided at the lowest reasonable costs.In this filing, GSWC is requesting for the CPUC to review and authorize an increase inthe cost of capital reflected in rates for 2012, 2013, and 2014. A decision is expected inDecember 2011.A copy of the application is here.New Rates Establishedin <strong>San</strong> <strong>Dimas</strong> Customer Service Areafor 2011 and 2012The CPUC issued a final decision on the company’s 2008 General Rate Case on Nov. 19,<strong>2010</strong>. The decision established rates for GSWC to charge customers for <strong>2010</strong>, 2011 and2012 in its Region III, which includes the <strong>San</strong> <strong>Dimas</strong> Customer Service Area.Fact SheetRATES, SCHEDULES & TARIFFSResidential Metered ServiceNon-Residential Metered ServiceMandatory Conservation - Rationing (Schedule 14.1)CLICK HERE to view all our rates, tariffs and advice lettersThird Tier Added to Tiered Ratesfor <strong>San</strong> <strong>Dimas</strong> Customer Service Areato Encourage <strong>Water</strong> Use EfficiencyGSWC residential customers in the utility’s <strong>San</strong> <strong>Dimas</strong> Customer Service Area (CSA)had a third tier added to their tiered rates to promote water use efficiency.The change, approved by the California Public Utilities Commission, began in December<strong>2010</strong>. GSWC will not exceed CPUC authorized revenues as a result of tiered rates.
<strong>San</strong> <strong>Dimas</strong> Community Service Area -- <strong>Golden</strong> <strong>State</strong> <strong>Water</strong> <strong>Company</strong> -- California <strong>Water</strong>...http://www.gswater.com/csa_homepages/san_dimas.htmlPage 2 of 36/13/2011Here’s how tiered rates work. Customers get charged for each unit of water they use. Aunit is equal to one hundred cubic feet of water, or Ccf (748 gallons). In the <strong>San</strong> <strong>Dimas</strong>CSA, residential customers will pay the lowest rate for each Ccf they use in tier one, upto 13 Ccf. For every unit of water used in tier two, which is 14-21 Ccf, customers willpay a 15 percent higher rate. In tier three, customers will pay an additional 15 percentfor every unit of water from 22 Ccf and above.The top of the first tier is based on the average winter month usage for the servicearea. The top of second tier is based on the midpoint between the annual averageusage and the average summer month usage for the service area. The per unit pricedifferential between each tier is approximately 15 percent, a sufficient amount toencourage water use efficiency.For more information, see our Residential Metered Service tariff in the article above.LOW INCOME PROGRAMCalifornia Alternate Rates for <strong>Water</strong> (CARW)<strong>Golden</strong> <strong>State</strong> <strong>Water</strong> <strong>Company</strong> offers a discount through the California Alternate Ratesfor <strong>Water</strong> (CARW) program to eligible customers. The amount of the discount is $8 permonth, which is equal to 15 percent of the average bill in your customer service area.If you qualify for a rate discount on your electricity, you may be eligible for a discounton your water bill. Qualifications are based on the number of people living in your homeand your total household income, including wages, government checks and benefits,and other financial support you and members of your family receive.For further information, see the application below or contact our CARW hotline at (866)360-CARW (2279).Application (English)Application (Spanish)Visit <strong>Golden</strong> <strong>State</strong> <strong>Water</strong> <strong>Company</strong>'sDemonstration Garden in <strong>San</strong> <strong>Dimas</strong><strong>Golden</strong> <strong>State</strong> <strong>Water</strong> <strong>Company</strong>’s demonstration garden which features over 25 differentCalifornia-friendly plants, drought tolerant turf, and a water-wise smart irrigationsystem recently received the California Landscape Contractors Association (CLCA) statewidetrophy award for sustainability.The CLCA trophy awards recognize companies, institutions, municipalities and residentsfor their interest in preserving and maintaining a beautiful California. The first of aninaugural award to be given by the CLCA, the award was designed to recognize thoseprojects containing sustainable installation elements, including: water management,planting and plant selection, sustainable construction methods.Since the completion of the project, <strong>Golden</strong> <strong>State</strong> <strong>Water</strong> <strong>Company</strong> has exceeded a 56-month return on investment goal of 40 percent water savings.<strong>Golden</strong> <strong>State</strong> <strong>Water</strong> <strong>Company</strong>'s<strong>Water</strong> Shortage Planfor <strong>San</strong> <strong>Dimas</strong> Customers<strong>Golden</strong> <strong>State</strong> <strong>Water</strong> <strong>Company</strong> developed a water shortage plan (Schedule 14.1) for its<strong>San</strong> <strong>Dimas</strong> Customer Service Area that asks customers to voluntarily reduce their usagebased on historical averages. Read additional plan details here. Each water allocationis based on the customer's average historical usage in 2004, 2005, and 2006, minus 10percent.Additionally, water use restrictions are now in place. GSWC may issue fines tocustomers who are involved in water wasting activities such as using water in anymanner that results in run-off in gutters, waterways, patios, driveways or streets.Repeated violations could lead to the installation of flow restrictors at the customer’scost and suspension of service. See list of restrictions.Should a mandatory allocation stage be implemented, exception forms will be availablefor customers to request an allocation adjustment. For example, if a household addedseveral people since 2006, or if customers require additional water for medical needs,they may be eligible for a higher water budget. <strong>Water</strong> conservation practices anddevices may be evaluated as part of the exception evaluation process.Since the targeted reductions in the current stage for Claremont customers arevoluntary, allocation forms will not be processed at this time.WATER CONSERVATION REBATE PROGRAMS<strong>Golden</strong> <strong>State</strong> <strong>Water</strong> <strong>Company</strong> partners with other agencies to offer various rebateprograms as an incentive for customers to purchase water-efficient products. Here are
<strong>San</strong> <strong>Dimas</strong> Community Service Area -- <strong>Golden</strong> <strong>State</strong> <strong>Water</strong> <strong>Company</strong> -- California <strong>Water</strong>...http://www.gswater.com/csa_homepages/san_dimas.htmlPage 3 of 36/13/2011some programs created for <strong>San</strong> <strong>Dimas</strong> Customer Service Area customers. Funding islimited.High-Efficiency Clothes Washer (HECW) RebatesFor single-family homes call 1-888-376-3314 or visit www.socalwatersmart.com.Up to $85 rebate for those who qualify.High-Efficiency Toilet (HET) RebatesUp to $125 for qualifying customers. Click here for application or call1-800-999-4033.Rotating Nozzles and Pressure Regulating Sprinkler HeadsSingle-family homes, call 888-376-3314 or visit www.socalwatersmart.com.Up to $4 per set rebate for those who qualify.Weather-based Irrigation Controller (SmarTimer)Single-family homes and multi-family buildings up to four units,call 888-376-3314 or visit www.socalwatersmart.com.Up to $25 rebate per station for those who qualify.SmarTimer rebates for multi-family buildings with more than four units are currently nolonger available due to overwhelming public response.To learn more about any of our current rebate programs, please call customer serviceat 800-999-4033.WATER QUALITY ANNUAL REPORT<strong>San</strong> <strong>Dimas</strong>© 2011 <strong>Golden</strong> <strong>State</strong> <strong>Water</strong> <strong>Company</strong>. All rights reserved. Terms of Use | Privacy PolicyHome Page | About <strong>Golden</strong> <strong>State</strong> <strong>Water</strong> <strong>Company</strong> | Customer Service | Find Your Local Office | Understanding Your BillConservation Information and Rebate Programs | Rates, Schedules and Tariffs | <strong>Water</strong> Quality | Contact UsFor 24-hour emergency and customer service, please call: 1-800-999-4033 or 877-933-9533 TTY (hearing impaired)customerservice@gswater.comWebsite design by NetPilot Web Solutions
No Meeting Minutes were taken since there was no attendanceby the public.
Appendix CCouncil Annual Reports for Demand Management Measures(To Be Included in Final <strong>UWMP</strong>)
4CUWCC BMP RETAIL COVERAGE REPORT 2009-<strong>2010</strong>Foundation Best Management Practices for Urban <strong>Water</strong> EfficiencyAgency: <strong>Golden</strong> <strong>State</strong> <strong>Water</strong> <strong>Company</strong> District Name: <strong>San</strong> <strong>Dimas</strong> CUWCC Unit #: 5044RetailPrimary Contact John Turner Telephone (909) 394-3600 Ext Email: johnturner@gswater.comCompliance Option Chosen By Reporting Agency:(Traditional, Flex Track or GPCD)GPCD if used: GPCD in <strong>2010</strong> 229GPCD Target for 2018 231Year Report TargetHighest AcceptableBoundNot on Track if <strong>2010</strong> GPCD is > than target% Base GPCD % Base GPCD GPCD in 201 229<strong>2010</strong> 1 96.4% 272 100% 282Highest2012 2 92.8% 261 96% 272 Acceptable2822014 3 89.2% 251 93% 261GPCD for2016 4 85.6% 241 89% 251 On Track2018 5 82.0% 231 82% 231
Agency: <strong>Golden</strong> <strong>State</strong> <strong>Water</strong> <strong>Company</strong> District Name: <strong>San</strong> <strong>Dimas</strong> CUWCC Unit #: 5044Retail4CUWCC BMP RETAIL COVERAGE REPORT 2009-<strong>2010</strong>Foundation Best Management Practices for Urban <strong>Water</strong> EfficiencyFoundational BMPsBMP 1.1 Operational Practices1.Conservation Coordinatorprovided with necessaryresources to implement BMPs?2. <strong>Water</strong> waste prevention documentation2009 <strong>2010</strong>Name Albert Frias AlbertFriasTitle <strong>Water</strong> Conservation Coordinator <strong>Water</strong> Conservation CoordinatorEmailOn Track On TrackDescriptive File Rule 20 = <strong>Water</strong> Conservation. Rule 11B = Discontinuance of Service based upon <strong>Water</strong> Wastage. RDescriptive File <strong>2010</strong>URLURL <strong>2010</strong>Describe Ordinance TermsOn Track On TrackConservation Coordinator provided with necessary resources toimplement BMPs?Where negligent or wasteful use of water exists on customer’s premises, the utility may discontinuethe service if such practices are not remedied within five days after it has given the customer writtennotice to such effect.http://www.aswater.com/Organization/Rates_and_Regulations/Rates_and_Tariffs/Rule_11.pdfOn Track if any one ofthe 6 ordinance actionsdone, plusdocumentation or linksprovided
Agency: <strong>Golden</strong> <strong>State</strong> <strong>Water</strong> <strong>Company</strong> District Name: <strong>San</strong> <strong>Dimas</strong> CUWCC Unit #: 5044Retail4CUWCC BMP RETAIL COVERAGE REPORT 2009-<strong>2010</strong>Foundation Best Management Practices for Urban <strong>Water</strong> EfficiencyBMP 1.2 <strong>Water</strong> Loss Control2009Complete a prescreening Audit On Track if YesMetered Sales #REF!Verifiable Other Uses #REF!Total Supply #REF!(Metered Sales + <strong>System</strong> uses)/Total Supply >0.89If ratio is less than 0.9, complete a fullscale Audit in 2009?#REF! #REF!#REF!On Track if =>.89, Not on Track if NoOn Track if YesVerify Data with Records on File? #REF! #REF! On Track if YesOperate a system Leak Detection Program? #REF! #REF! On Track if YesCompile Standard <strong>Water</strong> Audit usingAWWA Software?<strong>2010</strong>Yes On Track On Track if Yes, Not on Track if NoAWWA file provided to CUWCC? On Track On Track if Yes, Not on Track if NoAWWA <strong>Water</strong> Audit Validity Score? 84 Info only until 2012Completed Training in AWWA AuditMethod?Completed Training in ComponentAnalysis Process?YesNoInfo only until 2012Complete Component Analysis? No Info only until 2012Repaired all leaks and breaks to theextent cost effective?Locate and repair unreported leaks to theextent cost effective.YesYes On Track On Track if Yes, Not on Track if NoYes On Track On Track if Yes, Not on Track if NoMaintain a record-keeping system for the repair of reportedleaks, including time of report, leak location, type of leaking pipesegment or fitting, and leak running time from report to repair.YesInfo only until 2012Provided 7 types of <strong>Water</strong> Loss Control InfoLeaksRepairedValue Real LossesValue ApparentLossesMilesSurveyedPressReductionCost of Interventions<strong>Water</strong>SavedInfo only until 201218 $1,540.00 $1,540.00 38 41
Agency: <strong>Golden</strong> <strong>State</strong> <strong>Water</strong> <strong>Company</strong> District Name: <strong>San</strong> <strong>Dimas</strong> CUWCC Unit #: 5044Retail4CUWCC BMP RETAIL COVERAGE REPORT 2009-<strong>2010</strong>Foundation Best Management Practices for Urban <strong>Water</strong> Efficiency1.3 METERING WITH COMMODITY RATES FOR ALL NEW CONNECTIONS AND RETROFITOF EXISTING CONNECTIONSExemption or 'At least as Effective As'accepted by CUWCCNumbered Unmetered Accounts2009 <strong>2010</strong>If signed MOU prior to 31 Dec 1997, On Track if allconnections metered; If signed after 31 Dec 1997,complete meter installations by 1 July 2012 or within 6 yrs ofsigning and 20% biannual reduction of unmeteredconnections.2008 0 On Track 0 On Track On Track if no unmetered accountsMetered Accounts billed by volume ofuseNumber of CII accounts withMixed Use metersConducted a feasibility study to assess meritsof a program to provide incentives to switchmixed-use accounts to dedicated landscapemeters?Yes On Track Yes On Track150 149 Info onlyNo No Info only until 2012Volumetric billing required for all connections onsame schedule as meteringFeasibility Study provided to CUWCC? No On Track until 2012 No On Track until 2012 On Track if Yes, Not on Track if NoCompleted a written plan, policy or programto test, repair and replace metersYes On Track Yes On Track On Track if Yes, Not on Track if No
4CUWCC BMP RETAIL COVERAGE REPORT 2009-<strong>2010</strong>Foundation Best Management Practices for Urban <strong>Water</strong> EfficiencyAgency: <strong>Golden</strong> <strong>State</strong> <strong>Water</strong> <strong>Company</strong> District Name: <strong>San</strong> <strong>Dimas</strong> CUWCC Unit #: 5044RetailPrimary Contact John Turner Email: johnturner@gswater.com1.4 Retail Conservation PricingMetered <strong>Water</strong> Rate StructureOn Track if: Increasing Block, Uniform,Allocation, Standby Service; Not on Track ifotherwiseCustomer Class 2009 Rate Type Conserving Rate? Customer Class <strong>2010</strong> Rate Type Conserving Rate?Single-Family Increasing Block Yes Single-Family Increasing Block YesMulti-Family Increasing Block Yes Multi-Family Increasing Block YesCommercial Uniform Yes Commercial Uniform YesIndustrial Uniform Yes Industrial Uniform YesInstitutional Uniform Yes Institutional Uniform YesOn Track On TrackYear Volumetric Rates began for Agencies with some UnmeteredAccountsInfo onlyAgencies with Partially Metered Service Areas: If signed MOU prior to 31 Dec. 1997, implementation starts no laterthan 1July <strong>2010</strong>. If signed MOU after 31 Dec. 1997, implementation starts no later than 1July 2013, or within sevenyears of signing the MOU,
Foundation Best Management Practices for Urban <strong>Water</strong> EfficiencyOn Track if: 'Increasing Block', 'Uniform', 'based on long termmarginal cost' or 'next unit of capacity'Agency: <strong>Golden</strong> <strong>State</strong> <strong>Water</strong> <strong>Company</strong> District Name: <strong>San</strong> <strong>Dimas</strong> CUWCC Unit #: 5044RetailCUWCC BMP RETAIL COVERAGE REPORT 2009-<strong>2010</strong>Adequacy of Volumetric Rates) for Agencies with No Unmetered AccountsCustomer Class 2009 Rate Type 2009 Volumetric<strong>2010</strong> Rate TypeRevenues $1000sSingle-Family Increasing Block $6,262Single-FamilyMulti-Family Increasing Block $63Multi-FamilyCommercial Uniform $ 3,368CommercialIndustrial Uniform $50IndustrialInstitutional Uniform $ 704InstitutionalDedicated IrrigationOther$ 256$66<strong>2010</strong> VolumetricRevenues $1000s$ 6,301$64$3,389$50$709$258$66Agency Choices for rates:A) Agencies signingMOU prior to 13June2007,implementation starts 1July2007: On Track if (V56% for 2009 and70%x0.90 = 63% for<strong>2010</strong>; Not on track if (V /(V + M)) < 70%;Total Revenue Commodity Charges (V): Total Revenue Fixed Charges (M): $ 10,769$ 6,285$10,836$6,324Calculate: V / (V + M): 63% 63% B) Use Canadian model.Info Only untill 2011 Info Only untill 2011Agencies signing MOUCanadian <strong>Water</strong> & Wastewater Rate Design ModelUsed and Provided to CUWCCIf Canadian Model is used, was 1 year or 3 yearperiod applied?No NoInfo Only untill 2011 Info Only untill 2011Wastewater Rates 2009 If 'No', then wastewater rate info not<strong>2010</strong>Does Agency Provide Sewer Service? No required.NoCustomer Class 2009 Rate Type Conserving Rate? Customer Class <strong>2010</strong> Rate Type Conserving Rate?Yes YesYes YesYes YesYes YesYes YesYes YesYes YesOn TrackOn Track
4CUWCC BMP RETAIL COVERAGE REPORT 2009-<strong>2010</strong>Foundation Best Management Practices for Urban <strong>Water</strong> EfficiencyBMP 2. EDUCATION PROGRAMSBMP 2.1 Public Outreach Actions Implemented and Reported to CUWCCDoes a wholesale agency implement PublicOutrach Programs for this unility's benefit?Names of Wholesale Agencies2009 <strong>2010</strong>YesYes Yes/NoMetropolitan <strong>Water</strong> District of Los Angeles,Orange County Municipal <strong>Water</strong> DistrictMetropolitan <strong>Water</strong> District of Los Angeles,Orange County Municipal <strong>Water</strong> District1) Contacts with the public (minimum = 4 timesper year)25 252) <strong>Water</strong> supplier contacts with media (minimum = 4 timesper year, i.e., at least quarterly).4 43) An actively maintained website that is updated regularly(minimum = 4 times per year, i.e., at least quarterly).4) Description of materials used to meet minimumrequirement.Newspaper contactsYes YesNewspaper contactsAll 6 action typesimplemented andreported to CUWCC tobe 'On Track')5) Annual budget for public outreach program.$ 3,982$3,9826) Description of all other outreach programsOn Track On Track
4CUWCC BMP RETAIL COVERAGE REPORT 2009-<strong>2010</strong>Foundation Best Management Practices for Urban <strong>Water</strong> Efficiency2.2 School Education Programs Implemented and Reported to CUWCCDoes a wholesale agency implement SchoolEducation Programs for this unility's benefit?Name of Wholesale Supplier?2009 <strong>2010</strong>No NoNo School Education ProgramNo School Education Program1) Curriculum materials developedand/or provided by agency2) Materials meet state education frameworkrequirements and are grade-level appropriate?3) Materials Distributed to K-6?Describe K-6 Materials0Describe materials to meetminimum requirementsMaterials distributed to 7-12 students? Info Only4) Annual budget for school educationprogram.$-0Yes/ NoAll 5 actions types implementedand reported to CUWCC to be 'OnNot On Track Not On Track
Appendix DCPUC <strong>Water</strong> Conservation and Rationing Rules and Regulations
SOUTHERN CALIFORNIA WATER COMPANY Revised Cal. P.U.C. Sheet No. 3742-W630 E. FOOTHILL BLVD. - P. O. BOX 9016SAN DIMAS, CALIFORNIA 91773-9016 Canceling Revised Cal. P.U.C. Sheet No. 3072-WRule No. 11Page 1 of 10DISCONTINUANCE AND RESTORATION OF SERVICEA. Customer’s Request for Discontinuance of Service1. A customer may have service discontinued by giving not less than two day’s advancenotice thereof to the utility. Charges for service may be required to be paid until therequested date of discontinuance or such later date as will provide not less than therequired two days’ advance notice.2. When such notice is not given, the customer will be required to pay for service until twodays after the utility has knowledge that the customer has vacated the premises orotherwise has discontinued water service.B. Discontinuance of Service by Utility1. For Nonpayment of Billsa. Past-Due Bills. When bills are rendered monthly or bimonthly, theywill be considered past due if not paid within 19 days from the dateof mailing. The utility shall allow every residential customer at least19 days from the date of mailing its bill for services, postage prepaid,to make payment of the bill. The utility may not discontinue residentialservice for nonpayment of a delinquent account unless the utility firstgives notice of the delinquency and impeding discontinuance, at least10 days prior to the proposed discontinuance, by means of a noticemailed, postage prepaid, to the customer to whom the service isprovided if different than to whom the service is billed, not earlier than19 days from the date of mailing the utility’s bill for services. The10-day discontinuance of service notice shall not commence untilfive days after the mailing of the notice.(T)b. When a bill for water service has become past due and a 10-daydiscontinuance of residential service notice or a 7-day discontinuanceof residential service notice for nonpayment has been issued, service maybe discontinued if bill is not paid within the time required by such notice.The customer’s service, however, will not be discontinued for nonpaymentuntil the amount of any deposit made to establish credit for that service hasbeen fully absorbed.(Continued)ISSUED BY Date Filed July 29, 1993Advice Letter No. 925-W F. E. WICKS Effective Date September 7, 1993Decision No. President Resolution No. W 3770
SOUTHERN CALIFORNIA WATER COMPANY Revised Cal. P.U.C. Sheet No. 3743-W630 E. FOOTHILL BLVD. - P. O. BOX 9016SAN DIMAS, CALIFORNIA 91773-9016 Canceling Revised Cal. P.U.C. Sheet No. 3073-WRule No. 11Page 2 of 10DISCONTINUANCE AND RESTORATION OF SERVICE(Continued)B. Discontinuance of Services by Utility (Continued)1. For Nonpayment of Bills (Continued)c. Any customer, residential as well as nonresidential, who has initiated a billingcomplaint or requested an investigation within 5 days of receiving a disputed billor who has, before discontinuance of service made a request for extension of thepayment period of a bill asserted to be beyond the means of the customer to payin full within the normal period for payment, shall not have residential water servicediscontinued for nonpayment during the pendency of an investigation by the utilityof such customer complaint or request and shall be given an opportunity for reviewof the complaint, investigation, or request by a review manager of the utility. Thereview shall include consideration of whether a residential customer shall bepermitted to make installment payments on any unpaid balance of the delinquentaccount over a reasonable period of time, not to exceed 12 months. Such serviceshall not be discontinued for nonpayment for any customer complying with aninstallment payment agreement entered into with the utility, provided the customeralso keeps current his account for water service as charges accrue in eachsubsequent billing period. If a residential customer fails to comply with aninstallment payment agreement, the utility will give a 10-day discontinuance ofservice notice before discontinuing such service, but such notice shall not entitlethe customer to further investigation by the utility.d. Any customer whose complaint or request for an investigation pursuant tosubdivision (c) has resulted in an adverse determination by the utility mayappeal the determination to the Commission. Any subsequent appeal of thedispute or complaint to the Commission shall be in accordance with the Commissionadopted Rules of Practice and Procedure.e. Service to a residential water customer will not be discontinued for nonpaymentwhen the customer has previously established to the satisfaction of the utilitythat:(Continued)ISSUED BY Date Filed July 29, 1993Advice Letter No. 925-W F. E. WICKS Effective Date September 7, 1993Decision No. President Resolution No. W 3770
SOUTHERN CALIFORNIA WATER COMPANY Revised Cal. P.U.C. Sheet No. 3744-W630 E. FOOTHILL BLVD. - P. O. BOX 9016SAN DIMAS, CALIFORNIA 91773-9016 Canceling Revised Cal. P.U.C. Sheet No. 3074-WRule No. 11Page 3 of 10DISCONTINUANCE AND RESTORATION OF SERVICE(Continued)B. Discontinuance of Services by Utility (Continued)1. For Nonpayment of Bills (Continued)e. (Continued)(1) The customer is elderly (age 62 or over) or handicapped,* or uponcertification of a licensed physical or surgeon that to discontinue waterwill be life threatening to the customer; and*Proof of age must be supported by certificate of birth, driver’s license,passport or other reliable document. Proof of handicap must be bycertification from a licensed physician, surgeon, public health nurseor social worker.(2) The customer is temporarily unable to pay for such service inaccordance with the provisions of the utility’s tariffs; and(3) The customer is willing to arrange installment payments satisfactory tothe utility, over a period not to exceed 12 months, including arrangementsfor prompt payment of subsequent bills.However, service may be discontinued to any customer who does not complywith an installment payment agreement or keep current his account for waterservice as charges accrue in each subsequent billing period.(f)A customer’s residential service may be discontinued for nonpayment of a billfor residential service previously rendered him at any location served by the utility.A nonresidential service may be discontinued for nonpayment of a bill forresidential as well as nonresidential service previously rendered him atany location served by the utility.The discontinuance of service notice as set forth in subdivision (b) will be givenin both cases stated above before discontinuance of service takes place.(Continued)ISSUED BY Date Filed July 29, 1993Advice Letter No. 925-W F. E. WICKS Effective Date September 7, 1993Decision No. President Resolution No. W 3770
SOUTHERN CALIFORNIA WATER COMPANY Revised Cal. P.U.C. Sheet No. 745-W630 E. FOOTHILL BLVD. P. O. BOX 9016SAN DIMAS, CALIFORNIA 91773-9016 Cancelling Revised Cal. P.U.C. Sheet No. 3075-WRule No. 11Page 4 of 10DISCONTINUANCE AND RESTORATION OF SERVICE(Continued)B. Discontinuance of Services by Utility (Continued)1. For Nonpayment of Bills (Continued)f. (Continued)Residential services will not, however, be discontinued for nonpayment ofbills for separate nonresidential service.g. Service will not be discontinued by reason of delinquency in payment forservice on any Saturday, Sunday, legal holiday, or at any time during whichthe business offices of the utility are not open to the public.h. Where water service is provided to residential users in a multi-unit (T)residential structure, mobilehome park, or permanent residential structuresin a labor camp, where the owner, manager, or operator is listedby the utility as the customer of record, the utility will make every goodfaith effort to inform the users, when the account is in arrears, thatservice will be dicontinued. Notice will be in as prescribed in subdivision(a) above, and in Rules Nos. 5 and 8.(T)(1) Where said users are individually metered. (N)The utility is not required to make service available to these usersunless each user agrees to the terms and conditions of service andmeets the requirement of the law and the utility’s rules and tariffs.However, if one or more users are willing and able to assume responsibilityfor subsequent charges by these users to the account to thesatisfaction of the utility, and if there is a practical physical means,legally available to the utility of selectively providing services to theseusers who have met the requirements of the utility’s rules and tariffs,the utility will make service available to these users. For these selectedusers establishment of credit will be as prescribed in Rule No. 6, exceptthat where prior service for a period of time is a condition for establishingcredit with the utility, proof that is acceptable to the utility ofresidence and prompt payment of rent or other credit obligationduring that period of time is a satisfactory equivalent.(Continued)(N)ISSUED BY Date Filed July 29, 1993Advice Letter No. 925-W F. E. WICKS Effective Date September 7, 1993Decision No. President Resolution No.________
SOUTHERN CALIFORNIA WATER COMPANY Revised Cal. P.U.C. Sheet No. 745-W630 E. FOOTHILL BLVD. P. O. BOX 9016SAN DIMAS, CALIFORNIA 91773-9016 Cancelling Revised Cal. P.U.C. Sheet No. 3075-WISSUED BY Date Filed July 29, 1993Advice Letter No. 925-W F. E. WICKS Effective Date September 7, 1993Decision No. President Resolution No.________
SOUTHERN CALIFORNIA WATER COMPANY Original Cal. P.U.C. Sheet No. 3746-W630 E. FOOTHILL BLVD. - P. O. BOX 9016SAN DIMAS, CALIFORNIA 91773-9016 Canceling Cal. P.U.C. Sheet No. _____Rule No. 11Page 5 of 10DISCONTINUANCE AND RESTORATION OF SERVICE(Continued)B. Discontinuance of Services by Utility (Continued)1. For Nonpayment of Bills (Continued)h. (Continued)(2) Where said users are master metered. (N)The utility is not required to make service available to these usersunless each user agrees to the terms and conditions of service, andmeets the requirements of the law and the utility’s rules and tariffsand the following:The same Rule 11, item B.1.h. (1) above which applies to individuallymetered users also applies to master metered users, except arepresentative may act on the behalf of a master metered user, andthe utility will not discontinue service in any of the following situations:(a)(b)(c)(d)(e)During the pendency of an investigation by the utility of a mastermetercustomer dispute or complaint.When the master-metered customer has been granted an extensionof the period for repayment of a bill.For an indebtedness owned by the master metered customer to anyother person or corporation or when the obligation representedby the delinquent account or any other indebtedness was incurredwith a person or corporation other than the utility demanding paymenttherefor.When a delinquent account relates to another property owned,managed, or operated by the master-metered customer.When a public health or building officer certifies that determinationwould result in a significant threat to the health or safety of theresidential occupants or the public. Proof of age or handicap aredescribed in Rule 11.B.1.e.(N)(Continued)ISSUED BY Date Filed July 29, 1993Advice Letter No. 925-W F. E. WICKS Effective Date September 7, 1993Decision No. President Resolution No. W 3770
SOUTHERN CALIFORNIA WATER COMPANY Revised Cal. P.U.C. Sheet No. 3747-W630 E. FOOTHILL BLVD. - P. O. BOX 9016SAN DIMAS, CALIFORNIA 91773-9016 Canceling Original Cal. P.U.C. Sheet No. 3076-WRule No. 11Page 6 of 10DISCONTINUANCE AND RESTORATION OF SERVICE(Continued)B. Discontinuance of Services by Utility (Continued)1. For Nonpayment of Bills (Continued)i. A reasonable attempt must be made by the utility to personally contactan adult person on the residential customer’s premises either by telephone,or in person, at hours prior to discontinuance. For elderly orhandicapped residential customers, the utility shall provide at least 48hours’ notice by telephone or in person. For these customers, if telephoneor personal contact cannot be made, a notice of discontinuanceof service shall be posted in a conspicuous location at the serviceaddress at least 48 hours prior to discontinuance. Such notice shall beindependent of and in addition to, other notices(s) as may be prescribedin the utility’s tariffs.(C)(N)(N)(N)j. Residential Customer’s Remedies Upon Receipt of Discontinuance Notice.(1) If upon receipt of a 10 day discontinuance notice, a residentialcustomer is unable to pay, he must contact the utility before discontinuanceof service to make payment arrangements to avoid discontinuanceof service.(2) If, after contacting the utility, the residential customer alleges tothe Commission an inability to pay and that he is unable to makepayment arrangements with the utility he should write to theCommission’s Consumer Affairs Branch (CAB) to make an informalcomplaint. This action must be taken within the 10-day discontinuanceof service notice.(3) The CAB’s resolution of the matter will be reported to the utility andthe residential customer within ten business days after receipt of theinformal complaint. If the customer is not satisfied with suchresolution, he must file, within ten business days after the date ofthe CAB’s letter, a formal complaint with the Commission underPublic Utilities Code Section 1702 on a form provided by the CAB.(Continued)ISSUED BYDate Filed _____July 29, 1993____Advice Letter No. 925-W F. E. WICKS Effective Date __September 7, 1993____Decision No. President Resolution No.______W 3770 ______
SOUTHERN CALIFORNIA WATER COMPANY Revised Cal. P.U.C. Sheet No. 3748-W630 E. FOOTHILL BLVD. - P. O. BOX 9016SAN DIMAS, CALIFORNIA 91773-9016 Canceling Original Cal. P.U.C. Sheet No. 3077-WRule No. 11Page 7 of 10DISCONTINUANCE AND RESTORATION OF SERVICE(Continued)B. Discontinuance of Services by Utility (Continued)1. For Nonpayment of Bills (Continued)j. Residential Customer’s Remedies Upon Receipt of Discontinuance Notice.(4) Failure of the residential as well as the nonresidential customer to observethese time limits shall entitle the utility to insist upon payment or, upon failureto pay, to discontinue the customer’s service.k. Designation of a Third-Party Representative (Elderly or Handicapped only)(1) Customer must inform utility if he desires that a third party receivediscontinuance or other notices on his behalf.(2) Utility must be advised of name, address and telephone number of thirdparty with a letter from third party accepting this responsibility.(3) Only customers who certify that they are elderly or handicapped are entitledto third-party representation.*2. For Noncompliance with RulesThe utility may discontinue service to any customer for violation of these rules after it hasgiven the customer at least five days’ written notice of such intention. Where safety ofwater supply is endangered, service may be discontinued immediately without notice.3. For Waste of <strong>Water</strong>a. Where negligent or wasteful use of water exists on customer’s premises, the utilitymay discontinue the service if such practices are not remedied within five days afterit has given the customer written notice to such effect.(Continued)* Proof of age must be supported by certificate of birth, driver’s license, passportor other reliable document. Proof of handicap must be by certification from alicensed physician, public health nurse or social worker.ISSUED BY Date Filed July 29,1993Advice Letter No. 925-W F. E. WICKS Effective Date September 7, 1993Decision No. President Resolution No. W 3770
SOUTHERN CALIFORNIA WATER COMPANY Revised Cal. P.U.C. Sheet No. 3748-W630 E. FOOTHILL BLVD. - P. O. BOX 9016SAN DIMAS, CALIFORNIA 91773-9016 Canceling Original Cal. P.U.C. Sheet No. 3077-WISSUED BY Date Filed July 29,1993Advice Letter No. 925-W F. E. WICKS Effective Date September 7, 1993Decision No. President Resolution No. W 3770
SOUTHERN CALIFORNIA WATER COMPANY Revised Cal. P.U.C. Sheet No. 4804-W630 E. FOOTHILL BLVD. - P. O. BOX 9016SAN DIMAS, CALIFORNIA 91773-9016 Canceling Revised Cal. P.U.C. Sheet No. 3749-WRule No. 11Page 8 of 10B. Continuance of Services by Utility (Continued)3. For Waste of <strong>Water</strong> (Continued)DISCONTINUANCE AND RESTORATION OF SERVICE(Continued)b. In order to protect itself against serious and unnecessary waste or misuse ofwater, the utility may meter any flat rate service and apply the regularly establishedmeter rates where the customer continues to misuse or waste water beyond five daysafter the utility has given the customer written notice to remedy such practices.4. For Unsafe Apparatus or Where Service is Detrimental or Damaging to the Utility or itsCustomersIf an unsafe or hazardous condition is found to exist on the customer’s premise, or if theuse of water thereon by apparatus, appliances, equipment or otherwise is found to bedetrimental or damaging to the utility or its customers, the service may be shutoff withoutnotice. The utility will notify the customer immediately of the reasons for the discontinuanceand the corrective action to be taken by the customer before service can be restored.5. For Fraudulent Use of ServiceWhen the utility has discovered that a customer has obtained service by fraudulent means,or has diverted the water service for unauthorized use, the service to that customermay be discontinued without notice. The utility will not restore service to such customer untilthat customer has complied with all filed rules and reasonable requirements of the utilityand the utility has been reimbursed for the full amount of the service rendered and the actualcost to the utility incurred by reason of the fraudulent use.C. Restoration of Service1. Reconnection ChargeWhere service has been discontinued for violation of these rules or for nonpayment of bills,the utility may charge $25.00 for reconnection of service during regular working hours or $37.50(I)for reconnection of service at other than regular working hours when the customer hasrequested that the reconnection be made at other than regular working hours.(Continued)ISSUED BY Date Filed August 12, 2004Advice Letter No. 1173-W F. E. WICKS Effective Date September 21, 2004Decision No. 04-03-039 President Resolution No._____________
SOUTHERN CALIFORNIA WATER COMPANY Revised Cal. P.U.C. Sheet No. 3750-W630 E. FOOTHILL BLVD. - P. O. BOX 9016SAN DIMAS, CALIFORNIA 91773-9016 Canceling Original Cal. P.U.C. Sheet No. _3080-WRule No. 11Page 9 of 10C. Restoration of Service (Continued)DISCONTINUANCE AND RESTORATION OF SERVICE(Continued)2. To be Made During Regular Working HoursThe utility will endeavor to make reconnections during regular working hours on the dayof the request, if the conditions permit; otherwise reconnections will be made on the regularworking day following the day the request is made.3. To Be Made at Other Than Regular Working HoursWhen a customer has requested that the reconnection be made at other than regularworking hours, the utility will reasonably endeavor to so make the reconnection if practicableunder the circumstances.4. Wrongful DiscontinuanceD. Refusal to ServeA service wrongfully discontinued by the utility, must be restored without charge for therestoration to the customer within 24 hours.1 Conditions for RefusalThe utility may refuse to serve an applicant for service under the following conditions:a. If the applicant fails to comply with any of the rules as filed with the PublicUtilities Commission.b. If the intended use of the service is of such a nature that it will be detrimental orinjurious to existing customers.c. If, in the judgment of the utility, the applicant’s installation for utilizing theservice is unsafe or hazardous, or of such nature that satisfactory servicecannot be rendered.(Continued)ISSUED BY Date Filed July 29, 1993Advice Letter No. 925-W F. E. WICKS Effective Date September 7, 1993Decision No. President Resolution No. W 3770
SOUTHERN CALIFORNIA WATER COMPANY Revised Cal. P.U.C. Sheet No. 3751-W630 E. FOOTHILL BLVD. - P. O. BOX 9016SAN DIMAS, CALIFORNIA 91773-9016 Canceling Original Cal. P.U.C. Sheet No. _3080-WRule No. 11Page 10 of 10DISCONTINUANCE AND RESTORATION OF SERVICE(Continued)C. Restoration of Service (Continued)1. Conditions for Refusal (Continued)d. Where service has been discontinued for fraudulent use, the utility will not serve anapplicant until it has determined that all conditions of fraudulent use or practicehas been corrected.2. Notification to CustomersWhen an applicant is refused service under the provisions of this rule, the utility willnotify the applicant promptly of the reason for the refusal to service and of the right ofapplicant to appeal the utility’s decision to the Public Utilities Commission.ISSUED BY Date Filed July 29, 1993Advice Letter No. 925-W F. E. WICKS Effective Date September 7, 1993Decision No. President Resolution No. W 3770
GOLDEN STATE WATER COMPANY Revised Cal. P.U.C. Sheet No. 5578-W630 E. FOOTHILL BLVD. P. O. BOX 9016SAN DIMAS, CALIFORNIA 91773-9016 Canceling Revised Cal. P.U.C. Sheet No. 4786-W*RULE 14.1WATER CONSERVATION AND RATIONING PLANGENERAL INFORMATION1. If water supplies are projected to be insufficient to meet normal customer demand,and are beyond the control of the utility, the utility may elect to implement voluntaryconservation using the portion of this plan set forth in Section A of this Rule, afternotifying the Director of the Commission's Division of <strong>Water</strong> and Audits of its intent,via a letter in both hard-copy and e-mailed formats.2. Prior to declaration of mandatory rationing, a utility may request authorization of aSchedule 14.1 – Staged Mandatory <strong>Water</strong> Conservation and Rationing tariff, via aTier 2 advice letter.3. If, in the opinion of the utility, more stringent water measures are required, theutility shall request Commission authorization to implement the staged mandatoryconservation and rationing measures set forth in Sections B through E.4. The utility shall file a Tier 1 advice letter to request activation of a particular stageof Schedule 14.1 – Staged Mandatory <strong>Water</strong> Conservation and Rationing tariff.a. If a Declaration of Mandatory Rationing is made by utility or governingagency, orb. If the utility is unable to address voluntary conservation levels set by itself,supplier, or governing agency, orc. If the utility chooses to subsequently activate a different stage5. When Schedule 14.1 is in effect and the utility determines that water supplies areagain sufficient to meet normal demands, and mandatory conservation and rationingmeasures are no longer necessary, the utility shall seek Commission approval via aTier 1 advice letter to de-activate the particular stage of mandatory rationing that hadbeen authorized.(Continued)Page 1(N)(N)ISSUED BY Date Filed June 22, 2009Advice Letter No.1325-WA R. J. SPROWLS Effective Date June 20, 2009Decision No. _________ President Resolution No._________
GOLDEN STATE WATER COMPANY Revised Cal. P.U.C. Sheet No. 5579-W630 E. FOOTHILL BLVD. P. O. BOX 9016SAN DIMAS, CALIFORNIA 91773-9016 Canceling Revised Cal. P.U.C. Sheet No. 4787-W*RULE 14.1WATER CONSERVATION AND RATIONING PLANGENERAL INFORMATION (Continued)Page 2(N)6. In the event of a water supply shortage requiring a voluntary or mandatoryprogram, the utility shall make available to its customers water conservation kitsas required by its version of Rule 20. The utility shall notify all customers of theavailability of conservation kits via a bill insert or direct mailers.A. CONSERVATION - NON-ESSENTIAL OR UNAUTHORIZED WATER USENo customer shall use utility-supplied water for non-essential or unauthorized uses,including but not limited to:1. Use of potable water for more than minimal landscaping, as defined in thelandscaping regulated of the jurisdiction or as described in Article 10.8 of theCalifornia Government Code in connection with new construction;2. Use through any meter when the company has notified the customer in writing torepair a broken or defective plumbing, sprinkler, watering or irrigation system andthe customer has failed to effect such repairs within five business days;3. Use of potable water which results in flooding or runoff in gutters or streets;4. Individual private washing of cars with a hose except with the use of a positiveaction shut-off nozzle. Use of potable water for washing commercial aircraft, cars,buses, boats, trailers, or other commercial vehicles at any time, except at commercialor fleet vehicle or boat washing facilities operated at a fixed location whereequipment using water is properly maintained to avoid wasteful use;5. Use of potable water washing buildings, structures, , driveways, patios, parking lots,tennis courts, or other hard-surfaced areas, except in the cases where health andsafety are at risk;6. Use of potable water to irrigate turf, lawns, gardens, or ornamental landscaping by meansother than drip irrigation, or hand watering without quick acting positive action shut-offnozzles, on a specific schedule, for example: 1) before 8:00 a.m. and after 7:00 p.m.; 2)every other day; or 3) selected days of the week; (N)(Continued)ISSUED BY Date Filed June 22, 2009Advice Letter No.1325-WA R. J. SPROWLS Effective Date June 20, 2009Decision No. _________ President Resolution No.________
GOLDEN STATE WATER COMPANY Revised Cal. P.U.C. Sheet No. 5580-W630 E. FOOTHILL BLVD. P. O. BOX 9016SAN DIMAS, CALIFORNIA 91773-9016 Canceling Revised Cal. P.U.C. Sheet No. 4788-W*RULE 14.1WATER CONSERVATION AND RATIONING PLANGENERAL INFORMATION (Continued)7. Use of potable water for watering streets with trucks, except for initial wash-downfor construction purposes (if street sweeping is not feasible), or to protect thehealth and safety of the public;8. Use of potable water for construction purposes, such as consolidation of backfill,dust control, or other uses unless no other source of water or other method can beused.9. Use of potable water for construction purposes unless no other source of water orother method can be used;10. Use of potable water for street cleaning;11. Operation of commercial car washes without recycling at least 50% of the potablewater used per cycle;12. Use of potable water for watering outside plants, lawn, landscape and turf areasduring certain hours if and when specified in Schedule No. 14.1 when theschedule is in effect;13. Use of potable water for decorative fountains or the filling or topping off ofdecorative lakes or ponds. Exceptions are made for those decorative fountains,lakes, or ponds which utilize recycled water;14. Use of potable water for the filling or refilling of swimming pools.15. Service of water by any restaurant except upon the request of a patron; and16. Use of potable water to flush hydrants, except where required for public health orsafety.B. STAGED MANDATORY RATIONING OF WATER USAGEPage 3(N)1. Prior to declaration of mandatory rationing, a utility may request authorization of aSchedule 14.1 – Staged Mandatory <strong>Water</strong> Conservation and Rationing tariff, via a Tier 2advice letter, with full justification. The utility may not institute Schedule 14.1 until ithas been authorized to do so by the Commission.(Continued)(N)ISSUED BY Date Filed June 22, 2009Advice Letter No.1325-WA R. J. SPROWLS Effective Date June 20, 2009Decision No. _________ President Resolution No.________
GOLDEN STATE WATER COMPANY Revised Cal. P.U.C. Sheet No. 5581-W630 E. FOOTHILL BLVD. P. O. BOX 9016SAN DIMAS, CALIFORNIA 91773-9016 Canceling Revised Cal. P.U.C. Sheet No. 4789-W*RULE 14.1WATER CONSERVATION AND RATIONING PLANPage 4STAGED MANDATORY RATIONING OF WATER USAGE (Continued)(N)a. A staged Schedule 14.1 that has been authorized by the Commission shallremain dormant until triggered by specific conditions detailed in theSchedule 14.1 tariff and utility has requested and received authorization foractivating a stage by Commission.b. Notice of the Tier 2 advice letter (example shown in Appendix C) andassociated public participation hearing shall be provided to customersunder General Order (GO) 96-B rules.c. Utility shall comply with all requirements of Sections 350-358 of theCalifornia <strong>Water</strong> Code.d. The Tier 2 advice letter requesting institution of a Schedule 14.1 shallinclude but not be limited to:i. Proposed Schedule 14.1 tariff, which shall include but not be limitedto:1. Applicability,2. Territory applicable to,3. A detailed description of each Stage of Rationing,4. A detailed description of the Trigger that Activates each Stageof Rationing,5. A detailed description of each water use restriction for eachstage of rationing.6. <strong>Water</strong> use violation levels, written warning levels, associatedfines, and exception procedures,(Continued)(N)ISSUED BY Date Filed June 22, 2009Advice Letter No.1325-WA R. J. SPROWLS Effective Date June 20, 2009Decision No. _________ President Resolution No.________
GOLDEN STATE WATER COMPANY Original Cal. P.U.C. Sheet No. 5582-W630 E. FOOTHILL BLVD. P. O. BOX 9016SAN DIMAS, CALIFORNIA 91773-9016 Canceling _______ Cal. P.U.C. Sheet No. ______RULE 14.1WATER CONSERVATION AND RATIONING PLANSTAGED MANDATORY RATIONING OF WATER USAGE (Continued) Page 57. Conditions for installation of a flow restrictor, (N)8. Charges for removal of flow restrictors, and9. Special Conditionsii. Justification for, and documentation and calculations in support ofplan, including but not limited to each item in B.1.d.i above.2. Number of Stages requested by each utility/district may vary, depending on specificsof water shortage event.3. The utility shall file a Tier 1 advice letter to request activation of a particular stage ofSchedule 14.1 – Staged Mandatory <strong>Water</strong> Conservation and Rationing tariff.a. If a Declaration of Mandatory Rationing is made by utility or governingagency,b. If the utility is unable to address voluntary conservation levels set by itself orgoverning agency, orc. If the utility chooses to subsequently activate a different stage.d. The Tier 1 advice letter requesting activation of a Schedule 14.1 shall includebut not be limited to:i. Justification for activating this particular stage of mandatory rationing,as well as period during which this particular stage of mandatoryconservation and rationing measures will be in effect.ii. When the utility requests activation of a particular Stage, it shall notifyits customers as detailed in Section E, below.4. All monies collected by the utility through water use violation fines shall not beaccounted for as income.5. All expenses incurred by utility to implement Rule 14.1 and Schedule 14.1 that have notbeen considered in a General Rate Case or other proceeding, shall be recoverable byutility if determined to be reasonable by Commission.(N)(Continued)ISSUED BY Date Filed June 22, 2009Advice Letter No.1325-WA R. J. SPROWLS Effective Date June 20, 2009Decision No. _________ President Resolution No.________
GOLDEN STATE WATER COMPANY Original Cal. P.U.C. Sheet No. 5583-W630 E. FOOTHILL BLVD. P. O. BOX 9016SAN DIMAS, CALIFORNIA 91773-9016 Canceling _______ Cal. P.U.C. Sheet No. ______RULE 14.1WATER CONSERVATION AND RATIONING PLANSTAGED MANDATORY RATIONING OF WATER USAGE (Continued) Page 6a. These monies shall be accumulated by the utility in a separate memorandumaccount for disposition as directed or authorized from time to time by theCommission.(N)C. ENFORCEMENT OF STAGED MANDATORY CONSERVATION AND RATIONING1. The water use restrictions of the conservation program, in Section A of this rule,become mandatory when the authorized Schedule 14.1-Staged Mandatory RationingProgram is triggered, the utility files a Tier 1 advice letter requesting activation of aparticular stage, and authorization is received from the Commission.a. In the event a customer is observed to be using water for any nonessential orunauthorized use as defined in Section A of this rule, the utility may charge awater use violation fine in accordance with Schedule No. 14.1.2. The utility may, after one written warning and one non-essential or unauthorized useviolation notice , install a flow-restricting device on the service line of any customerobserved by utility personnel to be using water for any non-essential or unauthorizeduse as defined in Section A above.3. A flow restrictor shall not restrict water delivery by greater than 50% of normal flow.The restricting device may be removed only by the utility, only after a three-day periodhas elapsed, and only upon payment of the appropriate removal charge as set forth inSchedule No. 14.1.4. After the removal of the restricting device, if any non-essential or unauthorized use ofwater shall continue, the utility may install another flow-restricting device. This deviceshall remain in place until water supply conditions warrant its removal and until theappropriate charge for removal has been paid to the utility.5. Any tampering with flow restricting device by customer can result in fines ordiscontinuation of water use at the utility’s discretion.(Continued)(N)ISSUED BY Date Filed June 22, 2009Advice Letter No.1325-WA R. J. SPROWLS Effective Date June 20, 2009Decision No. _________ President Resolution No.________
GOLDEN STATE WATER COMPANY Original Cal. P.U.C. Sheet No. 5584-W630 E. FOOTHILL BLVD. P. O. BOX 9016SAN DIMAS, CALIFORNIA 91773-9016 Canceling _______ Cal. P.U.C. Sheet No. ______RULE 14.1WATER CONSERVATION AND RATIONING PLANENFORCEMENT OF STAGED MANDATORY CONSERVATION AND RATIONING(Continued) Page 7(N)6. If, despite installation of such flow-restricting device pursuant to the provisions ofthe previous enforcement conditions, any such non-essential or unauthorized use ofwater shall continue, then the utility may discontinue water service to such customer.In such latter event, a charge as provided in Rule No. 11 shall be paid to the utility asa condition to restoration of service.7. All monies collected by the utility through water use violation fines shall not beaccounted for as income. All expenses incurred by utility to implement Rule 14.1and Schedule 14.1 that have not been considered in a General Rate Case or otherproceeding, shall be recoverable by utility if determined to be reasonable byCommission. These additional monies shall be accumulated by the utility in aseparate memorandum account for disposition as directed or authorized from time totime by the Commission.8. The charge for removal of a flow-restricting device shall be in accordance withSchedule No. 14.1.D. APPEAL PROCEDURE1. Any customer who seeks a variance from any of the provisions of this waterconservation and rationing plan shall notify the utility in writing, explaining in detailthe reason for such a variation. The utility shall respond to each such request inwriting.2. Any customer not satisfied with the utility's response may file an appeal with thestaff of the Commission. The customer and the utility will be notified of thedisposition of such appeal by letter from the Executive Director of the Commission.(Continued)(N)ISSUED BY Date Filed June 22, 2009Advice Letter No.1325-WA R. J. SPROWLS Effective Date June 20, 2009Decision No. _________ President Resolution No.________
GOLDEN STATE WATER COMPANY Original Cal. P.U.C. Sheet No. 5585-W630 E. FOOTHILL BLVD. P. O. BOX 9016SAN DIMAS, CALIFORNIA 91773-9016 Canceling _______ Cal. P.U.C. Sheet No. ______RULE 14.1WATER CONSERVATION AND RATIONING PLANAPPEAL PROCEDURE (Continued) Page 8(N)3. If the customer disagrees with such disposition, the customer shall have the right tofile a formal complaint with the Commission. Except as set forth in this Section,no person shall have any right or claim in law or in equity, against the utilitybecause of, or as a result of, any matter or thing done or threatened to be donepursuant to the provisions of this water conservation and rationing plan.E. PUBLICITY1. As stated under Section B.1.b and c, when a utility requests authorization of aSchedule 14.1 – Staged Mandatory <strong>Water</strong> Conservation and Rationing tariff, via aTier 2 advice letter, it shall provide notice of the Tier 2 advice letter (exampleshown in Attachment C) and associated public meeting provided to customers,under General Order (GO) 96-B rules, and shall comply with all requirements ofSections 350-358 of the California <strong>Water</strong> Code (CWC), including but not limitedto the following:a. In order to be in compliance with both the GO and CWC, the utility shallprovide notice via both newspaper and bill insert/direct mailing.b. Utility shall file one notice for each advice letter filed, that includes bothnotice of the filing of the Tier 2 advice letter as well as the details of thepublic meeting (date, time, place, etc).c. The public meeting shall be held after the utility files the Tier 2 adviceletter, and before the Commission authorizes implementation of the tariff.d. Utility shall consult with Division of <strong>Water</strong> and Audits staff prior to filingadvice letter, in order to determine details of public meeting.2. In the event that a Schedule 14.1-Staged Mandatory Rationing Plan is triggered,and an utility requests activation through the filing of a Tier 1 advice letter, theutility shall notify its customers and provide each customer with a copy ofSchedule 14.1 by means of bill insert or direct mailing. Notification shall takeplace prior to imposing any fines associated with this plan.(N)(Continued)ISSUED BY Date Filed June 22, 2009Advice Letter No.1325-WA R. J. SPROWLS Effective Date June 20, 2009Decision No. _________ President Resolution No.________
GOLDEN STATE WATER COMPANY Original Cal. P.U.C. Sheet No. 5586-W630 E. FOOTHILL BLVD. P. O. BOX 9016SAN DIMAS, CALIFORNIA 91773-9016 Canceling _______ Cal. P.U.C. Sheet No. ______RULE 14.1WATER CONSERVATION AND RATIONING PLANPUBLICITY (Continued) Page 9(N)3. During the period that a stage of Schedule 14.1 is activated, the utility shall providecustomers with updates in at least every other bill, regarding its water supply statusand the results of customers' conservation efforts.(N)ISSUED BY Date Filed June 22, 2009Advice Letter No.1325-WA R. J. SPROWLS Effective Date June 20, 2009Decision No. _________ President Resolution No.________
SOUTHERN CALIFORNIA WATER COMPANY Revised Cal. P.U.C. Sheet No. 1772-W3625 WEST SIXTH STREETLOS ANGELES, CALIFORNIA 90020 Canceling Original Cal. P.U.C. Sheet No. 808-WRule No. 20WATER CONSERVATION(N)A. PurposeThe purpose of this rule is to ensure that water resources available to the utilityare put to a reasonable beneficial use and that the benefits of the utility’s waterwater supply and service extend to the largest number of persons.B. Waste of <strong>Water</strong> DiscouragedRefer to Rule 11 B. (3).C. Use of <strong>Water</strong>-Saving Devices and PracticesEach customer of the utility is urged to install devices to reduce the quantity ofwater to flush toilets and to reduce the flow rate of showers.Each customer is further urged to adopt such other water usage and reusagepractices and procedures as are feasible and reasonable.D. <strong>Water</strong>-Saving KitsThe utility will make available, without initial cost to the customer, for use in eachresidence receiving water service from the utility, a water-saving kit containing thefollowing:(1) A device or devices for reducing toilet flush water requirements;(2) A device or devices for reducing shower flow rates;(3) A dye tablet or tablets for determining if a toilet tank leaks;(4) Other devices from time to time approved by the utility;(5) Installation and other instructions and information pertinent toconservation of water.(N)ISSUED BY Date Filed June 12, 1978Advice Letter No. 521-W W. W. FRANKLIN Effective Date July 12, 1978Decision No.88466 President Resolution No.________
Appendix EDMM Supporting Documents
GOLDEN STATE WATER COMPANY Revised Cal. P.U.C. Sheet No. 6014-W630 EAST FOOTHILL BOULEVARD P.O. BOX 9016SAN DIMAS, CA 91773-9016 Canceling Revised Cal. P.U.C. Sheet No. 5962-WSchedule No. R3-1-RRegion 3 Customer Service AreasRESIDENTIAL METERED SERVICEAPPLICABILITYApplicable to all residential metered water services provided to single-family residential customers.TERRITORYBarstow and vicinity, <strong>San</strong> Bernardino County, the City of Claremont, portions of Montclair, Pomona, Upland, within thearea north of Thompson Creek and the Padua Hills Service Area, and adjacent unincorporated territory in Los Angeles and<strong>San</strong> Bernardino Counties, the City of Calipatria and community of Niland, and the adjacent territory in Imperial County, thevicinity of Victorville and Lucerne, <strong>San</strong> Bernardino County, all or portions of the Cities of Cypress, La Palma, Los Alamitos,Placentia, Seal Beach, Stanton, Yorba-Linda and vicinity, Cowan Heights, Orange County; <strong>San</strong> <strong>Dimas</strong>, Charter Oak andvicinity, Los Angeles County; and portions of the Cities of Arcadia, El Monte, Irwindale, Monrovia, Monterey Park, Rosemead,<strong>San</strong> Gabriel, Temple City and vicinity, Los Angeles County.RATESQuantity Rate:First 1,300 cu. Ft., per 100 cu. ft......................................... $ 2.673Next 800 cu. Ft., per 100 cu. ft............................................ $ 3.074Over 2,100 cu. Ft., per 100 cu. ft......................................... $ 3.535Per MeterService Charges:Per MonthFor 5/8 x 3/4-inch meter.......................................................... $ 15.15For 3/4-inch meter.......................................................... 22.70For 1-inch meter........................................................... 37.80For 1 1/2 inch meter........................................................... 75.65For 2-inch meter........................................................... 121.00For 3-inch meter........................................................... 227.00For 4-inch meter........................................................... 378.00For 6-inch meter........................................................... 756.00For 8-inch meter........................................................... 1,210.00For 10-inch meter.......................................................... 1,739.00Sprinkler <strong>System</strong> Services $16.65The Service Charge is a readiness-to-serve charge applicable to all metered service and to which is added thecharge for water used computed at the Quantity Rate.SPECIAL CONDITIONS1. All bills are subject to the reimbursement fee set forth on Schedule No. UF.2. Residential customers are defined as all single family customers with one dwelling unit that are individually metered.3. As authorized by the California Public Utilities Commission, an amount of $0.156 per Ccf for Tier 1, $0.180 per Ccf for Tier 2 and$0.207 per Ccf for Tier 3 is to be added to the Quantity Rate for a period of 24 months, beginning on the effective date of AdviceLetter 1381-W, which is March 21, <strong>2010</strong>. This surcharge will apply to all customers covered by the WRAM in 2009 which includesmetered customers in Barstow, Claremont, <strong>San</strong> Gabriel, Los Alamitos, Placentia, <strong>San</strong> <strong>Dimas</strong> and Calipatria customers who were billedat the metered rate as of December 31, 20094. As authorized by the California Public Utilities Commission, an amount of $0.0735 per Ccf for Tier 1, $0.0845 per Ccf for Tier 2and $0.0972 per Ccf for Tier 3 is to be added to the Quantity Rate for a period of 12 months, beginning on the effective date ofAdvice Letter 1401-W, which is June 7, <strong>2010</strong>. This surcharge will recover the undercollection in the CARW Balancing Account, as ofDecember 31, 2009.5. Pursuant to Decision 10-11-035, a surcharge of $0.0035 per Ccf will be applied to all metered customers bills excluding customersthat are receiving the CARW credit, beginning on the effective date of Advice Letter 1417-W. This surcharge will offset the CARWcredits and CARW administrative program costs recorded in the CARW Balancing Account.6. As authorized by the California Public Utilities Commission in D. 10-11-035, an amount of $0.20214 per Ccf is to be added to theQuantity Rate for a period of 24 months, beginning on January 1, 2011. This surcharge recovers the difference between the interimrates and final rates for the period of January 1, <strong>2010</strong> through December 1, <strong>2010</strong>.7. As authorized by the California Public Utilities Commission, an amount of $0.0053 per Ccf for Tier 1 and $0.0061 per Ccf (N)for Tier 2 is to be added to the Quantity Rate for a period of 12 months, beginning on the effective date of Advice Letter(N)1408-WA. This surcharge will recover the undercollection in the Orange County Annexation Memorandum Account, as of March (N)31, <strong>2010</strong>. (N)ISSUED BY Date Filed: January 20, 2011Advice Letter No. 1408-WA R. J. SPROWLS Effective Date: January 25, 2011Decision No. _____________ President Resolution No.W-4862
GOLDEN STATE WATER COMPANY Revised Cal. P.U.C. Sheet No. 6015-W630 EAST FOOTHILL BOULEVARD P.O. BOX 9016SAN DIMAS, CA 91773-9016 Canceling Revised Cal. P.U.C. Sheet No. 5963-WSchedule No. R3-1-NRRegion 3 Customer Service AreasNON-RESIDENTIAL METERED SERVICEAPPLICABILITYApplicable to all metered water service except those covered under R3-1-R.TERRITORYBarstow and vicinity, <strong>San</strong> Bernardino County, the City of Claremont, portions of Montclair, Pomona, Upland, within the areanorth of Thompson Creek and the Padua Hills Service Area, and adjacent unincorporated territory in Los Angeles and <strong>San</strong>Bernardino Counties, the City of Calipatria and community of Niland, and the adjacent territory in Imperial County, thevicinity of Victorville and Lucerne, <strong>San</strong> Bernardino County, all or portions of the Cities of Cypress, La Palma, Los Alamitos,Placentia, Seal Beach, Stanton, Yorba-Linda and vicinity, Cowan Heights, Orange County; <strong>San</strong> <strong>Dimas</strong>, Charter Oak andvicinity, Los Angeles County; and portions of the Cities of Arcadia, El Monte, Irwindale, Monrovia, Monterey Park, Rosemead,<strong>San</strong> Gabriel, Temple City and vicinity, Los Angeles County.RATESQuantity Rate:For all water delivered, per 100 cu. ft......................................... $ 2.489Per MeterService Charges:Per MonthFor 5/8 x 3/4-inch meter.......................................................... $ 21.45For 3/4-inch meter.......................................................... 32.15For 1-inch meter........................................................... 53.55For 1 1/2 inch meter........................................................... 107.00For 2-inch meter........................................................... 171.00For 3-inch meter........................................................... 321.00For 4-inch meter........................................................... 536.00For 6-inch meter........................................................... 1,071.00For 8-inch meter........................................................... 1,714.00For 10-inch meter.......................................................... 2,464.00The Service Charge is a readiness-to-serve charge applicable to all metered serviceand to which is added the charge for water used computed at the Quantity Rate.SPECIAL CONDITIONS1. All bills are subject to the reimbursement fee set forth on Schedule No. UF.2. As authorized by the California Public Utilities Commission, an amount of $0.154 per Ccf is to be added to the Quantity Rate for aperiod of 24 months, beginning on the effective date of Advice Letter 1381-W, which is March 21, <strong>2010</strong>. This surcharge will apply toall customers covered by the WRAM in 2009 which includes metered customers in Barstow, Claremont, <strong>San</strong> Gabriel, Los Alamitos,Placentia, <strong>San</strong> <strong>Dimas</strong> and Calipatria customers who were billed at the metered rate as of December 31, 2009.3. As authorized by the California Public Utilities Commission, an amount of $0.06879 per Ccf is to be added to the Quantity Ratefor a period of 12 months, beginning on the effective date of Advice Letter 1401-W, which is June 7, <strong>2010</strong>. This surcharge willrecover the undercollection in the CARW Balancing Account, as of December 31, 2009.4. Pursuant to Decision 10-11-035, a surcharge of $0.0035 per Ccf will be applied to all metered customers bills excluding customersthat are receiving the CARW credit, beginning on the effective date of Advice Letter 1417-W. This surcharge will offset the CARWcredits and CARW administrative program costs recorded in the CARW Balancing Account.5. As authorized by the California Public Utilities Commission in D. 10-11-035, an amount of $0.20214 per Ccf is to be added to theQuantity Rate for a period of 24 months, beginning on January 1, 2011. This surcharge recovers the difference between the interimrates and final rates for the period of January 1, <strong>2010</strong> through December 1, <strong>2010</strong>.6. As authorized by the California Public Utilities Commission, an amount of $0.0047 per Ccf is to be added to the Quantity Rate (N)for a period of 12 months, beginning on the effective date of Advice Letter 1408-WA. This surcharge will recover the (N)undercollection in the Orange County Annexation Memorandum Account, as of March 31, <strong>2010</strong>.(N)ISSUED BY Date Filed: January 20, 2011Advice Letter No. 1408-WA R. J. SPROWLS Effective Date: January 25, 2011Decision No. _____________ President Resolution No.W-4862
AWWA WLCC <strong>Water</strong> Audit Software: Reporting WorksheetCopyright © 2006, American <strong>Water</strong> Works Association. All Rights Reserved.WASv3.0Back to Instructions? Click to access definition<strong>Water</strong> Audit Report for: <strong>Golden</strong> <strong>State</strong> <strong>Water</strong> <strong>Company</strong> - <strong>San</strong> <strong>Dimas</strong>Reporting Year: 2008Please enter data in the white cells below. Where possible, metered values should be used; if metered values are unavailable please estimate a value. Indicate this by selectinga choice from the gray box to the left, where M = measured (or accurately known value) and E = estimated.All volumes to be entered as: ACRE-FEET PER YEARWATER SUPPLIEDVolume from own sources: ? M 5,368.000 acre-ft/yrMaster meter error adjustment: ? E 0.000 under-registered acre-ft/yr<strong>Water</strong> imported: ? M 8,651.000 acre-ft/yr<strong>Water</strong> exported: ?.0.000 acre-ft/yrWATER SUPPLIED: 14,019.000 acre-ft/yr.AUTHORIZED CONSUMPTION .Click here: ?Billed metered: ? M 13,782.000 acre-ft/yrfor help using optionBilled unmetered: ? 0.000 acre-ft/yrbuttons belowUnbilled metered: ? E 5.000 acre-ft/yr Pcnt: Value:Unbilled unmetered: ?.175.238 acre-ft/yr 1.25%AUTHORIZED CONSUMPTION: . 13,962.238 acre-ft/yr.WATER LOSSES (<strong>Water</strong> Supplied - Authorized Consumption) .56.763 acre-ft/yrApparent Losses . Pcnt: Value:Unauthorized consumption: ? 35.048 acre-ft/yr 0.25%Customer metering inaccuracies: ? 0.000 acre-ft/yr 2.00%<strong>System</strong>atic data handling errors: ? 0.000 acre-ft/yrApparent Losses: . 35.048 acre-ft/yrReal Losses .Real Losses = (<strong>Water</strong> Losses - Apparent Losses): .21.715 acre-ft/yrWATER LOSSES: 56.763 acre-ft/yr..NON-REVENUE WATER .NON-REVENUE WATER: . 237.000 acre-ft/yr.Use buttons to selectpercentageORvalueSYSTEM DATA . Length of mains: ? 221.6 milesNumber of active AND inactive service connections: ? 16,366Connection density: . 74 conn./mile mainAverage length of customer service line: ? E 25.0 ft.Average operating pressure: ? 82.0 psi(pipe length between curbstop and customermeter or property boundary)COST DATA . Total annual cost of operating water system: ? $12,035,622 $/YearCustomer retail unit cost (applied to Apparent Losses): ? $46.46 $/100 cubic feet (ccf)Variable production cost (applied to Real Losses): ? $536.00 $/acre-ft/yrDATA REVIEW - Please review the following information and make changes above if necessary:- Input values should be indicated as either measured or estimated. You have entered:3 as measured values3 as estimated values2 as default values10 without specifying measured, estimated or default- <strong>Water</strong> Supplied Data: No problems identified- Unbilled unmetered consumption: No problems identified- Unauthorized consumption: No problems identified- It is important to accurately measure the master meter - you have entered the measurement type as: measured- Cost Data: No problems identified.PERFORMANCE INDICATORSFinancial IndicatorsOperational Efficiency IndicatorsNon-revenue water as percent by volume: 1.7%Non-revenue water as percent by cost: 6.8%Annual cost of Apparent Losses: $709,290Annual cost of Real Losses: $11,639Apparent Losses per service connection per day:1.91 gallons/connection/dayReal Losses per service connection per day*:1.18 gallons/connection/dayReal Losses per length of main per day*: N/AReal Losses per service connection per day per psi pressure:0.01 gallons/connection/day/psi?Unavoidable Annual Real Losses (UARL):126.75 million gallons/year?Infrastructure Leakage Index (ILI) [Real Losses/UARL]:0.06* only the most applicable of these two indicators will be calculatedAWWA <strong>Water</strong> Loss Control Committee Reporting Worksheet 1
Appendix FGroundwater Basin <strong>Water</strong> Rights Stipulation/Judgment(Document is available electronically as a pdf; please request from GSWC)
Appendix GSummary of Population Based on Census Data
Urban <strong>Water</strong> Management Plan<strong>San</strong> <strong>Dimas</strong> <strong>System</strong>Kennedy/Jenks ConsultantsAppendix G-1: Census Tracts within the <strong>San</strong> <strong>Dimas</strong> <strong>System</strong>Census Percentage ofCounty Subregion City Tract Tract in <strong>System</strong>Los Angeles <strong>San</strong> Gabriel Valley Assoc. of Cities La Verne city 400203 25%Los Angeles <strong>San</strong> Gabriel Valley Assoc. of Cities <strong>San</strong> <strong>Dimas</strong> city 400203 100%Los Angeles <strong>San</strong> Gabriel Valley Assoc. of Cities La Verne city 400302 15%Los Angeles <strong>San</strong> Gabriel Valley Assoc. of Cities Unincorporated 400302 40%Los Angeles <strong>San</strong> Gabriel Valley Assoc. of Cities <strong>San</strong> <strong>Dimas</strong> city 400303 95%Los Angeles <strong>San</strong> Gabriel Valley Assoc. of Cities La Verne city 400304 100%Los Angeles <strong>San</strong> Gabriel Valley Assoc. of Cities <strong>San</strong> <strong>Dimas</strong> city 400304 100%Los Angeles <strong>San</strong> Gabriel Valley Assoc. of Cities Glendora city 401202 100%Los Angeles <strong>San</strong> Gabriel Valley Assoc. of Cities <strong>San</strong> <strong>Dimas</strong> city 401302 95%Los Angeles <strong>San</strong> Gabriel Valley Assoc. of Cities Unincorporated 401302 50%Los Angeles <strong>San</strong> Gabriel Valley Assoc. of Cities <strong>San</strong> <strong>Dimas</strong> city 401311 98%Los Angeles <strong>San</strong> Gabriel Valley Assoc. of Cities <strong>San</strong> <strong>Dimas</strong> city 401312 100%Los Angeles <strong>San</strong> Gabriel Valley Assoc. of Cities La Verne city 401500 20%Los Angeles <strong>San</strong> Gabriel Valley Assoc. of Cities Walnut city 403405 60%Los Angeles <strong>San</strong> Gabriel Valley Assoc. of Cities Unincorporated 403500 25%Los Angeles <strong>San</strong> Gabriel Valley Assoc. of Cities Walnut city 403500 100%Los Angeles <strong>San</strong> Gabriel Valley Assoc. of Cities Covina city 403702 75%Los Angeles <strong>San</strong> Gabriel Valley Assoc. of Cities Unincorporated 403702 100%Los Angeles <strong>San</strong> Gabriel Valley Assoc. of Cities Covina city 403703 100%Los Angeles <strong>San</strong> Gabriel Valley Assoc. of Cities <strong>San</strong> <strong>Dimas</strong> city 403703 100%Los Angeles <strong>San</strong> Gabriel Valley Assoc. of Cities Unincorporated 403703 100%Los Angeles <strong>San</strong> Gabriel Valley Assoc. of Cities Covina city 403721 10%Los Angeles <strong>San</strong> Gabriel Valley Assoc. of Cities Unincorporated 403721 50%Los Angeles <strong>San</strong> Gabriel Valley Assoc. of Cities Covina city 403801 35%Los Angeles <strong>San</strong> Gabriel Valley Assoc. of Cities Unincorporated 403801 85%Los Angeles <strong>San</strong> Gabriel Valley Assoc. of Cities Covina city 403802 100%Los Angeles <strong>San</strong> Gabriel Valley Assoc. of Cities <strong>San</strong> <strong>Dimas</strong> city 403802 100%Los Angeles <strong>San</strong> Gabriel Valley Assoc. of Cities Unincorporated 403802 100%J:\<strong>2010</strong>\1070001.00_GSWC-<strong>UWMP</strong>\09-Reports\9.03-Calcs\Population Projections\14_<strong>San</strong><strong>Dimas</strong>_GrowthProj.xls1070001.00<strong>UWMP</strong>
Urban <strong>Water</strong> Management Plan<strong>San</strong> <strong>Dimas</strong> <strong>System</strong>Kennedy/Jenks ConsultantsTable G-2: Population, Household and Employment Projections for <strong>San</strong> <strong>Dimas</strong> <strong>System</strong>CensusPopulationPercentage ofTract County Subregion City 2005 <strong>2010</strong> 2015 2020 2025 2030 2035 Tract in <strong>System</strong>400203 Los Angeles <strong>San</strong> Gabriel Valley Assoc. of Cities La Verne city 5,062 5,191 5,333 5,483 5,680 5,868 6,067 25%400203 Los Angeles <strong>San</strong> Gabriel Valley Assoc. of Cities <strong>San</strong> <strong>Dimas</strong> city 296 313 351 457 569 675 775 100%400302 Los Angeles <strong>San</strong> Gabriel Valley Assoc. of Cities La Verne city 1,769 1,816 1,868 1,923 1,995 2,065 2,137 15%400302 Los Angeles <strong>San</strong> Gabriel Valley Assoc. of Cities Unincorporated 1,346 1,445 1,556 1,660 1,761 1,859 1,953 40%400303 Los Angeles <strong>San</strong> Gabriel Valley Assoc. of Cities <strong>San</strong> <strong>Dimas</strong> city 4,072 4,124 4,232 4,531 4,848 5,148 5,432 95%400304 Los Angeles <strong>San</strong> Gabriel Valley Assoc. of Cities La Verne city 0 0 0 0 0 0 0 100%400304 Los Angeles <strong>San</strong> Gabriel Valley Assoc. of Cities <strong>San</strong> <strong>Dimas</strong> city 7,322 7,432 7,664 8,303 8,981 9,621 10,228 100%401202 Los Angeles <strong>San</strong> Gabriel Valley Assoc. of Cities Glendora city 3,207 3,331 3,450 3,562 3,666 3,770 3,866 100%401302 Los Angeles <strong>San</strong> Gabriel Valley Assoc. of Cities <strong>San</strong> <strong>Dimas</strong> city 8,844 8,991 9,305 10,175 11,099 11,971 12,798 95%401302 Los Angeles <strong>San</strong> Gabriel Valley Assoc. of Cities Unincorporated 361 386 416 447 478 508 536 50%401311 Los Angeles <strong>San</strong> Gabriel Valley Assoc. of Cities <strong>San</strong> <strong>Dimas</strong> city 7,209 7,335 7,606 8,356 9,152 9,903 10,615 98%401312 Los Angeles <strong>San</strong> Gabriel Valley Assoc. of Cities <strong>San</strong> <strong>Dimas</strong> city 5,694 5,801 5,994 6,476 6,985 7,464 7,919 100%401500 Los Angeles <strong>San</strong> Gabriel Valley Assoc. of Cities La Verne city 5,594 5,800 6,022 6,255 6,549 6,831 7,125 20%403405 Los Angeles <strong>San</strong> Gabriel Valley Assoc. of Cities Walnut city 1,793 1,824 1,914 1,975 2,041 2,105 2,166 60%403500 Los Angeles <strong>San</strong> Gabriel Valley Assoc. of Cities Unincorporated 1,283 1,382 1,498 1,624 1,747 1,865 1,978 25%403500 Los Angeles <strong>San</strong> Gabriel Valley Assoc. of Cities Walnut city 0 0 0 0 0 0 0 100%403702 Los Angeles <strong>San</strong> Gabriel Valley Assoc. of Cities Covina city 3,913 4,027 4,250 4,421 4,599 4,769 4,932 75%403702 Los Angeles <strong>San</strong> Gabriel Valley Assoc. of Cities Unincorporated 40 47 56 64 73 81 89 100%403703 Los Angeles <strong>San</strong> Gabriel Valley Assoc. of Cities Covina city 2,701 2,771 2,911 3,017 3,129 3,235 3,337 100%403703 Los Angeles <strong>San</strong> Gabriel Valley Assoc. of Cities <strong>San</strong> <strong>Dimas</strong> city 1,635 1,699 1,822 2,140 2,476 2,792 3,092 100%403703 Los Angeles <strong>San</strong> Gabriel Valley Assoc. of Cities Unincorporated 740 803 877 950 1,021 1,090 1,155 100%403721 Los Angeles <strong>San</strong> Gabriel Valley Assoc. of Cities Covina city 4,528 4,662 4,927 5,128 5,339 5,540 5,733 10%403721 Los Angeles <strong>San</strong> Gabriel Valley Assoc. of Cities Unincorporated 639 694 758 824 887 949 1,008 50%403801 Los Angeles <strong>San</strong> Gabriel Valley Assoc. of Cities Covina city 1,439 1,480 1,560 1,621 1,685 1,747 1,806 35%403801 Los Angeles <strong>San</strong> Gabriel Valley Assoc. of Cities Unincorporated 4,942 5,262 5,631 6,000 6,357 6,703 7,034 85%403802 Los Angeles <strong>San</strong> Gabriel Valley Assoc. of Cities Covina city 1,925 1,989 2,117 2,213 2,315 2,412 2,504 100%403802 Los Angeles <strong>San</strong> Gabriel Valley Assoc. of Cities <strong>San</strong> <strong>Dimas</strong> city 271 282 307 378 452 523 590 100%403802 Los Angeles <strong>San</strong> Gabriel Valley Assoc. of Cities Unincorporated 3,936 4,213 4,531 4,845 5,149 5,444 5,726 100%Total Population Based on SCAG 60,279 62,094 64,957 69,861 74,988 79,859 84,495SCAG Growth Rate 5% 8% 7% 6% 6%CensusHouseholdsPercentage ofTract County Subregion City 2005 <strong>2010</strong> 2015 2020 2025 2030 2035 Tract in <strong>System</strong>400203 Los Angeles <strong>San</strong> Gabriel Valley Assoc. of Cities La Verne city 1,513 1,570 1,633 1,716 1,781 1,844 1,894 25%400203 Los Angeles <strong>San</strong> Gabriel Valley Assoc. of Cities <strong>San</strong> <strong>Dimas</strong> city 169 182 207 273 328 378 419 100%400302 Los Angeles <strong>San</strong> Gabriel Valley Assoc. of Cities La Verne city 624 646 671 704 730 755 775 15%400302 Los Angeles <strong>San</strong> Gabriel Valley Assoc. of Cities Unincorporated 416 441 474 509 535 561 583 40%400303 Los Angeles <strong>San</strong> Gabriel Valley Assoc. of Cities <strong>San</strong> <strong>Dimas</strong> city 1,280 1,313 1,372 1,530 1,661 1,783 1,880 95%400304 Los Angeles <strong>San</strong> Gabriel Valley Assoc. of Cities La Verne city 0 0 0 0 0 0 0 100%400304 Los Angeles <strong>San</strong> Gabriel Valley Assoc. of Cities <strong>San</strong> <strong>Dimas</strong> city 2,485 2,533 2,619 2,850 3,040 3,217 3,358 100%401202 Los Angeles <strong>San</strong> Gabriel Valley Assoc. of Cities Glendora city 969 996 1,033 1,068 1,093 1,118 1,137 100%401302 Los Angeles <strong>San</strong> Gabriel Valley Assoc. of Cities <strong>San</strong> <strong>Dimas</strong> city 2,922 2,991 3,116 3,449 3,723 3,978 4,182 95%401302 Los Angeles <strong>San</strong> Gabriel Valley Assoc. of Cities Unincorporated 124 133 144 155 164 173 180 50%401311 Los Angeles <strong>San</strong> Gabriel Valley Assoc. of Cities <strong>San</strong> <strong>Dimas</strong> city 2,530 2,599 2,723 3,055 3,328 3,583 3,786 98%401312 Los Angeles <strong>San</strong> Gabriel Valley Assoc. of Cities <strong>San</strong> <strong>Dimas</strong> city 1,872 1,919 2,005 2,233 2,421 2,596 2,736 100%401500 Los Angeles <strong>San</strong> Gabriel Valley Assoc. of Cities La Verne city 1,789 1,859 1,936 2,037 2,118 2,194 2,255 20%403405 Los Angeles <strong>San</strong> Gabriel Valley Assoc. of Cities Walnut city 484 500 536 566 589 611 628 60%403500 Los Angeles <strong>San</strong> Gabriel Valley Assoc. of Cities Unincorporated 373 405 448 495 531 566 595 25%403500 Los Angeles <strong>San</strong> Gabriel Valley Assoc. of Cities Walnut city 0 0 0 0 0 0 0 100%403702 Los Angeles <strong>San</strong> Gabriel Valley Assoc. of Cities Covina city 1,178 1,209 1,283 1,344 1,393 1,439 1,476 75%403702 Los Angeles <strong>San</strong> Gabriel Valley Assoc. of Cities Unincorporated 10 12 15 18 20 23 25 100%403703 Los Angeles <strong>San</strong> Gabriel Valley Assoc. of Cities Covina city 806 824 867 904 932 959 981 100%403703 Los Angeles <strong>San</strong> Gabriel Valley Assoc. of Cities <strong>San</strong> <strong>Dimas</strong> city 480 493 517 581 634 683 722 100%403703 Los Angeles <strong>San</strong> Gabriel Valley Assoc. of Cities Unincorporated 228 245 268 291 309 327 342 100%403721 Los Angeles <strong>San</strong> Gabriel Valley Assoc. of Cities Covina city 1,513 1,552 1,645 1,723 1,784 1,842 1,888 10%403721 Los Angeles <strong>San</strong> Gabriel Valley Assoc. of Cities Unincorporated 205 223 246 271 290 309 324 50%403801 Los Angeles <strong>San</strong> Gabriel Valley Assoc. of Cities Covina city 470 482 509 532 550 567 581 35%403801 Los Angeles <strong>San</strong> Gabriel Valley Assoc. of Cities Unincorporated 1,590 1,696 1,835 1,981 2,094 2,204 2,295 85%403802 Los Angeles <strong>San</strong> Gabriel Valley Assoc. of Cities Covina city 654 675 725 767 801 833 858 100%403802 Los Angeles <strong>San</strong> Gabriel Valley Assoc. of Cities <strong>San</strong> <strong>Dimas</strong> city 94 102 116 152 183 211 234 100%403802 Los Angeles <strong>San</strong> Gabriel Valley Assoc. of Cities Unincorporated 1,295 1,392 1,520 1,652 1,755 1,854 1,936 100%Total Population Based on SCAG 19,628 20,298 21,403 23,385 24,993 26,505 27,719SCAG Growth Rate 5% 9% 7% 6% 5%J:\<strong>2010</strong>\1070001.00_GSWC-<strong>UWMP</strong>\09-Reports\9.03-Calcs\Population Projections\14_<strong>San</strong><strong>Dimas</strong>_GrowthProj.xls1070001.00<strong>UWMP</strong>
Urban <strong>Water</strong> Management Plan<strong>San</strong> <strong>Dimas</strong> <strong>System</strong>Kennedy/Jenks ConsultantsTable G-2: Population, Household and Employment Projections for <strong>San</strong> <strong>Dimas</strong> <strong>System</strong>CensusEmploymentPercentage ofTract County Subregion City 2005 <strong>2010</strong> 2015 2020 2025 2030 2035 Tract in <strong>System</strong>400203 Los Angeles <strong>San</strong> Gabriel Valley Assoc. of Cities La Verne city 65 73 79 85 92 99 106 25%400203 Los Angeles <strong>San</strong> Gabriel Valley Assoc. of Cities <strong>San</strong> <strong>Dimas</strong> city 118 145 165 176 190 204 218 100%400302 Los Angeles <strong>San</strong> Gabriel Valley Assoc. of Cities La Verne city 463 499 528 544 564 585 604 15%400302 Los Angeles <strong>San</strong> Gabriel Valley Assoc. of Cities Unincorporated 215 228 239 247 256 266 276 40%400303 Los Angeles <strong>San</strong> Gabriel Valley Assoc. of Cities <strong>San</strong> <strong>Dimas</strong> city 1,099 1,147 1,186 1,213 1,244 1,277 1,309 95%400304 Los Angeles <strong>San</strong> Gabriel Valley Assoc. of Cities La Verne city 0 0 0 0 0 0 0 100%400304 Los Angeles <strong>San</strong> Gabriel Valley Assoc. of Cities <strong>San</strong> <strong>Dimas</strong> city 2,477 2,517 2,549 2,570 2,595 2,621 2,647 100%401202 Los Angeles <strong>San</strong> Gabriel Valley Assoc. of Cities Glendora city 2,150 2,253 2,337 2,395 2,462 2,534 2,603 100%401302 Los Angeles <strong>San</strong> Gabriel Valley Assoc. of Cities <strong>San</strong> <strong>Dimas</strong> city 557 612 655 683 716 751 784 95%401302 Los Angeles <strong>San</strong> Gabriel Valley Assoc. of Cities <strong>San</strong> <strong>Dimas</strong> city 291 312 330 344 360 376 393 50%401311 Los Angeles <strong>San</strong> Gabriel Valley Assoc. of Cities <strong>San</strong> <strong>Dimas</strong> city 7,768 8,013 8,212 8,346 8,503 8,671 8,832 98%401312 Los Angeles <strong>San</strong> Gabriel Valley Assoc. of Cities <strong>San</strong> <strong>Dimas</strong> city 2,709 2,797 2,866 2,910 2,961 3,015 3,067 100%401500 Los Angeles <strong>San</strong> Gabriel Valley Assoc. of Cities La Verne city 3,505 3,533 3,555 3,566 3,579 3,594 3,607 20%403405 Los Angeles <strong>San</strong> Gabriel Valley Assoc. of Cities Walnut city 2,229 2,281 2,322 2,348 2,379 2,412 2,444 60%403500 Los Angeles <strong>San</strong> Gabriel Valley Assoc. of Cities Unincorporated 21 24 25 26 27 28 29 25%403500 Los Angeles <strong>San</strong> Gabriel Valley Assoc. of Cities Walnut city 0 0 0 0 0 0 0 100%403702 Los Angeles <strong>San</strong> Gabriel Valley Assoc. of Cities Covina city 688 704 717 726 737 748 760 75%403702 Los Angeles <strong>San</strong> Gabriel Valley Assoc. of Cities Unincorporated 21 21 22 22 23 23 24 100%403703 Los Angeles <strong>San</strong> Gabriel Valley Assoc. of Cities Covina city 324 379 426 463 505 551 594 100%403703 Los Angeles <strong>San</strong> Gabriel Valley Assoc. of Cities <strong>San</strong> <strong>Dimas</strong> city 27 33 38 41 44 48 51 100%403703 Los Angeles <strong>San</strong> Gabriel Valley Assoc. of Cities Unincorporated 96 114 129 139 151 163 175 100%403721 Los Angeles <strong>San</strong> Gabriel Valley Assoc. of Cities Covina city 2,506 2,607 2,687 2,737 2,795 2,857 2,916 10%403721 Los Angeles <strong>San</strong> Gabriel Valley Assoc. of Cities Unincorporated 373 389 401 407 415 424 432 50%403801 Los Angeles <strong>San</strong> Gabriel Valley Assoc. of Cities Covina city 1,160 1,186 1,206 1,218 1,233 1,249 1,264 35%403801 Los Angeles <strong>San</strong> Gabriel Valley Assoc. of Cities Unincorporated 850 870 885 894 904 914 925 85%403802 Los Angeles <strong>San</strong> Gabriel Valley Assoc. of Cities Covina city 69 78 85 90 96 103 109 100%403802 Los Angeles <strong>San</strong> Gabriel Valley Assoc. of Cities <strong>San</strong> <strong>Dimas</strong> city 0 0 0 0 0 0 0 100%403802 Los Angeles <strong>San</strong> Gabriel Valley Assoc. of Cities Unincorporated 568 647 709 750 797 847 896 100%Total Population Based on SCAG 22,187 23,067 23,774 24,246 24,799 25,386 25,953SCAG Growth Rate 3% 2% 2% 2% 2%J:\<strong>2010</strong>\1070001.00_GSWC-<strong>UWMP</strong>\09-Reports\9.03-Calcs\Population Projections\14_<strong>San</strong><strong>Dimas</strong>_GrowthProj.xls1070001.00<strong>UWMP</strong>
Appendix HDocumentation of submittal to Library, Cities and Counties(To Be Included in Final Submittal)
September 1, 2011City of CovinaMichael A. MarquezCommunity Development Director125 E. College StreetCovina, CA 91723Dear: Michael A. MarquezRE: <strong>Golden</strong> <strong>State</strong> <strong>Water</strong> <strong>Company</strong>‐ <strong>2010</strong> Urban <strong>Water</strong> Management Plan<strong>Golden</strong> <strong>State</strong> <strong>Water</strong> <strong>Company</strong> (GSWC) adopted the <strong>2010</strong> Urban <strong>Water</strong> Management Plan (<strong>UWMP</strong>)following a public hearing on July 19, 2011. The <strong>2010</strong> <strong>UWMP</strong> was adopted in accordance with the Urban<strong>Water</strong> Management Planning Act and filed with DWR and the California Sate Library.Pursuant to Section 10644(a) of the California <strong>Water</strong> Code, GSWC is required to file a copy of theadopted <strong>2010</strong> <strong>UWMP</strong> with any city or county within which GSWC provided water. Enclosed for your filesis one copy of GSWC’s adopted <strong>2010</strong> <strong>UWMP</strong>. It is also on our website at www.gswater.com.If you have any questions you can contact me at (916) 853‐3612.Sincerely,GOLDEN STATE WATER COMPANYErnest A. GislerPlanning ManagerEnclosureG:\AdminAsst\Jobs\<strong>2010</strong>\1070001.00_GSWC-<strong>UWMP</strong>\09-Reports\9.09-Reports\2011-08\Grp2b\Appendix H\Adoption Letter- <strong>San</strong> <strong>Dimas</strong>.doc
September 1, 2011City of La VerneHal FredericksenCommunity Development Director3660 D StreetLa Verne, CA 91750Dear: Hal FredericksenRE: <strong>Golden</strong> <strong>State</strong> <strong>Water</strong> <strong>Company</strong>‐ <strong>2010</strong> Urban <strong>Water</strong> Management Plan<strong>Golden</strong> <strong>State</strong> <strong>Water</strong> <strong>Company</strong> (GSWC) adopted the <strong>2010</strong> Urban <strong>Water</strong> Management Plan (<strong>UWMP</strong>)following a public hearing on July 19, 2011. The <strong>2010</strong> <strong>UWMP</strong> was adopted in accordance with the Urban<strong>Water</strong> Management Planning Act and filed with DWR and the California Sate Library.Pursuant to Section 10644(a) of the California <strong>Water</strong> Code, GSWC is required to file a copy of theadopted <strong>2010</strong> <strong>UWMP</strong> with any city or county within which GSWC provided water. Enclosed for your filesis one copy of GSWC’s adopted <strong>2010</strong> <strong>UWMP</strong>. It is also on our website at www.gswater.com.If you have any questions you can contact me at (916) 853‐3612.Sincerely,GOLDEN STATE WATER COMPANYErnest A. GislerPlanning ManagerEnclosureG:\AdminAsst\Jobs\<strong>2010</strong>\1070001.00_GSWC-<strong>UWMP</strong>\09-Reports\9.09-Reports\2011-08\Grp2b\Appendix H\Adoption Letter- <strong>San</strong> <strong>Dimas</strong>.doc
September 1, 2011City of <strong>San</strong> <strong>Dimas</strong>Dan ColemanPlanning Manager245 East Bonita Avenue<strong>San</strong> <strong>Dimas</strong>, CA 91773Dear: Dan ColemanRE: <strong>Golden</strong> <strong>State</strong> <strong>Water</strong> <strong>Company</strong>‐ <strong>2010</strong> Urban <strong>Water</strong> Management Plan<strong>Golden</strong> <strong>State</strong> <strong>Water</strong> <strong>Company</strong> (GSWC) adopted the <strong>2010</strong> Urban <strong>Water</strong> Management Plan (<strong>UWMP</strong>)following a public hearing on July 19, 2011. The <strong>2010</strong> <strong>UWMP</strong> was adopted in accordance with the Urban<strong>Water</strong> Management Planning Act and filed with DWR and the California Sate Library.Pursuant to Section 10644(a) of the California <strong>Water</strong> Code, GSWC is required to file a copy of theadopted <strong>2010</strong> <strong>UWMP</strong> with any city or county within which GSWC provided water. Enclosed for your filesis one copy of GSWC’s adopted <strong>2010</strong> <strong>UWMP</strong>. It is also on our website at www.gswater.com.If you have any questions you can contact me at (916) 853‐3612.Sincerely,GOLDEN STATE WATER COMPANYErnest A. GislerPlanning ManagerEnclosureG:\AdminAsst\Jobs\<strong>2010</strong>\1070001.00_GSWC-<strong>UWMP</strong>\09-Reports\9.09-Reports\2011-08\Grp2b\Appendix H\Adoption Letter- <strong>San</strong> <strong>Dimas</strong>.doc
September 1, 2011City of WalnutTom WienerDirector of Community Development21201 La Puente RoadWalnut, CA 91789Dear: Tom WienerRE: <strong>Golden</strong> <strong>State</strong> <strong>Water</strong> <strong>Company</strong>‐ <strong>2010</strong> Urban <strong>Water</strong> Management Plan<strong>Golden</strong> <strong>State</strong> <strong>Water</strong> <strong>Company</strong> (GSWC) adopted the <strong>2010</strong> Urban <strong>Water</strong> Management Plan (<strong>UWMP</strong>)following a public hearing on July 19, 2011. The <strong>2010</strong> <strong>UWMP</strong> was adopted in accordance with the Urban<strong>Water</strong> Management Planning Act and filed with DWR and the California Sate Library.Pursuant to Section 10644(a) of the California <strong>Water</strong> Code, GSWC is required to file a copy of theadopted <strong>2010</strong> <strong>UWMP</strong> with any city or county within which GSWC provided water. Enclosed for your filesis one copy of GSWC’s adopted <strong>2010</strong> <strong>UWMP</strong>. It is also on our website at www.gswater.com.If you have any questions you can contact me at (916) 853‐3612.Sincerely,GOLDEN STATE WATER COMPANYErnest A. GislerPlanning ManagerEnclosureG:\AdminAsst\Jobs\<strong>2010</strong>\1070001.00_GSWC-<strong>UWMP</strong>\09-Reports\9.09-Reports\2011-08\Grp2b\Appendix H\Adoption Letter- <strong>San</strong> <strong>Dimas</strong>.doc
September 1, 2011County of Los AngelesRichard BrudcknerDirector Department of Regional Planning320 West Temple StreetLos Angeles, CA 90012Dear: Richard BrudcknerRE: <strong>Golden</strong> <strong>State</strong> <strong>Water</strong> <strong>Company</strong>‐ <strong>2010</strong> Urban <strong>Water</strong> Management Plan<strong>Golden</strong> <strong>State</strong> <strong>Water</strong> <strong>Company</strong> (GSWC) adopted the <strong>2010</strong> Urban <strong>Water</strong> Management Plan (<strong>UWMP</strong>)following a public hearing on July 19, 2011. The <strong>2010</strong> <strong>UWMP</strong> was adopted in accordance with the Urban<strong>Water</strong> Management Planning Act and filed with DWR and the California Sate Library.Pursuant to Section 10644(a) of the California <strong>Water</strong> Code, GSWC is required to file a copy of theadopted <strong>2010</strong> <strong>UWMP</strong> with any city or county within which GSWC provided water. Enclosed for your filesis one copy of GSWC’s adopted <strong>2010</strong> <strong>UWMP</strong>. It is also on our website at www.gswater.com.If you have any questions you can contact me at (916) 853‐3612.Sincerely,GOLDEN STATE WATER COMPANYErnest A. GislerPlanning ManagerEnclosureG:\AdminAsst\Jobs\<strong>2010</strong>\1070001.00_GSWC-<strong>UWMP</strong>\09-Reports\9.09-Reports\2011-08\Grp2b\Appendix H\Adoption Letter- <strong>San</strong> <strong>Dimas</strong>.doc
Appendix IDocumentation of <strong>Water</strong> Use Projections Submittal
Appendix JUrban <strong>Water</strong> Management Plan Checklist
Table I-2 Urban <strong>Water</strong> Management Plan checklist, organized by subjectNo. <strong>UWMP</strong> requirement a Calif. <strong>Water</strong>Code reference Additional clarificationPLAN PREPARATION4 Coordinate the preparation of its plan with other appropriate agencies inthe area, including other water suppliers that share a common source,water management agencies, and relevant public agencies, to the extentpracticable.6 Notify, at least 60 days prior to the public hearing on the plan required bySection 10642, any city or county within which the supplier provides waterthat the urban water supplier will be reviewing the plan and consideringamendments or changes to the plan. Any city or county receiving thenotice may be consulted and provide comments.7 Provide supporting documentation that the <strong>UWMP</strong> or any amendments to,or changes in, have been adopted as described in Section 10640 et seq.54 Provide supporting documentation that the urban water management planhas been or will be provided to any city or county within which it provideswater, no later than 60 days after the submission of this urban watermanagement plan.55 Provide supporting documentation that the water supplier has encouragedactive involvement of diverse social, cultural, and economic elements ofthe population within the service area prior to and during the preparationof the plan.56 Provide supporting documentation that the urban water supplier made theplan available for public inspection and held a public hearing about theplan. For public agencies, the hearing notice is to be provided pursuant toSection 6066 of the Government Code. The water supplier is to providethe time and place of the hearing to any city or county within which thesupplier provides water. Privately-owned water suppliers shall provide anequivalent notice within its service area.57 Provide supporting documentation that the plan has been adopted asprepared or modified.58 Provide supporting documentation as to how the water supplier plans toimplement its plan.<strong>UWMP</strong>locationPageNumber10620(d)(2) 1.6 1-710621(b) 1.6 1-710621(c) 1.6 1-710635(b) Appendix H10642 1.6 1-710642 Page vii Vii10642 1.6 1-710643 1.8 1-8J:\<strong>2010</strong>\1070001.00_GSWC-<strong>UWMP</strong>\09-Reports\9.09-Reports\_Appendices\<strong>San</strong> <strong>Dimas</strong>\Appendix_J_<strong>UWMP</strong>-Checklist.doc1
No. <strong>UWMP</strong> requirement a Calif. <strong>Water</strong>Code reference Additional clarification59 Provide supporting documentation that, in addition to submittal to DWR,the urban water supplier has submitted this <strong>UWMP</strong> to the California <strong>State</strong>Library and any city or county within which the supplier provides watersupplies a copy of its plan no later than 30 days after adoption. This alsoincludes amendments or changes.60 Provide supporting documentation that, not later than 30 days after filing acopy of its plan with the department, the urban water supplier has or willmake the plan available for public review during normal business hoursSYSTEM DESCRIPTION<strong>UWMP</strong>location10644(a) 1.7Appendix HPageNumber10645 1.7 1-88 Describe the water supplier service area. 10631(a) 2.1 2-19 Describe the climate and other demographic factors of the service area of 10631(a) 2.2 & 2.4 2-1 & 2-10the supplier10 Indicate the current population of the service area 10631(a) Provide the most2.3 2-5recent population datapossible. Use themethod described in“Baseline Daily PerCapita <strong>Water</strong> Use.”See Section M.11 Provide population projections for 2015, 2020, 2025, and 2030, based on 10631(a) 2035 and 2040 can 2.3.2 2-5data from <strong>State</strong>, regional, or local service area population projections.also be provided tosupport consistencywith <strong>Water</strong> SupplyAssessments andWritten Verification of<strong>Water</strong> Supplydocuments.12 Describe other demographic factors affecting the supplier’s water10631(a) 2.2 & 2.4 2-1 & 2-10management planning.SYSTEM DEMANDS1 Provide baseline daily per capita water use, urban water use target,interim urban water use target, and compliance daily per capita water use,along with the bases for determining those estimates, includingreferences to supporting data.10608.20(e) 3.2 3-31-8J:\<strong>2010</strong>\1070001.00_GSWC-<strong>UWMP</strong>\09-Reports\9.09-Reports\_Appendices\<strong>San</strong> <strong>Dimas</strong>\Appendix_J_<strong>UWMP</strong>-Checklist.doc2
No. <strong>UWMP</strong> requirement a Calif. <strong>Water</strong>Code reference Additional clarification2 Wholesalers: Include an assessment of present and proposed futuremeasures, programs, and policies to help achieve the water usereductions. Retailers: Conduct at least one public hearing that includesgeneral discussion of the urban retail water supplier’s implementation planfor complying with the <strong>Water</strong> Conservation Bill of 2009.3 Report progress in meeting urban water use targets using thestandardized form.25 Quantify past, current, and projected water use, identifying the usesamong water use sectors, for the following: (A) single-family residential,(B) multifamily, (C) commercial, (D) industrial, (E) institutional andgovernmental, (F) landscape, (G) sales to other agencies, (H) salinewater intrusion barriers, groundwater recharge, conjunctive use, and (I)agriculture.33 Provide documentation that either the retail agency provided thewholesale agency with water use projections for at least 20 years, if the<strong>UWMP</strong> agency is a retail agency, OR, if a wholesale agency, it providedits urban retail customers with future planned and existing water sourceavailable to it from the wholesale agency during the required water-yeartypes34 Include projected water use for single-family and multifamily residentialhousing needed for lower income households, as identified in the housingelement of any city, county, or city and county in the service area of thesupplier.SYSTEM SUPPLIES13 Identify and quantify the existing and planned sources of water availablefor 2015, 2020, 2025, and 2030.10608.3610608.26(a)Retailers andwholesalers haveslightly differentrequirements<strong>UWMP</strong>locationPageNumber4.6 4-910608.40 Applicable3-83-15Not10631(e)(1) Consider ‘past’ to be 3.3 2005, present to be<strong>2010</strong>, and projected tobe 2015, 2020, 2025,and 2030. Providenumbers for eachcategory for each ofthese years.10631(k) Average year, single 3.7 dry year, multiple dry Appendix Lyears for 2015, 2020,2025, and 2030.10631.1(a) 3.8 3-1610631(b) The ‘existing’ watersources should be forthe same year as the“current population” inline 10. 2035 and 2040can also be provided.4.1 4-2J:\<strong>2010</strong>\1070001.00_GSWC-<strong>UWMP</strong>\09-Reports\9.09-Reports\_Appendices\<strong>San</strong> <strong>Dimas</strong>\Appendix_J_<strong>UWMP</strong>-Checklist.doc3
No. <strong>UWMP</strong> requirement a Calif. <strong>Water</strong>Code reference Additional clarification14 Indicate whether groundwater is an existing or planned source of wateravailable to the supplier. If yes, then complete 15 through 21 of the<strong>UWMP</strong> Checklist. If no, then indicate “not applicable” in lines 15 through21 under the <strong>UWMP</strong> location column.15 Indicate whether a groundwater management plan been adopted by thewater supplier or if there is any other specific authorization forgroundwater management. Include a copy of the plan or authorization.<strong>UWMP</strong>locationPageNumber10631(b) 4.3 4-4Source classifications are: surface water,groundwater, recycledwater, storm water,desalinated sea water,desalinated brackishgroundwater, andother.10631(b)(1) 4.3 4-416 Describe the groundwater basin. 10631(b)(2) 4.3 4-417 Indicate whether the groundwater basin is adjudicated? Include a copy of 10631(b)(2) 4.3 & 4-4the court order or decree.Appendix F18 Describe the amount of groundwater the urban water supplier has the 10631(b)(2) 4.3 4-4legal right to pump under the order or decree. If the basin is notadjudicated, indicate “not applicable” in the <strong>UWMP</strong> location column.19 For groundwater basins that are not adjudicated, provide information as to whether DWR has identified the basin or basins as overdrafted or has10631(b)(2) NotApplicableprojected that the basin will become overdrafted if present managementconditions continue, in the most current official departmental bulletin thatcharacterizes the condition of the groundwater basin, and a detaileddescription of the efforts being undertaken by the urban water supplier toeliminate the long-term overdraft condition. If the basin is adjudicated,indicate “not applicable” in the <strong>UWMP</strong> location column.20 Provide a detailed description and analysis of the location, amount, and sufficiency of groundwater pumped by the urban water supplier for thepast five years10631(b)(3) 4.3 4-421 Provide a detailed description and analysis of the amount and location ofgroundwater that is projected to be pumped.24 Describe the opportunities for exchanges or transfers of water on a shorttermor long-term basis.10631(b)(4) 4.3 4-4Provide projections for 2015, 2020, 2025, and2030.10631(d) 4.4 4-8J:\<strong>2010</strong>\1070001.00_GSWC-<strong>UWMP</strong>\09-Reports\9.09-Reports\_Appendices\<strong>San</strong> <strong>Dimas</strong>\Appendix_J_<strong>UWMP</strong>-Checklist.doc4
No. <strong>UWMP</strong> requirement a Calif. <strong>Water</strong>Code reference Additional clarification30 Include a detailed description of all water supply projects and programsthat may be undertaken by the water supplier to address water supplyreliability in average, single-dry, and multiple-dry years, excluding demandmanagement programs addressed in (f)(1). Include specific projects,describe water supply impacts, and provide a timeline for each project.31 Describe desalinated water project opportunities for long-term supply,including, but not limited to, ocean water, brackish water, andgroundwater.44 Provide information on recycled water and its potential for use as a watersource in the service area of the urban water supplier. Coordinate withlocal water, wastewater, groundwater, and planning agencies that operatewithin the supplier's service area.45 Describe the wastewater collection and treatment systems in thesupplier's service area, including a quantification of the amount ofwastewater collected and treated and the methods of wastewaterdisposal.46 Describe the quantity of treated wastewater that meets recycled waterstandards, is being discharged, and is otherwise available for use in arecycled water project.47 Describe the recycled water currently being used in the supplier's servicearea, including, but not limited to, the type, place, and quantity of use.48 Describe and quantify the potential uses of recycled water, including, butnot limited to, agricultural irrigation, landscape irrigation, wildlife habitatenhancement, wetlands, industrial reuse, groundwater recharge, indirectpotable reuse, and other appropriate uses, and a determination withregard to the technical and economic feasibility of serving those uses.49 The projected use of recycled water within the supplier's service area atthe end of 5, 10, 15, and 20 years, and a description of the actual use ofrecycled water in comparison to uses previously projected.50 Describe the actions, including financial incentives, which may be taken toencourage the use of recycled water, and the projected results of theseactions in terms of acre-feet of recycled water used per year.<strong>UWMP</strong>locationPageNumber10631(h) 4.5 4-810631(i) 4.7 4-1010633 4.8 4-1110633(a) 4.8.2 4-1210633(b) 4.8.2 4-1210633(c) 4.8.2 4-1210633(d) 4.8.3 4-1410633(e) 4.8 4-1110633(f) 4.8.4 4-15J:\<strong>2010</strong>\1070001.00_GSWC-<strong>UWMP</strong>\09-Reports\9.09-Reports\_Appendices\<strong>San</strong> <strong>Dimas</strong>\Appendix_J_<strong>UWMP</strong>-Checklist.doc5
No. <strong>UWMP</strong> requirement a Calif. <strong>Water</strong>Code reference Additional clarification51 Provide a plan for optimizing the use of recycled water in the supplier'sservice area, including actions to facilitate the installation of dualdistribution systems, to promote recirculating uses, to facilitate theincreased use of treated wastewater that meets recycled water standards,and to overcome any obstacles to achieving that increased use.WATER SHORTAGE RELIABILITY AND WATER SHORTAGE CONTINGENCY PLANNING b<strong>UWMP</strong>locationPageNumber10633(g) 4.8.4 4-155 Describe water management tools and options to maximize resources 10620(f) 1.10 1-10and minimize the need to import water from other regions.22 Describe the reliability of the water supply and vulnerability to seasonal or 10631(c)(1) 6.1 6-1climatic shortage and provide data for (A) an average water year, (B) asingle dry water year, and (C) multiple dry water years.23 For any water source that may not be available at a consistent level of 10631(c)(2) 6.1.5 6-7use - given specific legal, environmental, water quality, or climatic factors- describe plans to supplement or replace that source with alternativesources or water demand management measures, to the extentpracticable.35 Provide an urban water shortage contingency analysis that specifies 10632(a) 8.1 8-1stages of action, including up to a 50-percent water supply reduction, andan outline of specific water supply conditions at each stage36 Provide an estimate of the minimum water supply available during each of 10632(b) 8.2 8-3the next three water years based on the driest three-year historicsequence for the agency's water supply.37 Identify actions to be undertaken by the urban water supplier to prepare 10632(c) 8.3 8-4for, and implement during, a catastrophic interruption of water suppliesincluding, but not limited to, a regional power outage, an earthquake, orother disaster.38 Identify additional, mandatory prohibitions against specific water use 10632(d) 8.4 8-6practices during water shortages, including, but not limited to, prohibitingthe use of potable water for street cleaning.39 Specify consumption reduction methods in the most restrictive stages. 10632(e) 8.4 8-6Each urban water supplier may use any type of consumption reductionmethods in its water shortage contingency analysis that would reducewater use, are appropriate for its area, and have the ability to achieve awater use reduction consistent with up to a 50 percent reduction in watersupply.40 Indicated penalties or charges for excessive use, where applicable. 10632(f) 8.4 8-6J:\<strong>2010</strong>\1070001.00_GSWC-<strong>UWMP</strong>\09-Reports\9.09-Reports\_Appendices\<strong>San</strong> <strong>Dimas</strong>\Appendix_J_<strong>UWMP</strong>-Checklist.doc6
No. <strong>UWMP</strong> requirement a Calif. <strong>Water</strong>Code reference Additional clarification<strong>UWMP</strong>location41 Appendix DProvide an analysis of the impacts of each of the actions and conditions 10632(g) 8.5 8-8described in subdivisions (a) to (f), inclusive, on the revenues andexpenditures of the urban water supplier, and proposed measures toovercome those impacts, such as the development of reserves and rateadjustments.42 Provide a draft water shortage contingency resolution or ordinance. 10632(h) 8.4 & 8-643 Indicate a mechanism for determining actual reductions in water use pursuant to the urban water shortage contingency analysis.10632(i) 8.6 8-1052 Provide information, to the extent practicable, relating to the quality ofexisting sources of water available to the supplier over the same five-yearincrements, and the manner in which water quality affects watermanagement strategies and supply reliability53 Assess the water supply reliability during normal, dry, and multiple drywater years by comparing the total water supply sources available to thewater supplier with the total projected water use over the next 20 years, infive-year increments, for a normal water year, a single dry water year, andmultiple dry water years. Base the assessment on the informationcompiled under Section 10631, including available data from state,regional, or local agency population projections within the service area ofthe urban water supplier.DEMAND MANAGEMENT MEASURES26 Describe how each water demand management measures is beingimplemented or scheduled for implementation. Use the list provided.27 Describe the methods the supplier uses to evaluate the effectiveness ofDMMs implemented or described in the <strong>UWMP</strong>.28 Provide an estimate, if available, of existing conservation savings onwater use within the supplier's service area, and the effect of the savingson the ability to further reduce demand.10634 For years <strong>2010</strong>, 2015,2020, 2025, and 2030PageNumber5 5-110635(a) 6.2 – 6.4 6-710631(f)(1) 7.1 7-2Discuss each DMM, even if it is not currentlyor planned forimplementation.Provide anyappropriate schedules.10631(f)(3) 7.1 7-210631(f)(4) 7.2 7-4J:\<strong>2010</strong>\1070001.00_GSWC-<strong>UWMP</strong>\09-Reports\9.09-Reports\_Appendices\<strong>San</strong> <strong>Dimas</strong>\Appendix_J_<strong>UWMP</strong>-Checklist.doc7
<strong>UWMP</strong>locationPageNumber7.2 7-4a The <strong>UWMP</strong> Requirement descriptions are general summaries of what is provided in the legislation. Urban water suppliers should review the exact legislative wording prior tosubmitting its <strong>UWMP</strong>.b The Subject classification is provided for clarification only. It is aligned with the organization presented in Part I of this guidebook. A water supplier is free to address the <strong>UWMP</strong>Requirement anywhere with its <strong>UWMP</strong>, but is urged to provide clarification to DWR to facilitate review.N/ANo. <strong>UWMP</strong> requirement a Calif. <strong>Water</strong>Code reference Additional clarification29 Evaluate each water demand management measure that is not currentlybeing implemented or scheduled for implementation. The evaluationshould include economic and non-economic factors, cost-benefit analysis,available funding, and the water suppliers' legal authority to implement thework.32 Include the annual reports submitted to meet the Section 6.2requirements, if a member of the CUWCC and signer of the December10, 2008 MOU.10631(g) See 10631(g) foradditional wording.10631(j) Signers of the MOUthat submit the annualreports are deemedcompliant with Items 28and 29.J:\<strong>2010</strong>\1070001.00_GSWC-<strong>UWMP</strong>\09-Reports\9.09-Reports\_Appendices\<strong>San</strong> <strong>Dimas</strong>\Appendix_J_<strong>UWMP</strong>-Checklist.doc8