2012 Annual Report - Stone Energy Corporation
2012 Annual Report - Stone Energy Corporation
2012 Annual Report - Stone Energy Corporation

Create successful ePaper yourself
Turn your PDF publications into a flip-book with our unique Google optimized e-Paper software.
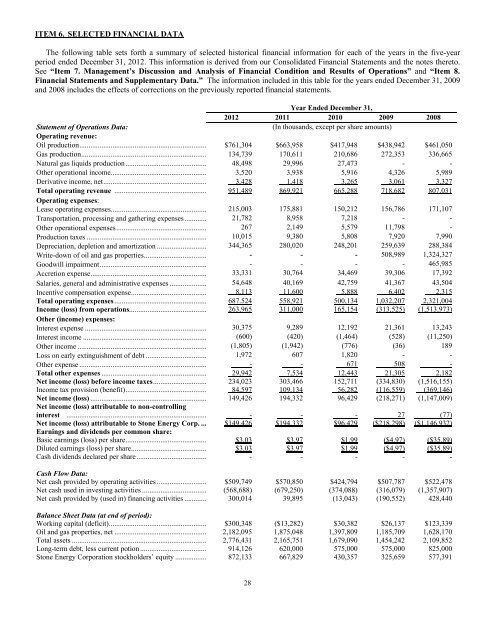
ITEM 6. SELECTED FINANCIAL DATAThe following table sets forth a summary of selected historical financial information for each of the years in the five-yearperiod ended December 31, <strong>2012</strong>. This information is derived from our Consolidated Financial Statements and the notes thereto.See “Item 7. Management’s Discussion and Analysis of Financial Condition and Results of Operations” and “Item 8.Financial Statements and Supplementary Data.” The information included in this table for the years ended December 31, 2009and 2008 includes the effects of corrections on the previously reported financial statements.Year Ended December 31,<strong>2012</strong> 2011 2010 2009 2008Statement of Operations Data:(In thousands, except per share amounts)Operating revenue:Oil production ..................................................................... $761,304 $663,958 $417,948 $438,942 $461,050Gas production .................................................................... 134,739 170,611 210,686 272,353 336,665Natural gas liquids production ............................................ 48,498 29,996 27,473 - -Other operational income.................................................... 3,520 3,938 5,916 4,326 5,989Derivative income, net ........................................................ 3,428 1,418 3,265 3,061 3,327Total operating revenue .................................................. 951,489 869,921 665,288 718,682 807,031Operating expenses:Lease operating expenses .................................................... 215,003 175,881 150,212 156,786 171,107Transportation, processing and gathering expenses ............ 21,782 8,958 7,218 - -Other operational expenses ................................................. 267 2,149 5,579 11,798 -Production taxes ................................................................. 10,015 9,380 5,808 7,920 7,990Depreciation, depletion and amortization ........................... 344,365 280,020 248,201 259,639 288,384Write-down of oil and gas properties .................................. - - - 508,989 1,324,327Goodwill impairment .......................................................... - - - - 465,985Accretion expense ............................................................... 33,331 30,764 34,469 39,306 17,392Salaries, general and administrative expenses .................... 54,648 40,169 42,759 41,367 43,504Incentive compensation expense ......................................... 8,113 11,600 5,888 6,402 2,315Total operating expenses .................................................. 687.524 558,921 500,134 1,032,207 2,321,004Income (loss) from operations .......................................... 263,965 311,000 165,154 (313,525) (1,513,973)Other (income) expenses:Interest expense .................................................................. 30,375 9,289 12,192 21,361 13,243Interest income ................................................................... (600) (420) (1,464) (528) (11,250)Other income ...................................................................... (1,805) (1,942) (776) (36) 189Loss on early extinguishment of debt ................................. 1,972 607 1,820 - -Other expense ..................................................................... - - 671 508 -Total other expenses ......................................................... 29,942 7,534 12,443 21,305 2,182Net income (loss) before income taxes ............................. 234,023 303,466 152,711 (334,830) (1,516,155)Income tax provision (benefit)............................................ 84,597 109,134 56,282 (116,559) (369,146)Net income (loss) ............................................................... 149,426 194,332 96,429 (218,271) (1,147,009)Net income (loss) attributable to non-controllinginterest ............................................................................ - - - 27 (77)Net income (loss) attributable to <strong>Stone</strong> <strong>Energy</strong> Corp. ... $149,426 $194,332 $96,429 ($218,298) ($1,146,932)Earnings and dividends per common share:Basic earnings (loss) per share ............................................ $3.03 $3.97 $1.99 ($4.97) ($35.89)Diluted earnings (loss) per share ......................................... $3.03 $3.97 $1.99 ($4.97) ($35.89)Cash dividends declared per share ...................................... - - - - -Cash Flow Data:Net cash provided by operating activities ........................... $509,749 $570,850 $424,794 $507,787 $522,478Net cash used in investing activities ................................... (568,688) (679,250) (374,088) (316,079) (1,357,907)Net cash provided by (used in) financing activities ............ 300,014 39,895 (13,043) (190,552) 428,440Balance Sheet Data (at end of period):Working capital (deficit)..................................................... $300,348 ($13,282) $30,382 $26,137 $123,339Oil and gas properties, net .................................................. 2,182,095 1,875,048 1,397,809 1,185,709 1,628,170Total assets ......................................................................... 2,776,431 2,165,751 1,679,090 1,454,242 2,109,852Long-term debt, less current potion .................................... 914,126 620,000 575,000 575,000 825,000<strong>Stone</strong> <strong>Energy</strong> <strong>Corporation</strong> stockholders’ equity ................. 872,133 667,829 430,357 325,659 577,39128