Optical Fiber Sensors for Biomedical Applications
Optical Fiber Sensors for Biomedical Applications
Optical Fiber Sensors for Biomedical Applications

Create successful ePaper yourself
Turn your PDF publications into a flip-book with our unique Google optimized e-Paper software.
Chapter 17<strong>Optical</strong> <strong>Fiber</strong> <strong>Sensors</strong> <strong>for</strong> <strong>Biomedical</strong><strong>Applications</strong>Lee C.L. Chin, William M. Whelan, and I. Alex Vitkin17.1 Introduction<strong>Optical</strong> fiber technology offers a convenient, af<strong>for</strong>dable, safe and effective approach<strong>for</strong> the delivery and collection of light to and from the tissue region of interest,and has been employed clinically since the 1960s [1]. This chapter discusses andreviews the recent developments in optical fiber sensor technology in the field ofbiomedicine.Be<strong>for</strong>e proceeding, we distinguish between the previous edition of this chapter(Optics of <strong>Fiber</strong> and <strong>Fiber</strong> Probes, 1995 edition, Chapter 19), which primarily examinedthe role of optical fibers <strong>for</strong> tissue modification (e.g., photo-therapeutics suchas laser heating), and the current treatise. Here, we focus on the clinical applicationof optical fiber technology <strong>for</strong> tissue assessment, in the contexts of diagnosisand therapeutic monitoring. While the term probe can describe either therapeuticor diagnostic intent, we classify probes <strong>for</strong> therapy as applicators and probes <strong>for</strong>diagnosis as sensors, and limit our discussion to the latter.The use of optical fiber technology offers numerous advantages that are wellsuited<strong>for</strong> clinical use. The sensors can be made biologically compatible (non-toxicand bio-chemically inert) and are immune from electromagnetic interference. Theycan be placed non-invasively in contact with external organs such as the skin or surgicallyexposed surfaces. In addition, due to their flexibility and thin outer diameter,they can also be placed into bodily cavities (endoscopic approach), inserted interstitiallyvia minimally invasive trocars, (e.g., hollow bore needles), or positionedintravascularly. As such, measurements can be per<strong>for</strong>med in difficult-to-access partsof the human body with greater “local” sensitivity. Finally, it is technologically possibleto bundle multiple sensors with different measurement capabilities into a singleprobe as a packaged instrument, thus potentially increasing useful in<strong>for</strong>mationcontent.L.C.L. Chin (B)Medical Physics Department, Odette Cancer Centre, Toronto, ON, Canadae-mail: Lee.Chin@sunnybrook.caA.J. Welch, M.J.C. van Gemert (eds.), <strong>Optical</strong>-Thermal Response of Laser-IrradiatedTissue, 2nd ed., DOI 10.1007/978-90-481-8831-4_17,C○ Springer Science+Business Media B.V. 2011661
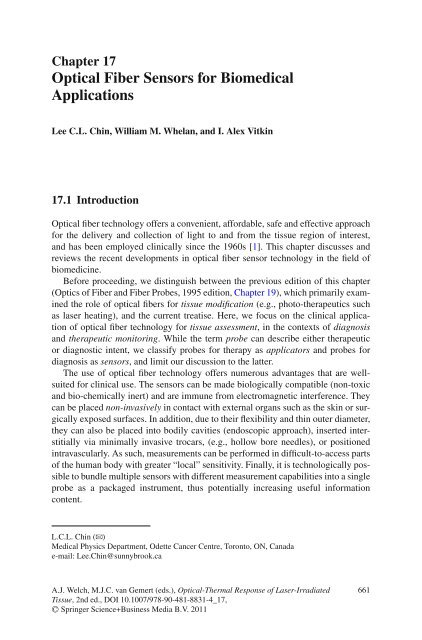
662 L.C.L. Chin et al.The choice and design of an optical fiber sensor is generally dictated by technologicaland clinical issues such as access to the target site, spatial resolution,spatial localization, desired sampling volume, (non)invasiveness, accuracy andoverall clinical intent. The combination of these factors <strong>for</strong>ms a unique biomedicalengineering problem that dictates the various system parameters such as thechoice of light source and detector characteristics, source-detector arrangement,and fiber tip modifications, among others. In addition, appropriate signal analysismust be chosen <strong>for</strong> specific applications (e.g., background fluorescence subtractionin fiber-based Raman spectroscopy, model fits in fiber-based spatially dependentdiffuse reflectance, corrections of fluorescence spectra <strong>for</strong> tissue attenuationdistortions, etc.).In this chapter, the fundamentals of optical fiber sensors will be reviewed,along with basic definitions, classifications and applications. Selected examples arechosen to illustrate the various design concepts. While this chapter by no means constitutesan exhaustive review, we hope to provide the reader with a sampling of thetype of approaches and innovations that can be used <strong>for</strong> solving clinical problems.17.2 <strong>Optical</strong> <strong>Fiber</strong> <strong>Sensors</strong>17.2.1 Basic System DesignA typical optical fiber sensing system, shown in Fig. 17.1, is comprised of fourmajor components: a light source, optical fiber(s), optical coupling/filters and adetector.1. The light source is typically a laser (pulsed, modulated, or steady-state) or whitelight (xenon or mercury lamp, with or without filters) used to probe or exciteFig. 17.1 Typical optical fiber sensors employing (a) a single fiber <strong>for</strong> both delivery and detectionor (b) separate source-detector fibers (after Utzinger and Richards-Kortum [2]). Solid boxes representessential components always present in fiber-based sensor systems; dotted boxes are opticalcomponents that may be optimized <strong>for</strong> a specific application
17 <strong>Optical</strong> <strong>Fiber</strong> <strong>Sensors</strong> <strong>for</strong> <strong>Biomedical</strong> <strong>Applications</strong> 663the tissue. The light source characteristics provide a wide range of properties <strong>for</strong>optical interrogation of tissues including intensity, phase, polarization state, andwavelength content.2. <strong>Optical</strong> fibers deliver light from a light source to a sensing mechanism (seeSection 17.2.2 below) located at the fiber end, which is coupled to the interrogatedmedium (e.g. tissue). Here, the light experiences a modulation by theinterrogated tissue, and is returned via the same (Fig. 17.1a) or different fiber(s)(Fig. 17.1b) to a light-measurement device where it can be detected and analyzed.Often, a portion of the interrogating light can be used as a reference (theratio method), to correct <strong>for</strong> optical fluctuation and to provide improved noiserejection.<strong>Fiber</strong>s can be bundled to increase the interrogation volume and improve signalto-noiseby capturing a larger signal. This typically requires stripping the outerbuffer (jacket) off the fiber to reduce overall diameter. A hexagonal packingconfiguration provides the optimal arrangement <strong>for</strong> minimizing the dead space(inactive area between fibers) due to the cladding. The total number of packedfibers, T, in a circular cross section <strong>for</strong> such an arrangement isT = 1 +k∑6i (17.1)where k is the total number of rings. With the jacket removed, a fiber bundle canachieve a total active area of almost 65%.3. <strong>Optical</strong> components such as connectors, lenses, mirrors, fiber couplers, circulators,polarizers, phase modulators, and beam-splitters can be configured tooptimize the signal in the detector fiber. Single source-detector geometry resultsin a small sensor diameter with a small interrogation volume and high lightcollection efficiency. However, compared to multi-distance sensors and/or fiberbundle geometries, single-fiber sensors suffer from high unwanted backgroundsignals generated within the fiber. These can stem from fiber autofluorescencegenerated by the excitation light or from backscattered illumination light. Assuch, filters (bandpass, monochromatic) can be used to remove background lightor reduce source intensities to appropriate safety levels <strong>for</strong> both the tissue and thelight detection system. Filters can also be applied to the source beam to improvespectral purity and/or to enable spectroscopy.4. For single wavelength detection and/or spectrally-unresolved total intensity,a photomultiplier tube or photodiode is used, whereas <strong>for</strong> spectral detection,a charged coupled device (CCD) or spectrograph/monochrometers is used.Conversion of detected light to electrical signal generally requires standardanalog-to-digital circuitry.i=017.2.2 Classification of <strong>Fiber</strong> Optic <strong>Sensors</strong> <strong>for</strong> Biomedicine<strong>Optical</strong> fiber sensors can be divided into two main categories based on the sensingmechanism: direct and indirect. Direct sensors (e.g., photometric sensors)
664 L.C.L. Chin et al.utilize the tissue itself to modulate the illuminating light, whereby the collectedlight is the result of backscattering directly from the interrogated tissue or tissuefluorescence/Raman induced by an optical source. Indirect sensors employ an intermediaryin response to the tissue property of interest (e.g., temperature, enzymepresence). Indirect sensors can be subdivided into intrinsic, which utilize the fiberitself (core and/or cladding) as the sensing element, and extrinsic, which incorporatean additional sensing element at the fiber end (e.g., transducer or substrate).Examples include physical sensors that employ miniaturized transducers that modulatethe light in response to such physical parameters as temperature, pressure andradiation dose. Chemical or biosensors evaluate the change in a molecular reagentattached to the end of the fiber via spectroscopic or fluorometric measurement. Suchsensors have been utilized <strong>for</strong> the measurement of pH, glucose, and other intrinsicmetabolites. Figure 17.2 presents a diagrammatic overview of the classificationschemes <strong>for</strong> optical fiber sensors in biomedicine.The primary discussion in this chapter focuses on photonic sensors, since thisis the most relevant sensor type in the biophotonics community. Depending onthe clinical purpose (diagnostic or dosimetric), photonic sensors offer a range ofpotential modalities that provide unique physical measurements including whitelight spectroscopy, fluorescence, Raman scattering, optical coherence tomography(OCT), and polarimetry. Of particular importance <strong>for</strong> sensor design is the choiceof the appropriate modality <strong>for</strong> the given application. Table 17.1 lists the variousmodalities discussed in this chapter, including an overview of the relevantphysical measurements, their advantages and disadvantages, and their potentialapplications.Fig. 17.2 Classification schemes <strong>for</strong> optical fiber sensors in biomedicine
17 <strong>Optical</strong> <strong>Fiber</strong> <strong>Sensors</strong> <strong>for</strong> <strong>Biomedical</strong> <strong>Applications</strong> 665Table 17.1 <strong>Optical</strong> fiber sensor modalities to be discussed in this chapter, listing the physicalmeasurements, applications, advantages and disadvantagesModalityDetection/determination <strong>Applications</strong> Advantages DisadvantagesWhite lightspectroscopyFluorescenceRamanOCT• absolute lightintensity• optical properties• chromophoreconcentration• scatterer spacingand density• oxygen saturation• fluorescenceintensityoptical propertiesfluorophoreconcentration• metaboliteconcentration• optical properties• tissuecompositionalin<strong>for</strong>mation• oxygen saturation• tissuemicrostructure• blood flow/Doppler• birefringence• diagnosis• oximetry• light intensitydosimetry• chromophore/drugconcentration• diagnosis• treatmentevaluation• fluorophore/drugconcentration• diagnosis• treatmentmonitoring/evaluation• diagnosis• treatmentmonitoring/evaluation• tissue functionalstatus (Dopplerblood flowmaps)• range ofsamplingvolumes• relativelyinexpensive• potentiallysimple dataprocessing• directmeasurement• wide array ofpossiblecontrast agents• high specificity• 3-D imaging• non-imaging• manycontributionsto the measuredsignal• uncertainsampling volume• auto fluorescencemay interfere• weak signals• long(er)integration times• need carefulanalysis toremoveconfoundingsignals• limitedpenetrationdepthThe choice of modality, in turn, guides a specific probe design that must considerthe accessibility of the target site. Superficial (exposed surface) tissue cantypically be examined using surface reflectance or endoscopic sensors, while internalstructures may require sensors suitable <strong>for</strong> interstitial insertion. Furthermore, inthe case of superficial targets, layered structures may require additional design considerations<strong>for</strong> spatial-depth discrimination. Such factors can be adjusted <strong>for</strong> usingappropriate source-detector geometry and fiber-tip design.While the specifics of actual sensors will be reviewed, we also examine thephysics behind sensor design parameters and their relation to light collection efficiencyand sampling volume in turbid media. By focusing on the physics of sensordesigns, it is hoped that the reader can extend the in<strong>for</strong>mation of this chapter to aspecific biomedical application.
666 L.C.L. Chin et al.17.3 <strong>Fiber</strong> Fundamentals17.3.1 Light TransmissionA typical optical fiber consists of (1) a central core of refractive index n 1 ;(2)acladding that encases the core with index of refraction n 2 (with n 2 < n 1 ); and (3)a buffer coating – also known as a “jacket.” The role of the buffer is to improvethe mechanical robustness of the fiber and minimize structural compromise frombending. A step-index fiber is shown in Fig. 17.3 which is characterized by a discretestep in the index of refraction at the boundary of the core (n 1 ) and cladding. Anothercommon design, the graded-index fiber, where the index of refraction decreasesgradually from the center of the core to the cladding, and will be discussed later.When a light ray is directed at the entrance of a fiber with core index of refractionn 1 , a portion of the incoming beam is reflected back into the surrounding medium(index of refraction n 0 ), while a portion of the beam is transmitted into the fiberaccording to Snell’s law:sin(α 1 )sin(α 0 ) = n 0n 1(17.2)where α 0 is the incidence angle and α 1 is the transmission angle into the fiber.Light transport inside optical fibers is based on the concept of total internal reflection,which requires that n 2 < n 1 and that the incidence angle at the core/claddingboundary is greater than a critical value, θ c according to:sin (θ c ) = n 2n 1(17.3)Light rays incident at angles less than θ c such as at point B in Fig. 17.3 (i.e., more“normal” to the interface) are refracted from the core into the cladding and, hence,do not propagate along the fiber. Now, it is clear from Fig. 17.3 that α c = 90 ◦ − θ c .Hence, in order to propagate light along an optical fiber, it is necessary to direct lightFig. 17.3 <strong>Optical</strong> fiber design. n 0 , n 1 and n 2 are the refractive indices of the surrounding medium,fiber core and fiber cladding, respectively. Light rays incident at point A with angles greater than θ c(Eq.(17.3)) undergo total internal reflection and constitute the propagating light modes; those lightrays incident at angles smaller than θ c (point B) are refracted from the core into the cladding anddo not propagate down the fiber. A step-index fiber is shown <strong>for</strong> illustration (sharp n 1 /n 2 boundary)
17 <strong>Optical</strong> <strong>Fiber</strong> <strong>Sensors</strong> <strong>for</strong> <strong>Biomedical</strong> <strong>Applications</strong> 667into the fiber such that it refracts at or below the critical propagation angle, α c .Themaximum angle of incidence that a light ray can enter a fiber and be transportedalong the fiber (propagate at or below α c ) is known as the acceptance angle, θ a .For fiber characterization, the acceptance angle is typically reported in terms of anumerical aperture, NA:NA = n 0 sin (θ a ) =√n 2 1 − n2 2(17.4)Hence, <strong>for</strong> a given acceptance angle, light enters (or leaves) the fiber within anacceptance cone of 2θ a .From Eq. (17.4), it follows that the NA can be expressed in terms of the refractiveindices of the fiber material (core n 1 , and cladding n 2 ), but is also dependent on therefractive index of the surrounding environment n 0 . As such, compared to an airenvironment (n 0 =1), the acceptance angle will be correspondingly smaller in water(n 0 =1.33). The NA of an optical fiber characterizes not only its ability to collectlight from a source, but also preserve the light inside the fiber.The choice of wavelength range plays an important role in the selection of appropriatecore and cladding materials that allow <strong>for</strong> suitable transmission of light.Conventional glass and plastic core fibers, highly transparent to wavelengths in thevisible spectrum, have absorption losses on the order of 0.1% per meter or less.However, optical transmission in the ultraviolet (UV) or infrared (IR) wavelengthranges requires the use of high-grade fused silica cores. In these wavelength ranges,the presence of hydroxyl (OH) radicals in the silica core strongly affects the absorptionand transmission characteristics of the fiber. For wavelengths in the UV region(200 nm < λ < 360 nm), high-OH fibers are preferred, whereas in the near infrared(NIR) and up to ∼2400 nm, low-OH concentration fibers provide the most favorabletransmission. In the infrared region beyond ∼2400 nm, absorption by silica beginsto dominate. In this regime, sapphire fibers provide superior transmission but cansuffer additional signal decreases due to high reflection losses at the fiber interface(because of sapphire’s high refractive index).17.3.2 <strong>Fiber</strong> Classifications<strong>Fiber</strong>s fall into two broad categories, single mode or multi-mode. A mode is definedas a set of similar paths that light rays travel along the fiber. The term single mode isused to describe a fiber that supports one transmission mode, whereas multi-modedescribes a fiber that can support more than one transmission mode. Multi-modefibers are commonly employed in biomedical applications and come in two basicconfigurations: step-index and gradient index.The step-index multi-mode fiber is the simplest design, and operates in the fundamentalmanner described in Section 17.3.1. Its name comes from the sharp changein refractive index in the fiber material at the core-cladding boundary. In contrast,with gradient-index fibers, the refractive index decreases gradually from the centerof the core to the cladding.
668 L.C.L. Chin et al.Fig. 17.4 Multi- mode (highNA, large core diameter) andsingle-mode (lower NA,smaller core diameter) fibersMulti-mode, step indexMulti-mode, graded indexSingle-modeThe concept of modes is illustrated in Fig. 17.4. <strong>Fiber</strong>s with a high NA allow lightat a large range of incident angles to enter the fiber. The result is that incoming rayswith smaller angles of incidence will travel shorter path-lengths closer to the central(optic) axis of the fiber (low order modes), while rays entering at larger incidentangles will travel longer path-lengths (higher order modes). Further, impurities inthe fiber material of both multi-mode and single-mode fibers can cause leaking at thecore/cladding interface. However, due to the longer distance traveled by higher ordermodes, the effect is enhanced with multi-mode fibers leading to greater transmissionlosses compared to single-mode fibers.The number of modes that are transmitted along a fiber is determined by thenormalized frequency parameter, VV = πd NA (17.5)λwhere d is the core diameter and λ is the input wavelength. For step-index andgraded-index fibers the number of modes, N m can be calculated via:N m = V22(step-index) (17.6)N m = V24(graded-index) (17.7)
17 <strong>Optical</strong> <strong>Fiber</strong> <strong>Sensors</strong> <strong>for</strong> <strong>Biomedical</strong> <strong>Applications</strong> 669Not surprisingly, single-mode fibers typically consist of a small core diameter(50 μm) and a corresponding larger numerical aperture (0.2–0.4 <strong>for</strong>silica-core fibers).When a high coupling efficiency is desired, the optical fiber should have a largeNA and the beam spot diameter, d, should be focused such that the focal length, F,of the coupling lens satisfies the condition:F >d2NA(17.8)However, a large NA results in a larger spectral dispersion of optical pathlengths(since n is typically a function of wavelength) that leads to a degradation of opticalin<strong>for</strong>mation at the distal end through spectral dispersion.The propagating modes (and hence NA) of an optical fiber are important <strong>for</strong> bothoptical coupling efficiency and transmission characteristics. For example, followingan initial short (picosecond range) injection of light into a step index multi-modefiber, the differences in path-lengths among the various modes causes the light tospread out in time as it propagates along the fiber. This temporal broadening of thelight pulse is known as modal dispersion, and is an undesirable effect in pulsedlight/time-domain optical studies.To minimize temporal dispersion in multi-mode fibers, a gradient-index designcan be employed. Graded-index multi-mode fibers have smaller core diameters (50–90 μm) compared to step-index multi-mode fibers (> 100 μm). With graded-indexfibers the index of refraction of the core decreases continuously between the centralaxis and the core-cladding boundary. The index gradient causes light rays tobend smoothly rather than sharply as they approach the core-cladding interface, andallows higher-order modes to travel more in the outer lower-index portion of thecore. This effectively reduces the differences in propagation time, thereby reducingtemporal modal dispersion.While graded-index fibers reduce modal dispersion, two other kinds of dispersionstill exist: material dispersion and waveguide dispersion. In essence, wavelengthdependentfiber material properties and optical/geometric characteristics of thesensors can cause spatial and/or temporal separation of the different optical wavelengthsif a broad-band source is used. Material dispersion arises from the multiplewavelengths present in a laser pulse that result in different refractive indices ateach wavelength. This effectively causes each wavelength to travel at differentspeeds and disperse. Similarly, waveguide dispersion (present in step-index singlemode fibers as well) also occurs due to the different wavelengths present ina light pulse. Here, the different traveling speeds are due to core and cladding.Further, the other basic components of the fiber sensor system (Fig. 17.1) alsoexhibit wavelength-dependent characteristics. These considerations must be takeninto account <strong>for</strong> specific sensor system implementations, especially those employingbroad-band sources <strong>for</strong> tissue spectroscopy with pulsed sources <strong>for</strong> time-of-flightsensor measurements.
670 L.C.L. Chin et al.The differences amongst multi-mode and single-mode fibers and step-index andgraded-index fibers lead to interesting design considerations when optimizing fiberopticsensors.Specific fiber types may be chosen based on dispersion characteristics, transmissioncapabilities, coupling efficiencies, mechanical flexibility, and biologicalcompatibility, among other criteria.Since single-mode fibers retain the coherence properties of the input laser light,they are commonly employed <strong>for</strong> fiber-based interferometers (e.g., OCT sensors).On the other hand, multi-mode fibers with larger NA and core diameter are typicallysimpler to couple and can transport and collect higher light signals that maybe necessary <strong>for</strong> achieving adequate signal to noise. The choice of appropriate fibermaterials must also be considered, to minimize transmission losses <strong>for</strong> probing tissuesat specific wavelengths; while generally not a major consideration in the visiblerange, this becomes more important <strong>for</strong> UV and IR fiber sensors.17.3.3 <strong>Fiber</strong> BendingBending of an optical fiber can lead to light leakage at the area of sharp curvature.When a light ray reaches the fiber bend, higher-order modes that hit the claddingbeyond the critical angle leak out of the fiber. Such an effect is less likely <strong>for</strong> lowerorder modes. However, low order modes can be converted to higher order modesthat then may leak out the fiber at subsequent bends. Although large bends leadto greater light loss, a series of small micro-bends can also lead to a significantdecrease in transmission.While light loss through micro-bending is generally an unwanted side-effect thatleads to signal degradation, the effect can have a number of useful applications.A fiber may be purposely twisted to homogenize and smooth the output beam –also called mode mixing – by converting lower order modes to higher order modes.Similarly, mode stripping is the application of local pressure to optical fibers tomodulate the output light patterns exiting a fiber.Temperature and pressure fiber optic sensors can be constructed to utilize thelight loss from fiber bending. Figure 17.5 illustrates a simple micro bending sensor.<strong>Optical</strong> fibers are positioned between a set of plates with indented groves such thatwhen pressure is applied to the plates micro-bending occurs leading to a decreasein transmitted optical power. Alternatively, the fibers may be encased in a temperaturesensitive material which constricts when cooled or heated, again creating lightmodulation through the resultant change in fiber shape.17.3.4 <strong>Fiber</strong> Tip Geometries <strong>for</strong> <strong>Biomedical</strong> <strong>Sensors</strong>Light exiting or entering an optical fiber can be redirected by sculpting or polishingthe fiber tip into a desired configuration. Modified fiber tips are appealing compared
17 <strong>Optical</strong> <strong>Fiber</strong> <strong>Sensors</strong> <strong>for</strong> <strong>Biomedical</strong> <strong>Applications</strong> 671Fig. 17.5 <strong>Fiber</strong> opticpressure sensor based on lightloss from fiber bending.Arrows indicate the directionof light travel. As the fingerapplies pressure to the tubing,fiber bending results in lightloss that is manifested as aloss in detected light signal(from www.sensors.com2008)to external optical components <strong>for</strong> a number of reasons. First, they are more compactand reduce overall system cost by reducing the number of total system components.Second, appropriate tip modification improves optical efficiency, reliabilityand durability by minimizing the number of optical interfaces (coupling/insertionlosses, unwanted reflections), compared to the use of external optics coupled to thefiber end.A variety of modified fiber tip strategies are available. Implementations that canadjust the spot size and divergence of emitted or collected light and/or steer anddirect the beam are all possible. In the following section we briefly review the theory,applications and construction of tapered, ball and side-firing fiber tips. We alsodiscuss the rationale <strong>for</strong> shielding cap use in tissue.The described fiber tips are often employed in reflectance sensors to adjust theirprobing and detection properties, while minimizing sensor size by avoiding the additionof external optics (see Section 4.1). Spherical and linear diffusers, typicallyemployed in interstitial applications, will be described in Section 17.4.3.1.17.3.4.1 Tapered <strong>Fiber</strong> TipsTapered (Fig. 17.6b) and ball-lens terminated (Fig. 17.6d) shaped fiber tips increasethe light intensity (fluence rate) close to the fiber tip.Tapered fibers are constructed by increasing or decreasing the diameter of thefiber at either the distal (emitting/detecting) or proximal (laser incident) end. An“up” tapered fiber increases the diameter of the fiber end while a “down” taperedfiber decreases the fiber diameter (see Fig. 17.7).Tapered fiber optics is governed by [4]:d 1 sin a 1 = d 2 sin a 2 (17.9)
672 L.C.L. Chin et al.a) b) c) d) e)Fig. 17.6 Typical fiber tip modifications (a) plane-cut fiber (b) tapered fiber (c) side-firing(d) ball-lens terminated fiber (e) spherical diffuser. Small triangles and arrows are guides <strong>for</strong> theeye to indicate the direction of light propagation (after Verdaasdonk and Borst [3])Fig. 17.7 Geometry of incident and reflected rays <strong>for</strong> tapered fiber tips: (a) up(b) down.Theentrance α 1 and exit α 2 angles of the light rays are governed by Eq. (17.9) (after PolymicroTechnologies [4])Light entering the taper will be reflected back and <strong>for</strong>th with a decreasing (downtapered) or increasing (up tapered) angle of incidence along the taper-length at thecore-cladding interface. This will continue until the incident angle of the travelingphotons exceeds the critical angle. At this “leaking” point, the photons are refractedout of the fiber. Hence, a “down” tapered tip can be employed to increase the divergence(numerical aperture) while decreasing the spot size of light exiting near thefiber tip. Conversely, an “up” tapered fiber can be used to reduce the NA and enlargethe spot-size of the exiting light. Thus, a down taper tip is a light “spreader” whilean up taper is a light “concentrator.”
17 <strong>Optical</strong> <strong>Fiber</strong> <strong>Sensors</strong> <strong>for</strong> <strong>Biomedical</strong> <strong>Applications</strong> 67317.3.4.2 Ball Shaped <strong>Fiber</strong> Tips<strong>Fiber</strong> tips can be also constructed to act as parallel focusing lenses. Such tips includehemispherical elements attached to a plane cut fiber, or ball-shaped endings whichare sculpted from the fiber core. The resulting curvature focuses the incominglight rays such that a higher density of light is present near (beyond) the fiber tip(Fig. 17.6d).A lens bends and focuses light by refracting it. The refraction is accomplishedby having different rays pass through different optical thicknesses, thus enablinga lens to focus a (collimated) beam to a (focal) point. Typically, varying opticalthickness means a transparent optical element made from a material with a givenrefractive index n 0 , shaped to have the desired physical thickness profile (e.g., alens-shape). However, especially when working in confined spaces, it is possible tofix a shape (e.g., cylinder) and have the refractive index vary in a particular fashion,generating the desired “variable optical thickness” effect. Lenses manufactured withthis approach are known as GRINs (GRadient INdex). For example, in the context offiber optics, cylindrical shaped GRIN lenses with a radially-varying refractive indexprofile (highest at the centre, dropping off with radial distance, often parabolically,towards the edges) are very popular. Since the end faces of the GRIN lens are flat,relatively straight-<strong>for</strong>ward coupling to a plane-cut termination of an optical fiber isenabled. In this chapter, several optical fiber sensors employ GRIN lenses in theirdesign (see Figs. 17.21 and 17.22).Alternatively, a fiber tip can be sculpted to a ball shape to adjust beam divergenceand spot size and vary the depth of focus of a probing light source. In air, the irradiationproperties of spherical tips can be described using paraxial theory [3], whichprovides an estimation of the position of highest light intensity as a function of thesphere radius.Paraxial theory predicts that a beam exiting a ball shaped tip in air will be focusedto a point at a distance, F 1 , given by:F 1 = R sn 0n 1 − n 0(17.10)where R s is the radius of the ball tip.A beam with finite diameter (i.e. containing multiple rays) will create an irradiationprofile with a “waist”, which is the convolution of “multiple” focal pointsdisplaced laterally from the central axis (all also located at also F 1 ).Equation (17.10) predicts that <strong>for</strong> a ball-shaped tip positioned in water, the focalpoint and region of highest intensity will be located more distally to the ball tipcompared to when the ball tip is in air (as n 0 is now greater). In water, the resultingrays are focused so far from the optical axis that the overall beam diameter at F 1 islarger than the beam diameter at the exit surface of the ball tip. This is despite thefact that the individual rays <strong>for</strong>ming the beam profile are still focused distally at F 1 .In this case, the region of highest intensity is now located between the distal ballsurface and F 1 .
674 L.C.L. Chin et al.Fig. 17.8 Geometry of ball-lens tipped fiber used in paraxial theory: R f is the fiber radius, R s isthe ball tip radius, D f is the distance between the focal point inside the fiber to the end of the fiber,R f is the radius of the fiber, F 2 = D f + R ′ s + R s the proximal focal point, while n 1 and n 0 are theindex of refraction of the ball tip and air, respectively (after Verdassdonk and Borst [3])Paraxial theory can also be used to estimate the conditions under which a convergingbeam profile is converted into a diverging beam profile. As illustrated inFig. 17.8, consider a set of rays originating from a point F 2 within the fiber, thatconverge to a distal focal point, F 1 . F 2 is also known as the proximal focal point.Using geometry, a relationship can be derived from the radius of the ball tip, R s ,the fiber radius, R f , the refractive index of the surrounding medium, n 0 , the index ofrefraction of the fiber/ball material, n 1 , and the divergence angle, θ.From Fig. 17.8:F 2 = D f + R ′ s + R s (17.11)Here R ′ s = √R 2 s − R2 fis the radius minus the portion of the ball that is withinthe fiber itself while D f = R f / tan θ is the distance from F 2 to the end of the fiber.Substituting <strong>for</strong> D f in Eq. (17.11):F 2 = R s +√R 2 s − R2 f+ R f/tan θ (17.12)Paraxial theory states the proximal focal point (located within the fiber), F 2 ,isgiven by:F 2 = R sn 1n 1 − n 0(17.13)Inserting Eqs. (17.12) into (17.13) and expanding, we find that the ratio of thesphere radius and sensor is governed by the following relationship:R sR f= T (N − 1) +√T 2 − N (N − 2)N (N − 2)(17.14)where N = n 1 /(n 1 − n 0 ) and T = 1/ tan θ.
17 <strong>Optical</strong> <strong>Fiber</strong> <strong>Sensors</strong> <strong>for</strong> <strong>Biomedical</strong> <strong>Applications</strong> 675The ratio, R s /R f , can be used to estimate under what conditions a ball-shapedtip loses its focusing effect. However, it should be noted that the theory is only afirst order approximation and ignores the effects of secondary reflections, whichcan lead to significant deviations. In such cases, ray-tracing provides more reliablepredictions of the resulting beam profiles [3].Both tapered and ball-shaped fiber tips provide a flexible approach <strong>for</strong> focusingincoming and outgoing light and can be optimized <strong>for</strong> a variety of applications.These include improving the coupling efficiency with the input laser or otheroptical components, improving the detection efficiency with a photodiode or photomultipliertube or, <strong>for</strong> therapeutic applications, per<strong>for</strong>ming high power laserablation.17.3.4.3 Side-Firing TipsSide-firing tips (Fig. 17.9c) redirect the light over a range of angles away fromthe fiber axis. Side-firing fibers are often employed in therapeutic applications suchas photodynamic therapy, thermal therapy, or tissue ablation target scenarios withlimited room or maneuverability. Recently, side-firing tips have also been employedas optical sensors <strong>for</strong> measuring the radiance distribution in turbid media [5, 6].Template <strong>for</strong>holding fibersLight InSensorwallTissuea)Fig. 17.9 (a) Lineararrangement of reflectancesensors (after Wang andJacques [9], with permissionfrom Applied Optics)(b) Circular arrangement ofreflectance sensors: (i) sourcefiber (ii) detection fibers(iii) calibration source (afterRef. [10])b)
676 L.C.L. Chin et al.An angled-tip with ∼10 ◦ angle can also be used to minimize specular reflection <strong>for</strong>light-scattering reflectance and/or OCT sensors.Typically, a side firing fiber with an NA of 0.22 should be polished at anangle >40 ◦ to ensure total internal reflection. For those light rays reflected at thesurface, the exiting beams will be further focused by the curvature of the core, muchlike a cylindrical lens.It is important to note that even if the fiber tip is polished at an angle exceedingthe angle of total internal reflection, a large portion of rays can still be refractedout the fiber tip. This is because the light traveling within the fiber carries a broadangular distribution such that not all rays can be internally reflected (recall discussionof fiber modes). In addition, when the surrounding environment is water ortissue, the total reflection capabilities of many side-firing tips (calculated with air asthe external medium) are lost. In such cases, a transparent shield can be positionedaround the tip to allow a surrounding air medium next to the tip, thus preserving itsside-firing properties.Alternatively, right angle micro prisms can be attached, using optical adhesive,to the end of a plain-cut fiber [5, 6]. Here, total internal reflection occurs at theprism’s hypotenuse to direct light to/from the fiber. One advantage of this approachis that the prisms can be coated with a thin layer of aluminum to increase theamount of light reflected at the prism hypotenuse (and to capture the off-axis raysthat are beyond the total internal reflection condition). Since aluminum is an efficientreflector over a broad range of wavelengths, Al-coated prisms are particularlyuseful to minimize light leakage in spectroscopic and fluorescence applications.However, the tips can be extremely fragile and typically require a surrounding glasscover to prevent the prisms from being unattached from the fiber during clinicalutilization.17.3.5 <strong>Fiber</strong> Tip ManufacturingThe majority of the specialized fiber tips described in this section are availablevia a number of commercial vendors, <strong>for</strong> example OZ Optics (www.ozoptics.com), Polymicro Technologies, (www.polymicro.com), and LaseOptics (www.laseoptics.com) among others (note that these company names are included <strong>for</strong> illustrativepurposes only, and in no way imply commercial endorsement by the authors)These vendors employ state of the art laser micro-machining equipment <strong>for</strong> sculptingtheir fiber tips. However, in-house approaches often offer a more economicaland quicker alternative to commercial vendors.Verdaasdonk and Borst [3] described a simple method <strong>for</strong> manufacturing ballshapedfiber tips using a high-temperature burner. Following stripping of the bufferand cladding, a standard silica fiber is exposed to a flame with local temperaturesexceeding 2000 ◦ C. As a result of the surface tension of the liquid silica, the meltedcore <strong>for</strong>ms a near spherical droplet that eventually solidifies into a ball-shaped tip.
17 <strong>Optical</strong> <strong>Fiber</strong> <strong>Sensors</strong> <strong>for</strong> <strong>Biomedical</strong> <strong>Applications</strong> 677The authors found that the best approach was to position the flame horizontally withthe fiber held beneath the flame at 20–45 ◦ from the vertical axis.A similar approach can be employed to manufacture tapered fibers. Here, the last1–1.5 cm of the fiber is stripped down to the buffer. The fiber is then positionedin an upside down fashion with a small weight (several hundred grams) attachedto the tip. By heating the fiber at the midway point of the stripped region, gravitythen draws the molten silica into a taper via the downward pulling weight. The taperangle can be refined by adjusting the fiber diameter, melted volume, and amount ofpulling weight. Finally, the taper end is shaped to a point by melting or polishing.Right-angle side-viewing fiber tips can be created by polishing a plane-cut fiberat an angle equal to or slightly exceeding the critical angle in the medium. In addition,a sputtering machine can be employed to coat the polished surface with a thin,reflecting metal layer (i.e. gold, silver, aluminum) to enhance and supplement thetotal internal reflection effect.Finally, shielded fibers can be constructed by encasing the sculpted fiber tipsusing a clear glass sheath. The glass sheath can be constructed using a glass capillarytube of appropriate diameter by melting the end of the tubing with a flame. Thesheath is then attached to the fiber at a location downstream from the tip using aclear UV-cured or chemically cured epoxy, thereby creating an air bubble inside topreserve the tip/air interface.17.3.5.1 <strong>Biomedical</strong> DeploymentCombinations of plane-cut, GRIN/ball lens/scattering-sphere terminated, tapered,and side-firing geometries have been employed in the construction of various opticalfiber sensors. The different combinations allow <strong>for</strong> flexibility in desired probingdepths and/or collection efficiency of detected light. The relative merits of theselected probe designs will be discussed in subsequent sections of this chapter inthe context of a particular modality/application.17.4 <strong>Fiber</strong>-Based White Light Spectroscopy17.4.1 Reflectance Geometry17.4.1.1 Conventional Reflectance Sensor DesignLight that enters tissue will be scattered and absorbed. The portion of scattered lightthat escapes the tissue in the backwards hemisphere is termed the diffuse reflectance(e.g., semi-infinite planar geometry, surface irradiation conditions). The diffusereflectance contains in<strong>for</strong>mation regarding the scattering and absorption propertiesof the tissue. The non-invasive nature of surface-probe-based reflectance measurementscan furnish a well sampled data set close to and far from the source, yielding
678 L.C.L. Chin et al.a spatial (and perhaps spectral) reflectance profile well suited <strong>for</strong> fitting to a theoreticalmodel. As summarized in Table 17.1, the measured reflectance data canbe employed to retrieve tissue optical properties, chromophore concentrations, andtissue scattering parameters.As shown in Fig. 17.9, conventional reflectance sensors employ a single excitationsource that injects light into the tissue surface, surrounded by several detectionfibers (5–10) at varying distances. To extract the tissue optical properties, the measuredreflectance must be fit to an analytic equation, which allows <strong>for</strong> separationof the absorption and scattering properties [7–9]. The diffusion approximation <strong>for</strong> ahomogeneous, semi-infinite slab is often employed as a model <strong>for</strong> the purposes ofdata fitting. Since diffusion theory is valid at positions greater than several meanfreepaths (mfp) from the source, this implies source-sensor positions between 0.2and 2 cm <strong>for</strong> most tissues. A key advantage of reflectance geometry is that onlyrelative data is necessary <strong>for</strong> determining the optical properties.Two approaches have been devised <strong>for</strong> fitting reflectance data. The first is toemploy a normal-incidence source and fit the spatially resolved reflectance profile.To enable quantitative data fitting, the entire reflectance profile is normalized to themeasured signal at a selected source position. Accurate optical property separationand determination requires that at least one detector fiber be positioned close to thesource (∼0.75–1 mfp). This is because measurements close to the sources are moreindicative of the reduced scattering coefficient, while optical attenuation far fromthe source represents a combination of both scattering and absorption [10], which isembedded in the effective attenuation coefficient, μ eff .An alternative configuration, suggested by Wang et al. [9], is to employ anoblique incident source. Here the relative shift in the center of diffuse reflectancefrom the entry point is employed as additional in<strong>for</strong>mation to extract the tissueoptical properties.The detection fibers can be packaged in a linear [9] (Fig. 17.9a) or in a circular(Fig. 17.9b) arrangement [10]. The advantage of the circular geometry is that asingle source, centered with respect to the detection fibers, can be employed <strong>for</strong>convenient calibration. The large range of source-detector separations results in arange of reflectance measurements that can span ∼ four orders of signal magnitude,complicating simultaneous reflectance measurements at all detector positions. Toreduce the dynamic range requirements, neutral density filters are often utilized toattenuate the signals at the closer sensor distances [10]. An alternative approach,suggested by Fuchs et al. [11], is to employ variable integration times (hundredsof milliseconds to a few seconds range) combined with an increased number ofdetection fibers at larger source-sensor separations, to enhance the detection of lowsignals.17.4.2 Depth SensitivityDepth-sensitive detection is important <strong>for</strong> fiber-optic assessment of layered structures.Specific clinical applications include evaluating the dyplastic state of a
17 <strong>Optical</strong> <strong>Fiber</strong> <strong>Sensors</strong> <strong>for</strong> <strong>Biomedical</strong> <strong>Applications</strong> 679particular tissue layer or determining the local uptake of light-activated drugs.Depending on the specific application, a reflectance sensor can be designed to preferentiallyprobe the superficial layer (e.g., 200–400 μm below tissue surface) orfurnish in<strong>for</strong>mation about deeper tissue layers (e.g., 1–2 cm below the surface).In Section 17.4.1.1, we described the conventional design <strong>for</strong> typical reflectancesensors. These sensors are not optimized <strong>for</strong> depth localization. In the following, wefocus on design approaches that can be employed to refine the depth selectivity of areflectance sensor.In general, two approaches can be employed to separate single or superficiallyscattered photons from bulk photons that undergo multiple scattering events.The first approach is to maintain the conventional reflectance sensor geometrybut employ polarization, time-domain, or frequency domain gating techniques byappropriate selection of source and detector characteristics. In this case, multi-layerlight modeling may also be required to properly extract the appropriate depth in<strong>for</strong>mation.The second approach is to adjust the geometric attributes of the source anddetection fibers employed in the sensor. Here, geometrical parameters of interest arethe source-detector (S-D) separation, fiber numerical aperture, fiber diameter, andprobe-tissue spacing.The principles behind these approaches, as well as specific selected examplesfrom the literature, are provided in the following sections.17.4.2.1 Steady-State Spectroscopy: Geometric ApproachesSource-Detector SpacingPatterson et al. [12] were able to obtain the average depth from which reflectancein<strong>for</strong>mation is acquired. From diffusion theory, the steady-state, semi-infinite geometrysolution <strong>for</strong> the fluence rate at a point P(κ,z) in a turbid medium (e.g., tissue) isgiven by:⎛[φ (κ, z) = 1exp{−μ eff (z − zo ) 2 + κ 2] 1/2 }[ (z )exp{−μ ] } ⎞2 1/2eff − zp + κ2 ⎜4πD ⎝ [(z − zo ) 2 + κ 2] −1/2[ (z ) ]⎟2 1/2 ⎠− zp + κ 2(17.15)where κ is a radial distance coordinate, z is a depth coordinate (i.e. below the tissuesurface), D = 1 / 3 ( μ a + μ ′ s)is the diffusion coefficient, μeff = is the√μaDeffective attenuation coefficient, z o = ( μ ′ s) −1 is the distance of initial scatter froman isotropic point source, z e = (5.91)D is derived from the extrapolated boundarycondition and z p =−z o − 2z e is the location of a negative image source requiredto meet a zero-fluence-rate boundary condition [12]. Physically, the extrapolatedboundary condition assumes that the fluence goes to zero at a certain distance abovethe tissue surface [13].The probability that a photon would be re-emitted from the tissue slab anddetected by the fiber sensor at location, r, located at the surface, can then be
680 L.C.L. Chin et al.described by an escape function, E, which is equivalent to the photon current acrossthe boundary at z = 0, is given by Fick’s Law as:(−D d )dz φ (17.16)Combining Eqs. (17.15) into (17.16) gives the escape function E(κ, θ, z, r):E (κ, θ, z, r) = 1 [ z exp (−μeff k)(μ4π k 2 eff + 1 )− z p exp (μ eff l)(μk l 2 eff + 1 )]l(17.17)where k and l are the positive roots of:z = 0k 2 = (r − κ cos θ) 2 + κ 2 sin 2 θ + z 2(17.18a)l 2 = (r − κ cos θ) 2 + κ 2 sin 2 θ + z 2 p(17.18b)Using Eqs. (17.15) and (17.17), the change in reflectance, R(r), due to a smallabsorbing perturbation, μ a in a small incremental volume, dV, is then:R (r) = μ a φ ( r ′) dV E ( r ′ , r ) (17.19)The mean photon-visit depth, 〈z〉 r , <strong>for</strong> a source-detector separation of r is thengiven by:∫V〈z〉 r =φ ( r ′) E ( r ′ , r ) zdV∫V φ (r′ ) dV E (r ′ (17.20), r) dVUsing Eq. √ (17.20), Patterson et al. [12] examined the change in 〈z〉 r as a functionof δ 1 /2 = 1 / μ eff (Fig. 17.10). They demonstrated that, using a simple empiricalrelationship, a reasonable estimation of 〈z〉 r could be determined from knowledgeof r and δ, alone:〈z〉 r = (rδ)1 /22(17.21)From Fig. 17.10 it is clear that short source-detector separations (lower line)result in shorter penetration depths while long source-detector separations (upperline) result in deeper sampling volumes. Furthermore, the mean penetration depthincreases with decreasing optical attenuation.Multi-distance reflectance probes that rely on diffusion theory <strong>for</strong> data fitting typicallyinvolved source-detector separations of up to ∼2 cm. Such a large probe sizemay pose serious problems when the optical properties vary significantly over theprobe sampling volume (e.g., when evaluating layered structures such as epithelialtissue, or sampling heterogeneous tumors with small localized regions of hypoxia).
17 <strong>Optical</strong> <strong>Fiber</strong> <strong>Sensors</strong> <strong>for</strong> <strong>Biomedical</strong> <strong>Applications</strong> 681Fig. 17.10 Plot of 〈z〉 r ,themean photon visit depth vs.δ 1/2 , the square root of thepenetration depth. Thesymbols representexperimental measurements.The lines are a linear fit of theresulting data <strong>for</strong> eachsource-detector separation,demonstrating an empiricalrelationship of 〈z〉 r = (rδ)1/22as per Eq. (17.21). (Reprintedwith permission from [12])Mean depth (mm)765432r = 20 mmr = 10 mmr = 5 mm100 0.5 1.0 1.5 2.0 2.5 3.0δ 1/2As demonstrated in Section 17.4.2.1, sensors with shorter source-detector separations(2–3 mm) must be employed to confine the volume of interrogation. Anexample of one such sensor (employed by Finlay and Foster [14]) is shown inFig. 17.11 and was used to reveal significant heterogeneities in oxygen saturationin small murine tumor models. However, in these cases diffusion theory isno longer valid. As such, when short-detector spacing is required, alternative <strong>for</strong>wardmodels and inversion algorithms must be employed during fitting <strong>for</strong> accuraterecovery of optical properties and their spectral dependencies. A brief summary ofthe different modeling approaches employed <strong>for</strong> short s–d distances is presented inTable 17.2.While an exhaustive explanation of all models is beyond the scope of this chapter,in general, the approaches can be divided into improved analytical solutions of theradiative transport equation such as the δ-P1 approximation, Born approximationand P3 approximations, or fast inversion algorithms based on Monte Carlo generatedDDDDFig. 17.11 Schematic of asmall SD separationreflectance sensor. The source(S) and detector (D)separation distances (mm) areindicated in the figure (afterFinlay and Foster[14])DSD
682 L.C.L. Chin et al.Table 17.2 Analyzing reflectance sensor symbols: models employed <strong>for</strong> short source detectordistancesModel Application ReferencesP3 approximation to RTE Homogeneous medium Finlay and Foster [14]δ-P1 approximation to RTE Homogeneous medium Seo et al. [15]Scaled MC Homogeneous or layered medium Kienle and Patterson [16]Born approximation to RTE Layered medium Kim et al. [17]MC-based neural networks Homogeneous medium Pfefer et al. [18]MC-diffusion hybrid Homogeneous medium Alexandrakis et al. [19]Perturbation MC Layered media Seo et al. [20]MC Monte Carlo, RTE Radiative Transfer Equationdata (Table 17.2). While analytical solutions carry the advantage of rapid <strong>for</strong>wardcalculations, they lack the accuracy of Monte Carlo simulations <strong>for</strong> many realisticscenarios and geometries. In contrast, Monte Carlo-based strategies are typicallyaccurate but often require longer computational/inversion times.Specialized <strong>Fiber</strong> Optic Sensor GeometriesAnother approach to superficial depth localization is to employ source-detector separationsand geometries that are virtually independent of scattering parameters, suchthat the path-length is nearly constant across all wavelengths. This is in contrastto the model based approach because it effectively removes the requirement <strong>for</strong>diffuse light modeling. In these cases, the attenuation effectively reduces to theBeer-Lambert Law, with the change in the measured signal being dictated by theabsorption coefficient at each wavelength.Mourant et al. [21] were the first to demonstrate experimentally that an optimumS-D separation of approximately 1.75 mm resulted in reflectance measurements thatwere virtually independent of the scattering properties of the measured phantom.These findings were later verified theoretically using diffusion theory [22].Amelink and Sterenborg [23] developed an approach termed differentialpathlengthspectroscopy (DPS) <strong>for</strong> measuring the optical properties of superficiallayers of tissue. The method employs a specialized measurement geometry to rejectdiffuse light such that the measured signal is relatively insensitive to the surroundingoptical properties.A dual-use delivery-collection fiber (dc) positioned at the tissue surface is used toboth illuminate and collect reflected light. A second collection fiber (c) is positionedadjacent to the dc fiber. The c-fiber only detects light that is reflected from the tissuesample. The two fibers are positioned touching side-by-side such that their coreto-coredistance is 1.2d fiber where the 1.2 accounts <strong>for</strong> the presence of the fibercladding and core. Light collected from the dc fiber contains a combination of bothsingly backscattered light from small sample depths and multiply-scattered, diffuselight from deeper depths.
684 L.C.L. Chin et al.Fig. 17.12 Monte Carlosimulation showing Beer’sLaw behavior, with anapparent path-length beingdependant only on fiberdiameter: d fiber = 200 μm(open circles, dashed curves),d fiber = 400 μm(filled circles,dotted curves), d fiber =600 μm(open squares, solidcurves), d fiber = 800 μm(filled squares, dashed-dottedcurves). (Reprinted withpermission from [23])R MC (arb. units)10 7μ s = 80 mm −1μ s = 50 mm −1μ s = 25 mm −1μ s = 15 mm −1010 6 μ a (mm −1 )0.20.40.60.81Using Eq. (17.25), the optical properties can be extracted using a non-linearmulti-parameter fit. However, when the fiber diameter is smaller than the mean freepath, single scattering dominates the detected signal. In this regime, the apparent“differential” path-length can be adjusted by changing the fiber diameter. As such,by varying the fiber diameter of the probe, d fiber , the volume of interrogation can byadjusted <strong>for</strong> the application of interest.The technique can, there<strong>for</strong>e, provide highly localized in<strong>for</strong>mation regardingthe absorption and scattering properties of superficial structures with very minimaladjustments in equipment or design. Differential path-length spectroscopy hasbeen employed to per<strong>for</strong>m optical assessment of human breast tissue [25] and oralmucosa [26] as well as localized drug concentrations during PDT [27].Illumination-Collection OrientationA possible method to improve depth discrimination of plane-cut fiber reflectanceprobes is by tilting the orientation of the source or detector fibers at oblique anglesto the tissue surface.Using Monte Carlo simulations, Wang et al. [28] investigated the change in depthsensitivity <strong>for</strong> reflectance sensors when detection fibers with oblique orientationwere employed. In their study, the sensor geometry utilized a single orthogonal
17 <strong>Optical</strong> <strong>Fiber</strong> <strong>Sensors</strong> <strong>for</strong> <strong>Biomedical</strong> <strong>Applications</strong> 685Single illuminationcollection fiber<strong>Fiber</strong> longitudinal axis(normal to surface)Positively Oblique Collection <strong>Fiber</strong>sS-Ddistancea)Orthogonal Collection <strong>Fiber</strong>sc)Negatively Oblique Collection <strong>Fiber</strong>sb) d)Fig. 17.13 Schematic of the fiber geometries employed <strong>for</strong> analyzing the effects of collection fiberorientation angle on average depth of penetration of detected photons in reflectance geometry. Greyboxes represent optional index-matching spacers (after Wang et al. [28])source fiber with detection fibers having varying orientation relative to the surface.The simulated tissue environment mimicked optical properties and geometriesrepresentative of human cervical tissues with a thin 450 μm epithelial layer andunderlying 10 cm of stromal tissue.Figure 17.13 shows the various geometries employed in their study: (a) a singleorthogonally oriented illumination-collection fiber; (b) conventional orthogonalfiber geometry; (c) positively oblique detection fibers; and (d) negatively obliquedetection fiber geometry. An index matching spacer can be used <strong>for</strong> tilted fibersto minimize reflections at the air tissue interface and improve detection efficiency.Their results demonstrated that, compared to a perpendicular orientation, positivetilting of the detection fibers results in overlapping illumination-collection volumethat is shifted closer to the tissue surface.Using a zero degree (normal incidence) single fiber geometry as reference(Fig. 17.13a), the authors observed that the mean penetration depth decreases(becomes more shallow) and photon spatial distribution becomes more localized(i.e. better defined) as the collection angle becomes more positive. Since the photonsexit the tissue obliquely, they require fewer scattering events and smaller scatteringangles be<strong>for</strong>e escaping to be detected. Furthermore, the slanted orientation of
686 L.C.L. Chin et al.the detector improves selection of photons diffusely reflected at small exit angles.The result is that one can obtain improved depth selectivity, and greater sensitivityto optical properties of shallower tissue regions [29–31]. Conversely, increasingthe collection angle in the negative direction preferentially selects photons that havetraversed deeper tissue regions, while also decreasing the overall peak to width ratio.The primary limitation of this sensor-tilting approach is that, to maintain smallprobe dimensions and to prevent mechanical damage, the fibers are generally limitedto a maximum tilt angle of ∼30 ◦ . For superficial layer sensing, however(Fig. 17.13(c)), this upper threshold still results in a sizeable contribution fromphotons that have sampled the deeper stromal regions.A potential solution <strong>for</strong> obtaining a suitable slanted orientation, proposed by thegroup at the University of Texas, is to focus the incident beams using a half-balllens. This approach has been described by Schwarz et al. [32].Figure 17.14a shows the geometry <strong>for</strong> a ball lens probe. The total angular deviationof the incident ray, θ, is the cumulative results of refraction at the entrance andexit interfaces of the ball lens.By geometry (Fig. 17.14b), the angle of incidence, θ i , can be geometricallyrelated to the distance from the centerline of the ball lens, d, and the ball lens radiusand index of refraction, by:sin θ i = d Rθ i = sin −1 d R(17.26a)(17.26b)From Snell’s law, the refracted angle, θ 2 , at the entrance interface is then relatedto the index of refraction of air, n air , and the balls lens, n L :dn airR = n L sin θ 2 (17.27)Since n air = 1, the refraction angle is then:θ 2 = sin −1dRn L(17.28)Per<strong>for</strong>ming a similar calculation <strong>for</strong> the exit angle of refraction, the total angulardeviation of the incident ray, θ, is expressed as:( ) ( ) ( )d ddθ = sin −1 − 2sin −1 + sin −1 (17.29)RRn L Rn Twhere n T is the tissue refractive index.Using the lens, the incident and collected rays are refracted at oblique anglesresulting in a similar distribution that can be obtained by physically tilting thefibers. As the fiber separation increases, the region of intersecting cones moves to
17 <strong>Optical</strong> <strong>Fiber</strong> <strong>Sensors</strong> <strong>for</strong> <strong>Biomedical</strong> <strong>Applications</strong> 687dRθa) b)Normalized Intensity10.80.60.40.2Reflectance Data with 2-mm Ball Lens750 μm separation; 370 nm750 μm separation; 450 nm750 μm separation; 633 nm500 μm separation; 370 nm500 μm separation; 450 nm500 μm separation; 633 nmc)00 200 400 600 800 1000Distance to Target (μm)Fig. 17.14 (a) Ball lens sensor composed of a central collection fiber and two adjacent illuminationfibers. The separation distance of the illumination and collection can be used to adjustthe probing depth of the ball lens sensor: illumination light rays (solid lines), detected lightrays (dotted lines). As reference, the expected thickness of the epithelium (∼300 μm) is shown.(b) Geometry<strong>for</strong>Eq.(17.26). (c) Measured reflectance intensity <strong>for</strong> a thin scattering layer asa function of ball lens sensor to reflecting target separation, <strong>for</strong> two different ball lens sensorillumination-collection fiber separations. Note that the depth sensing capability of the sensor isdemonstrated by the markedly different reflectance profiles at different illumination-collectionfiber separations. (Reprinted with permission from [32])
688 L.C.L. Chin et al.increasingly superficial depths thereby allowing <strong>for</strong> preferential selection of shallowpenetrating photons (Fig. 17.13b).Figure 17.13c demonstrates the effects of the ball lens measured experimentallyusing the geometry of Fig. 17.13a. In these experiments, a thin reflectancetarget (white business paper) was positioned at different distances from the ball lenssensor, and the reflectance intensity measured as a function of sensor-to-target distance.Two different illumination-collection fiber separations were employed (500and 750 μm). As expected, the normalized intensity drops faster at shallower depths,as the illumination-collection fiber separation increases.As noted above, the penetration depth not only depends on physical geometrybut on the optical properties of the tissue; an estimate can be obtained via MonteCarlo simulations [29]. In addition to the half-ball lens, a sapphire window can bepositioned between the lens and tissue surface to further converge the collectionilluminationcones closer to the tissue surface. Arifler et al. [29] have demonstratedthat a half-ball lens probe with source-detector fiber separation of 900 and a 300 μmthick sapphire window can result in >98% of collected photons coming from the300-micron thick epithelial layer (at wavelengths between 450 and 650 nm). Theball-lens sensor has been employed clinically <strong>for</strong> the diagnosis of cancer of the oralmucosa [33].Numerical ApertureThe effect of numerical aperture on probing depth is complex and depends on thecollection angle of the detection fibers. Using Monte Carlo simulations, Wang et al.[28] have demonstrated that, <strong>for</strong> collection angles between 0 and 20 ◦ , an increase innumerical aperture causes a shift to shallower probing depths. The opposite effect isobserved <strong>for</strong> collection angles between 40 and 75 ◦ , whereby the expected probingdepth increases with greater NA. In addition to depth selectivity, NA also plays rolein signal to noise. For example, increasing the numerical aperture from 0.22 to 0.34does not significantly change the probing depth of a reflectance sensor but increasesthe magnitude of the detected reflectance almost two-fold.17.4.2.2 Polarization Reflectance Gating: Steady-State SpectroscopyAn alternative to mechanical modification of the source and detector fiber orientationis to employ reflected polarized light to preferentially select the detectiondepth (optical modification) [34]. Polarized light is quickly depolarized upon multiplescattering. As such, reflected photons that are able to preserve their incidentlinear polarization are typically representative of light scattering in upper layer tissues.In contrast, detection in a crossed-linear sensor picks up mostly depolarizedlight randomized by multiple scattering, indicative of deeper tissue layers (and/orany circularly polarized light that may be present). Hence, the crossed polarizedreflectance can be subtracted from the parallel component to isolate reflectanceoriginating from superficial depths. The resulting polarization measurement D(λ)is given by:
17 <strong>Optical</strong> <strong>Fiber</strong> <strong>Sensors</strong> <strong>for</strong> <strong>Biomedical</strong> <strong>Applications</strong> 689D (λ) = I ‖ (λ) − I ⊥ (λ)I S ‖ (λ) + IS ⊥ (λ) (17.30)Here I ‖ (λ) is the parallel polarized light relative to the incident light, I ⊥ (λ) isthe perpendicular polarized light relative to the incident light, and λ is the wavelengthof the incident light. The denominator is employed <strong>for</strong> normalization andis the sum of the perpendicular, I⊥ S (λ), and parallel, IS ‖(λ), components collectedfrom a diffusing calibration medium. By normalizing, the detected signal nowaccounts <strong>for</strong> systematic sensor parameters such as the source and spectrometerspectral characteristics.A simplified fiber polarization reflectance probe utilized by Johnson and Mourant[34] is shown in Fig. 17.15.The probe is composed of a source (a) and two detection fibers <strong>for</strong> collection ofparallel and cross polarized light. The source and one detection fiber are coveredwith a linear polarizing film while a different cross polarizing film covers the otherdetector. Myakov et al. [35] employed a similar sensor configuration to measure thereflectance spectra of oral cavity mucosa in vivo. The resulting spectra can be fitusing Mie theory to obtain estimates of nuclear size <strong>for</strong> cancer detection. In thiscase, the polarization ratio is related to the average nuclear diameter, ¯d, and thenumber of nuclei per unit volume, ρ, by:D (λ) = I ‖ (λ) − I ⊥ (λ)I‖ S (λ) + a (ρ) B (λ) + b (ρ) S (λ) F (λ) + S (λ) (17.31)IS ⊥(λ)cb a e b a dei) ii)Fig. 17.15 Polarized reflectance sensor: The dotted lines within the sensor are representative ofpolarizing sheets while the parallel lines within the circular fibers are representative of the polarizationorientation: (i) Polarized reflectance probe (front view) composed of an illumination channel(label a) with parallel (label b) and cross-polarized (label c) detection fibers (ii) This probe configurationemploys an illumination fiber (label a) with two parallel detectors (labels b and c) andtwo cross-polarized detectors (labels d and e) such that all four polarization permutations can bemeasured (after Johnson and Mourant [34])
690 L.C.L. Chin et al.with∫F (λ) = p ( θ, λ, ¯d, d ) sin θ dθ (17.32)θ F∫B (λ) = p ( θ, λ, ¯d, d ) sin θ dθ (17.33)θ ηp ( θ, λ, ¯d, d ) = 〈 p ( θ, λ, ¯d, d )〉 ∫ ∞N(d) = p ( θ, λ, ¯d, d ) N (d) dd0(17.34)where d is the diameter of the nucleus, p ( θ, λ, ¯d, d ) is the scattering phase functionaveraged over a distribution of nuclear diameters, N(d), d is the standarddeviation of the average nuclear diameter, θ is the angle between the detection andillumination angles, θ D is the backward scattering angle range, θ F is the range ofscattering angles in the <strong>for</strong>ward direction, a(ρ) and b(ρ) are nuclei density dependentparameters, and S(λ) is the depolarization ratio profile of underlying tissuethat can be determined experimentally. The term p ( θ, λ, ¯d, d ) is based on Mietheory – with the assumption that the nuclei are homogeneous spheres – and containsin<strong>for</strong>mation regarding the nuclear diameter distribution, as well as, the spectraldependence of the scattering coefficient.Groner et al. [36] employed a similar approach to reduce confounding specularreflection signals and enhance the contribution of light detected from deep tissuelayers.17.4.2.3 Time-Resolved Reflectance SpectroscopyDiffusion theory can also be used to obtain the average penetration depth, 〈z〉 r ,asafunction of detection time <strong>for</strong> time-resolved fiber optic reflectance sensors [12].In the time-domain case, we are interested in the fluence rate as a function of timeat source-detector separation, r, and time, t, following an impulse source. Here, thedecrease in photons that escape the tissue due to an absorption inhomogeneity indt ′ at r ′ is:R ( r, t, t ′) = μ a φ ( r ′ , t ′) dV E ( r ′ , r, t − t ′) dt ′ (17.35)Here, φ ( r ′ , t ′) and E(r ′ , r, t − t ′ ) are the time-resolved equivalents to the continuouswave fluence rate and escape function, respectively. They are given by:φ ( κ, z, t ′) = c (4πDc) −3 /2 t ′ −3/2 exp ( −μ a ct ′){ [] [((z − z o ) 2 + κ 2) 2]}z − zp + κ2× exp4Dct ′ − exp4Dct ′(17.36)
17 <strong>Optical</strong> <strong>Fiber</strong> <strong>Sensors</strong> <strong>for</strong> <strong>Biomedical</strong> <strong>Applications</strong> 691E ( κ, θ, r, t − t ′) = 1 2 (4πDc)−3 /2 ∣ ∣ t − t′ ∣ ∣ −5 /2 × exp(−μa c ∣ ∣ t − t′ ∣ ∣ ){ [κ 2 ]× z exp4Dc |t − t ′ |[− z p expl 24Dc |t − t ′ |]} (17.37)where c is the speed of light in tissue.Integrating overall possible time, t ′ , gives the total reduction in photons,R(e, t, t ′ )as:∫ t−|r−r′ | / cR (r, t) = μ a dVφ ( r ′ , t ′) E ( r ′ , r, t − t ′) dt ′ (17.38)|r ′ | / cThe mean penetration depth <strong>for</strong> a source-detector separation of r and time ofdetection, t, is described by:〈z〉 r =∫V zdV ∫ t−|r−r ′ | / cφ ( r ′ , t ′) E ( r ′ , r, t − t ′) dt ′|r ′ | / c∫V dV ∫ t−|r−r ′ | / (17.39)cφ (r ′ , t ′ ) E (r ′ , r, t − t ′ ) dt ′|r ′ | / cEquation (17.39) can be evaluated using numerical integration. An example isshown in Fig. 17.16 <strong>for</strong> a nominal set of optical properties. As expected, it is seenthat increasing the detection time results in deeper sampling volumes. As such, thedepth of penetration can be adjusted at a single source-detector distance by varyingthe detection times of a time-domain reflectance sensor.108Fig. 17.16 Plot of meanphoton visitation depth versusthe square root of thedetection time using a pulsedsource and time-gateddetection system. Hereμ ′ s = 10cm−1 ,μ a = 0.1 cm −1 ,c = 0.214 mm ps −1 ,andthesource-detector distance ofthe surface sensor is 10 mm.(Reprinted with permissionfrom [12])Mean Depth (mm)64200 10 20 30 40 50(Detection time in ps) ^ 0.5
692 L.C.L. Chin et al.17.4.3 Interstitial GeometryThe advent of optical-based treatments such as photodynamic therapy (PDT) andlaser thermal therapy (LTT), often applied interstitially, has increased the necessity<strong>for</strong> corresponding interstitial sensors that can provide in<strong>for</strong>mation <strong>for</strong> pre-treatmentplanning, and <strong>for</strong> on-line monitoring of treatment progress. Interstitial sensors measurethe internal fluence or radiance (see Chapter 2 of this text <strong>for</strong> a review ofthese terms) in a turbid medium to extract in<strong>for</strong>mation on either the light (directionalor integrated) intensity (dosimetry), optical properties (spectroscopy), orextent of treatment effect. The following section reviews the basic design of fluenceand radiance probes, followed by clinical applications specific to the interstitialgeometry.17.4.3.1 Fluence <strong>Sensors</strong>Spherically Diffusing TipConventional interstitial fluence sensors are constructed by attaching a minimallyabsorbing,highly scattering sphere to the end of a plane cut fiber (Fig. 17.17a).Since light entering the diffusing sphere is multiply scattered, the incident light iseffectively collected over all polar and azimuthal angles by the plane cut fiber (typically400–600 μm core diameter) with virtually equal probability over all polar andazimuthal angles. Monte Carlo simulations comparing the fluence with and withouta sensor have demonstrated that spherical fluence sensors with diameters as smallas 0.5–0.8 mm result in minimal perturbation to the true fluence field in the turbidmedium [37].Two approaches have been reported <strong>for</strong> constructing the scattering tip. The firstemploys a UV-curable epoxy polymer mixed with a highly scattering powder (typicallytitanium dioxide) [38]. A plane cut fiber emitting UV light at microwatt powersFig. 17.17 (a) Sphere-tippedfluence probe with scatteringsphere attached to the end ofa plane cut fiber(b) Integrating sphere fluenceprobe with a constructed balltipped fiber coated with a thinlayer of scattering materiala) b)
17 <strong>Optical</strong> <strong>Fiber</strong> <strong>Sensors</strong> <strong>for</strong> <strong>Biomedical</strong> <strong>Applications</strong> 693is shone into the epoxy mixture. The resulting fluence pattern is then an isotropicspherical distribution that <strong>for</strong>ms symmetrically around the fiber tip. Following the<strong>for</strong>mation of the scattering tip, the epoxy is irradiated at higher powers to fullysolidify.A variation of this geometry is to employ a fiber with a ball-shaped tip insteadof a plane cut fiber and grow a thin layer of scattering material around the tip(Fig. 17.17b). The spherically tipped fiber can be purchased through commercialvendors, or constructed in-house by employing a small torch to melt the fiber tip attemperature >2500 ◦ C to the desired ball shape. Here the optical fiber tip acts as anintegrating sphere and requires less scattering epoxy compared to a bare-tipped fiberto fully randomize the direction of the incoming light. An additional advantage ofthis configuration is that if the fluence sensor is employed as an isotropic sphericalsource, higher input powers can be utilized, since the absorbed heat is dissipatedover the entire spherical surface instead of being concentrated in the vicinity of thesmaller bare-tip area.A second method is to attach a pre-fabricated sphere, typically made of Arnite,ceramic, or Teflon, to the end of a bare tip, plane cut fiber [39, 40]. A small hole isbored to the center midway point of the sphere, the sphere is then “skewered” by thefiber and fixed using glue to the end of the fiber tip.The primary weakness of scattering sphere probes is that sizeable diameters(∼1–2 mm) are required to achieve a desired level of collection isotropy and that aninherent “blind-spot” is present at the stem region of the probe. Typically, a 3 mmdiameterprobe can achieve an isotropy to within ± 15%, while a ∼1 mm-diameterprobe is isotropic to within ∼± 20% over a 320 angular range [39, 40]. Finally,during clinical application, the spherical tip can become unattached from the fibercore if the sensor is pulled back too quickly or awkwardly during its positioning,manipulation, or removal.Fluorescent Dye-Loaded TipTo overcome the size limitations of scattering-sphere probes, Lilge et al. [41]developedfluorescent dye-loaded fluence sensors. The use of fluorescent dyes overcomesthe limitations of larger scattering-based spherical sensors, because fluorescenceemission is naturally isotropic. As such, the isotropy of the sensor is dependent onlyon the tip shape and not its size [41].The sensor designs are illustrated in Fig. 17.18. First, a polymethlyl methacrylate(PMMA) dye-free offset is attached to the end of a plane cut fiber (Fig. 17.18a). Theoffset effectively serves as a spacer between the dye-sensitive region and the fiber.Next, a dye-loaded PMMA tip is added to the offset. The dye-free and dye-loadedPMMA are constructed using methyl-methacrylate (MMA), which is polymerizedin an oven at 60 C <strong>for</strong> ∼48 h and initiated using a primer (Azobis, Polyscience,Milwaukee, Wi, USA). The addition of dimethyl chloride (DMC) changes the solidpolymerized PMMA to a viscous <strong>for</strong>m. As such, fluorescent dyes dissolved in DMCcan be added to the solid PMMA. Following evaporation of DMC, the dye remainsabsorbed in the PMMA.
694 L.C.L. Chin et al.<strong>Optical</strong> fiber <strong>Optical</strong> fibera)b)CoreBufferCoreBufferDye-freePMMACladdingCladdingDye-loadedPMMACapillary tubingDye-loadedUV adhesiveFig. 17.18 Fluorescent dye-loaded fluence sensors: (a) Dye-loaded PMMA design; (b) Capillarytube tip design with dye-loaded UV adhesive (after Lilge et al. [41])<strong>Fiber</strong> tips with total diameters ranging from ∼250 to 435 μm can be constructedusing this approach. Smaller tips (
17 <strong>Optical</strong> <strong>Fiber</strong> <strong>Sensors</strong> <strong>for</strong> <strong>Biomedical</strong> <strong>Applications</strong> 695where A is the calibration constant (mW cm −2 V −1 ), and B (volts) is a factor thataccounts <strong>for</strong> the leakage of the detector. Typically, fluence sensors are calibrated inair either using a collimated light source [39] or in an integrating sphere [42]. Whenapplied to tissue, additional calibration factors must be employed to correct <strong>for</strong> theindex of refraction differences between air and tissue, fluence perturbation from thescattering tip, the blind spot from the fiber stem, and non-isotropic responses of thescattering bulb [40].17.4.3.2 Pre-Clinical and Clinical <strong>Applications</strong>Non-invasive surface reflectance geometries allow <strong>for</strong> a well-sampled data set ofradially-resolved surface measurements, which allows <strong>for</strong> the determination ofboth μ ′ t and μ eff , and thus the unique determination of absorption and scattering.However, interstitial characterization is complicated by: (1) the necessity tolimit patient invasiveness and (2) limitations in sensor positioning due to insertionthrough guidance templates. Clearly, the number of physical allowable measurementpositions is limited when inserting sensors directly into tissue. As such, a particularchallenge of interstitial geometries is to devise strategies <strong>for</strong> uniquely separatingabsorption and scattering properties using measurements far from the source, whereoptical properties cannot be uniquely separated with relative measurements alone.Calibrated sensors effectively overcome the limitations of poor spatial samplingby measuring differences in intensity at positions far from the source that are dominatedby μ ′ t = μ a + μ ′ s and not μ eff. However, accurate calibration can be difficultto accomplish and must be per<strong>for</strong>med <strong>for</strong> each source-detector pair and <strong>for</strong> differentirradiation wavelengths during spectroscopy. Several interstitial techniqueshave been devised to avoid absolute calibration when determining tissue opticalproperties at single wavelengths.Dimofte et al. [42] have employed multiple fluence sensors and sources attachedto a scanning translation stage coupled to a common catheter, <strong>for</strong> optical propertydetermination during PDT of the prostate. The set-up allows <strong>for</strong> multiple spatialmeasurements to be acquired in the same catheter, thereby avoiding additionalinsertions. <strong>Optical</strong> properties can be assessed throughout the prostate volume inquadrants with different source-detector pairs sampling a different volume of theprostate. A similar approach, reported by Pomerlea-Delacourt and Lilge [43], is toemploy fluorescent sensors with multiple detection locations along the same fiber.Interstitial optical measurements have recently been developed <strong>for</strong> monitoring ofthermal damage during laser thermal therapy (LTT) [5]. The approach relies on thesignificant difference in scattering between native and thermally coagulated tissue.The optical approach carries two significant advantages compared to conventionaltemperature sensors used <strong>for</strong> monitoring LTT. First, due to the speed of light in tissues,optical measurements provide volumetric in<strong>for</strong>mation in near real-time even atpositions distant from the source. This is in contrast to temperature sensors, wherecharring or coagulation events can occur some tens to hundreds of seconds be<strong>for</strong>emanifesting as a temperature change at typical monitoring positions of 0.5–1 cmfrom the source. Second, temperature sensors are unable to directly monitor thermal
696 L.C.L. Chin et al.Fig. 17.19 (a) <strong>Optical</strong> monitoring of coagulation boundary using real-time optical fluencemeasurements (source power (P), source-detector separation (r)). As the coagulation boundaryapproaches the fluence sensor, a decrease in light intensity is observed. This is due to a “light trapping”effect from the increased scattering properties of coagulated tissue. The same effect causesan increase in light intensity when the coagulation boundary reaches the location of the fluencesensor (located approximately at the triangle). Hence, a fluence sensor can be positioned strategicallyat the boundaries of a tumour to terminate the LTT treatment. The inset is a photograph ofthe resulting region of damage following LTT, indicating the locations of the source and detectorsemployed <strong>for</strong> optical monitoring. Note that, as expected from the termination of the treatment dueto the increase in fluence, the damage boundary is located almost at the location of the fluencesensor (b) Comparison of fluence and 180 ◦ radiance measurements <strong>for</strong> optical monitoring of thecoagulation boundary in tissue simulating optical phantoms. The 180 ◦ radiance enhances the sensitivityto the passing of the coagulation boundary compared to fluence measurements. (Reprintedwith permission from [5])damage and instead rely on thermal dose models or threshold temperatures to estimatethe extent of coagulation. However, optical sensors are able to directly measurecoagulation changes that are independent of the thermal dose models.Figure 17.19a illustrates the concept of optical monitoring during LTT of ex vivobovine liver. As the coagulation boundary approaches the fluence sensor location, adecrease in light intensity is observed. This is due to a “light trapping” effect fromthe significant increase in optical scattering within the coagulated region. This samescattering increase results in a significant increase in light intensity when the coagulationboundary reaches the sensor location. Hence, a fluence sensor strategicallypositioned at the margins of a cancerous region could be used to terminate an LTTtreatment and spare healthy surrounding tissue. In addition, directional light measurements(radiance) measurements can be employed instead of (isotropic) fluencesensors to offer enhanced sensitivity to the passing of the coagulation boundary.In particular, Chin et al. [5] demonstrated in tissue simulating phantoms that thebackwards (or 180 ◦ radiance) provides almost a two-fold increase in sensitivity
17 <strong>Optical</strong> <strong>Fiber</strong> <strong>Sensors</strong> <strong>for</strong> <strong>Biomedical</strong> <strong>Applications</strong> 697b)Fig. 17.20 Conventional fluorescent sensors. (a) Multi-fiber design (i) excitation fibers, (ii) collectionfibers and (iii) quartz shield (b) Single fiber design: variable aperture (after Utzinger andRichards-Kortum [2])compared to fluence measurements (Fig. 17.20b). They demonstrated that the lightintensity increase from the passing of the coagulation boundary is primarily dueto the increase of backwards traveling light randomized by the increased scatteringproperties of the coagulated region. Hence unlike fluence measurements, 180 ◦ radiancesensors effectively “filter out” the radiance that is insensitive to the passing ofthe coagulation volume.The optical approach provides virtually instantaneous in<strong>for</strong>mation regarding theonset, approach and final extent of thermal damage. Combined with interstitial temperaturesensors, optical monitoring can be employed as a feedback technique toadjust laser power levels and determine treatment termination when complete coverageof the target volume is achieved. As such, optical monitoring provides theadvantages of volumetric in<strong>for</strong>mation of thermal damage with the simplicity pointoptical sensor technology.17.5 Fluorescence Spectroscopy <strong>Fiber</strong>s17.5.1 Basic ApproachFluorescence spectroscopy is widely used <strong>for</strong> the detection and evaluation of neoplastictissues. The technique is potentially able to provide quantitative in<strong>for</strong>mationregarding the biochemistry, morphology and composition of pre-cancerous lesions
698 L.C.L. Chin et al.in several tissues including cervix, esophagus, bronchus, colon and skin. The primaryfluorescent tissue components, or fluorophores, are structural proteins suchas pyridine nucleotide, collagen, tryptophan, porphyrins, elastin, and flavoprotein[44]. The presence and relative concentration of these fluorophores and their distributionin tissue provides a means of distinguishing between normal and canceroustissues. In addition, the technique is able to provide dosimetric in<strong>for</strong>mation andtreatment evaluation of photonic treatments such as PDT and LTT. In the case ofPDT, fluorescent probes can be employed to determine the localization and concentrationof drugs (exogenous photosensitizers) necessary <strong>for</strong> treatment effect, as wellas photobleaching <strong>for</strong> treatment monitoring.Given the range of target sites evaluated by fluorescence spectroscopy, it isimportant to design fiber sensors that provide customized capabilities <strong>for</strong> their specificclinical applications. In the following section we describe a typical fluorescentsensor and the specific design characteristics that influence the detected signal.17.5.2 Fluorescence Sensor DesignSimilar to elastically-scattered light sensors of section 4, a conventional fluorescentsensor consists of (a) an excitation fiber, (b) a collection fiber and (c) a quartz shield(employed as a spacer). Carbon-filled or low-fluorescent epoxy can be employedto hold the fibers. Two potential configurations exist. In the first, the excitation andcollection fibers can be comprised of separate fibers (Fig. 17.20a). Alternatively, asingle excitation-collection fiber (Fig. 17.20b) can be employed <strong>for</strong> a more localizedfluorescence measurement. Multi-fiber sensors employ fiber bundles at differentdetection locations to achieve an overall larger interrogation volume. This configurationis particularly attractive <strong>for</strong> characterizing larger tissue, or when the marginsor location of a suspected lesion are unknown.17.5.2.1 Single and Multi-<strong>Fiber</strong> <strong>Sensors</strong>: Pros and ConsIt is important to compare the relative merits of single fiber and multi-fiber (i.e.multi-distance) fluorescent sensors. Both simulation and phantom experiments havedemonstrated that single fiber probes provide improved signal intensity and greatersensitivity to superficial fluorophores. This is primarily due to the overall shorterpathlengths traveled by collected photons in the single-fiber geometry. In contrast,multi-fiber separation probes detect photons that travel longer pathlengths and, assuch, are more sensitive to distortions and signal loss from blood absorption. Forshorter separations, multi-distance sensors can still provide reasonable depth sensitivitywith peak fluorescent detection sensitivity of ∼0.1 mm depth per 0.1 mmseparation, up to 0.4 mm. Beyond ∼0.4 mm larger separations result in a virtuallyuni<strong>for</strong>m sensitivity to all depths.Zhu et al. [45] described a 7-fiber sensor that combines the benefits of both singleand multi-distance designs. In their configuration a central fiber is surrounded ina ring by six additional fibers. The central fiber acts as a single fiber (illumination
17 <strong>Optical</strong> <strong>Fiber</strong> <strong>Sensors</strong> <strong>for</strong> <strong>Biomedical</strong> <strong>Applications</strong> 699and collection) sensor providing superficial probing sensitivity. The central fiberand one of the surrounding fibers can also be utilized in parallel <strong>for</strong> illuminationand collection as a larger diameter ‘single fiber’ sensor to provide intermediatedepth sensitivity. Finally, the central fiber and one of the surrounding fibers canbe employed as a multi-fiber sensor (one fiber illuminating and the other fiberdetecting) as a means to provide in<strong>for</strong>mation on deeper-seated structures.17.5.2.2 Effect of Spacer-ThicknessThe shield/spacer thickness, typically 1–7 mm, determines the fiber(s)-tissue separationand is a vital sensor design parameter. In the absence of a spacer (i.e., zerofiber-tissue separation, contact sensor) the excitation and detection regions are notco-localized. There<strong>for</strong>e, light must travel laterally through the interrogated tissuebe<strong>for</strong>e being collected, thereby increasing the overall path-length and decreasingthe intensity of detected photons due to attenuation. However, by increasing thefiber(s)-tissue distance, the spacer allows the excitation and collection regions tointersect, causing a decrease in the average lateral distance required <strong>for</strong> fluorescencecollection, and correspondingly, an increased collection efficiency and improvedsensitivity to fluorophores located in superficial regions. Note that, as describedin Section 17.4.2.1, by adjusting the source-detector separation, the mean probingdepth of detected photons can also be adjusted <strong>for</strong> steady-state reflectancesensors.The collection efficiency, β t , <strong>for</strong> a multi-fiber sensor (depicted in Fig. 17.20a)has been described by [46]:β t =β 0(z + shield t ) 2 (17.41)where z is the sensor to tissue distance along the optical axis of the sensor, shield tis the length of the spacer cap, and β 0 is a constant that incorporates the detectorefficiency. Equation (17.41) assumes isotropic fluorescence emission and does nothold <strong>for</strong> tissues with high <strong>for</strong>ward scattering. For example, in arterial tissue, thecollection efficiency has been shown empirically to follow a 1/shield n dependence,with n ∼1.1 [47].Equation (17.42) breaks down <strong>for</strong> very small spacer thicknesses < 0.5 mm [48].This is due to a shift in the overlap of the excitation and collection volumes ofthe sensor. When no spacer is employed, the collection fibers do not directly viewthe region of excitation. Here, photons must travel laterally (hence, be attenuated)be<strong>for</strong>e being detected. However, as the spacer size increases slightly, the overallfield of view of the collection fibers increases such that the collection fibers directlyview the excitation spot. In this case, no lateral propagation is needed <strong>for</strong> detectionand the sensor preferentially detects superficial fluorescence. In this spatialwindow, an increase in β t is observed. Beyond this regime, the increasing overlapof the excitation-collection volumes now detects a greater proportion of deeperlateral-traveling photons with longer path-lengths, thereby decreasing the collection
700 L.C.L. Chin et al.efficiency. Equation (17.42) is representative of this latter regime. Single-fiber sensors,which obviously have the greatest volume of illumination-collection overlapalso exhibit such trends.It is important to note that the larger the shield thickness, the larger the diameterof the shield and, consequently, the overall sensor diameter. To reduce the overalldiameter, the quartz spacer may be substituted using a coated glass rod or thickportion of optical fiber. These elements can effectively mix the illumination and collectionvolumes of the sensor. With this design, illumination and collection fibersare stripped of their outer jacket, randomly fixed with epoxy and packed hexagonallyinto a thin glass rod held together using shrink tubing. This greatly reducesthe overall diameter of the resulting sensor, while maintaining the high collectionefficiency of larger diameter spacer-based sensors. To ensure uni<strong>for</strong>m illumination,the length of the rod should be greater than 2R fiber /NA, where R fiber is the radius ofthe illumination and collection fibers.17.5.2.3 <strong>Fiber</strong> Diameter and OrientationSimilar to reflectance spectroscopy sensors (Section 17.4.2.1), varying both thesource and collection diameter has shown to influence the depth sensitivity of collectedfluorescence. Monte Carlo models and phantom studies have been per<strong>for</strong>medto elucidate the influence of sensor design on both the intensity and primary originof the detected fluorescence signals [45, 48].For small diameter fibers, sensitivity to superficial depths can be observed. This isa result of the reduced number of possible path-lengths of fluorescence photons <strong>for</strong>detection. However, with larger diameters the fluorescence sensitivity is averagedover many depths, thereby homogenizing and increasing the overall signal. Thesechanges are due to the same physical effects that occur with varying source-detectorseparation: an increase in measured photons that travel longer and deeper pathsthrough tissue be<strong>for</strong>e being collected.Previous studies have demonstrated that, in the range of 0.22–0.4, increasingthe collection fiber numerical aperture results in an increase in collected intensityand an enhancement in fluorescence sensitivity to superficial layers. These trendsare thought to stem from the increased acceptance angle af<strong>for</strong>ded by larger NAsthat allow <strong>for</strong> the collection of higher angle photons that originate under the illuminationregion. However, beyond an NA of 0.4, the collection efficiency ceases toincrease significantly due to the longer path-lengths of high angle photons, resultingin significant photon attenuation [48].Orienting the excitation fiber to greater than 45 ◦ incidence has shown to enhancecollection efficiency and increase sensitivity to superficial layers [45]. This isbecause angled illumination results in a shallower excitation light distribution,which leads to a shallower volume of origin <strong>for</strong> the generated fluorescence. Recallthat a similar principle can be employed <strong>for</strong> depth discrimination <strong>for</strong> spectroscopicreflectance sensors (Section “Specialized <strong>Fiber</strong> Optic Sensor Geometries”).However, <strong>for</strong> illumination angles less than ∼30 ◦ , very little difference in detectedfluorescence characteristics is observed compared to normal illumination.
17 <strong>Optical</strong> <strong>Fiber</strong> <strong>Sensors</strong> <strong>for</strong> <strong>Biomedical</strong> <strong>Applications</strong> 70117.5.2.4 Effect of Illumination-Collection <strong>Fiber</strong> SeparationCompared to single-fiber sensor, multi-fiber sensors also offer the additionalflexibility of varying the illumination-collection fiber separation. This providesan additional parameter <strong>for</strong> depth selectivity [48]. In general, increasing theillumination-collection spacing results in the detection of fluorescent photons fromdeeper regions. Again, physically this is explained by the longer path-lengthsrequired <strong>for</strong> collection when larger fiber separations are employed.17.5.3 Influence of Tissue OpticsWhile sensor design parameters influence the depth of fluorescence origin and averagepath length of detected photons, the detected fluorescent intensity and measuredspectrum is also “distorted” by optical properties of the interrogated medium. Anumber of investigators have examined the effect of absorption and scattering onthe “intrinsic” fluorescence spectrum [48–50]. These studies have shown that spectralalterations due to optical properties tend to be enhanced when detected photonstravel longer path lengths within the tissue. Hence, probe designs with large diameters,large NA, shallow illumination angle (i.e., near normal incidence), smallsource-tissue spacing, and large source-detector spacing will suffer greater changesthan their opposite counterparts.While sensor design can be utilized to minimize the effects of tissue optical properties,an alternative approach is to correct the altered spectra through reflectancedata that provide an indication of the degree of fluorescent distortion by combiningreflectance-and fluorescence spectroscopy. The most straight<strong>for</strong>ward approachis to utilize the measured reflectance to quantitatively derive in<strong>for</strong>mation regardingthe tissue optical properties (penetration depth, absorption and scattering). Usingthe measured optical properties, the “intrinsic” fluorescence spectra can be correctedusing appropriate photon migration models. While early corrections requiredsimplified geometries such plane-wave irradiation and/or specific source-detectorarrangements [51–53], recent improvements in diffuse light models have extendedthe technique to more complicated three-dimensional geometries [55, 56].A more simplified approach is to employ an approximate relationship betweenthe measured fluorescence and reflectance to correct <strong>for</strong> spectral distortions. Finlayet al. [54] recently described an empirical correction method by dividing themeasured fluorescence spectrum by the reflectance signal measured at the samewavelengths. The approach, which does not require determination of tissue opticalproperties, is applicable over a wide range of reflectance measurements typicallyencountered in vivo. However, their correction is limited to fixed source-detectorgeometries.Another alternative is to employ the distorted fluorescence spectrum to directlyobtain in<strong>for</strong>mation regarding the sample’s optical properties, and then employ thedetermined optical properties to eliminate the distortion. Using a <strong>for</strong>ward-adjointmodel, Finlay and Foster [56] have demonstrated that it is, in fact, possible to
702 L.C.L. Chin et al.directly recover the intrinsic fluorescence and in<strong>for</strong>mation on tissue optical propertiesfrom the measured distorted spectrum. Future advancement of this concept willlikely allow <strong>for</strong> fluorescent corrections without the necessity of added reflectancecomponents, thereby greatly simplifying detection technology and computationalanalysis.17.6 <strong>Optical</strong> Coherence Tomography <strong>Fiber</strong>sUnlike other fiber sensors described in this chapter, OCT <strong>for</strong>ms truly depth-resolvedtomographic cross-sectional images, with a depth resolution in the 1–20 μm range(cf. “depth-sensing” discussions of various sensors above). Essentially, an OCTimaging sensor <strong>for</strong>ms the sample arm of an OCT interferometer and typically consistsof a single mode optical fiber terminated with a focusing element (e.g., aGRIN or a ball lens) and beam deflecting element (e.g., a retro-reflecting prismor an angle cleaved distal optic) <strong>for</strong> a side-viewing sensor. The overall principle canbe appreciated from the layout of a catheter-based fast OCT imaging system presentedby Tearney et al. [57], as shown in Fig. 17.21. Specifics of the distal sensordesign, combination of radial scanning and longitudinal fiber pull-back approach,and integration with the rest of the OCT imager can be enabled. Using the system inFig. 17.21 and its later variants, the authors were able to generate impressive subsurfaceimages of the superficial layers of the gastro-intestinal and broncho-pulmanorytracts, as well as intravascular images of atherosclerotic plaques in coronary arteries[58]. Several other groups have also developed their own versions of intravascularand endoscopic OCT imaging systems, all using their own unique implementationsof OCT fiber sensors. For example, Fig. 17.22 shows an endoscopic sensordeveloped by Yang et al. [59] <strong>for</strong> esophageal imaging in the gastrointestinal tract.Cr 4+ :fosteritelaserDetectorTransimpedanceamplifierBandpassfilterDemodulator50/50SamplearmReferencearmComputerFramegrabberGratingPhasecontroldelay lineGalvanometercontrollerVideosynchronizationcircuitryCatheterendoscopeGalvanometermirror<strong>Optical</strong> fiber(angle cleaved)Grin lens(angle polished)PrismTransparentouter sheathS-VHSrecorderMonitorFig. 17.21 (a) layout of the OCT system. (b) Second-generation OCT catheter-endoscope. Byadjusting the angle cleaving the optical fiber and the angle polishing the GRIN lens, normal incidencesare avoided and thus internal reflections can be minimized. (c) Photograph of an OCTcatheter-endoscope at the distal end of the sensor. (Reprinted with permission from [57])
17 <strong>Optical</strong> <strong>Fiber</strong> <strong>Sensors</strong> <strong>for</strong> <strong>Biomedical</strong> <strong>Applications</strong> 703Fig. 17.22 An OCT optical fiber sensor adapted <strong>for</strong> biomedical imaging during human gastrointestinalendoscopy. (a) the proximal end of the endoscope, showing the linear translation motor thatpulls the OCT fiber to-fro by ∼3 mm to enable longitudinal cross-sectional imaging (b) the distalend of the endoscope, with the OCT probe protruding from the instrument channel (c) close-up ofthe OCT fiber sensor within its transparent sheath, with OF = optical fiber, L = focusing (GRIN)lens, P = side-reflecting prism, and A = adhesive sealant (d) clinical imaging showing OCT probein contact with human esophageal tissue. (Reprinted with permission from [59] and[74])A particularly important design consideration <strong>for</strong> OCT sensors is the avoidanceof normal interfaces and retro-reflective surfaces, which in addition to reducingsignal strength by causing photon loss, can inadvertently interfere with the referencebeam and generate spurious and artificial lines or streaks in the resultantimage. Thus, care must be taken to minimize the number of elements in an OCTsensor, as each one will likely contribute at least one (and often two) normalinterfaces whose reflections could fall within the coherence ranging depth of thesystem and thus cause artifacts in the image. The use of angle-cleaved surfaces toavoid normal incidence, refractive-index matching compounds, and careful opticaldesign to minimize the number of interfaces are thus essential <strong>for</strong> successfuloperation of an OCT fiber sensor. Figures 17.21(b, c) and 17.22 illustrate theseconcepts.A significant limitation of OCT is its shallow imaging depth, which is typically1–3 mm in nontransparent mammalian tissues. While a huge variety of excitingbiomedical applications are still possible within this depth range (<strong>for</strong> example, endoscopicand intravascular imaging as described above, where the pathologic changesof interest occur within 1–2 mm of the inner surface), many scenarios would benefitfrom deep tissue imaging with OCT. Fortunately, owing to the technique’s intrinsiccompatibility with optical fiber technology, this can indeed be done in the contextof an interstitial OCT fiber sensor.
704 L.C.L. Chin et al.Li and co-workers have first demonstrated an “OCT needle” approach suitable<strong>for</strong> deep tissue imaging in 2006 [61]. Using a single mode optical fiber with a GRINlens and microprism to focus and deflect the beam, delivered to the desired deeptissue location via a 27-gauge needle (0.41 mm outer diameter), the authors wereable to obtain high-quality microstructural images in deep-seated hamster leg muscletissue. More recently, the Toronto OCT group [60–62] has developed interstitialprobes capable of both microstructural OCT and microvascular Doppler OCT imagingin deep tissues. Using both cleaved ball lens and cleaved GRIN lens designs tominimize stray reflections as shown schematically in Fig. 17.23 and utilizing minimumfootprint components, sub-mm diameter probes have been produced. X-rayor ultrasound guidance enabled accurate placement of the distal imaging end of theprobe at the desired 3D location within, or at the margins, of the deep-seated tumourto be treated. While the tissue microstructure did not show obvious alterations inresponse to treatment (photodynamic therapy (PDT) in this case), the Doppler OCTsignal changed drastically, indicating a significant treatment-induced microvascularresponse that can be effectively monitored both on OCT optical fiber sensors [62].17.7 Raman Spectroscopy <strong>Fiber</strong>s17.7.1 Basic ApproachRaman spectroscopy has proven to be a valuable tool <strong>for</strong> interrogating biologicalmaterials. This technique relies on an inelastic scattering process in which incidentphotons transfer energy to (Stokes), or gain energy from (anti-Stokes) moleculeswithin a sample. For biological applications, the Raman scattering accounts <strong>for</strong>approximately 10 −10 of the incident light and the Raman signal is typically severalorders of magnitude weaker than the fluorescence signal. Raman spectroscopictechniques <strong>for</strong> biomedical applications have seen significant advancement over thepast few decades, with improvements in portability of equipment and fiber opticbased excitation and collection, which can be used in vivo. Raman spectroscopy hasbeen shown to provide in<strong>for</strong>mation about the structure of molecular constituents intissues [63, 64], and has the ability to distinguish between normal and canceroustissues in some scenarios [65, 66].17.7.2 Raman Probe DesignThe two key parameters <strong>for</strong> designing a fiberoptic probe <strong>for</strong> Raman spectroscopy aremaximizing the Raman-scattered light collection and minimizing unwanted opticalsignals (elastically scattered light, fluorescence photons, fiber-generated Ramansignals, etc.). The intrinsically weak Raman signals can be masked by strong fluorescencefrom biomolecules and cells, particularly <strong>for</strong> excitation in the visibleregion. Fluorescence decreases rapidly at longer wavelengths, such that this problem
17 <strong>Optical</strong> <strong>Fiber</strong> <strong>Sensors</strong> <strong>for</strong> <strong>Biomedical</strong> <strong>Applications</strong> 705(a)Linear scannerUS or CTguidanceDOCTsystemIS-DOCTneedlepatient(b)GRIN lens 8” polished8” polished<strong>Optical</strong>windowEchogenicneedle (19-guage)SM fiber50”polished(c)SM fiber withfused ball lens50”polishedFig. 17.23 (a) Schematic demonstrating interstitial Doppler OCT guided by either ultrasound orcomputed tomography (b) A beam is focused into a single mode fiber and subsequently deflectedvia a GRIN lens with three polished surfaces. Note the avoidance of normal interfaces in thissensor to minimize unwanted interference effects (c) Simplified schematic with a polished balllensedfiber. Both designs use an echogenic needle <strong>for</strong> enhanced ultrasound visualization [60]. Thebottom photograph shows (d) a 2nd generation Doppler OCT needle probe used <strong>for</strong> interstitialmonitoring of photodynamic therapy treatments [61]
706 L.C.L. Chin et al.has been largely overcome with excitation in the NIR. Alternatively, fluorescencefreeRaman can be achieved with excitation in the UV below ∼270 nm, but at theexpense of reduced optical penetration (microns). For ex vivo tissue interrogations,integration times of a few seconds yield acceptable signal to noise ratio. For in vivodeployment longer integration times 20–60 s are typically required; however, theacquisition of clinical data in real-time (∼1 s integration time) with good signalto-noiseratios has been demonstrated <strong>for</strong> margin assessment in patients undergoingpartial mastectomy [67]. <strong>Fiber</strong>optic bundles and imaging optics can also be usedto enhance collection efficiency (signal to noise), and filtering (and/or softwarecorrection) can be used to further remove unwanted signals.Some materials used in Raman systems are themselves Raman active and hencecan interfere with the signal coming from the sample under investigation. Hence,filters are required in both the delivery and collection arms of a Raman system.Fused silica fibers used to transmit optical radiation can generate Raman signals,with the intensity depending on the excitation wavelength and wavenumber regioninvestigated. In the fingerprint region (up to ∼2000 cm −1 ), fused silica fibers arecharacterized by a strong background signal generation. These fiber-induced signalsare proportional to the fiber length and can be greater than those from the sample.For high wavenumber investigations (2400 to 3800 cm −1 ), fused silica has almostno Raman background signal. Santos et al. [68] analyzed several core, claddingand coating materials used in Raman fiber probes <strong>for</strong> investigations in the highwavenumber region. Overall, low-OH (hydroxyl) fused silica appears to the optimalfiber material <strong>for</strong> NIR Raman applications.One must also prevent surface reflected or elastically scattered excitation lightfrom entering the collection fibers. This is typically achieved using a long pass filter(or notched filter) positioned in front of the collection optics. Typically a band passfilter is also used in the excitation line to allow <strong>for</strong> the transmission of only theexcitation light.A conventional Raman probe consists of a single excitation fiber and a bundleof collection fibers. Short et al. [69] developed a design with a central 200 μmexcitation fiber surrounded by twenty seven 100-micron core diameter collectionfibers (Fig. 17.24a). The excitation fiber can be coated, <strong>for</strong> example with gold [69]or aluminum [67], <strong>for</strong> optical isolation to prevent cross talk between the excitationand collection optics.Haka et al. [67] developed a fiber bundle comprised of a 200-μm core diameterlow OH fused silica excitation fiber (0.22 NA) surrounded by 15 collection fibers(0.27 NA) (Fig. 17.24b). The distal end of the probe contains a 0.55 mm short-passfilter rod, proximal to the excitation fiber, surrounded by a long-pass filter modulepositioned in front of the collection fibers. Filters are attached to the fibers using anindex-matching optical cement. A 2 mm diameter sapphire ball lens (1.77 NA) isused to improve collimation of the excitation light and the collection of the Ramanscattered light. The excitation fiber–lens separation determines the spot size andhence the energy density incident on the tissue. Due to the large angular distributionof the remitted Raman light, the ball lens should have a large index of refraction toimprove coupling to the collection fibers.
17 <strong>Optical</strong> <strong>Fiber</strong> <strong>Sensors</strong> <strong>for</strong> <strong>Biomedical</strong> <strong>Applications</strong> 707aLasercollection fibersaluminum jacketexcitation fiberCatheterbFiltermodule Spectrographc2 mmlong-passfilter tubemetalsleeveshort-passfilter rodretainingsleeveball lensa)b)Delivery fiberhaSpectrograph& CCD785 nm LaserProbeCollection fiber<strong>Fiber</strong>collimatorAxiconConverginglens<strong>Fiber</strong>LauncherDiverginglens(es)SpecimenConverginglensDichroicmirrorIlluminationCollectionInternal filtersfLP/NotchgedbBPcc) d) e)Fig. 17.24 (a) Endoscopic Raman probe based on a single illumination fiber surrounded by 27collection fibers. Band-pass filters (label a) are used <strong>for</strong> the excitation fiber and long-pass filters(label b) <strong>for</strong> the collection fibers. A second fiber bundle consisting of 54 ultralow 100 micron corefibers is coupled to the spectrograph (label c) (with permission from [69]). (b) Raman probe basedon a single illumination fiber surrounded by 15 collection fibers. The excitation fiber is coatedwith aluminum to prevent crosstalk between the excitation and collection lines. A short pass filteris used to reject background Raman signals generated in the low-OH fused silica and a long passused on the collection line. A sapphire ball lens is used to collimate the excitation light and improvecoupling of Raman light into the collection fibers (with permission from [67]). (c) Light is coupledinto a 200 micron core fiber, collimated, then directed through an axion. A Galilean telescopedesign comprised of converging and diverging lenses is used to achieve variable ring diameters<strong>for</strong> illumination. A dichroic mirror was used to reflect excitation light to the sample and transmitcollection light to a 1 mm diameter bundle of fifty 62.5 micron core fibers (with permission from[70]). (d) Endoscopic Raman probe comprised on a single central delivery fiber surrounded byseven beveled 300 micron core collection fibers. Band-pass and long-pass filters are used <strong>for</strong> theexcitation and collection lines, respectively (with permission from [71]). (e) Raman probe basedon excitation light, through a single 200 micron core fiber (label a), imaged on the tissue samplevia a biconvex lens (label b) and mirror (label c). A band-pass (BP) filter is used to remove Ramanbackground. The probe terminates in a quartz window (label d). Collected light is imaged usingtwo plano convex lenses (labels e and f) through an aperature stop (label g) and notched filter ontoa fiber bundle (label h) (with permission from [72])
708 L.C.L. Chin et al.Single point illumination can limit the amount of laser power that can bedelivered due to the potential of inducing thermal damage. To overcome this,Schulmerich et al. [70] collimated light from a 200 μm core fiber directed througha 175 ◦ Axicon lens and focused using a positive-negative lens pair to create an illuminationring. Ring diameters of 3.0–14.5 mm were achieved. In this design, lightis collected using a bundle of fifty 62.5-μm core diameter fibers (Fig. 17.24c).Molckovsky et al. [71] used a fiber probe with interchangeable beveled tips(Fig. 17.24d). They demonstrated that beveled tips improved collection efficiency.Moreover, the depth of interrogation is determined by the bevel angleand separation between the central excitation fiber and surrounding seven 300-μm core diameter collection fibers. As the bevel angle is increased and separationbetween excitation and collection fibers is decreased, the interrogated volume movescloser to the surface. Excellent collection efficiency has been reported using thisprobe.Mahadevan-Jansen et al. designed a 12 mm diameter Raman probe <strong>for</strong> cervicalstudy (Fig. 17.24e) [72]. Light from a diode laser is coupled to a 200-μm corediameter fiber and deflected onto the tissue surface using a gold mirror. The angle ofdeflection is chosen such that the excitation spot overlaps with the collection region.Remitted light from the sample is collected using two biconvex lenses and imagedonto a fiber bundle consisting of fifty 100 μm core diameter fibers. The probe terminatesin a quartz window, which is in contact with the tissue sample. The excitationlight will induce both Raman and fluorescence photons in the quartz window, butsince both processes are well known <strong>for</strong> quartz, this unwanted background signalcan be identified and removed (in software). More recently, Robichaux-Viehoeveret al. [73] utilized beveled collection fibers around a single excitation to achieveoverlap of the excitation and collection regions.For medical applications, Raman fiber probe design must also address a numberof clinical considerations. Practical probe dimensions are typically up to 2 mm(diameter) to allow <strong>for</strong> insertion into needles and endoscopes, and fiber lengths canbe on the order of a few meters.17.8 Summary<strong>Optical</strong> fiber sensors offer unique capabilities <strong>for</strong> accurate assessment of biologicaltissues, with interesting applications towards early disease diagnosis, therapyguidance and feedback, and treatment response monitoring. Depending on a particularclinical application and intent, they may be advantageous due to theirbio-compatibility, freedom from electromagnetic interference, choice of technologicaldesign parameters that may be individually optimized, and ability to furnish avariety of useful tissue characterization in<strong>for</strong>mation that may be difficult/impossibleto obtain by other means. The overview presented in this chapter has discussedbasic operating principles of fiber sensors, reviewed the types of fibers currentlyemployed in biomedicine, and provided illustrative examples of their biomedical
17 <strong>Optical</strong> <strong>Fiber</strong> <strong>Sensors</strong> <strong>for</strong> <strong>Biomedical</strong> <strong>Applications</strong> 709use. It is hoped that the presented concepts and applications of optical fiber sensorsconvey the scope of the basic science, enabling technology, and useful approachesand innovations that are occurring in this exciting field.Acknowledgement The authors would like to thank Dr. Richard Schwarz from the Richards-Kortum lab at The University of Texas at Austin <strong>for</strong> providing the derivation of the ball-lensequation.References1. Kapany NS. <strong>Fiber</strong> optics. Principles and applications. Academic, New York (1967).2. Utzinger U and Richards-Kortum RR. <strong>Fiber</strong> optic probes <strong>for</strong> biomedical optical spectroscopy.J. Biomed. Opt., 8(1):121–147 (2003).3. Verdaasdonk RM and Borst C. Optics of fiber and fiber probes. In: AJ Welch and MJCvan Gemert (eds) <strong>Optical</strong>-thermal response of laser-irradiated tissue. Plenum, New York,pp. 619–666 (1995).4. Polymicro Technologies Catalog, http://www.polymicro.com/catalog/2_8.htm (2009).5. Chin LC, Wilson BC, Whelan WM, and Vitkin IA. Radiance-based monitoring of the extentof tissue coagulation during laser interstitial thermal therapy. Opt. Lett., 29(9):959–961(2004).6. Dickey DJ, Moore RB, Rayner DC, and Tulip J. Light dosimetry using the P3 approximation.Phys. Med. Biol., 46(9):2359–2370 (2001).7. Farrell TJ, Patterson MS, and Wilson BC. A diffusion theory model of spatially, resolved,steady-state diffuse reflectance <strong>for</strong> the non-invasive determination of tissue optical propertiesin vivo. Med. Phys., 19:879–888 (1992).8. Hull EL, Nichols MG, and Foster TH. Quantitative broadband near-infrared spectroscopyof tissue-simulating phantoms containing erythrocytes. Phys. Med. Biol., 43(11):3381–3404(1998).9. Wang L and Jacques SL. Use of a laser beam with an oblique angle of incidence to measurethe reduced scattering coefficient of a medium. Appl. Opt., 34(13):2362–2366 (1995).10. Nichols MG, Hull EL, and Foster TH. Design and testing of a white-light, steady-statereflectance spectrometer <strong>for</strong> determination of optical properties of highly scattering systems.Appl. Opt., 36(1):93–104 (1997).11. Fuchs H, Utzinger U, Zuluaga F, Gillenwater R, Jacob R, Kemp B, and Richards-KortumR. Combined fluorescence and reflectance spectroscopy: in vivo assessment of oral cavityepithelial neoplasia. Porc. CLEO, 6:306–307 (1998).12. Patterson MS, Andersson-Engels S, Wilson BC, and Osei EK. Absorption spectroscopy intissue-simulating materials: a theoretical and experimental study of photon paths. Appl. Opt.,34(1):22–30 (1995).13. Farrell TJ, Patterson MS, and Wilson B. A diffusion theory model of spatially resolved,steady-state diffuse reflectance <strong>for</strong> the noninvasive determination of tissue optical propertiesin vivo. Med. Phys., 19(4):879–888 (1992).14. Finlay JC and Foster TH. Hemoglobin oxygen saturations in phantoms and in vivo from measurementsof steady-state diffuse reflectance at a single, short source-detector separation. Med.Phys., 31(7):1949–1959 (2004).15. Seo I, Hayakawa CK, and Venugopalan V. Radiative transport in the delta-P1 approximation<strong>for</strong> semi-infinite turbid media. Med. Phys., 35(2):681–693 (2008).16. Kienle A and Patterson MS. Determination of the optical properties of turbid media from asingle Monte Carlo simulation. Phys. Med. Biol., 41(10):2221–2227 (1996).17. Kim AD, Hayakawa C, and Venugopalan V. Estimating optical properties in layered tissues byuse of the Born approximation of the radiative transport equation. Opt. Lett., 31(8):1088–1090(2006).
710 L.C.L. Chin et al.18. Pfefer TJ, Matchette LS, Bennett CL, Gall JA, Wilke JN, Durkin AJ, and Ediger MN.Reflectance-based determination of optical properties in highly attenuating tissue. J. Biomed.Opt., 8(2):206–215 (2003).19. Alexandrakis G, Farrell TJ, and Patterson MS. Monte carlo diffusion hybrid model <strong>for</strong> photonmigration in a two-layer turbid medium in the frequency domain. Appl. Opt., 39(13):2235–2244 (2000).20. Seo I, You JS, Hayakawa CK, and Venugopalan V. Perturbation and differential Monte Carlomethods <strong>for</strong> measurement of optical properties in a layered epithelial tissue model. J. Biomed.Opt., 12(1):014030 (2007).21. Mourant JR, Bigio IJ, Jack DA, Johnson TM, and Miller HD. Measuring absorption coefficientsin small volumes of highly scattering media: Source-detector separations <strong>for</strong> whichpath lengths do not depend on scattering properties. Appl. Opt., 36(22):5655–5661 (1997).22. Kumar G and Schmitt JM. Optimal probe geometry <strong>for</strong> near-infrared spectroscopy ofbiological tissue. Appl. Opt., 36(10):2286–2293 (1997).23. Amelink A, Kaspers OP, Sterenborg HJ, van der Wal JE, Roodenburg JL, and Witjes MJ. Noninvasivemeasurement of the morphology and physiology of oral mucosa by use of opticalspectroscopy. Oral. Oncol., 44(1):65–71 (2008).24. Van de Hulst HC. Light scattering by small particles. Dover, New York (1957).25. van Veen RL, Amelink A, Menke-Pluymers M, van der Pol C, and Sterenborg HJ.<strong>Optical</strong> biopsy of breast tissue using differential path-length spectroscopy. Phys. Med. Biol.,50(11):2573–2581 (2005).26. Amelink A, OP Kaspers, HJCM Sterenborg, JE van der Wal, JLN Roodenburg, and MJHWitjes. Non-invasive measurement of the morphology and physiology of oral mucosa by useof optical spectroscopy. Oral Oncol., 44:65–71 (2008).27. Kruijt B, de Bruijn HS, van der Ploeg-van den Heuvel A, de Bruin RW, Sterenborg HJ,Amelink A, and Robinson DJ. Monitoring ALA-induced PpIX photodynamic therapy inthe rat esophagus using fluorescence and reflectance spectroscopy. Photochem. Photobiol.,6:1515–1527 (2008).28. Wang AMJ, Bender JE, Pfefer J, Utzinger U, and Drezek RA. Depth-sensitive reflectancemeasurements using obliquely oriented fiber probes. J. Biomed. Opt., 10(4):044017 (2005).29. Arifler D, Schwarz RA, Chang SK, and Richards-Kortum R. Reflectance spectroscopy <strong>for</strong>diagnosis of epithelial precancer: model-based analysis of fiber-optic probe designs to resolvespectral in<strong>for</strong>mation from epithelium and stroma. Appl. Opt., 44(20):4291–4305 (2005).30. Nieman L, Myakov A, Aaron J, and Sokolov K. <strong>Optical</strong> sectioning using a fiber probe withan angled illumination-collection geometry: evaluation in engineered tissue phantom. Appl.Opt., 43:1308–1319 (2004).31. Skala M, Palmer G, Zhu C, Liu Q, Vrotsos K, Marshek-Stone C, Gendron-Fitzpatrick A,and Ramanujam N. Investigation of the fiber-optic probe designs <strong>for</strong> optical spectroscopicdiagnosis of epithelial pre-cancers. Lasers Surg. Med., 34:25–38 (2004).32. Schwarz RA, Arifler D, Chang SK, Pavlova I, Hussain IA, Mack V, Knight B, Richards-Kortum R, and Gillenwater AM. Ball lens coupled fiber-optic probe <strong>for</strong> depth-resolvedspectroscopy of epithelial tissue. Opt. Lett., 30(10):1159–1161 (2005).33. Schwarz RA, Gao W, Daye D, Williams MD, Richards-Kortum R, and Gillenwater AM.Autofluorescence and diffuse reflectance spectroscopy of oral epithelial tissue using adepth-sensitive fiber-optic probe. Appl. Opt., 47(6):825–834 (2008).34. Johnson T and Mourant J. Polarized wavelength-dependent measurements of turbid media.Opt. Express, 4(6):200–216 (1999).35. Myakov A, Nieman L, Wicky L, Utzinger U, Richards-Kortum R, and Sokolov K. <strong>Fiber</strong> opticprobe <strong>for</strong> polarized reflectance spectroscopy in vivo: design and per<strong>for</strong>mance. J. Biomed. Opt.,7(3):388–397 (2002).36. Groner W, Winkelman JW, Harris AG, Ince C, Bouma GJ, Messmer K, and Nadeau RG.Orthogonal polarization spectral imaging: a new method <strong>for</strong> study of the microcirculation.Nat. Med., 5(10):1209–1213 (1999).
17 <strong>Optical</strong> <strong>Fiber</strong> <strong>Sensors</strong> <strong>for</strong> <strong>Biomedical</strong> <strong>Applications</strong> 71137. De Jode ML. Monte Carlo simulations of the use of isotropic light dosimetry probes to monitorenergy fluence in biological tissues. Phys. Med. Biol., 44:3207–3237 (1999).38. Henderson B. An isotropic dosimetry probe <strong>for</strong> monitoring light in tissue, theoretical andexperimental measurement. Ph.D. Thesis, Heriot Watt University, Edinburgh (1991).39. Marijnissen JP, Star WM. Calibration of isotropic light dosimetry probes based on scatteringbulbs in clear media. Phys. Med. Biol., 41(7):1191–1208 (1996).40. Marijnissen JP and Star WM. Per<strong>for</strong>mance of isotropic light dosimetry probes based onscattering bulbs in turbid media. Phys. Med. Biol., 47(12):2049–2058 (2002).41. Lilge L, Haw T, and Wilson BC. Miniature isotropic optical fibre probes <strong>for</strong> quantitative lightdosimetry in tissue. Phys. Med. Biol., 38(2):215–230 (1993).42. Dimofte A, Finlay JC, and Zhu TC. A method <strong>for</strong> determination of the absorption andscattering properties interstitially in turbid media. Phys. Med. Biol., 50(10):2291–2311(2005).43. Pomerleau-Dalcourt N and Lilge L. Development and characterization of multi-sensoryfluence rate probes. Phys. Med. Biol., 51(7):1929–1940 (2006).44. Richards-Kortum R. Fluorescence spectroscopy of turbid media. In: AJ Welch and MJC vanGemert (eds) <strong>Optical</strong> thermal response of laser-irradiated tissue. Plenum, New York, pp.667–706 (1995).45. Zhu C, Liu Quan, Ramanujam N. Effect of fiber optic probe geometry on depth-resolvedfluorescence measurements from epithelial tissues: a Monte Carlo simulation. J. Biomed. Opt.,8(2), 237–247 (2003).46. Trujillo EV, Sandison DR, Utzinger U, Ramanujam N, Mitchell MF, and Richard-KortumR. Method to determine tissue fluorescence efficiency in vivo and predict signal-to-noise <strong>for</strong>spectrometers. Appl. Spectrosc., 52(7):943–995 (1998).47. Pope K, Warren S, Yazdi Y, Johnston J, David M, and Richard-Kortum R. Dual imaging ofarterial walls: intravascular ultrasound and fluorescence spectroscopy. Proc. SPIE, 1878:42–50 (1993).48. Pfefer TJ, Schomacker KT, Ediger MN, and Nishioka NS. Multiple-fiber probe design <strong>for</strong>fluorescence spectroscopy in tissue. Appl. Opt., 41(22):4712–4721 (2002).49. Keijzer M, Richards-Kortum R, Jacques SL, and Feld MS. Fluorescence spectroscopy ofturbid media: Autofluorescence of the human aorta. Appl. Opt., 28:4286–4292 (1989).50. Avrillier S, Tinet D, Ettori D, Tualle JM, and Gelebart B. Influence of the emission receptiongeometry in laser-induced fluorescence spectra from turbid media. Appl. Opt., 37:2781–2787(1998).51. Gardner CM, Jacques SL, Welch AJ. Fluorescence spectroscopy of tissue: Recoveryof intrinsic fluorescence from measured fluorescence. Appl. Opt., 35:1780–1792(1996).52. Gardner CM, Jacques SL, Welch AJ. Light transport in tissue: accurate expressions <strong>for</strong> onedimensionalfluence rate and escape function based upon Monte Carlo simulation. LasersSurg. Med., 18:129–138 (1996).53. Durkin AJ, Richards-Kortum R. Comparison of methods to determine chromophore concentrationsfrom fluorescence spectra of turbid samples. Lasers Surg. Med., 19:75–89(1996).54. Finlay JC, Conover DL, Hull EL, Foster TH. Porphyrin bleaching and PDT-induced spectralchanges are irradiance dependent in ALA-sensitized normal rat skin in vivo. Photochem.Photobiol., 73:54–63 (2001).55. Wu J, Feld MS, and Rava R. Analytical model <strong>for</strong> extracting intrinsic fluorescence in turbidmedia. Appl. Opt., 32:3583–3595 (1993).56. Finlay JC and Foster TH. Recovery of hemoglobin oxygen saturation and intrinsic fluorescencewith a <strong>for</strong>ward-adjoint model. Appl. Opt., 44(10):1917–1933 (2005).57. Tearney GJ, Brezinski ME, Bouma BE, Boppart SA, Pitris C, Southern JF, and Fujimoto JG. Invivo endoscopic optical biopsy with optical coherence tomography. Science, 276:2037–2039(1997).
712 L.C.L. Chin et al.58. Kawasaki M, Bouma B, Bressner J, Houser S, Nadkarni S, MacNeill B, Jang I, Fujiwara H,and Tearney G. Diagnostic accuracy of optical coherence tomography and integrated backscatterintravascular ultrasound images <strong>for</strong> tissue characterization of human coronary plaques.J. Am. Coll. Cardiol., 48:81–88 (2006).59. Yang SJ, Marcon N, Gardiner G, Qi B, Bisland S, Seng-Yue E, Lo S, Pekar J, Wilson B, andVitkin I. High speed, wide velocity dynamic range Doppler optical coherence tomography(Part III): in vivo endoscopic imaging of blood flow in the rat and human gastrointestinaltracts. Opt. Express, 11(19):2416–2424 (2003).60. Yang VX, Mao YX, Munce N, Standish B, Kucharczyk W, Marcon NE, Wilson BC, andVitkin IA. Interstitial Doppler optical coherence tomography. Opt. Lett., 30(14):1791–1793(2005).61. Li H, Standish BA, Mariampillai A, Munce NR, Mao Y, Chiu S, Marcon NE, Wilson BC,Vitkin A, and Yang VX. Feasibility of interstitial Doppler optical coherence tomography <strong>for</strong>in vivo detection of microvascular changes during photodynamic therapy. Lasers Surg. Med.,38(8):754–761 (2006).62. Standish BA, Lee KK, Jin X, Mariampillai A, Munce NR, Wood MF, Wilson BC, Vitkin IA,and Yang VX. Interstitial Doppler optical coherence tomography as a local tumor necrosispredictor in photodynamic therapy of prostatic carcinoma: An in vivo study. Cancer Res.,68(23):9987–9995 (2008).63. De Jong BWD, Schut TCB, Wolffenbuttel KP, Nijman JM, Kok DJ, and Puppels GJ.Identification of bladder wall layers by Raman spectroscopy. J. Urol., 168:1771–1778 (2002).64. Notingher I, Verrier S, Romanska H, Bishop AE, Polak JM, and Hench LL. In situcharacterization of living cells by Raman spectroscopy. Spectroscopy, 16:43–51 (2002).65. Mahadevan-Jansen A and Richards-Kortum R. Raman spectroscopy <strong>for</strong> the detection ofcancers and precancers. J. Biomed. Opt., 1:31–70 (1996).66. Haka AS, Shafer-Peltier KE, Fitzmaurice M, Crowe J, Dasari RR, and Feld MS. Diagnosingbreast cancer by using Raman spectroscopy. Proc. Natl. Acad. Sci. U.S.A., 102:12371–12376(2005).67. Haka AVolynskaya, Z, Gardecki J, Nazemi J, Lyons J, Hicks D, Fitzmaurice M, Dasri R,Crowe J, and Felds M. In vivo margin assessment during partial mastectomy breast surgeryusing Raman spectroscopy. Cancer Res., 66:3317–3322 (2006).68. Santos LF, Wolthuis R, Koljenović S, Almeida RM, and Puppels GJ. <strong>Fiber</strong>-optic probes <strong>for</strong>in vivo Raman spectroscopy in the high-wavenumber region. Anal. Chem., 77(20):6747–6752(2005).69. Short M, Lam S, McWilliams A, Zhao J, and Lui Hand Zeng H. Development and prelimninaryresults of an endoscopic probe <strong>for</strong> potential in vivo diagnosis of lung cancers. Opt. Lett.,33:711–713 (2008).70. Schulmerich MV, Dooley KA, Morris MD, Vanasse TM, and Goldstein SA. Transcutaneousfiber optic raman spectroscoopy of bone using annular illumination and a circular array ofcollection fibers. J. Biomed. Opt., 11(6):060502 (2006).71. Molckovsky A, Wong Kee Song LM, Shim MG, Marcon NE, and Wilson BC. Diagnosticpotetnial of near infrared Raman spectroscopy of the colon: Differentiating adenomatous fromhyperplastic polyps. Gastrointestinal Endosc., 57:396–402 (2003).72. Mahadevan-Jansen A, Mitchell MF, Ramanujam N, Utzinger U, and Richards-Kortum R.Development of a fiber optic probe to measure NIR Raman spectra of cervical tissue in vivo.Photochem. Photobiol., 683:427–431 (1998).73. Robichaux-Viehoever A, Kanter E, Shappell H, Billheimer D, Jones H III, and Mahadevan-Jansen A. Characterization of Raman spectra measured in vivo <strong>for</strong> the detection of cervicaldysplasia. Appl. Spectrosc., 61(9):986–993 (2007).74. Victor XD, Tang YS, Gordon ML, Qi B, Gardiner G, Cirocco M, Kortan P, Haber GB, KandelG, Vitkin IA, Wilson BC, and Marcon NE, Endoscopic Doppler optical coherence tomographyin the human GI tract: Initial experience. GI Endosc., 61(7):879–890 (2005).