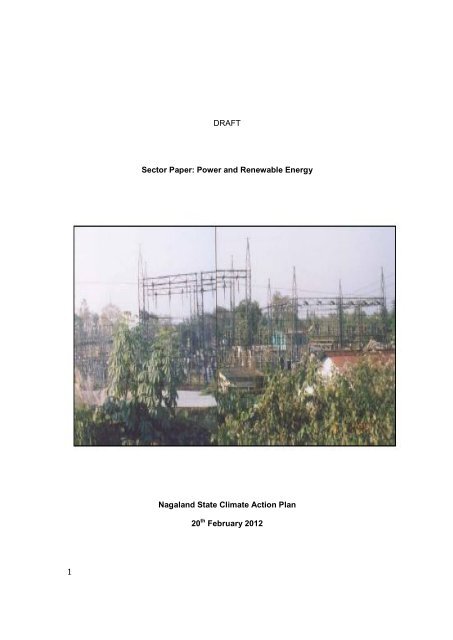
DRAFT Sector Paper: Power and Renewable Energy Nagaland ...
DRAFT Sector Paper: Power and Renewable Energy Nagaland ...
DRAFT Sector Paper: Power and Renewable Energy Nagaland ...
You also want an ePaper? Increase the reach of your titles
YUMPU automatically turns print PDFs into web optimized ePapers that Google loves.
<strong>DRAFT</strong><strong>Sector</strong> <strong>Paper</strong>: <strong>Power</strong> <strong>and</strong> <strong>Renewable</strong> <strong>Energy</strong>Nagal<strong>and</strong> State Climate Action Plan20 th February 20121
Content SheetI. Background <strong>and</strong> Introduction1.1 Overview of Electricity Supply/Generation1.2 Overview of Electricity Consumption Patterns1.3 Other Features of the Electricity <strong>Sector</strong> of the state1.4 Key Concerns of the <strong>Sector</strong>1.5 Likely Impacts of Climate Change on the <strong>Energy</strong> <strong>Sector</strong>1.5.1 Increasing Consumption Trends1.5.2 Electricity Supply Constraints1.5.3 Loss of Forest Cover <strong>and</strong> impact on <strong>Energy</strong>1.5.4 Impacts on Agriculture <strong>and</strong> Livelihoods <strong>and</strong> need for alternativeSolution1.5.5 Impacts on Water resourcesII. Institutional Mechanism governing the <strong>Sector</strong>2.1 Organisation, Programmes <strong>and</strong> Policies governing the <strong>Sector</strong>2.2 Adequacy of the Institutions to h<strong>and</strong>le Climate Change2.3 Adequacy of current programmes to meet the challenges of Climate Change2III. Strategies for Adaptation <strong>and</strong> Mitigating Climate Change3.1 Key Strategies to address climate change3.2 Linking growth <strong>and</strong> development to Climate Change – a Trend of Nagal<strong>and</strong><strong>Energy</strong>pathway which is climate friendly while fostering Growth3.3 Detailed Plan to implement strategies with budgets, programmes <strong>and</strong>implementingagencies.List of Figures-Figure 1: Sources of Electricity SupplyFigure 2: Household Electrification Status of Nagal<strong>and</strong>Figure 3: Sales of Electricity by class of consumersFigures 4 & 5: Town Wise Electricity ConsumptionFigures 6 & 7: Domestic <strong>Sector</strong> Electricity Consumption trendsFigure 8: Graphical representation of T & D LossFigure 9: Projected Temperature Chart for Nagal<strong>and</strong>Figure 10: Urban Population Growth in Nagal<strong>and</strong>Figure 11: Sources of fuel for cooking <strong>and</strong> heatingFigures 12, 13, 14 <strong>and</strong> 15: Increasing share of <strong>Renewable</strong> <strong>Energy</strong> in the StateFigure 16: Green <strong>Energy</strong> Share of the <strong>Energy</strong> Mix in Nagal<strong>and</strong>
4I. Introduction1.1 Overview Electricity Supply/Generation of the State:The <strong>Energy</strong> <strong>Sector</strong> plan for the state of Nagal<strong>and</strong> aims at achieving an integratedapproach to address climate change in t<strong>and</strong>em with the National Action Plan on ClimateChange <strong>and</strong> in particular, the key missions of the Action Plan, namely, “The Enhanced<strong>Energy</strong> Efficiency Mission”, “The National Solar Mission” <strong>and</strong> the “Sustainable HabitatMission”.Nagal<strong>and</strong>’s electricityrequirement is primarilymet from the CentralElectricity Generatingstations, wheeledthrough the <strong>Power</strong> GridCorporation of IndiaNetwork of the NorthEast Region. The statehas a very smallelectricity generationcapacity, with the totalinstalled capacity ofgeneration being 27.5MW as on 2012.Figure 1: Sources of Electricity SupplySource: Department of <strong>Power</strong>, Nagal<strong>and</strong>The electricity supply from the central grid tends to vary from peak to off peak season,since the main supply of electricity from the grid is from hydro-electric sources ofgeneration. During the months of November to June, where the generation capacitiesare low, the supply of electricity to the state varies from 50 MW for peak hour supply <strong>and</strong>30 MW during off peak hours, while for the months of July to October, the supply ofelectricity to the state is as high as 110 MW.Table 1: Seasonal Supply of Electricity to the State for Peak <strong>and</strong> Off-PeakHoursFrom November to JuneFrom July to OctoberPeak Hour Off-PeakHoursPeak Hours Off-PeakHoursDem<strong>and</strong> (in 110 MW 55 MW Dem<strong>and</strong> (in 110 MW 70 MWMW)MW)Availability 50 MW 30 MW Availability 110 MW 110 MW
(in MW) (Grid Only) (in MW)Surplus or -60 MW -25 MW Shortfall (indeficit (inMW)MW)+40 MW +40 MWSource: Department of <strong>Power</strong>, Nagal<strong>and</strong>With exacerbated impacts of climate change, managing electricity supply from the hydroelectricsources might become a uphill task, due to possible reduction in water flow insome of the river systems in the long run.1.2 A Brief Description of the Electricity Consumption pattern inNagal<strong>and</strong>:Nagal<strong>and</strong> is one of thestates with very low percapitaenergyconsumption. The currentper-capita energyconsumption of Nagal<strong>and</strong>is 110 kWh, while thenational average is 700kWh. However, Nagal<strong>and</strong>is one of the states, whichhas a fairly high level ofhousehold electrification,both rural as well asurban. The main reasonfor low level ofconsumption is supply<strong>and</strong> infrastructureconstraintsFigure 2: Household Electrification Status of Nagal<strong>and</strong>Source: Department of <strong>Power</strong>, Nagal<strong>and</strong>Poor electricityinfrastructure <strong>and</strong>supply is the maincause for industrialconsumption to beextremely low.Figure 3: Sales of Electricity by class of consumers5
As of now, the largest consumption of electricity is by the domestic sector, followed bybulk consumers <strong>and</strong> commercial sector.Table 2: Growth of Consumption of Electricity under different Class ofConsumers2005-06 2006-07 2007-08 2008-09 2009-10No MU No MU No MU No MU No MUDomestic 133,374126.20136,041128.71152,178117.68159,788127.63164,515175.84Commercial13,80321.1113,94721.3117,32021.2216,375,23.3717,27322.71Industrial 1379 27.171292 27.441353 31.851958 34.302095 11.86PublicLighting823 0.26 829 0.44 852 2.90 824 1.94 581 1.83Public 22 2.98 22 3.01 20 4.29 27 4.37 27 1.27WaterWorksAgricultu 0 0 0 0 0 2 0 2 0.04reSource: Department of <strong>Power</strong>, Nagal<strong>and</strong>As can be seen from Table 2 above, the consumption in the industrial sector has actuallyseen a downward trend, particularly from 2009-10, largely due to the closure of a fewindustries, primarily due to poor electricity supply.The domestic sector consumption has seen an upward trend, partcularly from 2008-09.One of the reasons for this, is due to growth of urban centres, improved economicconditions of people <strong>and</strong> thereby changess in lifestyle patterns, leading to increase indem<strong>and</strong> for electricity.In the domestic sector the major consumption of electricity is lights, fans <strong>and</strong> television,with air conditioning registering a consumption of 5% of the total electricity consumed,while in Dimapur, it is already 20%.Figures 4 & 5: Town Wise Electricity Consumption6
7Figures 6 & 7 Domestic <strong>Sector</strong> Electricity Consumption trends
Source: Department of <strong>Power</strong>, Nagal<strong>and</strong>The agriculture sector is not a consumer of electricity, as most of the irrigation is eitherrain-fed or through water canals or natural springs.The water supply sector is also a very low consumer of electricity, as again the mainsources of supply is through canals <strong>and</strong> natural springs <strong>and</strong> by <strong>and</strong> large supply isthrough gravitational force. The state has very littled piped water supply <strong>and</strong> has virtuallyno water treatment facility <strong>and</strong> therefore the energy consumption for water works isextremely minimal.1.3 Other Features of the Electricity <strong>Sector</strong> of the State:Nagal<strong>and</strong> is one of the states which has very high T & D <strong>and</strong> AT & C Losses. The T & DLoss estimated by the Nagal<strong>and</strong> Electricity Regulatory Commission (NERC) for the year2009-10 is 40.77%, while the estimate of the Department of <strong>Power</strong>, Nagal<strong>and</strong> was36.46%. The estimate by the NERC is based on the following computation.8Table 3: 2009-10, <strong>Energy</strong> Availability ChartSl.No Particulars 2009-10<strong>Energy</strong> Availability1 Own Generation (MU) 73.362 <strong>Power</strong> Purchase from CGS (MU) 395.253 Free <strong>Power</strong> from Doyang (MU) 27.914 Less Inter State Loss (Pool loss) @3.5% on (2) + (3) 14.81
5 UI Purchases 15.846 Less sales outside state 75.677 <strong>Power</strong> availability at state periphery 421.888 Sales within States (MU) 249.889 T & D Loss (MU) 172.0010 T & D Loss % 40.77Source: Department of <strong>Power</strong>, Nagal<strong>and</strong>As per the data of the Central Electricity Authority, the T & D Losses for the state in2002-03 was around 56.71% <strong>and</strong> it is now at 40.77%. The trend in the losses has beenmore or less static – while there is a drop in some years, there is also a steep rise in theother years. This erraciticity of T & D Losses is evident from the graph below.The following table <strong>and</strong> graph, gives an indication of the T & D Loss trends in the state,from 2002 till date.Table 4: T & D Loss Trends in Nagal<strong>and</strong>2002-032003-042004-052005-062006-072007-082008-092009-10T & D 294.24 302.76 354.03 353.09 346.16 411.60 462.72 172.00Loss inMillionUnitsT & D 56.71% 55% 48.26% 58.99% 54.79% 55.61% 58.30% 40.77%loss in% ageSource: Department of <strong>Power</strong>, Nagal<strong>and</strong>Figure 8: Graphical representation of T & D LossSource: Department of <strong>Power</strong>, Nagal<strong>and</strong>In addition to the T & D Losses, there is also commercial loss <strong>and</strong> both are factored inthe total AT&C loss in the state Therefore, the total losses in the state – both T & D <strong>and</strong>Commerical Losses put together works to 60%, which is in line with the past trends.9
1.4 Key Concerns of the <strong>Sector</strong>:1.4.1 Key Concerns of the <strong>Sector</strong>The Key concerns of the energy sector are as follows:a. Dependent on the Central Grid for most of its electricity needsb. Bulk of the supply from the Central Grid is met from Hydro-Electric sources <strong>and</strong> hencesupply during lean seasons is extremely erratic.c. The state has currently very limited investments in the renewable energy sectord. The state has very limited implementation of energy efficiency <strong>and</strong> conservationmeasuree. Huge AT &C Losses accounting to close to 60%f. Very low per-capita electricity consumption, which is largely due to poor electricitysupplyg. Poor electricity infrastructure, resulting in a number of industries having to close down<strong>and</strong> has also resulted in poor per-capita electricity consumptionSome of the Key Concerns which could further increase due to climate change area. Reduction in supply of electricity even during non-lean hydro seasons, which may bedue to shortage of water availability even for coal fired power plants elsewhere in thecountry <strong>and</strong> this could potentially lead to reduction in generation capacities.b. The continuation of the huge ATC losses could impose a huge fiscal burden on thestate, due to possible increase in the electricity tariffs generated into the central grid.c. Shortage of water could also impact small hydro generation in the state in the longrun.d. Increase in domestic consumption of electricity due to longer <strong>and</strong> hotter summers <strong>and</strong>due to more intense winters1.4.2: People’s Perception of Concerns from the <strong>Sector</strong>Nagal<strong>and</strong> on paper is near 100% electrified with close to 90% of all its householdshaving electricity connection. However, quality of electricity access is not up to therequirements of the people of Nagal<strong>and</strong>.10
A field trip to interact with villages/communities across 6 districts of Nagal<strong>and</strong>,namely, Mokokchung, Tuensang, Wokha, Phek, Kiphire <strong>and</strong> Peren <strong>and</strong> hadmeetings organised at Pfutsero, Meluri, Pungro, Tuensang, Alisofor <strong>and</strong> Wokha withinteraction with a wide range of people representing communities, farmers, districtadministrative officials, officials from the forest department, NGOs <strong>and</strong> civil societygroups among others.Some of the common issues across the region that we visited, with regard to “energyaccess” was as follows:a) Most of the villages in the region had electricity accessb) But the quantum of electricity supply was extremely low, primarily – low voltagewas a common issuec) In terms of hours of supply, while the supply ranged from 4-10 hours a day, thecommon feed back was that most of the supply was during the day time, whenthe need for electricity was the least. The biggest issue was that most often thannot, the supply of electricity during night hours <strong>and</strong> early morning hours, wherethe need was the highest, was extremelylow <strong>and</strong> erraticd) Bulk of electricity supplied was primarily was lighting purposes. Due to lowvoltage <strong>and</strong> quality of supply, most appliances would not worke) Much of the area that we visited being in the relatively higher altitude zones withpleasant weather almost through out the year, the need for air-conditioning wasnear zero. At best, fans would suffice. However, in winters, the need for waterheating was high <strong>and</strong> sometimes, there was also a requirement for room heaters.f) There was hardly any electricity supply for small <strong>and</strong> agro-based units <strong>and</strong> linkingenergy with livelihoods was not being practiced, again due to erratic <strong>and</strong> lowquality supply.g) The time taken to rectify faults took time – some time, as much as 5 to 15 days.One of the reasons that was attributed to this is that, currently, Nagal<strong>and</strong> hasonly one transformer repairing unit, which is located at Dimapur <strong>and</strong> hence,transporting the faulty transformer to Dimapur, getting it rectified <strong>and</strong> transportingit back to the location did take some timeh) The load shedding was highest during winter <strong>and</strong> summer months <strong>and</strong> this islargely attributed to the fact that bulk of the energy for the state comes fromHydro sources <strong>and</strong> during dry seasons, the state gets a lesser power allocationfrom the Central Grid.1.5 Likely Impacts of Climate Change on the Electricity/ <strong>Energy</strong><strong>Sector</strong>1.5.1 Increase in <strong>Energy</strong> Consumption<strong>Energy</strong> consumption of a city is closely related to its ambient temperature. However,urban temperature is changing because of heat isl<strong>and</strong> effect <strong>and</strong> global warming. TheInternational Panel on Climate Change (IPCC) forecasts that the global temperature willbe rising in the next 100 years] 1 ; the temperature rise in 2100 relative to 2000 wouldrange from 1.4 to 5.8 1C under different adaptation scenarios.1 Fourth Assessment Report, IPCC, 200711
Further, there have been a number of scientific studies which estimate that, with a 1°Cambient temperature rise, the consumption of electricity would increase by 9.2% ofdomestic consumption, 3% of commercial consumption <strong>and</strong> 2.4% of industrialconsumption. 2Nagal<strong>and</strong>In the case of Nagal<strong>and</strong>, it hasbeen estimated that by the midcentury(2020-2050), the state isprojected to experience anincrease in annual averagetemperature between 1.6°C <strong>and</strong>1.8°C. Southern districts showhigher increase in temperature,with Kohima, Wokha, Phek,Zunheboto <strong>and</strong> Tuensang showingan increase in temperaturebetween 1.7 <strong>and</strong> 1.8°C. TheNorthern districts of Mon <strong>and</strong>Mokokchung are projected to havean increase in averagetemperature of between 1.6°C <strong>and</strong> 1.7°C.Figure 9: Projected Temperature Chart forDistrict-wise projected increase in annual average temperature (°C)for the period 2021-2050 (A1B SRES scenario) compared tobaseline (1975), projected by the HadRM3 model.Based on the above, it is estimated that there would be approximately a 14-15%increase in electricity consumption in the state, due to temperature rise. due totemperature rise.Other factors such as increasing growth of domestic consumers, increase inconsumption due to growth in GDP etc, increase in electricity coverage area, etc wouldcontinue to have a bearing on electricity consumption.2http://www.ucdenver.edu/academics/colleges/Engineering/research/CenterSustainableUrbanInfrastructure/LowCarbonCities/Documents/Wing-tat%20Hung/WTHung%20energy%20consumption.pdf12
In the case of DImapur, a temperature rise of 1.6°C is likely to lead to an increase inelectricity consumption by 20% to 30% primarily due to increased use of air-conditional<strong>and</strong> cooling appliances <strong>and</strong> this trend is likely to be seen in all low altitude areas ofNagal<strong>and</strong>.Climate change also brings in more intense winters in some areas, though the spells willbe shorter. However, considering that with the exception of perhaps Dimapur, all theother regions of Nagal<strong>and</strong> experience peak winters <strong>and</strong> further that one of the majordomestic consumption of electricity during winters is for room <strong>and</strong> water heaters, thewinter intensity increase will potentially lead to an increase in the use of room <strong>and</strong> waterheaters.Figure 10: Urban Population Growth in Nagal<strong>and</strong>There is also likely to be a hugepressure on urban centres, aswater shortages <strong>and</strong> changes inrainfall pattern is likely to affectagriculture <strong>and</strong> thererby alsoaffecting livelihoods, leading tomore people coming to towns insearch of employment.of 28.97% of the total population of the state.The urban population in 2001constituted 17.23% of the totalpopulation of the state, while asper the 2011 provisional census,the urban population comprisesA number of new towns have been added during the period <strong>and</strong> there has also been amovement from rural to urban areas in the past decade. A negative growth rate ofpopulation amounting to -14.59% has been recorded in rural areas of Nagal<strong>and</strong>.The domestic consumption in Nagal<strong>and</strong> has seen a increasing trend in the last fiveyears, both in terms of the number of consumers as well as in terms of quantum ofelectricity consumption.13
1.5.2 Affecting Electricity Supply:The power availability during monsoon period is more than sufficient to meet the energyrequirements of the state, however, during lean seasons, the state faces a shortfall of 60MW of peak dem<strong>and</strong> <strong>and</strong> 25 MW of off-peak dem<strong>and</strong>.The impacts of climate change on water resources have been highlighted in the Fourthassessment report of the Intergovernmental Panel on Climate Change (IPCC) indicatingan intensification of the global hydrological cycle affecting both the ground water <strong>and</strong>surface water supply. The effects of climate change on water resources in India includeincreased drought, river system closure, reduced flows in Himalayan river systems,extreme floods, reduced river yields <strong>and</strong> reduced ecosystem resilience.Therefore, with the huge dependence on electricity from large hydro-electric sources <strong>and</strong>with science based evidence that river systems in India could possibly be affected due toClimate Change, the already shortfall in electricity supply in off-season periods couldintensify further.1.5.3 Impact on Forest CoverheatingTraditional bio-mass is one ofthe predominant fuels inNagal<strong>and</strong> particularly forcooking <strong>and</strong> heating purposes.The average family usage offire-wood <strong>and</strong> wood chips forheating <strong>and</strong> cooking purposes is63 Kgs per day, as against 1.11Kgs of LPG <strong>and</strong> 0.13 Kgs ofKerosene in rural households. Inurban households too, fire-wood<strong>and</strong> wood chips is the dominantfuel for cooking <strong>and</strong> heating,with the total fire-woodconsumption per month perhousehold working to 20 Kgs,as against 3 Kgs of LPG.Figure: 11: Sources of fuel for cooking <strong>and</strong>14
Source: Department of <strong>Power</strong>, Nagal<strong>and</strong>In a climate constrained world, forest protection is one of the best forms of mitigatingcarbon, as it acts as a carbon sink. With increasing population <strong>and</strong> continueddependence on firewood for cooking <strong>and</strong> heating, could potentially affect the forest coverof the state. Therefore, it is imperative that the current dependence on firewood formeeting energy needs to be change drastically.1.5.4 Impacts on Agriculture <strong>and</strong> Livelihoods <strong>and</strong> need for alternative solutionThe detailed assessment of impacts of climate change <strong>and</strong> the development ofvulnerability profiles for the agriculture sector of Nagal<strong>and</strong> clearly indicates the need foradaptation strategies <strong>and</strong> practices to enable different sectors <strong>and</strong> the stakeholders tocope with climate risks.With a projected fall in agricultural production, there is a need to resort to adaptivepractices, going beyond adaptive agriculture practice, such as developing “storage <strong>and</strong>warehousing facilities”, “creating market access <strong>and</strong> allowing movement of agriculturalproduce to areas beyond the current traditional geographic areas.Such practices would be energy intensive, particularly for perishable commodities,requiring the use of “cold storage” <strong>and</strong> developing “cold storage chains”. This would addburden on the electricity <strong>and</strong> energy requirement for the state.From an economic point of view <strong>and</strong> keeping growth <strong>and</strong> GDP targets in mind, withfalling revenues from the agricultural sector <strong>and</strong> the need to also ensure employmentgeneration, there needs to be some focus on the development of the industrial sector.The growth of the industrial sector is vastly dependent on energy availability <strong>and</strong> access.This again would add a burden on the electricity <strong>and</strong> energy requirements of the state.1.5.5 Impacts on Water resourcesNagal<strong>and</strong> has distinct physical <strong>and</strong> physiographic characters with almost 95 per cent ofits total area covered by hilly terrain with limited valley areas. Heavy rainfall during southwest monsoon period leads to run off, stream bank erosion, flash flooding <strong>and</strong> change inriver courses.With meager rainfall in the lean period (winter period), Nagal<strong>and</strong> is frequentlyexperiencing water scarcity especially vis-a-vis drinking water. The communities living atthe top of the hills are the ones most vulnerable.In order to address the issue of water scarcity, in addition to putting in place practicessuch as “sustainable water management system”, “rain water harvesting”, etc, there isalso a need to have environment friendly reservoirs that are built for water storage <strong>and</strong>for efficient water distribution.Currently, most areas of Nagal<strong>and</strong> are dependent on rivers, streams <strong>and</strong> other runoffsfor water usually by gravitational force.15
A water management system would require piped system of water distribution, which inturn would require substantial amount of energy.As of now, public water works consumes just about 1.27 Million kWh of electricity peryear, but with the changed scenario, it is estimated that by 2025, the public worksdepartment would easily require close to 60 Million kWh of electricity to maintain a robust<strong>and</strong> sustainable water distribution system across the state.II. Institutional Mechanism Governing the <strong>Energy</strong> <strong>Sector</strong>2.1 Organisations, Programmes <strong>and</strong> Policiesa) The Department of <strong>Power</strong>, Nagal<strong>and</strong>:The Department of <strong>Power</strong>, Nagal<strong>and</strong>, is responsible for Generation, transmission <strong>and</strong>distribution of power <strong>and</strong> maintenance of generation stations, transmission <strong>and</strong>distribution network in the State.The major policies <strong>and</strong> programmes implemented by the Department of <strong>Power</strong> are1) Implementation of the Electricity Act, 2003, the National Electricity Policy <strong>and</strong> theRural Electrification Policy2) The Rajiv G<strong>and</strong>hi Grameen Vidyut Vitaran Yojana, aimed at rural electrification3) The Re-structured Accelerated <strong>Power</strong> Reforms Project aimed at reducingTransmission <strong>and</strong> Distribution Losses4) Implementation of the rural16
) The Department of Electrical Inspectorate:The Department of Electrical Inspectorate is m<strong>and</strong>ated with the administration of theprovisions of the <strong>Energy</strong> Conservation Act 2001 in the state. The Department ofElectrical Inspectorate is also m<strong>and</strong>ated to inspect all electrical installation of Hightension <strong>and</strong> medium voltage consumers, permit new high tension lines.The major policies <strong>and</strong> programmes implemented by the Department are1) Implementation of the <strong>Energy</strong> Conservation Act, 20012) Implementing the various programmes of the Bureau of <strong>Energy</strong> Efficiencynamely:a. The <strong>Energy</strong> Efficient Lamps Programme – Bachat Lamp Yojanab. The St<strong>and</strong>ards <strong>and</strong> labeling Programme for promoting energy savingappliances <strong>and</strong> devicesc. The <strong>Energy</strong> Conservation <strong>and</strong> Building Coded. The Municipal Dem<strong>and</strong> Side Management Programme, aimed atreplacements of equipment <strong>and</strong> appliances for street lighting <strong>and</strong> waterpumping with energy efficient systemse. National Mission on Enhanced <strong>Energy</strong> Efficiencyc) Department of New <strong>and</strong> <strong>Renewable</strong> <strong>Energy</strong>, Nagal<strong>and</strong>The department of New <strong>and</strong> <strong>Renewable</strong> <strong>Energy</strong>, Nagal<strong>and</strong> is tasked to implement all theprogrammes <strong>and</strong> policies for the promotion <strong>and</strong> penetration of New <strong>and</strong> <strong>Renewable</strong><strong>Energy</strong> sources.Specifically, the Department of New <strong>and</strong> <strong>Renewable</strong> <strong>Energy</strong> implements the followingpolicies <strong>and</strong> programmes1) The National Solar Mission2) The Off-grid programme, primarily· Biomass based heat <strong>and</strong> power projects <strong>and</strong> industrial waste to-energy projectsfor meeting captive needs· Biomass gasifiers for rural <strong>and</strong> industrial energy applications· Watermills/micro hydro projects – for meeting electricity requirement of remotevillages· Small Wind <strong>Energy</strong> & Hybrid Systems - for mechanical <strong>and</strong> electricalapplications, mainly where grid electricity is not available.· Solar PV Roof-top Systems for abatement of diesel for power generation inurban areas3) The National Grid Programme, which is primarily17
To promote Grid-interactive renewable power projects based on wind power, biomass,small hydro <strong>and</strong> solar with the objective of ensuring that it is mainly private investmentdriven, with favourable tariff policy regimes established by State Electricity RegulatoryCommissions (SERC), <strong>and</strong> almost all-renewable power capacity addition during the yearhas come through this route.d) The Nagal<strong>and</strong> Electricity Regulatory Commission (NERC) is m<strong>and</strong>ated todetermine the tariff for generation, supply, transmission <strong>and</strong> wheeling ofelectricity, wholesale, bulk or retail, as the case may be within the State <strong>and</strong> toregulate electricity purchase <strong>and</strong> procurement process of distribution licenseesincluding the price at which electricity shall be procured from the generatingcompanies or licensees or from other sources through agreements for purchaseof power for distribution of supply within the State.e) The Nagal<strong>and</strong> Empowerment of People through <strong>Energy</strong> Development (NEPeD):NEPED is a people centric project that works with the farmers of Nagal<strong>and</strong>, todevelop community centric small hydro systems with their current focus being todesign <strong>and</strong> develop “Pico Hydro Models” that are efficient, cost effective <strong>and</strong> canbe deployed at homes to generate sufficient electricity to meet the requirement ofrural households of Nagal<strong>and</strong>.f) The Department of Industries <strong>and</strong> Commerce:The department of industry <strong>and</strong> commerce should technically be the largest consumer ofelectricity in the state of Nagal<strong>and</strong>, if the plans of the Government as envisaged in theIndustrial Policy of 2000, revised in 2004 had materialized. However, as of now, theindustries department is trying to ensure that adequate energy is available to propel theirMSME <strong>Sector</strong> <strong>and</strong> to ensure that there is sufficient power for the Nagal<strong>and</strong> Mini ToolRoom <strong>and</strong> Training Centre, the Nagal<strong>and</strong> Pulp <strong>and</strong> <strong>Paper</strong> Company, <strong>and</strong> the SEZ. TheDepartment of Industries <strong>and</strong> Commerce is m<strong>and</strong>ated to create a favorable environmentfor industrial growth in Nagal<strong>and</strong> <strong>and</strong> one area where they are working in coordinationwith the Department of <strong>Power</strong>, Nagal<strong>and</strong>, is to ensure that the power infrastructure isstrengthened in order to ensure that there is a suitable environment created for industrialpromotion in the state.2.2 Adequacy of the Institutions to h<strong>and</strong>le a climate changeThe institutional framework is fairly robust <strong>and</strong> evolved with focused set of m<strong>and</strong>ates,which equips itself to perform. The clear role of each of the institutions also avoidsoverlaps <strong>and</strong> the tendency to pass on responsibility of implementation to anotherdepartment is avoided.For instance, while both the Department of New <strong>and</strong> <strong>Renewable</strong> <strong>Energy</strong> <strong>and</strong> theDepartment of <strong>Power</strong> have the responsibility of setting up or promoting renewableenergy generation, the m<strong>and</strong>ate for each of the department is clearly outlined, withthe Department of New <strong>and</strong> <strong>Renewable</strong> <strong>Energy</strong> promoting generation projects of 1MW <strong>and</strong> below <strong>and</strong> the Department of <strong>Power</strong> promoting renewable energygeneration projects of above 1 MW.18
Similarly, with the Department of Electrical Inspectorate being m<strong>and</strong>ated toimplement energy efficiency programmes, all issues related to energy efficiencywhether it is a street light efficiency programme or a village light efficiencyprogramme comes under its ambit <strong>and</strong> responsibility.However, it must be noted while that these Departments work independently as ofnow, since their m<strong>and</strong>ates <strong>and</strong> responsibilities are also very focused, for addressingclimate change, all the departments of Nagal<strong>and</strong> will have to work together <strong>and</strong>establish inter-departmental coordination to assess <strong>and</strong> plan a combined strategy toensure that the energy sector is a zero carbon emitter to the extent possible. Theinter-departmental coordination should also include departments such as the UrbanPlanning, Transport, Forest, Science <strong>and</strong> Technology amongst others.2.3 Adequacy of current programmes to meet the challenges ofClimate ChangeThe Programmes implemented by the sector with the exception of those programmesspecifically under the National Action Plan on Climate Change are “business as usualprogrammes” <strong>and</strong> not necessarily programmes which have been designed to addressclimate change.However, since India does not need to take any emission reduction actions per se, theprogrammes <strong>and</strong> policies which are being implemented properly will ensure thatefficiencies of the sector improves, people have access to modern energy <strong>and</strong> electricityneeds, reduce the dependence on forests for energy purposes <strong>and</strong> importantly increasethe fuel mix of energy generation to ensure sustainable energy production in the mediumto long run.However, in terms of programme, there is a need to factor in climate change projectionsin the long run <strong>and</strong> plan generation capacity addition as well as reforms in the energysector.In terms of implementation, some of the weak links that was observed are:· The activities of the departments are st<strong>and</strong> alone in nature,· Actions implemented are mostly reactive <strong>and</strong> not proactive,· Programmes do not cover the entire state comprehensively,Therefore, it is important that there is coordination between all the implementingdepartment to ensure that programmes are linked <strong>and</strong> actions cover the entire state.Some of the main implementation constraints cutting across all the concerneddepartments of the <strong>Energy</strong> <strong>Sector</strong> with regard to accessing funds from the CentralGovernment, due to the manner in which the policies or programmes are framed isprimarily due to the fact that these programmes have not been framed keeping theground realities of the North Eastern States in mind.The following are some of the ground realities of Nagal<strong>and</strong>:19
a. L<strong>and</strong> Holding: Peculiar to Nagal<strong>and</strong> <strong>and</strong> some states in North East, 90%of the l<strong>and</strong> holding is with individuals <strong>and</strong> communities with very little l<strong>and</strong>holding by either the revenue department of the state or any otherGovernment Departments. Therefore, in the implementation of projects,which require l<strong>and</strong>, the Government has to purchase the l<strong>and</strong> from thepeople at market rates. Most schemes of Government of India, whether itis the capital subsidy provided by the Ministry of New <strong>and</strong> <strong>Renewable</strong><strong>Energy</strong> for implementing <strong>Renewable</strong> <strong>Energy</strong> Programme or theRestructured Accelerated <strong>Power</strong> Reforms Project of the Ministry of<strong>Power</strong>, there is no financial assistance provided for l<strong>and</strong>. The fact thatl<strong>and</strong> has to be bought by the Government, results in a substantialincrease in project cost <strong>and</strong> therefore, the subsidy or assistancecomponent of the Government of India is in-sufficient to implement manyprojects.b. Transportation <strong>and</strong> Logistics Issue: Being a hilly state, transporting tohilly terrains involves a very high transportation cost. In most projectsfinanced or supported by the Central Government, price benchmarks aremade based on an All India Average Price, which will be a good 15% -20% lower than the l<strong>and</strong>ing costs of these equipment/ appliances inNagal<strong>and</strong>. This again contributes to the financial assistance by the centralgovernment proving to be insufficient to meet the costs of the project inNagal<strong>and</strong>.c. Being a hilly terrain with a relatively low solar isolation, particularly inwinter months, the efficiency rate of some of the solar related applicationis lesser than what it would be in the Plains of India. Therefore, some ofthe existing schemes of the government where only “interest subsidy” isgiven as against “capital subsidy”, will not be viable, as the “paybackperiod” will be huge <strong>and</strong> people will not be able to afford it. Therefore,there needs to be special assistance given to North East States where inaddition to “interest subsidy”, “capital subsidy”, also needs to be given toencourage people to go in for costlier renewable energy options. This islargely applicable to “solar thermal applications”. The subsidy element for“individual bio-gas” plants need to also go up, to encourage people toinstall bio-gas plants.d. Given the terrain of Nagal<strong>and</strong>, schemes which are aimed to strengthenelectricity distribution networks, need to be supported to a large extentthrough Central Government Schemes, as these would also be costintensive.To illustrate the above, for example, for remote rural electrification programme, as perthe guidelines of the Ministry of New <strong>and</strong> <strong>Renewable</strong> <strong>Energy</strong>, the following costs areconsidered:1. SPV Home-lighting System Model – II with 37 W module, 2 lights: Maximum of Rs.8,990/-2. SPV Home-lighting System Model – I with 18 W module, 1 lights; Maximum of Rs.4,370/-20
3. Street lighting system with 74 W SPV module <strong>and</strong> 11 W CFL lamp, Maximum of Rs.17,980/-4. Street lighting system with 45 W SPV module <strong>and</strong> LED lamp, Maximum of Rs.10,935/-However, these are based on the costs of the system in the plains of India. Forinstance, in the Bangalore market, one could procure home lighting systems for lessthan Rs. 9,000/-. However, the l<strong>and</strong>ed costs of these equipments are a good 30%higher in Nagal<strong>and</strong>. For instance the home lighting systems as per the abovespecification would cost roughly Rs. 15,000/-. Therefore, the amount provided by theMinistry scheme is a good Rs. 6,000/- lesser than the market rate.Similarly, if a comparison was to be made of the l<strong>and</strong>ed cost of solar water heaters, thecost of a 100 Liters of Solar Water heater in either the Delhi or Bangalore Market is Rs.14,000/-, while it would be Rs. 25,000/- in Nagal<strong>and</strong>.In both the above, if the cost of maintenance <strong>and</strong> getting skilled manpower to come fromthe plains for erection <strong>and</strong> installations, the cost goes up further.The above example is not just solar specific but cuts across all equipments.The cost of transporting any heavy equipment from say Delhi to Kohima <strong>and</strong> further onto say Zunheboto would work out to at least Rs. 100,000/-.Therefore, it is imperative that local factors are taken into consideration <strong>and</strong> existingschemes <strong>and</strong> programmes of the Government of India be modified particularly for NorthEast States.21
III. Strategies to combat the challenges of Climate Change3.1 Strategies:Issues of Concern from a ClimatePerspectiveIncrease in <strong>Energy</strong> ConsumptionAffecting Electricity SupplyAddressing <strong>Energy</strong> Generation, lesserDependence on Central Grid <strong>and</strong>therefore making the sector climateresilient <strong>and</strong> ensuring reducing off-seasonelectricity supplyStrategies to Address itPromoting <strong>Energy</strong> efficiency <strong>and</strong>sustainable use of electricity at all levels<strong>and</strong> categories of usage such as:· Identifying <strong>and</strong> Converting theLighting Devices in all KeyGovernment Buildings to <strong>Energy</strong>Efficient Lighting by 2015· In a phased wise manner, convertingall street <strong>and</strong> public lighting to LEDLighting· <strong>Energy</strong> Auditing of all Governmentbuildings· Promotion of building star ratingsystems <strong>and</strong> incorporate buildingbye-laws for energy conservation· Program for awareness building onBEE star labeled appliances· Initiating <strong>and</strong> Implementing demoprojects on energy efficiency incommercial sector· Reducing T & D LossesReducing the dependence on Central Gridof <strong>Energy</strong> Supply by augmenting own cleanelectricity generation capacities· Maximizing the potential ofcommunity owned decentralizedrenewable energy option· Promotion of Small HydroProjects· Promotion of Solar PVProjects· Promotion of biogas plants<strong>and</strong> manure management· Promotion of bio-massgassifier projects· Identify wind potential sites<strong>and</strong> promote wind power· Prepare a master plan for alldistrict HQs under the “SolarCity project”22
Reducing Impacts on Forests · Increasing de-centralised energyapplications3.2 Linking growth <strong>and</strong> development to Climate Change – a Trend ofNagal<strong>and</strong> <strong>Energy</strong> pathway which is climate friendly while fosteringGrowthThe aim of the Nagal<strong>and</strong> Government as far as the <strong>Energy</strong> <strong>Sector</strong> is concerned is toensure “energy access” to all, while fostering economic <strong>and</strong> social development. In thisregard, the government proposes to ensure that industrial activities are encouraged inthe state, with focus on small <strong>and</strong> agro-based industries, while reviving some of the largeindustries <strong>and</strong> getting investments for other industries which can help the state to furtherits growth potentials.As far as the domestic energy consumption is concerned, based on projections, it isestimated that the per-capita energy consumption from the current level of roughly 100kWh to at least 800 kWh by 2031, by ensuring 100% energy access for all withincreased income generation in order to also increase energy consumption whilekeeping it sustainable <strong>and</strong> clean to the extent possible.Being a state, with very little or no emission from the energy sector, the state proposesto continue to be “carbon positive” , despite the steep growth in energy consumption, aslaid out in the section on “future supply trends”.In short, while in 2027, the per-capita energy consumption will be 600 kWh, it wouldincrease to 800 kWh by 2031. The connected load for industrial connection from thecurrent level of less that 5 MW would touch 110 MW by 2027.However, the share of Green <strong>Energy</strong>, which is a combination of energy efficiency, ATCloss reduction <strong>and</strong> increased generation capacity addition through renewable energywould touch the 100% mark by the year 2019-20, <strong>and</strong> in fact start generating surplusgreen energy which can be marketed to other states at a “Feed in Tariff” rate, becomingan “income earning” sector for the Department of <strong>Power</strong>, Nagal<strong>and</strong>.The following graphs indicate how the share of Green <strong>Energy</strong> progressively increasesover the years in the <strong>Energy</strong> Generation Mix of the state, <strong>and</strong> by 2019 Nagal<strong>and</strong> couldperhaps be one of the very few states that could perhaps boast of 100% renewableenergy, with the bulk of it being from non-conventional renewable energy sources.Figures 12, 13, 14 <strong>and</strong> 15: Increasing share of <strong>Renewable</strong> <strong>Energy</strong> in the State23
One other area where, there will be substantial progress is with regard to the limiting oftraditional bio-mass or fire wood for cooking. The department for new <strong>and</strong> renewableenergy proposes to cover 12,500 households with household level bio-gas plants by theend of the 12 th Plan, which will increase to a further 25,000 households by the end of the13 th Plan <strong>and</strong> gradually cover as many households as possible all over Nagal<strong>and</strong> by theend of the 14 th Plan.Combining this with electricity access to all households <strong>and</strong> increasing supply <strong>and</strong>quality of supply, it is hoped that the use of both traditional bio-mass as well as kerosenewould reduce drastically.3.3 Detailed Plan to implement strategies with budgets, programmes<strong>and</strong> implementing agencies.3.3 Detailed Plan to implement strategies with budgets, programmes<strong>and</strong> implementing agenciesSolution: Regulating <strong>Energy</strong> ConsumptionStrategy (2012-2017) Medium Term (2017-2022)Long Term (2022-2027)A T & C LossReductionSet of activities underthe R-APDRP which willhelp to reduce ATClosses of 60% to 37%Target of reducing a t& c Loss from 37% to24%Target of reducinga t & c Loss fromthe 24% to 12%(Implementingagency:Department of<strong>Power</strong>, Nagal<strong>and</strong>)Budgets: Rs. 535 CrBudget: Rs. 700 CrBudget: Rs. 1000CrBudget: Ministry of<strong>Power</strong> – RestructuredAccelerated <strong>Power</strong>DevelopmentReforms ProjectMunicipal LevelProgrammes(ImplementingAgency: TheElectricalInspectorate,Nagal<strong>and</strong>)Budget/ProgrammeDetailed Mapping <strong>and</strong>auditing of allGovernment buildingsconforming to the<strong>Energy</strong> ConservationAct for efficiencypotentials in Kohima<strong>and</strong> DimapurBudget: Rs. 100 CrDetailed Mapping <strong>and</strong>auditing of allGovernment buildingsconforming to the<strong>Energy</strong> ConservationAct for efficiencypotentials in all otherGovernment buildingsin Kohima <strong>and</strong>Dimapura.DetailedMapping <strong>and</strong>auditing of allGovernmentbuildingsconforming to the<strong>Energy</strong>Conservation Actfor efficiencypotentials in all24
Municipal levelDSM Programmeof Bureau of<strong>Energy</strong> EfficiencyBudget: Rs. 200 CrGovernmentbuildings in theentire length <strong>and</strong>breadth ofNagal<strong>and</strong>GreenInitiativeVillageImplementing of findingof the audit to make thebuildings energyefficient compliance inaccordance with the<strong>Energy</strong> ConservationAct in Nagal<strong>and</strong>Budget: Rs. 5 CrDetailed Mapping <strong>and</strong>auditing of Street lightsfor conversion in to LEDlighting on iconic <strong>and</strong>key roads of Kohima,Dimapur <strong>and</strong> otherdistrict head quartersBudget: Rs. 1 CrInitiating the conversionof Street lights in toLED lighting on iconic<strong>and</strong> key roads ofDimapur <strong>and</strong> Kohima<strong>and</strong> other district headquartersBudget: Rs. 14 CrConverting 100 Villagesinto 100% LED lightingvillagesImplementing offinding of the audit tomake the buildingsenergy efficientcompliance in all otherGovernment buildings<strong>and</strong> governmentbuildings in theKohima <strong>and</strong> Dimapurin accordance with the<strong>Energy</strong> ConservationActBudget: Rs. 10 CrDetailed Mapping <strong>and</strong>auditing of Streetlights for conversion into LED lighting on allmajor roads ofKohima <strong>and</strong> Dimapur<strong>and</strong> other district headquarterBudget: Rs. 1 CrInitiating theconversion of Streetlights in to LEDlighting on all majorroads of Dimapur <strong>and</strong>Kohima <strong>and</strong> otherdistrict head quartersBudget: Rs. 29 CrConverting 500Villages in to 100%LED lighting vilalgesBudget: Rs. 350 CrImplementing offinding of the auditto make thebuildings energyefficientcompliance in allGovernmentbuildings in theentire length <strong>and</strong>breadth ofNagal<strong>and</strong>Budget: Rs. 15 CrDetailed Mapping<strong>and</strong> auditing ofStreet lights forconversion in toLED lighting on allmajor roads of alltowns of Nagal<strong>and</strong>Budget: Rs. 1 CrInitiating theconversion ofStreet lights in toLED lighting on allmajor towns of alltown, including thenew towns ofNagal<strong>and</strong>Budget: Rs. 49 CrConverting 1000Villages in to 100%LED lightingvillagesBudget: Rs. 10 CrBudget: Rs. 50 CrBudget: Rs. 100 CrBuilding NormsDrafting new buildingbye-laws incorporatingImplementing newbuilding bye-lawsStrict enforcementof building bye-25
(ImplementingAgency: ElectricalInspectorate)Programme:<strong>Energy</strong>Conservation <strong>and</strong>Building Code,Bureau of <strong>Energy</strong>Efficiencyprinciples of <strong>Energy</strong>Conservation <strong>and</strong>building codeBudget: Rs. 5 Crincorporatingprinciples of <strong>Energy</strong>Conservation <strong>and</strong>building codeBudget: Rs. 10 Crlaws incorporatingprinciples of<strong>Energy</strong>Conservation <strong>and</strong>building codeBudget: Rs. 15 CrSolution: Increasing self-Reliance on Sustainable <strong>and</strong> Green <strong>Energy</strong> GenerationExplore SmallHydro Projects(ImplementingAgency:Department of New<strong>and</strong> <strong>Renewable</strong><strong>Energy</strong>)Programme:MNRE’s SmallHydro ProgrammeInvestigation <strong>and</strong>detailed survey of 17potential Hydro SitesBudget Rs. 5 CrCommissioning of 12MW of Micro/Mini/SmallHydro ProjectsBudget Rs. 200 CrTo come up with apolicy which incoordination withother departments forwater bodyrejuvenationBudget Rs. 5 CrCommissioning of 50MWofMicro/Mini/SmallHydro ProjectsBudget: Rs. 400 CrCommissioning of100 MW ofMicro/Mini/SmallHydro ProjectBudget: Rs. 800 CrSolar Projectsunder the NationalSolar Mission(ImplementingAgency:Department of New<strong>and</strong> <strong>Renewable</strong><strong>Energy</strong>)Commissioning <strong>and</strong>operationalizing GridInteractive Solar PV<strong>and</strong> Solar-Wind HybridProject – 10 MW <strong>and</strong>implementing Solar CityProjectBudget Rs. 228 CrCommissioning <strong>and</strong>operationalizing GridInteractive Solar PV<strong>and</strong> Solar-WindHybrid Project – 10MW <strong>and</strong> implementingSolar City ProjectBudget: Rs. 255 CrCommissioning<strong>and</strong>operationalizingGrid InteractiveSolar PV <strong>and</strong>Solar-Wind HybridProject – 35 MW<strong>and</strong> implementingSolar City ProjectProgramme:National SolarMissionBudget Rs. 582 CrBio-mass Commissioning <strong>and</strong> Commissioning <strong>and</strong> Commissioning26
gasification project(ImplementingAgency:Department of New<strong>and</strong> <strong>Renewable</strong><strong>Energy</strong>)operationalizing of Gridinteractive bio-massgasification – 10 MWBudget Rs. 5 Croperationalizing ofGrid interactive biomassgasification –15 MWBudget: Rs. 10 Cr<strong>and</strong>operationalizing ofGrid interactivebio-massgasification – 15MWBudget Rs. 20 CrProgramme:National Bio-massGassificationProjectsLargePotentialHydroImplementingAgency:(Department of<strong>Power</strong>, Nagal<strong>and</strong>)Commission of a 165MW Major HydroProject at DikhuBudget: Rs. 131 CrCommissioning of a150 MW major hydroproject at Tizu-ZungkiBudget Rs. 700 CrOther projectsBudget Rs. 1200CrProgramme:NationalPolicyHydroSolution: Minimising the impacts on Forest Cover by reducing the dependence onFirewoodSolar MissionImplementingAgency: TheDepartment of<strong>Power</strong>, Nagal<strong>and</strong>Programme:NationalMissionSolarSolar water heatercoverage of 1000 metresquare per year with100 litres systemBudget Rs. 5 CrSolar water heatercoverage of 3000metre square per yearwith 100 litres systemBudget Rs. 10 CrSolar water heatercoverage of 3000metre square peryear with 100 litressystemBudget Rs. 15 CrBio-gasProgrammeImplementingAgency: TheDepartment of<strong>Power</strong>, Nagal<strong>and</strong>Programme:Increasing coverage ofbio-gas programmefrom the current level of1000 household plantsto at least 2500household plants peryear = 12,500Increasing coverageof bio-gas programmefrom 2500 householdsto 5000 householdsper year = 25,000householdsBudget Rs. 20 CrIncreasing <strong>and</strong>ensuring fullcoverage of biogasprogrammeexploiting fullpotential of bio-gasBudget Rs. 30 Cr27
National Bio-Gas<strong>and</strong> ManureProgramme ofMNREBudget Rs. 10 CrSolution: Minimising the Use of Fossil Fuel – Kerosene for lightingSolar MissionImplementingAgency: TheDepartment of<strong>Power</strong>, Nagal<strong>and</strong>Programme:National SolarMission – Off GridProjectsCommissioning of 5MW of Off-Grid Projectsunder the RemoteVillage ElectrificationProjectBudget Rs. 145 CrCommissioning of 5MW of Off-GridProjects under theRemote VillageElectrification ProjectBudget Rs. 145 CrCommissioning of5 MW of Off-GridProjects under theRemoteElectrificationProjectVillageBudget Rs. 145 CrCreating off – GridSolutions throughthe development<strong>and</strong> deployment ofPico HydroNEPeD proposes to setup community picohydro projects totalingto 2 MWNEPeD proposes toset up community picohydro projects totalingto 5 MW (Cumulative)NEPeD proposesto set upcommunity picohydro projectstotaling to 10 MW(Cumulative)ImplementingAgency: NEPeDBudget Rs. 15 CrBudget Rs. 15 CrBudget Rs. 15 CrProject: Research<strong>and</strong> Developmentbudgetary head ofMNRE3.4 Projected impacts of Plans to Make Nagal<strong>and</strong> Climate Resilient:To make the <strong>Energy</strong> <strong>Sector</strong> of Nagal<strong>and</strong> Climate Resilient, a combination of new effortsalong with “business as usual plans” needs to be implemented. Some of the businessas usual plans which needs to be implemented in a strengthened manner are:a) A T & C Loss reduction Programmeb) <strong>Energy</strong> Conservation <strong>and</strong> Efficiency Programmesc) Implementation of “sustainable habitat” programmes <strong>and</strong> putting in place legalframework for “green buildings”.d) Implementation of the Solar Missione) Coordinated effort with the “Green India Mission”, to reduce the use of “traditionalbio-mass for cooking <strong>and</strong> heating.New Efforts that needs to be encouraged are:28
a) Renewed efforts to set up “decentralised renewable energy solutions”, primarilythrough a combination of small hydro (Pico or mini or micro), solar, small windgenerators to ensure 24 x 7 clean energy supply at the village levels. Thecurrent focus of either the Solar Mission or other <strong>Renewable</strong> <strong>Energy</strong> solutions arelargely for “grid connected systems”. The Rajiv G<strong>and</strong>hi Grameen VidyutikaranYojana (RGGVY) does have schemes for decentralised distributed generation,which can be utilised for “energizing” Nagal<strong>and</strong> villages.b) Since Nagal<strong>and</strong> does not have adequate “electricity generation capacities” of itsown, to meet the state’s growing requirements, there needs to be a re-look givento “renewable energy generation capacity addition” for the state <strong>and</strong> if required,“caps on generation capacities” needs to be removed to facilitate rapid expansionof renewable energy generation capacities.The Strategies <strong>and</strong> Action Plan detailed in sections 2.1 to 2.3 will help address thefollowing:a) Increase the generation capacity addition, without compromising on environmentissues, with a thrust given to decentralised renewable energy solutions.b) Ensure that the dependence on the central grid for electricity needs is reducedgradually.c) Project a dem<strong>and</strong> growth which factors in possible increase in dem<strong>and</strong> forelectricity as a “adaptive measure” to address climate change.d) Address the issue of “energy access” to people, by providing them with “cleanenergy” <strong>and</strong> thereby reduce the unhealth trend of dependence on “traditional biomass”for heating.The table below gives an snap shot of the projected supply of electricity for the stateover the period of 2012 to 2027.29
Table 5: <strong>Power</strong> Generation Projection Trends – Source Wise in MW2011-122012-132013-142014-152015-162016-17Peak Load (MW) 115 152 186 225 284 340 414 467 524 625 686 747 791 824 855 885Savings potential through <strong>Energy</strong>Efficiency <strong>and</strong> Conservationmeasures (IN MW) 1 3 5 7 13 22 32 46 63 85 106 133 172 183 194 204Savings through ATC LossReduction Measures (AggressiveImplementation) 10 15 20 25 40 50 55 60 75 85 95 95 105 105 110 120Existing Hydro Unit of theNagal<strong>and</strong> Department of <strong>Power</strong>(in MW) 27 27 27 27 27 27 27 27 27 27 27 27 27 27 27 27Capacity addition planned by theDepartment of <strong>Power</strong>, Nagal<strong>and</strong>for <strong>Renewable</strong> sources of power,mainly Hydro 2 2 2 11 15 15 15 25 25 50 95 105 150 175 197 197Capacity Addition Planned New<strong>and</strong> <strong>Renewable</strong> <strong>Energy</strong> (In MW)(through Grid <strong>and</strong> Off Gridapplications 3 7 15 23 31 39 55 65 75 90 111 125 140 155 190 217Capacity Addition Planned byNEPeD through CommunityProjects 0.2 0.4 0.5 1 1.5 2 2.5 3 3.5 4 5 6 7 8 9 10Other Large Hydro (Run of theriver Sources Explored (Dikhu(165 MW)<strong>and</strong> Tizu-Zunki Hydro<strong>Power</strong> plants) (In MW)(Cumulative) 165 165 165 315 315 311 315 315 315 315 315Total Green <strong>Energy</strong> in the state inMW 43.2 54.5 69.5 94 127 314 341 381 578 656 759 806 916 968 1042 1090Net additions Capacity additionsNeeded (In MW) (Peak Loadminus Green <strong>Energy</strong>) 71.8 97.5 116.5 131 157 20 73 86 -54 -31 -73 -59 -125 -144 -187 -2052017-182018-192019-202020-212021-222022-232023-242024-252025-262026-27As can be seen from the above table, the carbon foot print of the energy generation sector of Nagal<strong>and</strong> will still be very low,with the Green <strong>Energy</strong> Component increasing from a modest 45 MW by 2011 to as much as 320 MW by 2017, assuming thatthe Dikhu Hydro <strong>Power</strong> plant is commissioned by then. By the year 2020, the state will have surplus green energy, which canbe sold to the central grid, earning revenues for the Government of Nagal<strong>and</strong>.30
The net energy which will be required from the central grid for the period till 2019, may not necessarily be carbon intensive,given that bulk of Nagal<strong>and</strong>’s energy requirement from the central grid is currently met through hydro sources. However,given that the state has requested the Government of India for a 1000 MW coal fired power plant to be built to meet itsrequirements using the coal block allotted to the state, the purchase from central grid is being assumed to be carbon emitting.The following graphs show the share of Green <strong>Energy</strong> Vs Carbon Emitting <strong>Energy</strong> over the period of 2011 to 2027.Figure 16: Green <strong>Energy</strong> Share of the <strong>Energy</strong> Mix in Nagal<strong>and</strong>31
As per the provisional 2011 census, the population of Nagal<strong>and</strong> is 19,80, 602 people<strong>and</strong> approximately 3,50,000 households. The estimated consumption of firewood is 20Kgs per household per day. The estimated consumption of firewood in Nagal<strong>and</strong> worksto a total of 4900 tonnes, computed on the basis that 70% of Nagal<strong>and</strong>’s household usefire wood for cooking <strong>and</strong> heating purposes, with the average consumption of 20 Kgs perfamily per day.As per the plans of the Nagal<strong>and</strong> State Climate Action Plan, a total of 75,000households would be covered by bio-gas plants by 2026 <strong>and</strong> all villages will haveelectricity supply. This would substantially reduce the quantum of firewood consumptionin the state for cooking purposes.32
Annexes ContentsAnnex I: Future Dem<strong>and</strong> <strong>and</strong> Supply Projections1.1 Future Electricity Dem<strong>and</strong> Projections1.2 Dem<strong>and</strong> Projections Rationale – Linking it to Climate1.3 Detailed Loss Reduction Projections1.4 Detailed <strong>Energy</strong> Efficiency <strong>and</strong> Conservation ProjectionsAnnex II: Green Generation Projections2.1 Projected Generation capacity addition PlansAnnex III: Industrial <strong>Sector</strong> PlansAnnex IV: Overview of the <strong>Renewable</strong> <strong>Energy</strong> Department <strong>and</strong> NePED33
Annexe I: Future Dem<strong>and</strong> <strong>and</strong> Supply Projection of ElectricityA detailed projection for dem<strong>and</strong> for electricity has been worked out. This is based on past trends, increase in percapitaconsumption. However, the projection is based on a “Business as usual approach”. A detailed explanation ofhow the projections have been worked out is given in the next section.The dem<strong>and</strong> project has been made for until 2027, factoring in the 12 th <strong>and</strong> 13 th plan <strong>and</strong> 14 th Plan.Table 6: Projected dem<strong>and</strong> for Nagal<strong>and</strong><strong>Energy</strong>Consumption– in MU2011-122012-132013-142014-152015-162016-172017-182018-19Domestic 250 335 375 425 520 563 700 810 927 1187 1350 1506 1597 1685 1740 1806Commercial 35 40 45 75 100 120 165 185 200 231 256 285 315 340 371 401PublicLightingPublic WaterWorks5 10 15 20 25 30 33 37 40 50 60 65 65 65 65 652 10 20 25 30 35 40 44 48 50 55 60 60 60 60 60Industries 30 50 70 90 120 150 175 190 215 250 300 350 400 450 500 550Bulk Supply 41 45 70 90 120 200 250 300 350 400 427 454 487 511 567 5912019-202020-212021-222022-232023-242024-252025-262026-27Total <strong>Energy</strong>ConsumptionT & D Lossesin MUT & D Losses(in %)Total <strong>Energy</strong>Requirementin MUPeak Load(MW)363 490 595 725 915 1098 1363 1566 1780 2168 2448 2720 2924 3111 3303 3473217 294 357 420 530 636 750 814 890 1019 1053 1088 1111 1089 1057 104260% 60% 60% 58% 58% 58% 55% 52% 50% 47% 43% 40% 38% 35% 32% 30%580 784 952 1145 1445 1734 2113 2380 2670 3187 3501 3808 4035 4200 4360 4515115 153 186 225 284 340 414 467 524 625 686 747 791 824 855 885Source: Prepared by Drafting team based onparameter34
A1.2 Rationale for Dem<strong>and</strong> Projections <strong>and</strong> Graphical Representation of Dem<strong>and</strong> Growth:The Dem<strong>and</strong> projections have been computed on a “Business as Usual Approach”, factoring in a number of factors <strong>and</strong> keydrivers of the Government of India <strong>and</strong> Government of Nagal<strong>and</strong>. They are the following:a) An increase in per-capita energy consumption over the years, starting off with at least 1 Unit per family per day by2012 for all households.b) An increase in economic growth <strong>and</strong> fostering economic <strong>and</strong> industrial development along with agriculturaldevelopmentc) Agricultural growth also linked to market access <strong>and</strong> facilities for “value-add”, which would require additional energyaccessd) 24 x 7 x 365 days supply to all electricity connections.e) Give stimulus for industrial investments by providing infrastructure. The electricity sector infrastructure improvement<strong>and</strong> development being one of the key priorities for increasing industrial investments.Based on the above parameters the dem<strong>and</strong> projections have been worked out. However, while computing it, we have onlyfactored in a business as usual implementation of AT & C Loss reduction, while reductions in energy consumption due to“energy conservation <strong>and</strong> efficiency improvements” have not been factored in. Reduction in losses due to aggressiveimplementation of AT &C Losses <strong>and</strong> due to energy conservation <strong>and</strong> efficiency programme efforts have been taken into the“Supply side”, as “energy saved is equal to energy generated”.Figure 17: Projected growth of Per-capita consumptionThe dem<strong>and</strong> for domesticconsumption will grow from aper-capita energyconsumption of roughly 87kWh in 2004 to 800 kWh in2031, while it would increaseto 250 kWh by 2017, the endof the 12 th Five year Plan.The proposed plan is toincrease the consumption ofelectricity from the 2012target of at least 1 kWh perfamily per day to at least 235
kWh per family per day on an average by the end of the 12 th Plan <strong>and</strong> further increase in the 13 th <strong>and</strong> 14 th Plan period, as canbe seen from the graph alongside.Figure 18: Peak Load Requirement trends (IN MW)conservation <strong>and</strong> efficiency improvements.The growth in the energyrequirement is from thecurrent level of 110 MW toapproximately 400 MW by2017, <strong>and</strong> close to 1000MW by 2027, the end ofthe 14 th Plan period. Thisenergy requirement isbased on a business asusual scenario <strong>and</strong> theactual installed capacityrequirement will not be asmuch, since ATC lossreduction will play a majorrole <strong>and</strong> so will energySource: Prepared by the drafting team based on dem<strong>and</strong> projectionsHowever, the key issue to factor into any planning for generation capacity addition is that Nagal<strong>and</strong> would require close to1000 MW of generation by 2027.Figure 19: IndustrialConnected Load Trendsin MWSimilarly, the industrialdem<strong>and</strong> has alsoincreased from thecurrently level of just36
around 15 Million Units to 30 Million Units by 2012 <strong>and</strong> 150 million units by 2017. The aim of the government is to fostereconomic growth through a combination of promoting industrial growth <strong>and</strong> reviving some of the existing industries withpromoting agro-based processing units. The target of the government is to establish a 25 MW industrial capacity load by theend of the 12 th Plan, <strong>and</strong> gradually increase it to 100 MW by the end of the 14 th Plan period. Industrial development hasalways be on the cards, but a number of industries which have come forward to set up units in Nagal<strong>and</strong> could not do so, dueto poor energy infrastructure. However, with modernization of transmission <strong>and</strong> distribution infrastructure along withgeneration infrastructure, it is proposed to open up Nagal<strong>and</strong> for rapid industrialization, with focus primarily on agro-based<strong>and</strong> small industries which could enhance income <strong>and</strong> livelihood options for the communities.The public works <strong>and</strong> public lighting segment will also see a tremendous growth in energy consumption, as the Nagal<strong>and</strong>government has an ambitious target of ensuring street lights <strong>and</strong> piped drinking water to every community <strong>and</strong> household inNagal<strong>and</strong> by the end of the 14 th Plan period. In terms of public lighting, while there would be a rise in growth till 2021-22, itwould remain stable thereafter <strong>and</strong> even the rate of growth would reduce by 2017, which means that attempt would be madeto ensure that all new street lights will be with LED lamps <strong>and</strong> the existing <strong>and</strong> old ones would also be in a phased manner bereplaced with LED lamps. In the public water sector, more reservoirs <strong>and</strong> water treatment plants will be set up in all districts.It is proposed to pump water to all households through piped connections. While, gravitational system would work in someplaces, water pumping systems need to be installed <strong>and</strong> energy would also be required for water treatment plants <strong>and</strong>sewerage treatment plants. Therefore this segment would also see a growth in energy consumption.A1.3 A T & C Loss Projections <strong>and</strong> trends:The aim of the Department of <strong>Power</strong>, Nagal<strong>and</strong> is to reduce the A T & C losses to 15% or even 12% by the end of the 14 thPlan period. Some efforts into the direction is already underway with detailed plans to upgrade transmission <strong>and</strong> distributioninfrastructure. Some of the current efforts/initiative taken in this direction is listed in page 15 of this report.In a Business as Usual Scenario, the AT& C Losses will come down to 30% by 2027, which is as below:Table 7: BAU Scenario for AT & C Loss Reduction TrendsTotal <strong>Energy</strong>Consumptionin MUA T & CLosses inMUA T & C Lossin MW372011-122012-132013-142014-152015-162016-172017-182018-19363 490 595 725 915 1098 1363 1566 1780 2168 2448 2720 2924 3111 3303 3473217 294 357 420 530 636 750 814 890 1019 1053 1088 1111 1089 1057 104245 60 70 85 110 130 150 160 180 200 210 215 220 215 210 205A T & C 60% 60% 60% 58% 58% 58% 55% 52% 50% 47% 43% 40% 38% 35% 32% 30%2019-202020-212021-222022-232023-242024-252025-262026-27
Losses%)(inHowever, in an aggressive scenario, the AT&C losses will come down to 12% to 15% by 2027, which the Nagal<strong>and</strong>Government proposes to embark on, subject to getting the resources for the same.Table 8: A T & C Loss reduction trends in an aggressive scenarioTotal<strong>Energy</strong>ConsumptionA T & CLosses inMU(roundedoff to thenearestroundnumber)A T & CLosses inMWA T & CLosses (in%)382011-12 2012-132013-142014-152015-162016-172017-182018-19363 490 595 725 915 1098 1363 1566 1780 2168 2448 2720 2924 3111 3303 3473180 235 270 310 360 405 480 515 530 585 585 600 585 560 495 41535 45 50 60 70 80 95 100 105 115 115 120 115 110 100 8550% 48% 45% 43% 40% 37% 35% 33% 30% 27% 24% 22% 20% 18% 15% 12%Figure 20: A T & C Loss Reduction Scenarios2019-202020-212021-222022-232023-242024-252025-26The graph alongside givesa description of the savingspotential from AT&C Lossreduction programme,which is Business as Usualas against an AggressiveImplementation approach.In a Business as Usualapproach, the loss2026-27
eduction is from the current level of 60% to 30% by 2027, while in an “aggressive” approach, it is brought down to 12% by2027.Figure 21: Net <strong>Energy</strong> Generation Savings through A T & C Loss reduction Programmewhich is 2022, with a saving of up to 120 MW by the end of the 14 th Plan period, which is 2027.The Net savingpotential ofelectricitythroughaggressiveimplementationof T & D Loss is10 MW in theyear 2011-12<strong>and</strong> goes up to50 MW by 2017,the end of the12 th plan,increases to asaving of 100MW by the endof the 13 th Plan,The Business as usual approach primarily refers to the implementation of routine ATC loss reduction programmes of theCentral Government <strong>and</strong> the State Government. However, given the fact that energy is a scarce commodity <strong>and</strong> also in viewof the serious impact of climate change, the more reduction in fossil fuel or electricity generation by conventional power plantsis followed, the better it is for the environment.39
A 1.4 Projected Efficiency <strong>and</strong> Conservation Trends:The current electricity consumption pattern amongst all segments of consumers indicatethat close to 60% of the electricity is for lighting purposes.An average of 15% of electricity consumption is for air-conditioning.The 15 year electricity consumption from 2011-12 to 2026-27 for Public Lightingsegment alone is projected to 70 MU. By converting all Public Lighting to efficientlighting, it is possible to reduce the consumption from 70 MU to 25 MU.The total consumption by the domestic <strong>and</strong> commercial segment over the span of 15years is working to 6400 MU. Assuming that 60% of this consumption is for lightingpurposes, <strong>and</strong> with modest efficient lighting application being introduced, theconsumption can reduce by 30%, the total consumption from the two segments can bereduced to 5000 MU.As an immediate measure, the government of Nagal<strong>and</strong> proposes to convert all the 11audited buildings of Dimapur <strong>and</strong> Kohima to lighting efficient buildings <strong>and</strong> also ensurethat the main street lights of Kohima <strong>and</strong> Dimapur are converted to LED, Solar lit streetlights. In the next stage, the main street of all district head quarter would also beconverted in to solar powered, LED street lights <strong>and</strong> similarly, it would target theconversion of all government buildings in Kohima <strong>and</strong> Dimapur <strong>and</strong> select buildings inother district head quarters to lighting efficient buildings.With the Bureau of <strong>Energy</strong> Efficiency proposing to gradually phase out energy in-efficientair-conditioning by 2012, all new air-conditioners being installed in Dimapur from 2012 isexpected to consumer at least 15-30% less energy, which could further reduce theconsumption of electricity.The table below gives a very conservative estimate of the saving potential in the totalenergy consumption by implementation of energy conservation <strong>and</strong> efficiency measures.41
Table 9: Savings in <strong>Energy</strong> Generation through <strong>Energy</strong> Conservation <strong>and</strong> Efficiency ProgrammeTotal <strong>Energy</strong>Consumption(IN MU)2011-122012-132013-142014-152015-162016-172017-182018-19363 490 595 725 915 1098 1363 1566 1780 2168 2448 2720 2924 3111 3303 3473Saving PotentialThrough <strong>Energy</strong>Efficiency <strong>and</strong>Conservation 2% 3% 4% 5% 7% 10% 12% 15% 18% 20% 22% 25% 30% 30% 30% 30%Savings in MU 7 15 24 36 64 110 164 235 320 434 539 680 877 933 991 1042Saving in MW 1 3 5 7 13 22 32 46 63 85 106 133 172 183 194 200The estimates that have been taken is from a low of 2% to a maximum of 35%, while, the saving potential could be a lot moretoo.Figure 22: Graphical representation of savings of electricity through efficiency programmeIn the initial years, thepercentage of savings istaken at a low of 2%,given that much of thesavings could be donethrough Government <strong>and</strong>Public Buildings, <strong>and</strong> alsofactoring in that energyaudit for only 11Government buildingshave been carried out sofar. However, with the implementation <strong>and</strong> phasing out of energy inefficient products as m<strong>and</strong>ated by the <strong>Energy</strong>Conservation Act 2001, by 2015, a number of inefficient product <strong>and</strong> appliances will be phased out. The total savings inenergy consumption starts off with a modest 1 MW by March 2012 <strong>and</strong> increases to roughly 200 MW by the end of the 14 thPlan period, which is 2027.2019-202020-212021-222022-232023-242024-252025-262026-2743
<strong>Energy</strong> Efficiency <strong>and</strong> Conservation implementation plans2011-2017 2017-2022 2022-2027<strong>Energy</strong> Auditing in allgovernment buildings inKohima <strong>and</strong> DimapurImplement lightingefficiency programme in thealready audited 11buildingsIdentifying 150 Villages <strong>and</strong>launch of a programme toprovide all the houses inthe villages with LED lightsreplacing existing onesPilot schemes coded“Green Village Initiatives ina few villages10 street lights in Kohima<strong>and</strong> 10 in Dimapur to beconverted into <strong>Energy</strong>Efficient street lightsBEE’s star rating appliancecapacity building <strong>and</strong>awareness programmesAwareness Programme onenergy efficiency <strong>and</strong>conservation in all schoolsof Nagal<strong>and</strong><strong>Energy</strong> Auditing of allGovernment buildings in alldistrict head quartersImplement lightingefficiency <strong>and</strong> energyefficiency programme in allGovernment buildings inKohima <strong>and</strong> DimapurIdentifying a further 350Villages <strong>and</strong> launch of aprogramme to provide allthe houses in the villageswith LED lights replacingexisting onesIncreasing the “GreenVillage Initiative” to 350villagesAll major street lights inKohima <strong>and</strong> Dimapur to beconverted in to energyefficient street lights.Awareness Programme onenergy efficiency <strong>and</strong>conservation in all schoolsof Nagal<strong>and</strong><strong>Energy</strong> auditing of all publicbuildings in all towns ofNagal<strong>and</strong>Implement lightingefficiency, energy efficiency<strong>and</strong> space heating usingsolar architecture in allGovernment buildings ofNagal<strong>and</strong>Identifying a further 500(reaching out to almost allof the 1286 Villages <strong>and</strong>launch of a programme toprovide all the houses inthe villages with LED lightsreplacing existing onesIncreasing the “GreenVillage Initiative” to 500villagesAll major street lights in alldistrict head quarters <strong>and</strong>towns will be converted intoenergy efficient streetlights.Awareness Programme onenergy efficiency <strong>and</strong>conservation in all schoolsof Nagal<strong>and</strong>A2 2.1 Green <strong>Energy</strong> Generation Capacities Addition in the State11 th Plan PeriodSource No of Projects Total Size in MWSolar PV Grid Connected A cluster of Projects 2 MWProjectsSolar Off-Grid for captive A total of 57 projects, 742 kWconsumption forGovernment Buildings,university etcalready sanctionedSolar – Wind Hybrid Project 2 Projects of 10 kW each,one at the ADC’s office,20 kW45
Pfutsero <strong>and</strong> theCommissioner’s office,KohimaBio-Mass Projects 7 Projects 1 MWBio-Gas ProjectFor captive consumption ofveterinary farm50 kWMicro/Mini <strong>and</strong> Small Hydro Tsutsung MHP of 1 MW 1 MWSmall Hydro generation of atotal of 2 MW by theDepartment of <strong>Power</strong>,Nagal<strong>and</strong>Project of 1 MW Lang HEP<strong>and</strong> 1 MW Toho HEP2 MWMicro/mini <strong>and</strong> small hydroInvestigation <strong>and</strong> detailedsurvey – 17 Hydro SitesTotal7.7 MW12 th Plan Period (All Cumulative)Source No of Projects Total Size in MWUnder National Solar A cluster of Projects 10 MWMission: Solar PV GridConnected ProjectsSolar City Project in Kohima2 MW<strong>and</strong> DimapurUnder National Solar A cluster of Projects 5 MWMission: Off grid Solar PVProjectsWind ProjectsSome Sites have been 100 kWidentifiedBio-Mass Gassification Cluster of them10 MWProjectsMicro/mini <strong>and</strong> small hydro Micro: 1 MW; Mini: 5 MW 12 MWsites planned by theDepartment of New &<strong>Renewable</strong> <strong>Energy</strong><strong>and</strong> Small: 6 MWMajor Hydro Projects Dikhu (165MW) 165 MWA number of communityprojects in village clustersplanned by NEPeDAll districts of Nagal<strong>and</strong> 2Small Hydro Projectsranging from 0.2 MW to 4MW already commissionedby the Department of<strong>Power</strong>, Nagal<strong>and</strong>All districts of Nagal<strong>and</strong>(List of Projects in Annex I)Total15 MW221 MW13 th Plan Period (Cumulative)Source No of Projects Total Size in MWNational Solar Mission: A cluster of Projects 20 MW (10 MW addition)Solar PV Grid Connected46
ProjectsSolar City Project in Kohima<strong>and</strong> DimapurUnder National SolarMission: Off grid Solar PVProjectsWind ProjectsBio-Mass GassificationProjectsMicro/mini <strong>and</strong> small hydroplanned by Department ofNew <strong>and</strong> <strong>Renewable</strong><strong>Energy</strong>Major Hydro ProjectsA number of communityprojects implemented byNEPeDHydro Projects ranging from1 MW to 7 MW proposed bythe Department of <strong>Power</strong>,Nagal<strong>and</strong>A cluster of ProjectsSome Sites have beenidentifiedCluster of them5 MW (3 MW addition)10 MW (5 MW addition)1 MW25 MW (15 MW addition)100 Sites 50 MW (38 MW addition)Dikhu (165 MW) <strong>and</strong> Tizu-Zungki (150 MW)All districts of Nagal<strong>and</strong>All districts of Nagal<strong>and</strong>(List in Annex I)Total315 MW (150 MW addition)5 MW (3 MW addition)95 MW (80 MW addition)526 MW14 th Plan Period (Cumulative)Source No of Projects Total Size in MWUnder National Solar A cluster of Projects 50 MW (35 MW addition)Mission: Solar PV GridConnected ProjectsSolar City Project in Kohima10 MW (5 MW addition)<strong>and</strong> DimapurUnder National Solar A cluster of Projects 15 MW (5 MW addition)Mission: Off grid Solar PVProjectsWind ProjectsSome Sites have been 2 MW (1 MW addition)identifiedBio-Mass Gassification Cluster of them40 MW (15 MW addition)ProjectsMicro/mini <strong>and</strong> small hydro 100 Sites 100 MW (50 MW addition)by the Department of New<strong>and</strong> <strong>Renewable</strong> <strong>Energy</strong>,Nagal<strong>and</strong>Major Hydro Projects Dikhu (165 MW) <strong>and</strong> Tizu- 315 MWZungki (150 MW)A number of community All districts of Nagal<strong>and</strong> 10 MW (5 MW addition)projects implemented byNEPeDHydro <strong>Power</strong> Projects All Districts of Nagal<strong>and</strong> 197 MW (102 MW addition)47
anging from 1 MW to 10MW planned by theDepartment of <strong>Power</strong>,Nagal<strong>and</strong>(Annexe I)739A 3.1 Overview of the Industrial <strong>Sector</strong> of Nagal<strong>and</strong>The mission of the Government of Nagal<strong>and</strong> for industries is described as below:“To facilitate rapid <strong>and</strong> sustained industrial development in the state through enhancedinvestments, an investor friendly environment, provision of infrastructure <strong>and</strong> institutionalsupport, attractive incentive package <strong>and</strong> optimum utilization of existing resources inorder to gainfully exploit emerging opportunities in the national <strong>and</strong> international markets<strong>and</strong> generate substantial income <strong>and</strong> employment avenues for the people of Nagal<strong>and</strong>”In this direction, the state came up with a “Industrial Policy” in the year 2000, which wasrevised in 2004.The state had identified industrial zones to attract industrial investments <strong>and</strong> 11 zoneswere identified, nameluy, Bh<strong>and</strong>ari Sub-division, Dimapur, Sub-division, Ghathashi area,Industrial Growth Centre, Longleng, Industrial Growth Centre, Noklak, Mini IndustrialGrowth Centre, Visvema, New Industrial Growth Centre, Ganeshnagar, Tizit Subdivision,Wazeho area, Tuli area, Kiphire sub-division <strong>and</strong> Longnak area.The major thrust areas identified for industrial development was:a) Food Processing Industriesb) Agro-based Industriesc) Sericultured) Floriculturee) Electronics <strong>and</strong> Information Technologyf) Pharmaceuticalsg) Bio-tech Industriesh) Cane <strong>and</strong> Bamboo Processingi) Medicinal <strong>and</strong> Aromatic Plantsj) Herbs <strong>and</strong> natural dyes industriesk) H<strong>and</strong>loom <strong>and</strong> H<strong>and</strong>icraftsl) Tourism IndustryThe other areas which were explored are mineral based industries, given the hugemineral resources of Nagal<strong>and</strong> <strong>and</strong> petrochemical industries.The industrial policy had also come up with a package of incentives to invite industrialinvestments.48
However, as of now, some of the sectors that have progress include the h<strong>and</strong>loom <strong>and</strong>h<strong>and</strong>icrafts sector, the Small <strong>and</strong> Medium Enterprises <strong>Sector</strong> <strong>and</strong> some industries withinthe Special Economic Zone. The Nagal<strong>and</strong> Mini Tool Room in addition to providingindustrial training to local youth has also started to design <strong>and</strong> manufacture “Pico-Hydro”turbines.Amongst the larger industries that existed include the Nagal<strong>and</strong> Mechanized BricksLimited, Dimapur, The Nagal<strong>and</strong> Pulp <strong>and</strong> <strong>Paper</strong> Company Limited, Tuli, both of whichhave had to be shut down due to heavy losses <strong>and</strong> lack of “sufficient electricity”.One major constraint that the Industrial sector has been facing is the lack of sufficient<strong>and</strong> good quality electricity supply. This has not only hindered industrial development,but also some of the traditional practices which Nagal<strong>and</strong> is famous for, such asBamboo Processing, H<strong>and</strong>icrafts <strong>and</strong> H<strong>and</strong>looms, etc have not been mechanized to theextent it was envisaged.However, the industrial sector has huge potentials <strong>and</strong> if the electricity infrastructure inthe state can be improved, there is ample scope for a number of industries to be set up.Further, it is also proposed to revive some of the existing industries, particularly, focus ison to revive the Nagal<strong>and</strong> Pulp <strong>and</strong> <strong>Paper</strong> Company Limited.The following are some of the initiatives already taken by the Department of Industries,Nagal<strong>and</strong>, which would bear fruits as soon as the “Electricity situation” in the stateimproves. This is in addition to the above.Industrial Growth Centre (IGC):At present,there are 23 ( twenty three) sheds under the Industrial Growth Centre inGaneshnagar,Dimapur. One M/s Naga Food Ltd. is functioning <strong>and</strong> producing cannedbamboo shoot <strong>and</strong> other food items <strong>and</strong> the unit is functioning well. Almost all shedshave been allotted to investors but yet to establish <strong>and</strong> start functioning. The mainreason for non-establishment of units even after allotment of sheds being erratic powersupply.Integrated Infrastructural Development Centre(IIDC):The Integrated Infrastructural Development Centre at Kiruphema (i.e between 25 th & 26 thkms from Kohima on NH-39) in Kohima District built at the cost of Rs.498.84 lakh wasinaugurated by the Hon’ble Chief Minister of Nagal<strong>and</strong>, Shri. Neiphiu Rio on 26 th May2009. The project is managed by the Nagal<strong>and</strong> Industrial Development Corporation Ltd(NIDC), Dimapur. Common facilities like Administrative Building, Conference Hall, BankBuilding, Building for Canteen, <strong>and</strong> Building for Research & Development <strong>and</strong> Godownincluding developed plots are readily available for entrepreneurs <strong>and</strong> investors to set upindustries.The <strong>Power</strong> Department in coordination with the industries department proposes toensure that the industries get a connected electricity load of at least 25 MW by 2017 <strong>and</strong>gradually increase it to 100 MW by 2027, the end of the 14 th Plan period.49
Bibliographya) Annual Plans of the Department of <strong>Power</strong>, Department of New <strong>and</strong> <strong>Renewable</strong><strong>Energy</strong> <strong>and</strong> Department of Electrical Inspectorateb) Statistics H<strong>and</strong>book of the Nagal<strong>and</strong> Government, 2000 <strong>and</strong> 2009c) 12 th Five Year Plan approach paper of Department of <strong>Power</strong>, Department of New<strong>and</strong> <strong>Renewable</strong> <strong>Energy</strong>, Department of Electrical Inspectorate <strong>and</strong> NEPeDd) Human Development Report, 2004e) Comprehensive Development Plan, Kohimaf) Infrastructure Assessment plan for all districts of Nagal<strong>and</strong>g) Current status of Rajiv G<strong>and</strong>hi Grameen Vidhyutikaran Yojanah) Current status of Bureau of <strong>Energy</strong> Efficiency Implementation programmesi) 10 th Plan, implementation status published by the Planning Commission50


