Macro-flow and Velocity Dispersion - SEG Digital Library
Macro-flow and Velocity Dispersion - SEG Digital Library
Macro-flow and Velocity Dispersion - SEG Digital Library

Create successful ePaper yourself
Turn your PDF publications into a flip-book with our unique Google optimized e-Paper software.
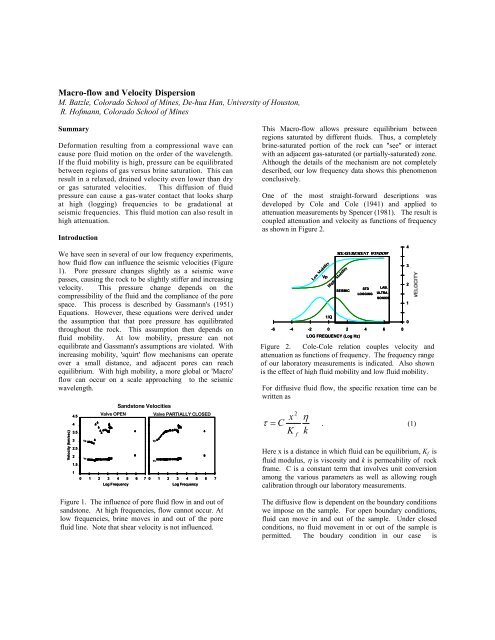
<strong>Macro</strong>-<strong>flow</strong> <strong>and</strong> <strong>Velocity</strong> <strong>Dispersion</strong>M. Batzle, Colorado School of Mines, De-hua Han, University of Houston,R. Hofmann, Colorado School of MinesSummaryDeformation resulting from a compressional wave cancause pore fluid motion on the order of the wavelength.If the fluid mobility is high, pressure can be equilibratedbetween regions of gas versus brine saturation. This canresult in a relaxed, drained velocity even lower than dryor gas saturated velocities. This diffusion of fluidpressure can cause a gas-water contact that looks sharpat high (logging) frequencies to be gradational atseismic frequencies. This fluid motion can also result inhigh attenuation.IntroductionWe have seen in several of our low frequency experiments,how fluid <strong>flow</strong> can influence the seismic velocities (Figure1). Pore pressure changes slightly as a seismic wavepasses, causing the rock to be slightly stiffer <strong>and</strong> increasingvelocity. This pressure change depends on thecompressibility of the fluid <strong>and</strong> the compliance of the porespace. This process is described by Gassmann's (1951)Equations. However, these equations were derived underthe assumption that that pore pressure has equilibratedthroughout the rock. This assumption then depends onfluid mobility. At low mobility, pressure can notequilibrate <strong>and</strong> Gassmann's assumptions are violated. Withincreasing mobility, 'squirt' <strong>flow</strong> mechanisms can operateover a small distance, <strong>and</strong> adjacent pores can reachequilibrium. With high mobility, a more global or '<strong>Macro</strong>'<strong>flow</strong> can occur on a scale approaching to the seismicwavelength.<strong>Velocity</strong> (km/sec)4.543.532.521.51VpVsValve OPENValve PARTIALLY CLOSED0 1 2 3 4 5 6 70 1 2 3 4 5 6 7Log FrequencyS<strong>and</strong>stone VelocitiesLog FrequencyFigure 1. The influence of pore fluid <strong>flow</strong> in <strong>and</strong> out ofs<strong>and</strong>stone. At high frequencies, <strong>flow</strong> cannot occur. Atlow frequencies, brine moves in <strong>and</strong> out of the porefluid line. Note that shear velocity is not influenced.VpVsThis <strong>Macro</strong>-<strong>flow</strong> allows pressure equilibrium betweenregions saturated by different fluids. Thus, a completelybrine-saturated portion of the rock can "see" or interactwith an adjacent gas-saturated (or partially-saturated) zone.Although the details of the mechanism are not completelydescribed, our low frequency data shows this phenomenonconclusively.One of the most straight-forward descriptions wasdeveloped by Cole <strong>and</strong> Cole (1941) <strong>and</strong> applied toattenuation measurements by Spencer (1981). The result iscoupled attenuation <strong>and</strong> velocity as functions of frequencyas shown in Figure 2.VpLow Mobility1/QSEISMIC-6 -4 -2 0 2 4 6 8LOG FREQUENCY (Log Hz)MEASUREMENT WINDOWHigh MobilityFigure 2. Cole-Cole relation couples velocity <strong>and</strong>attenuation as functions of frequency. The frequency rangeof our laboratory measurements is indicated. Also shownis the effect of high fluid mobility <strong>and</strong> low fluid mobility.STDLOGGINGLAB.ULTRA -SONICSFor diffusive fluid <strong>flow</strong>, the specific rexation time can bewritten asτxCKηk2= . (1)fHere x is a distance in which fluid can be equilibrium, K f isfluid modulus, η is viscosity <strong>and</strong> k is permeability of rockframe. C is a constant term that involves unit conversionamong the various parameters as well as allowing roughcalibration through our laboratory measurements.The diffusive <strong>flow</strong> is dependent on the boundary conditionswe impose on the sample. For open boundary conditions,fluid can move in <strong>and</strong> out of the sample. Under closedconditions, no fluid movement in or out of the sample ispermitted. The boudary condition in our case is43210
<strong>Macro</strong>-<strong>flow</strong> <strong>and</strong> <strong>Velocity</strong> <strong>Dispersion</strong>determined by opening <strong>and</strong> closing micro-valves in thepore fluid lines.Measured Low Frequency DataWe have observed this <strong>flow</strong> effect in the Rim S<strong>and</strong>stonewith partial saturation. In this case, the rock is measureddry <strong>and</strong> completely brine saturated (Figure 3). Atultrasonic frequencies, we see the expected effect of brinesaturation: a substantial increase in the compressionalvelocity with brine saturation. When the valves are open,fluid motion in <strong>and</strong> out of the pore system can occur at lowfrequencies. This results in a 'drained' case, or a conditionwhere pore pressure will not change with the deformationresulting from the elastic wave. Hence, the bulk moduluswill not increase. However, density is increased because ofthe water saturation. Thus the velocity is lower than for thedry case.VELOCITY (km/s)3.53.02.52.01.51.00.5RIM SANDSTONE,Pd = 2000 psi0.00 1 2 3 4 5 6 7LOG 10 FREQUENCY Log(Hz )Figure 3. Rim S<strong>and</strong>stone, dry <strong>and</strong> saturated with brine. I nbrine saturated case, the microvalves in the pore fluidsystem are open allowing fluid moving in <strong>and</strong> out ofsample. At low frequency, the sample acts at ‘drained’condition. As results, the compressional velocity is lowertha dry case due to density effect.An injection process can be used to produce aheterogenious fluid distribution. Two cubic centimeters ofliquid butane are injected into the brine saturated sample.This results in a hydrocarbon saturation of 20%. As we cansee in Figure 4, the effect is small at ultrasonic frequencies,<strong>and</strong> increases with decreasing frequency. This is what wewould expect for fluid motion <strong>and</strong> pressure equilibrationbetween the two regions. The butane, although liquid, stillhas a very low modulus. This keeps the pore pressurechange small with deformation. At lower frequencies, thebrine-saturated zone is more strongly influenced by thispressure equilibration. Applying the <strong>flow</strong> model (with theadjustable parameters) gives the red line fit to thecompressional velocity. Note that the dispersion in shearmodulus must also be included in this model calculation.VsVpFigure 4. Brine saturated <strong>and</strong> partially butane saturatedRim s<strong>and</strong>stone. At lower frequencies, the brine can comeinto pressure equilibrium with the more compressiblebutane. The macro <strong>flow</strong> model fit is shown in red.ApplicationHere we are interested in the effects of fluid <strong>flow</strong> on themoduli <strong>and</strong> velocities, through the fluid mobility <strong>and</strong>distance from a gas saturated zone.As an example of a logging application, we can apply therelaxation relation to the case of a porous <strong>and</strong> permeables<strong>and</strong>. This model consists of a thin gas saturated layer ontop of a brine saturated zone. A uniform shale surroundsthe s<strong>and</strong>. The use of the Cole-Cole relation aids us sinceboth the low frequency <strong>and</strong> high frequency moduli can beestimated from the log. The 'low frequency' modulus ispresumed to be that of the gas s<strong>and</strong> (3 GPa). The infinitefrequency limit will be the modulus of the brine saturatedzone as measured as an isolated, homogeneous system (7.5GPa). These values were chosen to match values observedin a Gulf of Mexico log. The log in Figure 6 shows a s<strong>and</strong>with a gas cap over a brine saturated zone in Figure 6.Under the correct conditions of high fluid mobility <strong>and</strong> lowfrequency, we can see that the nature of the gas-watercontact can be changed substantially. What appears as asharp contact at high (logging) frequencies, is smeared intoa gradational contact at seismic frequencies (right side ofFigure 6).
<strong>Macro</strong>-<strong>flow</strong> <strong>and</strong> <strong>Velocity</strong> <strong>Dispersion</strong>BULK MODULUS(GPa)2 4 6 8 10Gas Sat.BULKATTENUATION(1/Q k )0 0.1 0.2Gas Sat.DEPTH1 Hz1010,00050Brine Sat.500,000 Hz10,00050101 HzBrineSat.MACRO FLOWMODELViscosity0.01 PoisePermeability1000 mDFigure 5. Modeled modulus <strong>and</strong> attenuation for agas s<strong>and</strong> layer on top of a brine saturated zone. Atlower frequencies, fluid motion can be significant,blurring the contact <strong>and</strong> causing high attenuation.To apply this technique to correct a sonic log of dispersion,we need to know the distance from the gas-liquid contact,porosity, permeability, <strong>and</strong> frequencies involved. Most ofthese can be extracted from the logs or derived from thetool characteristics. Permeability is often a difficult valueto obtain, but as a first estimate, were could use therelations similar to the form developed by Berg,(1970),Figure 6. Schematic of <strong>flow</strong> effects on a logged section. Athigh (log) frequencies, the contact appears abrupt (blockedblue line). At seismic frequencies, the contact appearsgradational (red line).k = c 2 k S h φ m (2)where S h is shale content <strong>and</strong> c k is a constant.To examine the influence on seismic data, simple, 1-Dforward models were calculated. As seen in Figure 7, theinfluence of the gas/brine boundary at low frequencies issubstantial. Due to the pressure equilibration, the upperbrine zone appears seismically to be gas saturated.ConclusionsPore fluid motion <strong>and</strong> pressure equilibration can occur overdistances similar to the seismic wavelength if fluid mobilityis high. The equilibrated rock will have a lower velocity atlow frequencies. This fluid motion can also cause higherattenuation. As a result, synthetic seismic traces derivedfrom high frequency sonic tools will be different from theobserved low frequency seismic traces.Figure 7. Synthetic traces calculated for the case inFigure 6. The signature at high frequency is substantiallydifferent than that at low frequencies.
<strong>Macro</strong>-<strong>flow</strong> <strong>and</strong> <strong>Velocity</strong> <strong>Dispersion</strong>ReferencesBerg, Robert R., 1970, Method for determiningpermeability from reservoir rock properties: Trans. GulfCoast Assoc. of Geol. Soc., v. 20, p. 303-317.Cole, K.S., <strong>and</strong> Cole, R.H., 1941, <strong>Dispersion</strong> <strong>and</strong>absorption in dielectrics; J. Chem. Phys., 9, 341-351.Gassmann, F., 1951, Uber Die elastizitat poroser medien,Vier, der Natur Gesellschaft, 96,1-23.Spencer, J.W., 1981, Stress relaxation at low frequencies influid saturated rocks: attenuation <strong>and</strong> modulus dispersion;J. Geophys. Res., 86, 1803-1812.AcknowledgmentsWe would like to recognize the support provided to us <strong>and</strong>the ‘Fluids Consortium’ by our corporate sponsors:Amerada-Hess, Burlington Resources, ChevronTexaco,ConocoPhillips, ExxonMobil, Jason, JNOC, Kerr-McGee,Marathon, Encana, , Paradigm, Shell, Statoil, <strong>and</strong> Unocal.