ELECTRICAL DISTURBANCES APPARENTLYOF ... - Soft.belastro.net
ELECTRICAL DISTURBANCES APPARENTLYOF ... - Soft.belastro.net
ELECTRICAL DISTURBANCES APPARENTLYOF ... - Soft.belastro.net
- No tags were found...

You also want an ePaper? Increase the reach of your titles
YUMPU automatically turns print PDFs into web optimized ePapers that Google loves.
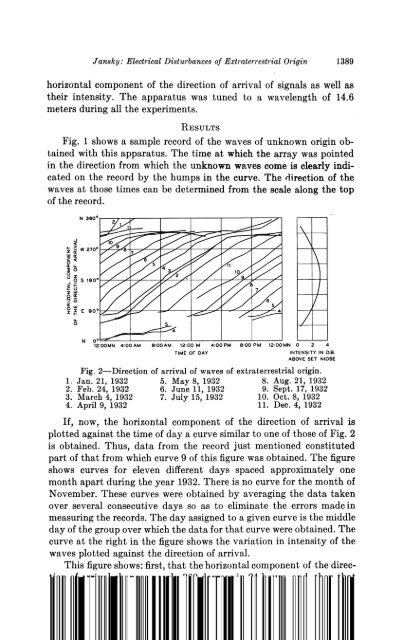
Jansky: Electrical Disturbances of Extraterrestrial Origin1389horizontal component of the direction of arrival of signals as well astheir intensity. The apparatus was tuned to a wavelength of 14.6meters during all the experiments.RESULTSFig. 1 shows a sample record of the waves of unknown origin obtainedwith this apparatus. The time at which the array was pointedin the direction from which the unknown waves come is clearly indicatedon the record by the humps in the curve. The direction of thewaves at those times can be determined from the scale along the topof the record.-J012:00MN 4:00AM 8:00AM 12:00 M 4:00PM 8:00 PM 12:00MN 0 2 4TIME OF DAY INTENSITY IN D.B.ABOVE SET NIOSEFig. 2-Direction of arrival of waves of extraterrestrial origin.1. Jan. 21, 1932 5. May 8,1932 8. Aug. 21, 19322. Feb. 24, 1932 6. June 11, 1932 9. Sept. 17, 19323. March 4, 1932 7. July 15, 1932 10. Oct. 8, 19324. April 9, 1932 11. Dec. 4, 1932If, now, the horizontal component of the direction of arrival isplotted against the time of day a curve similar to one of those of Fig. 2is obtained. Thus, data from the record just mentioned constitutedpart of that from which curve 9 of this figure was obtained. The figureshows curves for eleven different days spaced approximately onemonth apart during the year 1932. There is no curve for the month ofNovember. These curves were obtained by averaging the data takenover several consecutive days so as to eliminate the errors made inmeasuring the records. The day assigned to a given curve is the middleday of the group over which the data for that curve were obtained. Thecurve at the right in the figure shows the variation in intensity of thewaves plotted against the direction of arrival.This figure shows: first, that the horizontal component of the directionof arrival changes nearly 360 degrees in 24 hours, and, then that