Cruise report - Coastal Observatory, Liverpool Bay, Irish Sea
Cruise report - Coastal Observatory, Liverpool Bay, Irish Sea
Cruise report - Coastal Observatory, Liverpool Bay, Irish Sea

You also want an ePaper? Increase the reach of your titles
YUMPU automatically turns print PDFs into web optimized ePapers that Google loves.
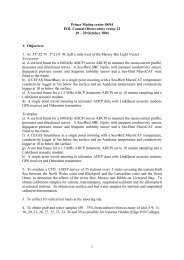
Prince Madog cruise 29/08POL <strong>Coastal</strong> <strong>Observatory</strong> cruise 5610 – 12 September 20081. Objectives1. At Site A 53º 32´ N 3º 21.8´ W, (CTD station 1 and 9)To recovera) A sea bed frame containing a 600kHz ADCP (waves ADCP) to measure the mean currentprofile, pressures and directional waves, <strong>Sea</strong>-Bird SBE 16plus with pumped conductivitysensor, digiquartz pressure sensor and a <strong>Sea</strong>Point turbidity sensor, SonTek ADV andAanderra oxygen optode.b) A CEFAS SmartBuoy (with cellulose bags) in a single point mooring. Attached to themooring wire are <strong>Sea</strong>Bird MicroCat temperature, conductivity loggers at 5 and 10m belowthe surface and miniloggers at 7.5 and 15 m below the surface.To deployc) an identical bedframe to that which was recovered.d) an identical CEFAS smartbuoy to that which was recoverede) Collect 10 vertical zooplankton net hauls (CEFAS).2. At Site B 53º 27´ N 3º 38.6´ W, (CTD station 21)To recovera) A CEFAS SmartBuoy (with cellulose bags) in a single point mooring. Attached to themooring wire are <strong>Sea</strong>-Bird MicroCat temperature, conductivity loggers at 5 and 10m belowthe surface and miniloggers at 7.5 and 15 m below the surface.b) A sea bed frame for a 600 kHz ADCP (waves ADCP) to measure the mean currentprofile, pressures and directional waves. A <strong>Sea</strong>-Bird SBE 16plus with pumped conductivitysensor, digiquartz pressure sensor and a <strong>Sea</strong>Point turbidity sensor were fitted to the frame. A1200 kHz telemetry ADCP was fitted to the frame.c) A telemetry buoy.To deployd) A CEFAS SmartBuoy (with cellulose bags) in a single point mooring. Attached to themooring wire are <strong>Sea</strong>-Bird MicroCat temperature, conductivity loggers at 5 and 10m belowthe surface and miniloggers at 7.5 and 15 m below the surface.e) A sea bed frame for a 600 kHz ADCP (waves ADCP) to measure the mean current profile,pressures and directional waves. A <strong>Sea</strong>-Bird SBE 16plus with pumped conductivity sensor,digiquartz pressure sensor and a <strong>Sea</strong>Point turbidity sensor were fitted to the frame. A 1200kHz telemetry ADCP was fitted to the frame.
f) A telemetry buoy fitted with an ACS and <strong>Sea</strong>-Bird MicroCat.3. To conduct a CTD / LISST survey of 34 sites every 5 miles covering the eastern <strong>Irish</strong> <strong>Sea</strong>between the North Wales coast and Blackpool and the Lancashire coast and the Great Orme,to determine the effects of the rivers Dee, Mersey and Ribble on <strong>Liverpool</strong> <strong>Bay</strong>. To obtaincalibration samples for salinity, transmittance, suspended sediment and for chlorophyll atselected stations. To obtain near surface and bed water samples for nutrient and suspendedsediment determination.4. Collect sediment samples at each of the CTD sites.5. Collect near surface water samples for Elena Stoica at stations 1, 21 & the most offshorestation. Some of these samples are to be ‘fixed’ using provided formaldehyde solutions andfrozen at -20ºC and others left in the fridge.6. To conduct a benthic survey at site 1 and site 21 (five grab samples at each site).2.1 Scientific personnelPhil Knight (Principal Scientist)Andy LaneTerry DoyleChris BalfourEmlyn JonesJoanne HopkinsDave Pearce (CEFAS)Jenny Keable (CEFAS)Anne Hammerstein (School of Ocean Sciences)Katherine Nisbet (University of <strong>Liverpool</strong>)2.2 Ship’s officers and crewSteve Duckworth (Master)David Shaw (Chief Officer)Les Black (Chief Engineer)Meikle Mackay (2 nd Engineer)Martin Ansley (A.B.)Mick Callaghan (Bosun)Steve Lewis (A.B.)Richard Ederle (Cook)3. Narrative (times in GMT)The anchor chain clumps, two sea-bed frames and instrumentation were loaded onto RVPrince Madog between 15:30 and 17:00 on 9 September 2008. The frames had already beenpartly fitted out with ADCP and <strong>Sea</strong>Bird loggers in the pavilion. The tower and instrumentswere fitted to the SmartBuoy toroid by CEFAS personnel. The main survey CTD was foundto be faulty and taken off for repair.
Prince Madog left Menai Bridge at 06:00 on 10 September 2008. The ship’s surfacemonitoring, pCO 2 system and ADCP were switched on at 07:00 near to Puffin Island. Site Awas reached at 09:48 on the 10 September 2008 and a surface water sample taken forCEFAS. At site A the ADCP release was fired at 10:01 and surfaced at 10:02. Thereplacement ADCP was then deployed at 11:22. The replacement SmartBuoy was deployedat 11:55 and the old buoy recovered between 12:06 and 12:32. This was followed by twowater samples (surface and bottom) for CEFAS and six sediment grabs.Site B was reached at 14:50 and the ADCP recovered between 14:54 and 15:13 on 10September 2008. On inspection the frame was found to be missing two ADCP’s. Nodamage was evident, which suggested that they had not been correctly bolted on to the framebases. The telemetry buoy was recovered between 15:37 and 15:53. It was found to bedamaged and could not be refurbished with new telemetry units and the planned ACS withCTD unit underneath. The replacement ADCP was then deployed at 16:27. The replacementSmartBuoy was deployed at 17:23. Prince Madog then headed back to Menai Bridge to pickup a replacement CTD (<strong>Sea</strong>-Bird 19). The surface monitoring, ADCP and pCO 2 system wereswitched off passing Puffin Island at 19:32. Prince Madog arrived at Menai Bridge at 20:15on 10 September 2008.Prince Madog left Menai Bridge at 06:15 on 11 September 2008. The ship’s surfacemonitoring, pCO 2 system and ADCP were switched on at 07:19 near to Puffin Island.The SmartBuoy at site B was recovered between 09:06 and 09:13. Surface water sampleswere taken for Elena Stoica and CEFAS. This was followed by six sediment grabs and oneCTD dip.Prince Madog reached the Hilbre Channel at 12:14. The wave buoy was recovered between15:18 and 15:37 during slack water conditions. The wave buoy was vented immediately onceon deck. Site A was reached at 17:16 and CTD’s and water samples taken for Elena Stoica.This was followed by zooplankton net hauls. The last CTD was taken at site 33 together withwater samples for Elena Stoica.The surface monitoring, ADCP and pCO 2 system were switched off passing Puffin Island at22:00. Prince Madog arrived at Menai Bridge at 23:15 on 11 September 2008. All the majormoorings objectives were accomplished with the exception of the telemetry buoydeployment. However, a comprehensive CTD survey was not possible because of the faultwith the main CTD.
Figure 1. <strong>Cruise</strong> track.4. Moorings (times in GMT)4.1 The set up of the recovered instruments was as follows:Site Aa) Frame setup at POL prior to cruiseWaves ADCP 600 kHz RDI (S/N 5806).Mode 1: 100 pings every 10 minutes (velocity standard deviation 0.007 m s-1).35 x 1 m bins (2.65 – 36.65 m above the bed).Beam co-ordinates - speeds, correlation, echo intensity, % good.Sound velocity calculated from temperature, depth and salinity of 32.Break at 12:03 on 11 September 2008 (clock drift +23s). Only recorded 195Mb of data onfirst 512Mb original sandisk card.<strong>Sea</strong>-Bird 16plus S/N 4848 on base of frame with pumped conductivity sensor underneath.Sample interval 600s. <strong>Sea</strong>Point turbidity sensor (S/N 10489) taped to roll bar; set up for 0 -125 FTU range. Sample interval 600 s; digiquartz integration time 40 s, range 400; pump0.5s, 1 s delay. Aanderaa oxygen optode S/N 674.Clock settings not noted.SonTek ADV (Acoustic Doppler Velocimeter); ADV Logger G479; head A984.Distance from center of three prong head on ADV transmitter to deck was 1.262m (i.e. above
sea bed). Red prong aligned to ADCP beam 3. Sample rate 16Hz; burst interval 3600s;samples in each burst 19200; burst length 1200s. Time reset to 14:00:00 on 29 July 2008,logging set to start at 09:00:00 on 30 July 2008. Logging stopped at 09:02 on 11 September2008.The frame was fitted with a fizz link, a spooler with 50m of rope for recovery of the ballastweight and two Benthos releases s/n 71904 (Rx 10.0 kHz, Tx 12.0 kHz, release C) and s/n70358 (Rx 11.0 kHz, Tx 12.0 kHz, release A).b) SmartBuoy Mooring. (Loggers set up at POL prior to cruise)<strong>Sea</strong>-Bird MicroCat temperature, conductivity and pressure recorder s/n 2991 at 5m below thesurface. Sample interval 600s. Logging stopped at 13:52 on 10 September 2008.<strong>Sea</strong>-Bird MicroCat temperature and conductivity recorder s/n 2506 at 10m below the surface.Sample interval 600s.Clock settings not noted.Mini-logger s/n 6020E at 7.5 m below the surface set to record at 600s intervals. Clocksettings not noted.Mini-logger s/n 6028E at 15 m below the surface set to record at 600s intervals.Clock settings not noted.The CEFAS SmartBuoy is fitted with one surface CTD, light sensors at 1 and 2 m below thesurface, a water sampler which obtains water samples once per day for laboratory nutrient(TOXN and silicate; no filtration therefore no phosphate), fluorometer (<strong>Sea</strong>Point), oxygen(Aanderaa Optode) and chlorophyll determination and an in situ NAS2E nutrient analyser.The CTD and light data are transmitted back to CEFAS via Orbcomm. The frame was fittedwith bags of material supplied by University of <strong>Liverpool</strong> for the determination of bacterialdegradation.The single point mooring was composed of ½" long link chain, marked by a 1.8 m diametertoroid and anchored by a half tonne clump of scrap chain.Site Ba) Waves ADCP 600 kHz RDI 2390, 1GB memory.Mode 1: 100 pings every 10 minutes (velocity standard deviation 0.007 m s-1).35 x 1 m bins (2.65 – 36.65 m above the bed).Beam co-ordinates - speeds, correlation, echo intensity, % good.Sound velocity calculated from temperature, depth and salinity of 32.Clock set at 13:35:20 on 24 June 2008; delayed start 06:00 on 25 June 2008.LOSTTelemetry ADCP 1200 kHz RDI 3052.Mode 1: 100 pings every 10 minutes (velocity standard deviation 0.003 m s -1 ).30 x 1 m bins (2.15 – 31.15 m above the bed). 1 Gb memory.Earth co-ordinates - speeds, correlation, echo intensity, % good.Sound velocity calculated from temperature, depth and salinity of 32.Clock reset at 13:46:10 on 24 June 2008; delayed start 15:50:00 on 24 June 2008.
LinkQuest acoustic modem sn008602 set for transmission of ADCP data every hour.LinkQuest tx at 16:00:00 on 24 June 2008.LOST<strong>Sea</strong>-Bird 16plus S/N 4596 (RS485) on base of frame with pumped conductivity sensorunderneath. <strong>Sea</strong>Point turbidity sensor 10533 taped to roll bar; set up for 0 - 125 FTU range.Sample interval 600 s; digiquartz integration time 40 s, range 400; pump 0.5s, 1 s delay.Sample interval 600s.Clock set at 13:22:50 on 24 June 2008; delayed start at 06:00 on 25 June 2008.The frame was fitted with a fizz link, a spooler with 50m of rope for recovery of the ballastweight and two Benthos releases s/n 67679 (Rx 11.5 kHz, Tx 12.0 kHz, release B) and s/n70356 (Rx 10.5 kHz, Tx 12.0 kHz, release D).b) Telemetry buoyRecovered and not re-deployed because one of the telemetry mounting holes had snapped offthe frame during the previous deployment.c) SmartBuoy Mooring. (Loggers set up at POL prior to cruise)<strong>Sea</strong>-Bird MicroCat temperature, conductivity recorder s/n 2010 at 5 m below the surface.Sample interval 600s. Clock settings not noted.<strong>Sea</strong>-Bird MicroCat temperature, conductivity recorder s/n 4966 at 10 m below the surface.Sample interval 600s. Logging stopped at 10:20 on 11 September 2008 (clock drift 8s).VEMCO Mini-logger s/n 0142E at 7.5 m below the surface set to record at 600s intervals.Clock settings not noted.NO VEMCO Mini-logger at 15m.The CEFAS SmartBuoy is fitted with a surface CTD (including turbidity sensor andfluorometer). The frame was fitted with bags for the determination of bacterial degradation.The single point mooring was composed mainly of ½" long link chain, marked by a 1.8 mdiameter toroid and anchored by a half tonne clump of scrap chain.Table 1. Recovered mooring positions and times.Latitude Longitude Water Recovered(N) (W) Depth (m) Time DateADCP frame (Site A) 53º 32.096´ 3º 21.562´ 21.1 10:01 10/09/08SmartBuoy (Site A) 53º 32.044´ 3º 21.796´ 23.0 12:06 10/09/08Telemetry toroid 53º 27.070´ 3º 38.635´ 23.0 15:37 10/09/08ADCP (Site B) 53º 27.118´ 3º 38.604´ 24.3 14:54 10/09/08SmartBuoy (Site B) 53º 26.889´ 3º 38.730´ 28.0 09:01 11/09/08WaveBuoy (Hilbre Channel) 53º 23.624´ 3º 14.168´ 10.0 15:18 11/09/084.2 The set up of the deployed instruments was as follows:
Site Aa) Waves ADCP 600 kHz RDI 5803Mode 1: 100 pings every 10 minutes (velocity standard deviation 0.007 m s-1).35 x 1 m bins (2.65 – 36.65 m above the bed).Beam co-ordinates - speeds, correlation, echo intensity, % good.Sound velocity calculated from temperature, depth and salinity of 32.Clock reset at 15:47:00 on 9 September 2008.Logging set to start at 17:00 on 9 September 2008.<strong>Sea</strong>-Bird 16plus S/N 5309 (RS232) on base of frame with pumped conductivity sensorunderneath. Sample interval 600s. <strong>Sea</strong>Point turbidity sensor (S/N 10471) taped to roll bar;set up for 0 - 125 FTU range. Sample interval 600 s; digiquartz integration time 40 s, range400; pump 0.5s, 1 s delay. Aanderaa optode S/N 674. Clock reset at 15:08 on 9 September2008. Logging set to start at 08:00 on 10 September 2008.SonTek ADV (Acoustic Doppler Velocimeter); ADV Logger G527; head A983.Distance from center of three prong head on ADV transmitter to deck was 1.390m (i.e. abovesea bed). Red prong aligned to ADCP beam 3. Sample rate 16Hz; burst interval 3600s;samples in each burst 19200; burst length 1200s. Time reset to 17:18:00 on 9 September2008, logging set to start at 08:00:00 on 10 September 2008.The frame was fitted with a fizz link, a spooler with 50m of rope for recovery of the ballastweight and two Benthos releases s/n 71922 (Rx 11.5 kHz, Tx 12.0 kHz, release A) and s/n72858 (Rx 14.5 kHz, Tx 12.0 kHz, release A).b) SmartBuoy Mooring.<strong>Sea</strong>-Bird MicroCat temperature, conductivity and pressure recorder s/n 5793 at 5m below thesurface. Sample interval 600s.Clock reset to 17:48:00 on 9 September 2008.<strong>Sea</strong>-Bird MicroCat temperature and conductivity recorder s/n 5792 at 10m below the surface.Sample interval 600s.Clock reset to 17:36 on 9 September 2008.Mini-logger (Star ODi) s/n 2842 at 7.5 m below the surface set to record at 600s intervals.Set to start sampling at 08:00 on 10 September 2008.Mini-logger (Star ODi) s/n 2843 at 15 m below the surface set to record at 600s intervals.Set to start sampling at 08:00 on 10 September 2008.The CEFAS SmartBuoy is fitted with one surface CTD, light sensors at 1 and 2 m below thesurface, a water sampler which obtains water samples once per day for laboratory nutrient(TOXN and silicate; no filtration therefore no phosphate), fluorometer (<strong>Sea</strong>Point), oxygen(Aanderaa Optode) and chlorophyll determination and an in situ NAS2E nutrient analyser.The CTD and light data are transmitted back to CEFAS via Orbcomm. The frame was fittedwith bags of material supplied by University of <strong>Liverpool</strong> for the determination of bacterialdegradation.The single point mooring was composed of ½" long link chain, marked by a 1.8 m diametertoroid and anchored by a half tonne clump of scrap chain.
Site Ba) Waves ADCP 600 kHz RDI 3644Mode 1: 100 pings every 10 minutes (velocity standard deviation 0.007 m s-1).35 x 1 m bins (2.65 – 36.65 m above the bed).Beam co-ordinates - speeds, correlation, echo intensity, % good.Sound velocity calculated from temperature, depth and salinity of 32.Clock reset to 16:24:00 on 9 September 2008.Set to start at 09:00:00 logging on 9 September 2008Telemetry ADCP 1200 kHz RDI 0572.Mode 1: 100 pings every 10 minutes (velocity standard deviation 0.003 m s -1 ).30 x 1 m bins (2.15 – 31.15 m above the bed). 1 Gb memory.Earth co-ordinates - speeds, correlation, echo intensity, % good.Sound velocity calculated from temperature, depth and salinity of 32.Clock reset at 16:29:00 on 9 September 2008; delayed start 17:00:00 on 9 September 2008.LinkQuest acoustic modem set for transmission of ADCP data every hour.<strong>Sea</strong>-Bird 16plus S/N 5310 on base of frame with pumped conductivity sensor underneath.Sample interval 600s. <strong>Sea</strong>Point turbidity sensor (S/N 10320) taped to roll bar; set up for 0 -500 FTU range. Sample interval 600 s; digiquartz integration time 40 s, range 400; pump0.5s, 1 s delay. Clock reset at 15:25 on 9 September 2008.The frame was fitted with a fizz link, a spooler with 50m of rope for recovery of the ballastweight and two Benthos releases s/n 70355 (Rx 10.0 kHz, Tx 12.0 kHz, release B) and s/n72382 (Rx 10.0 kHz, Tx 12.0 kHz, release A).b) Telemetry buoy with ACS and <strong>Sea</strong>Bird MicrocatThis was not deployed, because one of the telemetry mounting holes had snapped off therecovered buoy during the previous deployment.c)SmartBuoy Mooring.<strong>Sea</strong>-Bird MicroCat temperature, conductivity recorder s/n 5791 (RS 232) at 5 m below thesurface. Sample interval 600s. Clock reset to 17:59 on 9 September 2008. Logging set tostart 08:00:00 on 10 September 2008.<strong>Sea</strong>-Bird MicroCat temperature, conductivity recorder s/n 5433 (RS 232) at 10 m below thesurface. Sample interval 600s. Clock reset to 18:07 on 9 September 2008. Logging set tostart 08:00:00 on 10 September 2008.Mini-logger (Star ODi) s/n 2847 at 7.5 m below the surface set to record at 600s intervals.Set to start sampling at 08:00 on 10 September 2008.Mini-logger (Star ODi) s/n 2849 at 15 m below the surface set to record at 600s intervals.Set to start sampling at 08:00 on 10 September 2008.The CEFAS SmartBuoy is fitted with a surface CTD (including turbidity sensor andfluorometer). The frame was fitted with bags for the determination of bacterial degradation.The single point mooring was composed mainly of ½" long link chain, marked by a 1.8 m
diameter toroid and anchored by a half tonne clump of scrap chain.Table 2. Deployed mooring positions and times.Latitude Longitude Water Deployed(N) (W) Depth (m) Time DateADCP frame (Site A) 53º 32.106´ 3º 21.564´ 23.1 11:22 10/09/08SmartBuoy (Site A) 53º 32.088´ 3º 21.629´ 22.7 11:55 10/09/08ADCP frame (Site B) 53º 27.014´ 3º 38.603´ 24.6 16:27 10/09/08SmartBuoy (Site B) 53º 26.889´ 3º 38.639´ 26.8 17:23 10/09/085. CTDA <strong>Sea</strong>-Bird SBE 19-03 CTD (600m rated) was used, because of a fault with the standard <strong>Sea</strong>-Bird 911 CTD. The <strong>Sea</strong>-Bird 19 recorded internally and no external monitoring wasavailable. Only one 0.7 litre water bottle was used which was attached to the wire. Two dipswere required to obtain surface and bottom water samples. The water bottle lids were shutusing a brass messenger which was free dropped down the CTD wire. The messenger waslost after the first CTD and temporary weights had to be used.Table 3. Nominal CTD positions. (Ss – Suspended sediments, Nu – Nutrients)Site Latitude Longitude Visited Cefas POL POL Grab(N) (W) on this Chloropyll Nu Ss No.cruise & Nu & Ss1 53º 32´ 3º 21.8´ yes yes+bottom yes yes 12 53º 37´ 3º 13.4´3 53º 42´ 3º 13.4´4 53º 47´ 3º 13.4´5 53º 52´ 3º 21.8´6 53º 47´ 3º 21.8´7 53º 42´ 3º 21.8´8 53º 37´ 3º 21.8´9 53º 32´ 3º 21.8´10 53º 27´ 3º 13.4´11 53º 27´ 3º 21.8´12 53º 27´ 3º 30.2´13 53º 32´ 3º 30.2´14 53º 37´ 3º 30.2´15 53º 42´ 3º 30.2´16 53º 47´ 3º 30.2´17 53º 47´ 3º 47.0´18 53º 42´ 3º 38.6´19 53º 37´ 3º 38.6´20 53º 32´ 3º 38.6´21 53º 27´ 3º 38.6´ yes yes yes yes 222 53º 23´ 3º 38.6´23 53º 23´ 3º 47.0´24 53º 27´ 3º 47.0´
25 53º 32´ 3º 47.0´26 53º 37´ 3º 47.0´27 53º 42´ 3º 47.0´28 53º 47´ 3º 47.0´29 53º 47´ 3º 55.4´30 53º 42 3º 55.4´31 53º 37´ 3º 55.4´32 53º 32´ 3º 55.4´33 53º 27´ 3º 55.4´ yes34 53º 22´ 3º 55.4´35 53º 32´ 3º 15.9´Surface water samples were obtained for Elena Stoica at sites 1 (CTD No.2-4), 21(CTDNo.1) and 29 (CTD No.5).6. Surface samplingThe intake for the surface sampling system is located underneath RV Prince Madog, at about3 m below sea level. The parameters recorded every minute by the WS Oceans system are:Date, Transmissance, Hull Temperature (ºC), Barometric Pressure (mbar), Fluorescence,Turbidity, Salinity, Conductivity sensor water temperature (ºC). <strong>Sea</strong> surface temperature,salinity and transmittance were calibrated against the CTD by BODC. In addition a pCO2sensor is incorporated into the surface sampling system.Met package measures and records Barometric pressure (mbar), Solar Radiation (W m-2),PAR (µmols / m2s), Air Temperature (ºC), Relative Humidity, Relative Wind Speed (m s-1),Relative Wind Direction (º) – zero indicates wind on the bow, Minimum Air Temp (ºC),Maximum Air Temp (ºC), Wind Gust (m s-1). ** Wind spd/dir not working **Underway data, pCO 2 and ships ADCP data were recorded every minute. The ship was fittedwith a 300 kHz ADCP set to record 25 x 2m bins, the bin nearest the surface was at 5.1 mdepth, every 30 seconds with 29 pings / ensemble. The systems were switched on at 07:00on 10 September 2008 on passing Puffin Island. The ADCP, underway and pCO 2 systemswere switched off at 19:32 on 10 September 2008 on passing Puffin Island. The systemswere again switched on at 07:19 on 11 September 2008 on passing Puffin Island. TheADCP, underway and pCO 2 systems were finally switched off at 22:00 on 11 September2008 on passing Puffin Island.AcknowledgementsThe assistance of the master, officers, and crew is appreciated in ensuring the success of thiscruise.