Biologist at Work! - Home Page for Ross Koning
Biologist at Work! - Home Page for Ross Koning
Biologist at Work! - Home Page for Ross Koning

You also want an ePaper? Increase the reach of your titles
YUMPU automatically turns print PDFs into web optimized ePapers that Google loves.
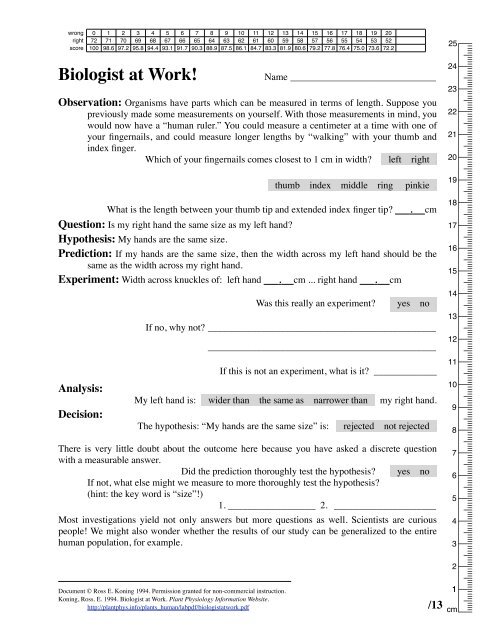
wrong 0 1 2 3 4 5 6 7 8 9 10 11 12 13 14 15 16 17 18 19 20right 72 71 70 69 68 67 66 65 64 63 62 61 60 59 58 57 56 55 54 53 52score 100 98.6 97.2 95.8 94.4 93.1 91.7 90.3 88.9 87.5 86.1 84.7 83.3 81.9 80.6 79.2 77.8 76.4 75.0 73.6 72.2<strong>Biologist</strong> <strong>at</strong> <strong>Work</strong>!Name ______________________________Observ<strong>at</strong>ion: Organisms have parts which can be measured in terms of length. Suppose youpreviously made some measurements on yourself. With those measurements in mind, youwould now have a “human ruler.” You could measure a centimeter <strong>at</strong> a time with one ofyour fingernails, and could measure longer lengths by “walking” with your thumb andindex finger.Which of your fingernails comes closest to 1 cm in width? left right .thumb index middle ring pinkie .Wh<strong>at</strong> is the length between your thumb tip and extended index finger tip? . cmQuestion: Is my right hand the same size as my left hand?Hypothesis: My hands are the same size.Prediction: If my hands are the same size, then the width across my left hand should be thesame as the width across my right hand.Experiment: Width across knuckles of: left hand . cm ... right hand . cmAnalysis:Decision:Was this really an experiment? yes no .If no, why not?______________________________________________________________________________________________If this is not an experiment, wh<strong>at</strong> is it? _____________My left hand is: wider than the same as narrower than my right hand.The hypothesis: “My hands are the same size” is: rejected not rejected .There is very little doubt about the outcome here because you have asked a discrete questionwith a measurable answer.Did the prediction thoroughly test the hypothesis? yes no .If not, wh<strong>at</strong> else might we measure to more thoroughly test the hypothesis?(hint: the key word is “size”!)1. __________________ 2. _____________________Most investig<strong>at</strong>ions yield not only answers but more questions as well. Scientists are curiouspeople! We might also wonder whether the results of our study can be generalized to the entirehuman popul<strong>at</strong>ion, <strong>for</strong> example.2524232221201918171615141312111098765432Document © <strong>Ross</strong> E. <strong>Koning</strong> 1994. Permission granted <strong>for</strong> non-commercial instruction.1<strong>Koning</strong>, <strong>Ross</strong>. E. 1994. <strong>Biologist</strong> <strong>at</strong> <strong>Work</strong>. Plant Physiology In<strong>for</strong>m<strong>at</strong>ion Website.http://plantphys.info/plants_human/labpdf/biologist<strong>at</strong>work.pdf /13 cm
<strong>Page</strong> 2Observ<strong>at</strong>ion: You now know something about your own two hands. You also notice th<strong>at</strong> noteveryone in the room is the same size overall.Question: In spite of different absolute body sizes, does everyone have hands of equal width?Hypothesis: The human popul<strong>at</strong>ion has hands of equal width. [a null hypothesis]Prediction: If the human popul<strong>at</strong>ion has hands of equal width, then a sample of the humanpopul<strong>at</strong>ion should have hands of equal width.Notice th<strong>at</strong> we cannot go out and measure the hands of the entire humanpopul<strong>at</strong>ion, so we must settle <strong>for</strong> a sample. We hope we can take a represent<strong>at</strong>ive sample(th<strong>at</strong> is a random sample). Our sample will be all the people in this labor<strong>at</strong>ory.If it is not a random sample, why isn’t it?Would this be a random sample of the popul<strong>at</strong>ion? yes no .1. _______________________________________________________________2. _______________________________________________________________We also hope th<strong>at</strong> our sample is sufficiently large. In spite of any shortcomings in oursample, we will continue our analysis since we lack a better sample.Experiment: Your instructor will help you post your hand width d<strong>at</strong>a along with yourclassm<strong>at</strong>es’ d<strong>at</strong>a on the board. Additional d<strong>at</strong>a will be recorded on a computer.By collecting lots of d<strong>at</strong>a, do we now have an experiment? yes no .If no, why not? ______________________________________________________________________________________________If this is not an experiment, wh<strong>at</strong> is it? _____________Analysis: Clearly we have various widths in each sample and must now include an assessmentof this vari<strong>at</strong>ion in preparing <strong>for</strong> our decision. Calcul<strong>at</strong>e the mean (average) width and thestandard devi<strong>at</strong>ion of the samples. The l<strong>at</strong>ter gives us some measure of the vari<strong>at</strong>ion (orspread) around the mean. Most calcul<strong>at</strong>ors will determine the mean and standarddevi<strong>at</strong>ion <strong>for</strong> you, using the <strong>for</strong>mulae shown below, but we will let a computer do thiswork <strong>for</strong> us!mean = x = (Σi=1 n xi) / nstandard devi<strong>at</strong>ion = { [Σi=1 n (xi -x) 2 ] / (n-1) } 1/2We will use Microsoft Excel to help us with these calcul<strong>at</strong>ions.After powering up the computer, select Excel from the dock <strong>at</strong> the bottom of thescreen. This should open a dialog box, which you can dismiss by clicking on the blue“Open” button. A blank spreadsheet will appear on the monitor screen. In the cell A1 type“Left” and in the cell B1 type “Right.” Enter the d<strong>at</strong>a from the board in the columnsbene<strong>at</strong>h the words (left hand d<strong>at</strong>a in A2 to A25, and right hand d<strong>at</strong>a in B2 to B25)./6
<strong>Page</strong> 3To calcul<strong>at</strong>e the means: In A26 type “=average(A2:A25)” and hit return. CopyA26 and paste it into B26. To calcul<strong>at</strong>e the standard devi<strong>at</strong>ions: In A27 type“=stdev(A2:A25)” and hit return. Copy A27 and paste it into B27. To fix the roundingproblems, select A26:B27 and then select Form<strong>at</strong>-Cells-Number- (Form<strong>at</strong> Tab on Ribbon)and set the decimal places to one more than we have precision in our measurements (inthis case millimeters, so we want two decimal places—the default). Record your valuesbelow:Left hands in sample: Right hands in sample:Mean width (cm) . .Standard Devi<strong>at</strong>ion (cm) . .Student’s t-test value of p . same different .In general, if the spread about a mean (Standard Devi<strong>at</strong>ion) is gre<strong>at</strong>er than thedifference between the two means, we worry whether wh<strong>at</strong> we are observing ismeaningful or not. But how will we know with reasonable certainty? We need to do ast<strong>at</strong>istical test of our hypothesis.Student’s T-Test:Excel can quickly carry out a t-test, which compares the means of two samplesand gives us a probability (p) value th<strong>at</strong> the result we observed could be observed againwith the null hypothesis. In A28 type: “=ttest(A2:A25,B2:B25,2,1)” hit return, and set thecell to show 3 decimal places. In general we choose to reject a null hypothesis when thisvalue is less than the arbitrary value (α) of 5% (0.05…so now you see why we chosethree decimal places).In B28 type: “=if(A28>0.05,"Same","Different")” and hit return. You can see th<strong>at</strong>Excel can even autom<strong>at</strong>e your decision making. The beauty of a spreadsheet is th<strong>at</strong> onceyou have produced it, you can change any of the raw d<strong>at</strong>a numbers and the rest of thecalcul<strong>at</strong>ions are repaired autom<strong>at</strong>ically!Some details: the ttest function in Excel compares the two d<strong>at</strong>a ranges you told itwere of interest (A2:A25 and B2:B25). We told it to per<strong>for</strong>m a two-tailed (2) test and th<strong>at</strong>our d<strong>at</strong>a were paired (1), meaning we had left and right hand d<strong>at</strong>a from the same personin each row of our d<strong>at</strong>a chart. The returned value of p was compared to an α value, whichis suitable <strong>for</strong> everyday biology projects. In some kinds of projects you might want toallow more error (more than 5%), but in others you might want to allow less error.Allowing 5% gives a reasonable balance between Type I and Type II st<strong>at</strong>istical errors <strong>for</strong>“typical” tests of null hypotheses.Decision: Based upon Student’s T-test, the hypothesis:“The human popul<strong>at</strong>ion has hands of equal width”There are two reasons <strong>for</strong> this:is is not . rejected.1.________________________________________________________________2.________________________________________________________________/9
<strong>Page</strong> 4Observ<strong>at</strong>ions: A single bag of beans was purchased from the store. Some of the beans weresoaked in w<strong>at</strong>er overnight, the rest from the same bag remain dry. Clearly the soaking hashad some effect upon length.Question: Does soaking beans cause them to expand?Hypothesis: Soaking does not cause beans to expand. [null hypothesis]Prediction: If soaking causes beans to expand, then beans will be significantly larger whenthey are soaked than beans which have been kept dry.Experiment: A sample of beans was divided into two sub-samples. One sub-sample wasplaced in w<strong>at</strong>er, the other sub-sample was kept in dry conditions. Use a metric rule and abalance to their gre<strong>at</strong>est precision to determine the length and weight of each of 10 beansfrom each sub-sample.Was this a true experiment? yes no .Soaked BeansDry Beanslengthweightlengthweightmm . g mm . gSoaked DryBeans Beansmm . g mm . gMean Length (mm) . .mm . g mm . gStandard Dev. . .mm . g mm . gt-test p = . same different .mm . g mm . gmm . g mm . gmm . g mm . gmm . g mm . gmm . g mm . gmm . g mm . gSoaked DryBeans BeansMean Weight g) . .Standard Dev. . .t-test p = . same different .Analysis: Carry out Student’s t-tests to see whether there are any significant differencesbetween the mean lengths and weights of the two sub-samples. In this case the <strong>for</strong>mula<strong>for</strong> t-test needs to end with 1,3. We get to do a one-tailed test as our subjects clearly musthave gained w<strong>at</strong>er during the tre<strong>at</strong>ment, but we do not have paired d<strong>at</strong>a this time.There<strong>for</strong>e the 3 tells Excel th<strong>at</strong> our two d<strong>at</strong>a sets come from different distributions. Basedon the t-test, are the two mean weights significantly different?Decision:Based on Student's T-test, the hypothesis:“Soaking does not cause beans to expand” is: rejected not rejected .Our hypothesis used the term “expand” and our prediction used the term “larger.” In ourexperiment we measured the weight of the beans.Wh<strong>at</strong> weight adjective would describe the soaked beans? _________________________/23
<strong>Page</strong> 5Observ<strong>at</strong>ion: Our soaked beans sure do seem larger than the dry beans, but how can wemeasure the volume of an oddly shaped living-bean?Question: Does soaking beans cause them to expand?Hypothesis: Soaking does not cause beans to expand. [null hypothesis]Prediction: If soaking does not cause beans to expand, then beans will not be significantlylarger when they are soaked than beans left dry.Experiment: Measure the volume of bean seeds by displacement of w<strong>at</strong>er in a gradu<strong>at</strong>edcylinder. Put exactly 14 mL of w<strong>at</strong>er in the gradu<strong>at</strong>ed cylinder. Now slowly add beansuntil the w<strong>at</strong>er level comes just below the 25 mL mark; do not put in more than 10 beans.Calcul<strong>at</strong>e the volume per bean by dividing the total volume of beans added by thenumber of beans added.Soaked Beans Dry BeansFinal Liquid Level . mL . mLStarting Level -14 mL -14 mLTotal Volume of Beans Added . mL . mLNumber of Beans Added beans beansVolume per Bean . mL . mLIs this really an experiment? yes no .The group of dry beans receiving no tre<strong>at</strong>ment is the ________________ group.The group of soaked beans is called the ________________ group.Analysis: Examining the volume per bean, there is a striking difference.Can we per<strong>for</strong>m a t-test on these d<strong>at</strong>a? yes no .The degrees of freedom calcul<strong>at</strong>ion (=N1+N2-2) specifies how free you are to do a t-test.How free are we do to this test? The degrees of freedom are:_________________How could we redo our measurements so th<strong>at</strong> we could use a t-test <strong>for</strong> our analysis?1. _____________________________________________________________________2. _____________________________________________________________________We will not make any further measurements, but perhaps we may s<strong>at</strong>isfy our need <strong>for</strong>significance by recalling th<strong>at</strong> scientists find 5% error acceptable.Calcul<strong>at</strong>e the r<strong>at</strong>io of volume per soaked bean to volume per dry bean ____. ____ ____The soaked beans occupy _______% of the volume of the dry beans.Is there <strong>at</strong> least a 5% difference between the beans? yes no .Decision:Based on a displacement test, the hypothesis:“Soaking does not cause beans to expand” is: rejected not rejected .By having hypotheses rejected, are we poor scientists? yes no .Why did we not have the option to “prove” any of our hypotheses?Because of _________________________________________________________<strong>Home</strong>work: redo all Excel work <strong>at</strong> home, check rounding and leading 0 <strong>for</strong> all d<strong>at</strong>a!!/21