Attachment E: Example Validation Report - RoadSafe LLC
Attachment E: Example Validation Report - RoadSafe LLC
Attachment E: Example Validation Report - RoadSafe LLC

You also want an ePaper? Increase the reach of your titles
YUMPU automatically turns print PDFs into web optimized ePapers that Google loves.
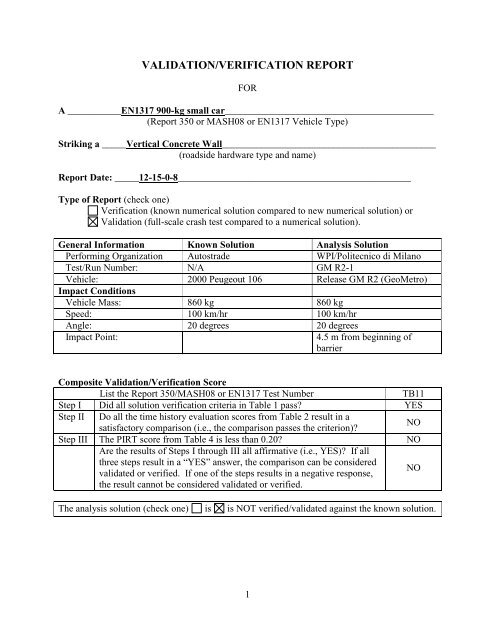
VALIDATION/VERIFICATION REPORTFORA ___________EN1317 900-kg small car___________________________________________(<strong>Report</strong> 350 or MASH08 or EN1317 Vehicle Type)Striking a _____Vertical Concrete Wall____________________________________________(roadside hardware type and name)<strong>Report</strong> Date: _____12-15-0-8________________________________________________Type of <strong>Report</strong> (check one)Verification (known numerical solution compared to new numerical solution) or<strong>Validation</strong> (full-scale crash test compared to a numerical solution).General Information Known Solution Analysis SolutionPerforming Organization Autostrade WPI/Politecnico di MilanoTest/Run Number: N/A GM R2-1Vehicle: 2000 Peugeout 106 Release GM R2 (GeoMetro)Impact ConditionsVehicle Mass: 860 kg 860 kgSpeed: 100 km/hr 100 km/hrAngle: 20 degrees 20 degreesImpact Point:4.5 m from beginning ofbarrierComposite <strong>Validation</strong>/Verification ScoreList the <strong>Report</strong> 350/MASH08 or EN1317 Test NumberTB11Step I Did all solution verification criteria in Table 1 pass? YESStep II Do all the time history evaluation scores from Table 2 result in asatisfactory comparison (i.e., the comparison passes the criterion)?NOStep III The PIRT score from Table 4 is less than 0.20? NOAre the results of Steps I through III all affirmative (i.e., YES)? If allthree steps result in a “YES” answer, the comparison can be consideredvalidated or verified. If one of the steps results in a negative response,the result cannot be considered validated or verified.NOThe analysis solution (check one) is is NOT verified/validated against the known solution.1
PART I: BASIC INFORMATIONThese forms may be used for validation or verification of roadside hardware crash tests. If theknown solution is a full-scale crash test (i.e., physical experiment) then the procedure is avalidation exercise. If the known solution is a numerical solution (e.g., a prior finite elementmodel using a different program or earlier version of the software) then the procedure is averification exercise.Provide the following basic information for the validation/verification comparison:1. What type of roadside hardware is being evaluated (check one)?Longitudinal barrier or transitionTerminal or crash cushionBreakaway support or work zone traffic control deviceTruck-mounted attenuatorOther hardware: _____________________________________2. What test guidelines were used to perform the full-scale crash test (check one)?NCHRP <strong>Report</strong> 350MASH08EN1317Other: ______________________________________________3. Indicate the test level and number being evaluated (fill in the blank). ___3-10_____4. Indicate the vehicle type appropriate for the test level and number indicated in item 3according to the testing guidelines indicated in item 2.NCHRP <strong>Report</strong> 350/MASH08700C 820C 1100C2000P2270P8000S10000S36000V36000TEN1317Car (900 kg) Car (1300 kg) Car (1500 kg)Rigid HGV (10 ton) Rigid HGV (16 ton) Rigid HGV (30 ton)Bus (13 ton)Articulated HGV (38 ton)2
PART II: ANALYSIS SOLUTION VERIFICATIONUsing the results of the analysis solution, fill in the values for Table 1. These values areindications of whether the analysis solution produced a numerically stable result and do notnecessarily mean that the result is a good comparison to the known solution.Table 1. Analysis Solution Verification Table.Verification Evaluation CriteriaTotal Energy of the analysis solution (i.e., kinetic, potential, contact,etc.) must not vary more than 10 percent from the beginning of the runto the end of the run.Hourglass Energy of the analysis solution at the end of the run is lessthan 5 percent of the total initial energy at the beginning of the run.Mass Added to the total model is less than five percent of the totalmodel mass at the beginning of the run.There are no shooting nodes in the solution?There are no solid elements with negative volumes?Change(%) Pass?6 YES0 YES0 YESYESYESIf all the analysis solution verification criteria are scored as passing, the analysis solution can beverified or validated against the known solution. If any criterion in Table 1 does not pass one ofthe verification criterion listed in Table 1, the analysis solution cannot be used to verify orvalidate the known solution.The Analysis Solution (check one) passes does NOT pass all the criteria in Table 1.3
PART III: TIME HISTORY EVALUATION TABLEA) Analysis of each single channelUsing the RSVVP computer program („Single channel‟ option), compute the Sprauge-Geer MPCmetrics and ANOVA metrics using time-history data from the known and analysis solutions for atime period starting at the beginning of the contact and ending at the loss of contact. TheSprauge-Geer metrics must be calculated based on the velocity time-history and the ANOVAmust be based on the acceleration time-history; these the defaults produced by RSVVP. If all sixdata channels are not available for both the known and analysis solutions, enter “N/A” in thecolumn corresponding to the missing data. In some cases, an analyst may deem some of the timehistories unimportant and may also record “N/A” for those time histories as well. An examplewould be a breakaway sign support test where the lateral (i.e., Y) and vertical (i.e., Z)accelerations are presumably insignificant to the dynamics of the crash event. Enter the valuesobtained from the RSVVP program in Table 2a and indicate if the comparison was acceptable ornot by entering a “yes” or “no” in the “Agree?” column.In order for the analysis solution to be considered in agreement with the known solution (i.e.,verified or validated), all the criteria scored in Table 2a must pass.The Analysis Solution (check one) passes does NOT pass all the criteria in Table 2a.Attach a graph of each channel for which the metrics have been compared in Appendix.4
Mean ResidualMPStandard Deviationof ResidualsCTable 2a. Roadside Safety <strong>Validation</strong> Metrics Rating Table – Time History Comparisons(Single channel).Evaluation Criteria (time interval [0 sec; 0.25 sec])O Sprauge-Geer MetricsThe MPC metrics comparing the full-scale test and simulation velocitytime-histories at the center of gravity. Values strictly less than 10percent are acceptable.Pass?X acceleration 8.6 9.4 12.7 NOY acceleration 1.0 2.2 2.4 YESZ acceleration 255 58.5 262 NORoll rate or redundant X acceleration N/A N/A N/A N/APitch rate or redundant Y acceleration N/A N/A N/A N/AYaw rate or redundant Z acceleration 2.9 1.4 3.2 √P ANOVA MetricsUsing the acceleration time histories of the center of gravity fromthe full-scale crash test and the simulation, all three of the followingcriteria must be met:The mean residual error must be less than five percent of thepeak acceleratione 0 . 05 a )( PeakThe standard deviation of the residuals must be less than 20percent of the peak acceleration ( 0 .20 aPeak)Pass?X acceleration/Peak 0 0.22 NOY acceleration/Peak 0 0.24 NOZ acceleration/Peak -0.04 0.45 NORoll rate or redundant X acceleration/Peak N/A N/A N/APitch rate or redundant Y acceleration/Peak N/A N/A N/AYaw rate or redundant Z acceleration/Peak -0.1 0.17 YES5
B) Analysis of multiple channelsUsing the RSVVP computer program („Multiple channel‟ option), compute the Sprauge-GeerMPC metrics and ANOVA metrics using all the time histories data from the known and analysissolutions for a time period starting at the beginning of the contact and ending at the loss ofcontact. The Sprauge-Geer metrics must be calculated based on the velocity time-history and theANOVA must be based on the acceleration time-history. If all six data channels are notavailable for both the known and analysis solutions, enter “N/A” in the column corresponding tothe missing data. In some cases, an analyst may deem some of the time histories unimportantand may also record “N/A” for those time histories as well. An example would be a breakawaysign support test where the lateral (i.e., Y) and vertical (i.e., Z) accelerations are insignificant tothe dynamics of the crash event. Enter the values obtained from the RSVVP program in Table2b and indicate if the comparison was acceptable or not by entering a “yes” or “no” in the“Agree?” column.In order for the analysis solution to be considered in agreement with the known solution (i.e.,verified or validated), all the criteria scored in Table 2b must pass.The Analysis Solution (check one) passes does NOT pass all the criteria in Table 2b.Attach a graph of each channel for which the metrics have been compared in Appendix.6
Mean ResidualMPStandard Deviationof ResidualsCTable 2b. Roadside Safety <strong>Validation</strong> Metrics Rating Table – Time History Comparisons(Multiple channels).Evaluation Criteria (time interval [0.00 sec to 0.25 sec])Channels (Select which was used)X Acceleration Y Acceleration Z AccelerationRoll rate Pitch rate Yaw rateOSprauge-Geer MetricsThe MPC metrics comparing the full-scale test and simulation velocitytime-histories at the center of gravity. Values strictly less than 10percent are acceptable.PANOVA MetricsUsing the acceleration time histories of the center of gravity fromthe full-scale crash test and the simulation, all three of the followingcriteria must be met:The mean residual error must be less than five percent of thepeak acceleratione 0 . 05 a )( PeakThe standard deviation of the residuals must be less than 20percent of the peak acceleration ( 0 .20 a )PeakThe absolute value of the t statistic should be less than thecritical t-statistic for a two-tailed t-test at the five-percentconfidence level (i.e., t 0.005,). Normally, t 0.005,< 2.65Pass?40.9 10.1 42.5 NOPass?-0.01 0.22 NO7
PART IV: PHENOMENA IMPORTANCE RANKING TABLEThe following table is similar to the evaluation tables in <strong>Report</strong> 350 and MASH08. For the testnumber identified in Part I, circle all the evaluation criteria applicable to that test in Table 3.Some of the <strong>Report</strong> 350 evaluation criteria have been removed (i.e., J and K) since they are notgenerally useful in assessing the comparison between the known and analysis solutions.Table 3. Evaluation Criteria Test Applicability Table.EvaluationApplicable TestsEvaluation CriteriaFactorsStru Test article should contain and redirect the vehicle; the vehicle10, 11, 12, 20, 21, 22, 35, 36,ctur A should not penetrate, under-ride, or override the installation although37, 38al controlled lateral deflection of the test article is acceptable.AdeThe test article should readily activate in a predictable manner byqua B 60, 61, 70, 71, 80, 81breaking away, fracturing or yielding.cyAcceptable test article performance may be by redirection, controlled 30, 31,, 32, 33, 34, 39, 40, 41,Cpenetration or controlled stopping of the vehicle.42, 43, 44, 50, 51, 52, 53Occupant Detached elements, fragments or other debris from the test articleRiskshould not penetrate or show potential for penetrating the occupantDAllcompartment, or present an undue hazard to other traffic, pedestriansor personnel in a work zone.Detached elements, fragments or other debris from the test article, orE vehicular damage should not block the driver‟s vision or otherwise 70, 71cause the driver to lose control of the vehicle. (Answer Yes or No)VehicleTrajectoryFGHILMThe vehicle should remain upright during and after the collisionalthough moderate roll, pitching and yawing are acceptable.It is preferable, although not essential, that the vehicle remainupright during and after collision.Occupant impact velocities should satisfy the following:Occupant Impact Velocity Limits (ft/s)Component Preferred MaximumLongitudinal andLateral30 40All except those listed incriterion G12, 22 (for test level 1 – 30,31, 32, 33, 34, 35, 36, 37, 38,39, 40, 41, 42, 43, 44)10, 20, 30,31, 32, 33, 34, 36,40, 41, 42, 43, 50, 51, 52, 53,80, 81Longitudinal 10 15 60, 61, 70, 71Occupant ridedown accelerations should satisfy the following:Occupant Ridedown Acceleration Limits (g‟s)10, 20, 30,31, 32, 33, 34, 36,Component Preferred Maximum40, 41, 42, 43, 50, 51, 52, 53,Longitudinal and60, 61, 70, 71, 80, 8115 20LateralThe occupant impact velocity in the longitudinal direction should notexceed 40 ft/sec and the occupant ride-down acceleration in the 11,21, 35, 37, 38, 39longitudinal direction should not exceed 20 G‟s.The exit angle from the test article preferable should be less than 60percent of test impact angle, measured at the time of vehicle loss ofcontact with test device.N Vehicle trajectory behind the test article is acceptable.10, 11, 12, 20, 21, 22, 35, 36,37, 38, 3930, 31, 32, 33, 34, 39, 42, 43,44, 60, 61, 70, 71, 80, 818
Complete Table 4 according to the results of the known solution (e.g., crash test) and the analysissolution (e.g., simulation). If the result of the analysis solution agrees with the known solution,mark the “agree” column “yes.” For example, if the vehicle in both the known and analysissolutions rolls over and, therefore, fails criterion F, the known and the analysis columns forcriterion F would be evaluated as “no.” Even though both failed the criteria, they agree witheach other so the “agree” column is evaluated as “yes.” Any criterion that is not applicable to thetest being evaluated should be indicated by entering “NA” in the “agree?” column for that row.Many of the <strong>Report</strong> 350 evaluation criteria have been subdivided into more specificphenomenon. For example, criterion A is divided into 8 sub-criteria, A1 through A8, thatprovide more specific phenomena for evaluation. Some of the values are simple yes or noquestions while other request numerical values. For the numerical phenomena, the analystshould enter the value for the known and analysis result and then calculate the relativedifference. Relative difference is always the absolute value of the difference of the known andanalysis solutions divided by the known solution. Enter the value in the “relative difference”column. If the relative difference is less than 20 percent, enter “yes” in the “agree?” column.Otherwise enter “no.”If a numerical model was not created to represent the phenomenon, a value of “NM” (i.e., notmodeled) should be entered in the appropriate column of Table 4. If the known solution for thatphenomenon number is “no” then a “NM” value in the “test result” column can be considered toagree. For example, if the material model for the rail element did not include the possibility offailure, “NM” should be entered for phenomenon number T in Table 4. If the known solutiondoes not indicate rail rupture or failure (i.e., phenomenon T = “no”), then the known and analysissolutions agree and a “yes” can be entered in the “agree?” column. On the other hand, if theknown solution shows that a rail rupture did occur resulting in a phenomenon T entry of “yes”for the known solution, the known and analysis solutions do not agree and “no” should beentered in the “agree?” column. Analysts should seriously consider refining their model toincorporate any phenomena that appear in the known solution.Calculate the PIRT sub-score from Table 2 by counting all the “yes” values in the “agree”column and all the “no” values in the agree column. Do not include “NA” values in thesummation. The score is the number of “no” values divided by the sum of the “no” and “yes”values.Enter the PIRT subscore on page 1.9
Occupant RiskFGHDETable 4. Roadside Safety Phenomena Importance Ranking Table (continued).F1F2F3F4G1G2G3Evaluation CriteriaDetached elements, fragments or other debris from the testarticle should not penetrate or show potential for penetratingthe occupant compartment, or present an undue hazard toother traffic, pedestrians or personnel in a work zone.(Answer Yes or No)Detached elements, fragments or other debris from the testarticle, or vehicular damage should not block the driver‟svision or otherwise cause the driver to lose control of thevehicle. (Answer Yes or No)The vehicle should remain upright during and after thecollision although moderate roll, pitching and yawing areacceptable. (Answer Yes or No)The relative difference between the maximum roll of thevehicle is less than 20 percent.The relative difference between the maximum pitch of thevehicle is less than 20 percent.The relative difference between the maximum yaw of thevehicle is less than 20 percent.It is preferable, although not essential, that the vehicleremain upright during and after collision. (Answer Yes orNo)The relative difference in the maximum vehicle roll angle isless than 20 percent.The relative difference between the maximum rotationbetween the tractor and trailer is less than 20 percent (Tests5-12, 6-12, 5-22 and 6-22 onlyThe vehicle ballast or load significantly shifted during theG4collision (Tests 12 and 22 only)G5 The frontal axle connection failed (Tests 12 and 22 only).The relative difference in the Occupant impact velocity isless than 20 percent:H1Longitudinal OIVLateral OIVH2 Longitudinal OIVThe relative difference in the Occupant ridedownaccelerations is less than 20 percent:ILongitudinal ORALateral ORAKnownResultAnalysisResultRelativeDiff. (%)Agree?Yes Yes YESYes Yes YES2.2° 2.5° 13 YES17.4 ft/s 18 ft/s 3.4 YES22.6 ft/s 23 ft/s 1.8 YES3.6 g‟s 8.8 g‟s 140 NO12.7 g‟s 16.6 g‟s 31 NO11
Vehicle TrajectoryTable 4. Roadside Safety Phenomena Importance Ranking Table (continued).MLM1M2M3M4NEvaluation CriteriaThe occupant impact velocity in the longitudinal directionshould not exceed 40 ft/sec and the occupant ridedownacceleration in the longitudinal direction should not exceed20 G‟s.The exit angle from the test article preferable should be lessthan 60 percent of test impact angle, measured at the time ofvehicle loss of contact with test device.The relative difference in the exit angle at loss of contact isless than 20 percent.The relative difference in the exit velocity at loss of contactis less than 20 percent.One or more vehicle tires failed or de-beaded during thecollision event (Answer Yes or No).Vehicle trajectory went behind the test article (Answer Yesor No)KnownResultAnalysisResultRelativeDiff. (%)Agree?Yes Yes YESNR 2.5° NONR 81 km/h NOYes Yes YESNR = Not reported in the test report.12
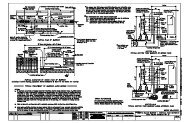
APPENDIX: Plot of the time histories used to evaluate the comparison metricsA) Accelerations and angular ratesChannel XChannel Y13
Channel ZYaw Rate14
B) Velocities and anglesChannel XChannel Y15
Channel ZYaw Angle16