3D Printing of Protein Models - University of Wisconsin-Madison
3D Printing of Protein Models - University of Wisconsin-Madison
3D Printing of Protein Models - University of Wisconsin-Madison

Create successful ePaper yourself
Turn your PDF publications into a flip-book with our unique Google optimized e-Paper software.
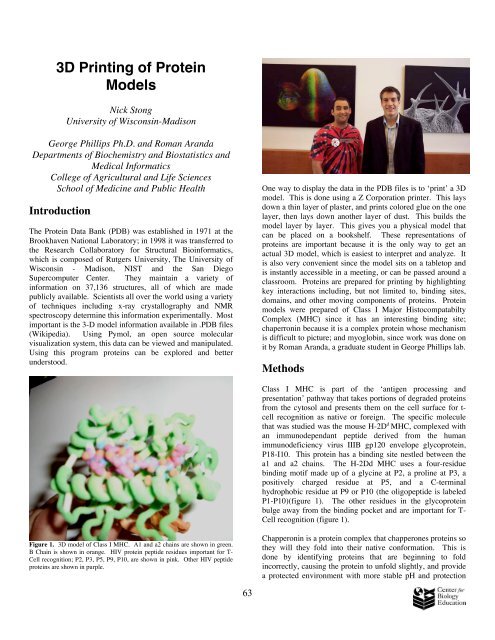
<strong>3D</strong> <strong>Printing</strong> <strong>of</strong> <strong>Protein</strong><strong>Models</strong>Nick Stong<strong>University</strong> <strong>of</strong> <strong>Wisconsin</strong>-<strong>Madison</strong>George Phillips Ph.D. and Roman ArandaDepartments <strong>of</strong> Biochemistry and Biostatistics andMedical InformaticsCollege <strong>of</strong> Agricultural and Life SciencesSchool <strong>of</strong> Medicine and Public HealthIntroductionThe <strong>Protein</strong> Data Bank (PDB) was established in 1971 at theBrookhaven National Laboratory; in 1998 it was transferred tothe Research Collaboratory for Structural Bioinformatics,which is composed <strong>of</strong> Rutgers <strong>University</strong>, The <strong>University</strong> <strong>of</strong><strong>Wisconsin</strong> - <strong>Madison</strong>, NIST and the San DiegoSupercomputer Center. They maintain a variety <strong>of</strong>information on 37,136 structures, all <strong>of</strong> which are madepublicly available. Scientists all over the world using a variety<strong>of</strong> techniques including x-ray crystallography and NMRspectroscopy determine this information experimentally. Mostimportant is the 3-D model information available in .PDB files(Wikipedia). Using Pymol, an open source molecularvisualization system, this data can be viewed and manipulated.Using this program proteins can be explored and betterunderstood.One way to display the data in the PDB files is to ‘print’ a <strong>3D</strong>model. This is done using a Z Corporation printer. This laysdown a thin layer <strong>of</strong> plaster, and prints colored glue on the onelayer, then lays down another layer <strong>of</strong> dust. This builds themodel layer by layer. This gives you a physical model thatcan be placed on a bookshelf. These representations <strong>of</strong>proteins are important because it is the only way to get anactual <strong>3D</strong> model, which is easiest to interpret and analyze. Itis also very convenient since the model sits on a tabletop andis instantly accessible in a meeting, or can be passed around aclassroom. <strong>Protein</strong>s are prepared for printing by highlightingkey interactions including, but not limited to, binding sites,domains, and other moving components <strong>of</strong> proteins. <strong>Protein</strong>models were prepared <strong>of</strong> Class I Major HistocompatabiltyComplex (MHC) since it has an interesting binding site;chaperronin because it is a complex protein whose mechanismis difficult to picture; and myoglobin, since work was done onit by Roman Aranda, a graduate student in George Phillips lab.MethodsClass I MHC is part <strong>of</strong> the ‘antigen processing andpresentation’ pathway that takes portions <strong>of</strong> degraded proteinsfrom the cytosol and presents them on the cell surface for t-cell recognition as native or foreign. The specific moleculethat was studied was the mouse H-2D d MHC, complexed withan immunodependant peptide derived from the humanimmunodeficiency virus IIIB gp120 envelope glycoprotein,P18-I10. This protein has a binding site nestled between thea1 and a2 chains. The H-2Dd MHC uses a four-residuebinding motif made up <strong>of</strong> a glycine at P2, a proline at P3, apositively charged residue at P5, and a C-terminalhydrophobic residue at P9 or P10 (the oligopeptide is labeledP1-P10)(figure 1). The other residues in the glycoproteinbulge away from the binding pocket and are important for T-Cell recognition (figure 1).Figure 1. <strong>3D</strong> model <strong>of</strong> Class I MHC. A1 and a2 chains are shown in green.B Chain is shown in orange. HIV protein peptide residues important for T-Cell recognition; P2, P3, P5, P9, P10, are shown in pink. Other HIV peptideproteins are shown in purple.Chapperonin is a protein complex that chapperones proteins sothey will they fold into their native conformation. This isdone by identifying proteins that are beginning to foldincorrectly, causing the protein to unfold slightly, and providea protected environment with more stable pH and protection63
from negative interactions with other molecules. In E. colitype I chapperonin complex consists <strong>of</strong> a GroEL cap and aGroEs cis and trans subunit. When a incorrectly foldedprotein and 4 ATP molecules enter the complex the ATP bindsto the GroES cis subunit, causing a conformational changethat binds the GroEL cap, creating a protected environment forthe protein to fold in. The model prepared shows the GroELcap and the the GroES cis subunit complexed with it. 4 boundmolecules <strong>of</strong> ADP and magnesium molecules important in thebinding <strong>of</strong> ADP are also shown (figure 2)monoxide ‘molecule’ within the center <strong>of</strong> the model(figure 3).This model CO trapped by physical spheres, however in theprotein the CO is trapped by molecular forces. This is the firstmodel that is able to represent the movement within theprotein.Figure 3. <strong>3D</strong> model <strong>of</strong> myoglobin. Heme group is shown in dark blue.Carbon monoxide molecule is trapped above heme group and ‘rattles’,showing movement.Figure 2. <strong>3D</strong> model <strong>of</strong> type I chapperonin. GroEL cap is shown in yellow.GroES subunit is shown in green in cis conformation. ADP bound to induceconformation change is shown in redMyoglobin is a heme protein that reversibly binds smallgaseous ligands such as carbon monoxide (CO).; for thisreason myoglobin is found primarily in muscle and isimportant in gas exchange. Myoglobin was one <strong>of</strong> the firstprotein structures found and has been extensively studied. Anew technique being applied to myoglobin is time resolved X-ray crystallography, which provides a series <strong>of</strong> time lapsedimages <strong>of</strong> the protein at very brief intervals. By disrupting thephotoliable ligand-heme bond the dissociation <strong>of</strong> CO wasmonitored over 100 ps to 3.16 ms. This provided 8 timelapsed structures <strong>of</strong> hemoglobin, with the heme, CO and keyresidues shifted slightly in each structure. Roman Aranda didthis work in the Phillips lab. Color coding and overlapping <strong>of</strong>these structures allows for the change over time <strong>of</strong> the proteinto be seen in a physical representation (figure 2.). Ahemoglobin model was also made that traps a loose carbonFigure 4. Time Lapsed <strong>3D</strong> <strong>of</strong> myoglobin. Time lapse structures are shownfrom red purple. Movement shown is due to the forces exerted by the COmolecule exiting from being bound to the hemeResultsThe Class I MHC (Fig. 1) is colored to show the separatechains <strong>of</strong> the protein. The A chain is shown in green and theB chain is show in orange. Detail is only shown in the bindingsite which is the area <strong>of</strong> interest in the protein. The protein isbound to an HIV glycoprotein. The glycoprotein residues arecolored individually in purple or pink. The proteins that are64
important for binding and a part <strong>of</strong> the class I MHC bindingmotif are shown in purple. The other residues are shown inpink. Most <strong>of</strong> these residues are pushed away from the proteinand are important for T-cell recognition.The chapperonin model (Fig. 2) is <strong>of</strong> a much larger protein. Itis easy to see how many individual residues are a part <strong>of</strong> themodel. The model shows how the chapperonin functions,providing a large open space with controlled pH, ionconcentration, and charge that allows proteins to fold properly.The first myoglobin model (Fig. 3) is meant to showmovement within the protein. Almost all representations <strong>of</strong>proteins are static, when in fact they are dynamic molecules.This model shows the movement <strong>of</strong> the separated carbonmonoxide within the heme pocket.The second myoglobin model (Fig. 4) is also meant to showmovement <strong>of</strong> the carbon monoxide molecule as it isdissociates from the myoglobin. This is done by overlappingmodels at different time points. The models are coloredsequentially so one can follow the changes over time.DiscussionThis work has given me the ability to be able to access andintelligently interpret the data found in the protein data bank.This skill has applications in any study at the molecular levelin which further understanding <strong>of</strong> the interaction betweenproteins would be helpful. As <strong>3D</strong> printing technologybecomes less complicated, and more automated, labs in nearlyall fields will be able to have physical representations <strong>of</strong>studied structures. This will bring us one step further to fullyunderstanding the molecular world.AcknowledgementsThis research was supported by:• <strong>University</strong> <strong>of</strong> <strong>Wisconsin</strong>-<strong>Madison</strong> Graduate School• National Science Foundation (144 PE44)References1. Li, H., et al. "Three-Dimensional Structure <strong>of</strong> H-2DdComplexed with an Immunodominant Peptide from HumanImmunodeficiency Virus Envelope Glycoprotein 120."Journal <strong>of</strong> Molecular Biology 283.1 (1998): 179-91.2. Roman Aranda IV, et al. "Time-Dependent AtomicCoordinates for the Dissociation <strong>of</strong> Carbon Monoxide fromMyoglobin." International Union <strong>of</strong> Crystallography D.62(2006): 776-83.65