Goldrush Resources Ltd. (TSXV: GOD) â Initiating Coverage; Gold ...
Goldrush Resources Ltd. (TSXV: GOD) â Initiating Coverage; Gold ...
Goldrush Resources Ltd. (TSXV: GOD) â Initiating Coverage; Gold ...

Create successful ePaper yourself
Turn your PDF publications into a flip-book with our unique Google optimized e-Paper software.
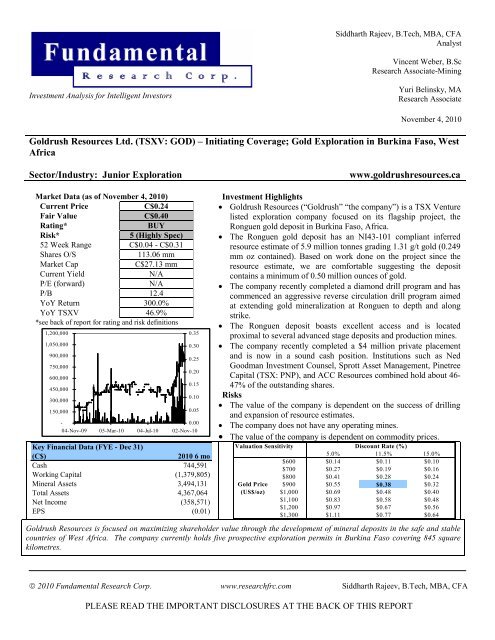
<strong><strong>Gold</strong>rush</strong> <strong>Resources</strong> <strong>Ltd</strong> (<strong>TSXV</strong>: <strong>GOD</strong>) – <strong>Initiating</strong> <strong>Coverage</strong> Page 6Figure 4: Artisanal mine workings at the Ronguen Deposit. (Source: Company)Geology and Mineralization: The Birimian greenstone Belts of western Africa arewidely regarded as the most prominent component for significant gold mineralization inthe region. These Paleo-Proterozoic basement rocks consist of volcanic and sedimentaryunits which have been intruded and surrounded by related plutonic rocks. The vastmajority of the gold deposits currently being exploited and explored are related tostructural zones of deformation and shearing within the Birimian greenstone rocks.The Birimian greenstone rocks of Burkina Faso are shown as dark green in Figure 1above.The Ronguen deposit is hosted by the Boromo greenstone belt in north-central BurkinaFaso. The Boromo belt is typical of Birimian sequences being characterized by maficvolcanic rocks, minor felsic rocks, and extensive sedimentary units. A five kilometer long,southeast to east trending panel of deformed sedimentary rocks dipping moderatelyto the south provides the primary structure hosting the Ronguen deposit. The goldmineralization is associated with quartz veining and quartz stockwork primarily inmetasedimentary rocks near the sheared contact with diorite rocks (Mineral ResourceEstimation Ronguen <strong>Gold</strong> Project, Burkina Faso; Nimoh, F. G. Wahl, J.F. Couture; 2008).© 2010 Fundamental Research Corp. www.researchfrc.com Siddharth Rajeev, B.Tech, MBA, CFAPLEASE READ THE IMPORTANT DISCLOSURES AT THE BACK OF THIS REPORT
<strong><strong>Gold</strong>rush</strong> <strong>Resources</strong> <strong>Ltd</strong> (<strong>TSXV</strong>: <strong>GOD</strong>) – <strong>Initiating</strong> <strong>Coverage</strong> Page 9• Current measured and indicated resources of 13.3 million tonnes grading 2.48 g/t gold(1.066 mm oz) and inferred resources of 8.3 million tonnes grading 1.81 g/t gold(0.483 mm oz).Kalsaka Mine• Controlled by Cluff <strong>Gold</strong> plc (“Cluff” TSX: CFG); 40 kilometres west of Ronguen• The mine has measured and indicated resources of 12.1 million tonnes at 1.6 g/t gold(0.64 mm oz) and inferred resources of 3.3 million tonnes grading 1.5 g/t gold (0.16mm oz).• The mine also has mineral reserves of 0.33 mm oz at a gold price of just US$525 perounce, demonstrating the potential of Ronguen, particularly at today’s elevated goldprice.Karma Project• Controlled by Riverstone <strong>Resources</strong> <strong>Ltd</strong>. (“Riverstone” <strong>TSXV</strong>: RVS); 80 kilometresnorth-west of Ronguen• Current indicated resource of 21.4 million tonnes grading 1.20 g/t gold (0.820 mm oz)and inferred resource of 12.2 million tonnes grading 0.82 g/t gold (0.322 mm oz).Sega Deposit• Controlled by Orezone <strong>Resources</strong> <strong>Ltd</strong>. (“Orezone” TSX: ORE); 50 km north-west ofRonguen• Current indicated resource of 8.3 million tonnes grading 1.69 g/t gold (0.450 mm oz)and inferred resource of 2.9 million tonnes grading 1.58 g/t gold (0.147 mm oz).We believe that from a geological perspective, the Ronguen deposit has excellentupside potential. The deposit remains both at depth and along the five kilometer longstructural trend. Unexplored targets also remain throughout the property area.Exploration by <strong><strong>Gold</strong>rush</strong>: To date, the company has completed 397 rotary air blast,reverse circulation (“RC”) and core drill holes totaling over 25,000 metres. Over 2,000metres in 23 trenches has been completed over a 1.5 km section of the 5 km longcontrolling structure.The 2010 Phase I drill program contributed 1,992 metres of core drilling which aspreviously noted, has demonstrated mineralization from near surface to a depth ofapproximately 160 metres. First assays from the Phase II RC drill program included anintersection of 7.63 g/t gold over 15 metres and 3.17 g/t gold over 22 metres in holeKGRR010-096. A step-out hole was drilled 22.5 metres north of hole KGRR010-096 -assay results are currently pending. Also, four of the six initial South Zone holesencountered shallow gold mineralization at depths of 6 - 37 meters vertical from surface.Resource Estimate: A resource estimate, presented in the table on the next page, wascompleted for the Ronguen deposit in March 2008 by SRK Consulting (Canada) Inc.© 2010 Fundamental Research Corp. www.researchfrc.com Siddharth Rajeev, B.Tech, MBA, CFAPLEASE READ THE IMPORTANT DISCLOSURES AT THE BACK OF THIS REPORT
<strong><strong>Gold</strong>rush</strong> <strong>Resources</strong> <strong>Ltd</strong> (<strong>TSXV</strong>: <strong>GOD</strong>) – <strong>Initiating</strong> <strong>Coverage</strong> Page 10Table 1: Ronguen Deposit NI43-101 <strong>Resources</strong> - March, 2008*The reported cut-off grade of 0.5 g/t gold is based on a metal price assumption of US$685 perounce. (Source: Company)At the time the resource estimate was completed, exploration had identified goldmineralization only to a depth of 80 meters. Logic would suggest that increasing thevertical extent of mineralization from 80 to 160 metres with similar widths and gradesshould dramatically increase the total number of contained ounces. We are comfortablesuggesting that the deposit contains a minimum of 0.5 million ounces of gold.Current Status: Phase II of the 2010 drilling and trenching program was recentlycompleted. The program included 37 reverse circulation drill holes totaling 3,396 metresand 3 trenches totaling 360 metres. The Phase II program was designed to:• Continue to test the Ronguen Main Zone at depth.• Test for extension of the Ronguen Main Zone along strike to the west.• Complete in-fill drilling in various inadequately defined areas of the RonguenMain Zone.• Drill test the Ronguen South Zone to depth of 40 vertical metres.Other PropertiesDevelopment Timeline: The company will begin a 4,000 metre RAB drill program onoutlying targets on the Kongoussi and Tikare permits in November, 2010, to be followedby further RC drilling in Q1-2011. The Ronguen deposit still requires a lot of work. Weanticipate the company may pursue an upgraded resource estimate for the Ronguen MainZone once drilling has tested the full length to a depth of 160 metres.Salbo – Summary: The Salbo exploration permit covers 146.2 square kilometresapproximately 35 kilometres south of the Kindo Group. The permit is contiguous with,and to the south of, the permits hosting High River’s Bissa deposit. Rock and soil samplingalong with geological mapping conducted in 2008, identified three NE-SW mineralizedtrends. The main trend (Trend 1 in Figure 8a) extends for approximately 2 kilometres andincludes an artisanal mining site. Highlight assay results are shown in Figure 8a.Taparko Group - SummaryThe Ouavousse (244.36 sq km) and Bougou I (72.44 sq km) exploration permits composethe company’s Taparko group; the permits are respectively, 120 km and 200 km northeastof Ouagadougou. The Bougou I permits share a boundary with High River’s Taparko-Bouroum mine which declared commercial production in 2007. The Taparko-Bourammine has proven and probable reserves of 7.97 million tonnes at a grade of 2.81 g/t gold(0.72 mm oz contained).© 2010 Fundamental Research Corp. www.researchfrc.com Siddharth Rajeev, B.Tech, MBA, CFAPLEASE READ THE IMPORTANT DISCLOSURES AT THE BACK OF THIS REPORT
<strong><strong>Gold</strong>rush</strong> <strong>Resources</strong> <strong>Ltd</strong> (<strong>TSXV</strong>: <strong>GOD</strong>) – <strong>Initiating</strong> <strong>Coverage</strong> Page 11Rock sampling and resampling of a past operator’s trench has confirmed goldmineralization at various sites throughout the Ouavousse permit. The Ouavousse permithas recently seen the arrival of over 500 artisanal miners. The company plans to begin anexploration program on this permit in the near future.Figure 8: a) Highlights of 2008 rock sampling on the Salbo permit. B) The TaparkoGroup claims (Ouavousse and Bougou I)and High River’s Taparko-Bouram gold deposit.(Source: Company)ManagementTeam and Boardof DirectorsManagement and directors currently hold about 6 - 7% of the outstanding shares. Briefbiographies of the management team and directors, as provided by the company, follow:Len Brownlie, Ph.D – President, Chief Executive Officer and DirectorDr. Brownlie graduated from Simon Fraser University in 1993 with a Doctoral degree inKinesiology. Dr. Brownlie is the President of Brownlie Management <strong>Ltd</strong>. (a privateconsulting company). Dr. Brownlie has over 27 years of experience in administrative andexecutive positions with Vancouver-based mining exploration companies.Driff Cameron, P. Geo., DirectorMr. Cameron is a member of the Association of Professional Geoscientists of Ontario, afellow of the Geological Association of Ontario and a member of the Society of EconomicGeologists. Mr. Cameron has over 30 years of international experience in miningexploration with ASARKO Company of Canada <strong>Ltd</strong>., <strong>Gold</strong> Fields Canadian MiningLimited and High River <strong>Gold</strong>. Driffield Cameron has played a leadership role in the teams© 2010 Fundamental Research Corp. www.researchfrc.com Siddharth Rajeev, B.Tech, MBA, CFAPLEASE READ THE IMPORTANT DISCLOSURES AT THE BACK OF THIS REPORT
<strong><strong>Gold</strong>rush</strong> <strong>Resources</strong> <strong>Ltd</strong> (<strong>TSXV</strong>: <strong>GOD</strong>) – <strong>Initiating</strong> <strong>Coverage</strong> Page 13Management RatingTechnical Experience3.5Experience in putting mines to production/generatingprospects4.0Track record in raising capital/working for public companies3.2Experience in projects similar to the current project4.0Team's focus on the company4.5Net Rating3.80% 20% 40% 60% 80% 100%Strength ofBoardWe believe that the Board of Directors of a company should include independent orunrelated directors who are free of any relationships or business that could materiallyinterfere with the director’s ability to act in the best interest of the company. We looked atthe company’s annual “Management Information Circular” to ensure that the company hasan independent Board of Directors, Audit Committee and Compensation Committee.Three of five directors are independentNone of the directors have filed for personalbankruptcyFour of the directors hold shares in thecompanyThe Audit committee is composed of threeboard members, two of which areindependentThe Compensation committee is composedof three board members, two of which areindependentPoor Good ExcellentXXXXFinancialsAt the end of Q2 2010 (quarter ended June 2010), the company had $0.74 million in cash.Working capital deficit was $1.38 million. Working capital deficit was primarily due to anon-interest bearing convertible debenture (face value of $1.99 million) expiring in March2011. The company posted a net loss of $0.36 million (EPS: -$0.01) in the first six monthsof FY2010 (ended June 30 2010). We estimate the company had a burn rate (cash spent onoperating and financing activities) of $0.05 million per month during the first six monthsof FY2010, versus $0.02 million per month in FY2009 (12 month period). The table belowshows a summary of the company’s cash and liquidity position.© 2010 Fundamental Research Corp. www.researchfrc.com Siddharth Rajeev, B.Tech, MBA, CFAPLEASE READ THE IMPORTANT DISCLOSURES AT THE BACK OF THIS REPORT
<strong><strong>Gold</strong>rush</strong> <strong>Resources</strong> <strong>Ltd</strong> (<strong>TSXV</strong>: <strong>GOD</strong>) – <strong>Initiating</strong> <strong>Coverage</strong> Page 14(in C$) 2009 2010 6 moWorking Capital (163,082) (1,379,805)Current Ratio 0.38 0.37Monthly Burn Rate (incl. exploration) (21,366) (47,584)Cash from Financing Activities - 947,650LT Debt / Assets 53% -The outstanding convertible debenture is convertible at the company’s option at any timeup to maturity, subject to a mandatory conversion if the company’s shares trade at $1 ormore for 20 consecutive trading days, into common shares of the company at a price of$1.00 per share. Our discussions with management indicated that the company intendsto convert the debenture into common shares in 2011.Subsequent Financings: In October 2010, the company closed a private placement of 40million shares at a price of $0.10 per share for $4 million.The company is now in a sound cash position and is adequately funded to continue asignificant drill program at Ronguen.ValuationStock options and warrants: The company has 12.69 million warrants and 3.62 millionstock options outstanding. The weighted average exercise price for the options andwarrants is about $0.19 per share. All the warrants and 2.41 million options are currently'in-the-money'. The company can raise up to $2.69 million if all these 'in-the-money'options and warrants are exercised.As mentioned earlier, we believe the Ronguen deposit contains at least 0.50 million ouncesof gold. Although the company's near-term goal is to keep expanding its resource to atleast 0.75 - 1 mm oz before they make a production decision, for valuation purposes, weassumed the project will be taken into production based on our current internal resourceestimate of 0.50 million ounces. Our Discounted Cash Flow (DCF) model gave a fair valueof $0.40 per share.DCF Valuation SummaryResource (in tonnes) 11,871,556Wt. Avg. Grade (g/t) 1.31Recovery (%) 85%Recovered Metal (in troy oz) 425,000Production Commencement mid 2013Mill Processing (tpy) 1,750,000Mine Life (in years) 6.8LT Au Price (US$/oz) - 2014+ $900Average Operating Costs ($/tonne) $15.25Capital Costs (in $) $45,000,000Discount Rate 11.49%Fair Value (assuming 100% interest) $43,754,761Working Capital $3,500,000No. of Shares (diluted) 118,898,102Value per Share $0.40© 2010 Fundamental Research Corp. www.researchfrc.com Siddharth Rajeev, B.Tech, MBA, CFAPLEASE READ THE IMPORTANT DISCLOSURES AT THE BACK OF THIS REPORT
<strong><strong>Gold</strong>rush</strong> <strong>Resources</strong> <strong>Ltd</strong> (<strong>TSXV</strong>: <strong>GOD</strong>) – <strong>Initiating</strong> <strong>Coverage</strong> Page 15The following assumptions were used for our model:• We have assumed the project will be an open-pit heap leach operation.• Although it is likely that High River will have a processing facility 6 km away (for theBissa Deposit; a feasibility study completed on the project earlier this year expects theprocessing plant will comprise crushing, a ball mill, and carbon-in-leach goldextraction), for conservatism, we have not assumed any potential benefits for<strong><strong>Gold</strong>rush</strong>, from these facilities, in our models at this time. Note that High River owns7% of <strong><strong>Gold</strong>rush</strong>'s outstanding shares.• As the project is in a mining friendly jurisdiction, we have used a discount rate of11.5%.• The recovery rate, operating cost and capital cost estimates used in the model werebased on the preliminary information available on the project and comparable deposits.• We have assumed a 100% interest for <strong><strong>Gold</strong>rush</strong> even though High River holds a 50%one time back-in right. This is because our analysis indicated little difference betweenthe value of a 50% interest in the project and High River's costs of exercising theoption (which is 150% of <strong><strong>Gold</strong>rush</strong>’s cumulative expenditures on the two permitscontaining the deposit; the acquisition costs will include a 15% administration fee thatis added to the company’s direct costs)• We have assumed the outstanding convertible debentures will be converted into shares.Our real options model gave a fair value estimate of $0.45 per share.Real Options Valuation ModelInputs relating to the underlying assetEstd.Value of Minerals if extracted today $80,589,626Annualized Standard Deviation of Mineral prices 19%PV of Capital Investment $36,834,865Time to Maturity 5Riskfree Rate 3.35%OutputStock Price $80,589,626 T.Bond rate 3.35%Strike Price $36,834,865 Variance 0.04Expiration (in years) 5.0 Annualized div yield 0.0%d1 = 2.449 Fair Value (assuming 100% interest) $49,527,431N(d1) = 0.993 Working Capital $3,500,000d2 = 2.025 No of outstanding shares (diluted) 118,898,102N(d2) = 0.979 Value per share $0.45Our comparables valuation model estimated a fair value of $0.30 per share based on a peeraverage EV/resource ratio of $64/oz.© 2010 Fundamental Research Corp. www.researchfrc.com Siddharth Rajeev, B.Tech, MBA, CFAPLEASE READ THE IMPORTANT DISCLOSURES AT THE BACK OF THIS REPORT
<strong><strong>Gold</strong>rush</strong> <strong>Resources</strong> <strong>Ltd</strong> (<strong>TSXV</strong>: <strong>GOD</strong>) – <strong>Initiating</strong> <strong>Coverage</strong> Page 16CompanySYMEV /<strong>Resources</strong>1 <strong>Gold</strong>en Band <strong>Resources</strong> Inc. <strong>TSXV</strong>: GBN $118.92 Sona <strong>Resources</strong> Corporation <strong>TSXV</strong>: SYS $115.63 Silverado <strong>Gold</strong> Mines <strong>Ltd</strong>. OTCBB: SLGLF $62.14 Sutter <strong>Gold</strong> Mining Inc. <strong>TSXV</strong>: SGM $53.05 <strong><strong>Gold</strong>rush</strong> <strong>Resources</strong> <strong>TSXV</strong>: <strong>GOD</strong> $50.16 Nio<strong>Gold</strong> Mining Corporation <strong>TSXV</strong>: NOX $33.37 Crown <strong>Gold</strong> Coporation <strong>TSXV</strong>: CWM $17.0Average EV / <strong>Resources</strong> ($/oz) $64.3RatingFair value $0.30* <strong>Resources</strong> include all measured and indicated, and half of inferred and historical resourcesTherefore, based on our three valuation models, we arrived at a fair value of $0.38 pershare.Valuation SummaryDCF $0.40Real Options $0.45Comparables $0.30Average $0.38The following table shows the sensitivity of our valuation to changes in gold price anddiscount rate assumptions.Valuation Sensitivity Discount Rate (%)0.381056854 5.0% 11.5% 15.0%$600 $0.14 $0.11 $0.10$700 $0.27 $0.19 $0.16$800 $0.41 $0.28 $0.24<strong>Gold</strong> Price $900 $0.55 $0.38 $0.32(US$/oz) $1,000 $0.69 $0.48 $0.40$1,100 $0.83 $0.58 $0.48$1,200 $0.97 $0.67 $0.56$1,300 $1.11 $0.77 $0.64RisksWe initiate coverage on <strong><strong>Gold</strong>rush</strong> with a BUY rating and fair value of $0.40 pershare.The following risks, though not exhaustive, may cause our estimates to differ from actualresults:• The value of the company is dependent on commodity prices.• Access to capital and share dilution.© 2010 Fundamental Research Corp. www.researchfrc.com Siddharth Rajeev, B.Tech, MBA, CFAPLEASE READ THE IMPORTANT DISCLOSURES AT THE BACK OF THIS REPORT
<strong><strong>Gold</strong>rush</strong> <strong>Resources</strong> <strong>Ltd</strong> (<strong>TSXV</strong>: <strong>GOD</strong>) – <strong>Initiating</strong> <strong>Coverage</strong> Page 17• The success of drilling, project development and resource expansion are important longtermsuccess factors for these early projects.• The company does not own a currently producing mineral property.We rate the company’s shares a RISK of 5 (Highly Speculative).© 2010 Fundamental Research Corp. www.researchfrc.com Siddharth Rajeev, B.Tech, MBA, CFAPLEASE READ THE IMPORTANT DISCLOSURES AT THE BACK OF THIS REPORT
<strong><strong>Gold</strong>rush</strong> <strong>Resources</strong> <strong>Ltd</strong> (<strong>TSXV</strong>: <strong>GOD</strong>) – <strong>Initiating</strong> <strong>Coverage</strong> Page 18Fundamental Research Corp. Equity Rating Scale:Buy – Annual expected rate of return exceeds 12% or the expected return is commensurate with riskHold – Annual expected rate of return is between 5% and 12%Sell – Annual expected rate of return is below 5% or the expected return is not commensurate with riskSuspended or Rating N/A— <strong>Coverage</strong> and ratings suspended until more information can be obtained from the company regarding recent events.Fundamental Research Corp. Risk Rating Scale:1 (Low Risk) - The company operates in an industry where it has a strong position (for example a monopoly, high market share etc.) or operates in a regulated industry.The future outlook is stable or positive for the industry. The company generates positive free cash flow and has a history of profitability. The capital structure isconservative with little or no debt.2 (Below Average Risk) - The company operates in an industry where the fundamentals and outlook are positive. The industry and company are relatively less sensitiveto systematic risk than companies with a Risk Rating of 3. The company has a history of profitability and has demonstrated its ability to generate positive free cash flows(though current free cash flow may be negative due to capital investment). The company’s capital structure is conservative with little to modest use of debt.3 (Average Risk) - The company operates in an industry that has average sensitivity to systematic risk. The industry may be cyclical. Profits and cash flow are sensitiveto economic factors although the company has demonstrated its ability to generate positive earnings and cash flow. Debt use is in line with industry averages, andcoverage ratios are sufficient.4 (Speculative) - The company has little or no history of generating earnings or cash flow. Debt use is higher. These companies may be in start-up mode or in aturnaround situation. These companies should be considered speculative.5 (Highly Speculative) - The company has no history of generating earnings or cash flow. They may operate in a new industry with new, and unproven products.Products may be at the development stage, testing, or seeking regulatory approval. These companies may run into liquidity issues, and may rely on external funding.These stocks are considered highly speculative.Disclaimers and DisclosureThe opinions expressed in this report are the true opinions of the analyst about this company and industry. Any “forward looking statements” are our best estimates andopinions based upon information that is publicly available and that we believe to be correct, but we have not independently verified with respect to truth or correctness.There is no guarantee that our forecasts will materialize. Actual results will likely vary. The analyst and Fundamental Research Corp. “FRC” does not own any sharesof the subject company, does not make a market or offer shares for sale of the subject company, and does not have any investment banking business with the subjectcompany. Fees of less than $30,000 have been paid by <strong>GOD</strong> to FRC. The purpose of the fee is to subsidize the high costs of research and monitoring. FRC takessteps to ensure independence including setting fees in advance and utilizing analysts who must abide by CFA Institute Code of Ethics and Standards of ProfessionalConduct. Additionally, analysts may not trade in any security under coverage. Our full editorial control of all research, timing of release of the reports, and release ofliability for negative reports are protected contractually. To further ensure independence, <strong>GOD</strong> has agreed to a minimum coverage term including an initial report andthree updates starting with this report. <strong>Coverage</strong> can not be unilaterally terminated. Distribution procedure: our reports are distributed first to our web-basedsubscribers on the date shown on this report then made available to delayed access users through various other channels for a limited time. The performance of FRC’sresearch is ranked by Investars. Full rankings and are available at www.investars.com.The distribution of FRC’s ratings are as follows: BUY (74%), HOLD (8%), SELL (4%), SUSPEND (14%).To subscribe for real-time access to research, visit http://www.researchfrc.com/subscribe.php for subscription options.This report contains "forward looking" statements. Forward-looking statements regarding the Company and/or stock’s performance inherently involve risks anduncertainties that could cause actual results to differ from such forward-looking statements. Factors that would cause or contribute to such differences include, but arenot limited to, continued acceptance of the Company's products/services in the marketplace; acceptance in the marketplace of the Company's new product lines/services;competitive factors; new product/service introductions by others; technological changes; dependence on suppliers; systematic market risks and other risks discussed inthe Company's periodic report filings, including interim reports, annual reports, and annual information forms filed with the various securities regulators. By makingthese forward looking statements, Fundamental Research Corp. and the analyst/author of this report undertakes no obligation to update these statements for revisions orchanges after the date of this report. A report initiating coverage will most often be updated quarterly while a report issuing a rating may have no further or less frequentupdates because the subject company is likely to be in earlier stages where nothing material may occur quarter to quarter.Fundamental Research Corp DOES NOT MAKE ANY WARRANTIES, EXPRESSED OR IMPLIED, AS TO RESULTS TO BE OBTAINED FROM USING THISINFORMATION AND MAKES NO EXPRESS OR IMPLIED WARRANTIES OR FITNESS FOR A PARTICULAR USE. ANYONE USING THIS REPORTASSUMES FULL RESPONSIBILITY FOR WHATEVER RESULTS THEY OBTAIN FROM WHATEVER USE THE INFORMATION WAS PUT TO. ALWAYSTALK TO YOUR FINANCIAL ADVISOR BEFORE YOU INVEST. WHETHER A STOCK SHOULD BE INCLUDED IN A PORTFOLIO DEPENDS ON ONE’SRISK TOLERANCE, OBJECTIVES, SITUATION, RETURN ON OTHER ASSETS, ETC. ONLY YOUR INVESTMENT ADVISOR WHO KNOWS YOURUNIQUE CIRCUMSTANCES CAN MAKE A PROPER RECOMMENDATION AS TO THE MERIT OF ANY PARTICULAR SECURITY FOR INCLUSION INYOUR PORTFOLIO. This REPORT is solely for informative purposes and is not a solicitation or an offer to buy or sell any security. It is not intended as being acomplete description of the company, industry, securities or developments referred to in the material. Any forecasts contained in this report were independently preparedunless otherwise stated, and HAVE NOT BEEN endorsed by the Management of the company which is the subject of this report. Additional information is availableupon request. THIS REPORT IS COPYRIGHT. YOU MAY NOT REDISTRIBUTE THIS REPORT WITHOUT OUR PERMISSION. Please give proper credit,including citing Fundamental Research Corp and/or the analyst, when quoting information from this report.Fundamental Research Corp is registered with the British Columbia Securities Commission as a Securities Adviser which is not in any way an endorsement from theBCSC. The information contained in this report is intended to be viewed only in jurisdictions where it may be legally viewed and is not intended for use by any personor entity in any jurisdiction where such use would be contrary to local regulations or which would require any registration requirement within such jurisdiction.© 2010 Fundamental Research Corp. www.researchfrc.com Siddharth Rajeev, B.Tech, MBA, CFAPLEASE READ THE IMPORTANT DISCLOSURES AT THE BACK OF THIS REPORT