Response of juvenile scalloped hammerhead sharks to electric stimuli
Response of juvenile scalloped hammerhead sharks to electric stimuli
Response of juvenile scalloped hammerhead sharks to electric stimuli
- No tags were found...

Create successful ePaper yourself
Turn your PDF publications into a flip-book with our unique Google optimized e-Paper software.
242ARTICLE IN PRESSS.M. Kajiura, T.P. Fitzgerald / Zoology 112 (2009) 241–250shortcoming, this study measured and mapped thecharge distribution in seawater and compared it <strong>to</strong> themodeled distribution <strong>of</strong> <strong>electric</strong> charges for an idealdipole.Given the ability <strong>to</strong> model the charge distribution,predictions can then be made about how the <strong>sharks</strong> willrespond <strong>to</strong> a variety <strong>of</strong> prey-simulating dipole <strong>electric</strong>fields. By manipulating parameters such as the separationdistance <strong>of</strong> the electrodes on the dipole and themagnitude <strong>of</strong> the <strong>electric</strong> current passed between theelectrodes, various <strong>electric</strong> field sizes and intensities canbe generated. It was predicted that the <strong>sharks</strong> wouldorient from a greater distance when exposed <strong>to</strong> largerelectrode separations because a larger separation willestablish a proportionally larger <strong>electric</strong> field. Similarly,<strong>sharks</strong> should also orient from a greater distance whenexposed <strong>to</strong> a dipole with a greater applied currentstrength. Implicit in these predictions is the assumptionthat the <strong>electric</strong> field parameters remain sufficientlynaturalistic that the <strong>sharks</strong> will demonstrate normalfeeding behavior. It was further predicted that the<strong>sharks</strong> would be best attuned (i.e. demonstrate thegreatest sensitivity) <strong>to</strong> <strong>electric</strong> <strong>stimuli</strong> that most closelyresembled their natural prey. These predictions weretested by quantifying the response distance <strong>of</strong> the<strong>sharks</strong> <strong>to</strong> various <strong>stimuli</strong> and subsequently calculatingthe minimum voltage gradient that elicited a response(i.e. their threshold sensitivity).MethodsElectric field measurementTo verify that the literature model <strong>of</strong> <strong>electric</strong> fieldintensity values (Kalmijn, 1982a; Griffiths, 1989; Denny,1993; Benedek and Villars, 2000) matched actual valuesexperienced by the <strong>sharks</strong>, a dipole <strong>electric</strong> field wasmeasured in a controlled tank environment. Theexperimental apparatus used is illustrated in Fig. 1.A fiberglass tank (122 cm 243 cm 76 cm) was filled <strong>to</strong>a depth <strong>of</strong> 48 cm with seawater at a temperature <strong>of</strong>27.5 1C and a resistivity <strong>of</strong> 18.0 O cm. Two 1 mmdiameter holes separated by 1 cm were drilled throughthe center <strong>of</strong> a 61.0 cm 41.9 cm acrylic plate. Theacrylic plate was marked with concentric circles <strong>of</strong> 2, 3,4, 5, 10, 15 and 20 cm radius around the center <strong>of</strong> the1 cm dipole. Radiating from the center <strong>of</strong> the dipolewere lines drawn at 151 increments from 01 <strong>to</strong> 901 withrespect <strong>to</strong> the dipole axis. On the underside <strong>of</strong> the acrylicplate was glued a machined acrylic block that connectedthe holes on the plate <strong>to</strong> individual screw-in hose barbs.Fifty cm lengths <strong>of</strong> seawater-filled tygon tubing werepress-fitted snugly on the hose barbs and the plate wasthen centered on the bot<strong>to</strong>m <strong>of</strong> the tank. The oppositeend <strong>of</strong> each length <strong>of</strong> tubing was tightly sealed <strong>to</strong> goldplatedstainless steel pins at the end <strong>of</strong> a shieldedunderwater cable. A 12 V marine deep cycle battery wasused <strong>to</strong> apply a 600–800 mA DC current between theelectrodes which generated an <strong>electric</strong> field <strong>of</strong> sufficientmagnitude <strong>to</strong> be easily measured.The voltage at various locations around the dipolewas measured with chlorided silver wire electrodes (10 TMedwire; Mount Vernon, NY, USA) encased in glasspipettes filled with seawater agar <strong>to</strong> provide mechanicalstability. The reference electrode was affixed <strong>to</strong> the side<strong>of</strong> the tank near the surface <strong>of</strong> the water as far aspossible (approximately 145 cm) from the center <strong>of</strong> thedipole. The recording electrode was vertically <strong>of</strong>fset5 mm from the surface <strong>of</strong> the acrylic plate and wasaffixed <strong>to</strong> a vertical wooden dowel secured <strong>to</strong> a slidingtrack on the lip <strong>of</strong> the tank. By positioning the slidingtrack around the lip <strong>of</strong> the tank, the recording electrodesampled the voltage at various points around the acrylicplate. For each measurement, the wooden dowel waspositioned away from the center <strong>of</strong> the dipole <strong>to</strong>minimize any dis<strong>to</strong>rtion <strong>of</strong> the <strong>electric</strong> field. The outputfrom the electrodes was filtered (low pass: 0.1 kHz, highpass: 300 Hz) and amplified differentially at 10000 with a Warner DP304 amplifier (Hamden, CT, USA).The data were digitized with a PowerLab model 16/30(Colorado Springs, CO, USA) sampling at 1 kHz usingChart s<strong>of</strong>tware and a 1 mV calibration pulse wasprovided at the start and end <strong>of</strong> each recording session.Measurements were made <strong>of</strong> the voltage at 2, 3, 4, 5, 10,15 and 20 cm radius and at angles from 01 <strong>to</strong> 901 at 151increments with respect <strong>to</strong> the dipole axis. The order inwhich the points were sampled was randomized and acomplete data set was collected three times. Themeasurements were repeated for dipole separationdistances <strong>of</strong> 3 cm and 5 cm. For the 3 cm dipole,measurements started at 3 cm from the center <strong>of</strong> thedipole (1.5 cm from the closest pole) and for the 5 cmdipole measurements started at 4 cm from the center <strong>of</strong>the dipole (1.5 cm from the closest pole).Behavioral assaysThe behavioral trials were conducted in the largeoutdoor holding pens at the Hawaii Institute <strong>of</strong> MarineBiology (HIMB), Coconut Island, Oahu. The experimentalapparatus, pro<strong>to</strong>col and analysis methodologyhave been previously described (Kajiura and Holland,2002) and all experiments were conducted underUniversity <strong>of</strong> Hawaii IACUC pro<strong>to</strong>col 99-028-3. Briefly,<strong>juvenile</strong> <strong>scalloped</strong> <strong>hammerhead</strong> <strong>sharks</strong>, Sphyrna lewini(Griffith and Smith, 1834), were caught with barblesshooks and quickly transported <strong>to</strong> the outdoor holdingpens at HIMB where they were allowed <strong>to</strong> acclimate fora minimum <strong>of</strong> one week prior <strong>to</strong> the start <strong>of</strong>
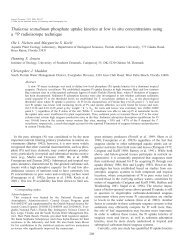
ARTICLE IN PRESSS.M. Kajiura, T.P. Fitzgerald / Zoology 112 (2009) 241–250 243differentialamplifier+-digitizercomputer12Vreference electroderecordingelectrode105 3 90°75°1560°2045°0°15°30°Fig. 1. Experimental apparatus used <strong>to</strong> measure voltage in a controlled environment. A 12 V marine battery produced a dipole<strong>electric</strong> field in the seawater through a pair <strong>of</strong> electrodes in the acrylic plate on the floor <strong>of</strong> the tank. The voltage was measureddifferentially with a recording electrode that was moved <strong>to</strong> various positions around the dipole. Concentric circles <strong>of</strong> 2, 3, 4, 5, 10, 15and 20 cm radius were drawn around the center <strong>of</strong> the dipole and lines radiated from the dipole axis at 151 increments from 01 <strong>to</strong> 901(expanded view at bot<strong>to</strong>m). These landmarks served as reference points <strong>to</strong> position the recording electrode relative <strong>to</strong> the center <strong>of</strong>the dipole. Output from the differential amplifier was digitized and s<strong>to</strong>red on computer.
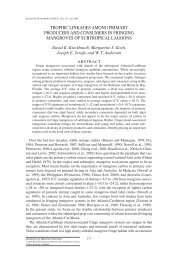
244ARTICLE IN PRESSS.M. Kajiura, T.P. Fitzgerald / Zoology 112 (2009) 241–2503 cm15 cm1 cmodor1 cmactivedipole5 cm20 cm1 mFig. 2. Electrode array used <strong>to</strong> study the response <strong>of</strong> <strong>juvenile</strong><strong>scalloped</strong> <strong>hammerhead</strong> <strong>sharks</strong> <strong>to</strong> prey-simulating dipole<strong>electric</strong> fields. In each trial, one <strong>of</strong> the four electrode pairswas activated with a weak <strong>electric</strong> current which generated adipole <strong>electric</strong> field around the electrodes. Electrodes werespaced 1, 3 or 5 cm apart and each electrode pair wasequidistant from an odor delivery tube in the center <strong>of</strong> theplate. The electrodes were spaced symmetrically on the plate,and around the center <strong>of</strong> each electrode pair a 10 cm radiuscircle was drawn as a frame-<strong>of</strong>-reference for subsequent videoanalysis. A line drawn on the plate through the dipole axis wasalso used during video analysis <strong>to</strong> determine orientation angle<strong>of</strong> the shark with respect <strong>to</strong> the dipole axis. An outline <strong>of</strong> ashark is included for scale.experimentation. A <strong>to</strong>tal <strong>of</strong> 19 <strong>sharks</strong> were tested (13females, 6 males) ranging in size from 46.0 cm <strong>to</strong>tallength (TL) <strong>to</strong> 58.5 cm TL with a mean <strong>of</strong> 53.2970.90standard error <strong>of</strong> the mean (s.e.m.) cm TL.A1m 2 clear acrylic plate was outfitted with four pairs <strong>of</strong>electrodes arranged equidistant around a center holethrough which odor was introduced (Fig. 2). Twoelectrode pairs had a 1 cm separation distance and onepair each had a 3 and 5 cm separation distance. Fiftycentimeter lengths <strong>of</strong> seawater-filled tygon tubing connectedeach electrode <strong>to</strong> a gold-plated stainless steelunderwater connec<strong>to</strong>r. The underwater cables were thesame as those used in the <strong>electric</strong> field measurementexperiments. A battery-powered stimula<strong>to</strong>r on the surfacecould activate any one <strong>of</strong> the four electrode pairs and varythe amount <strong>of</strong> <strong>electric</strong> current applied across the electrodes.To closely approximate the <strong>electric</strong> field emanatingfrom the prey, the applied current for the behavioral trialswas much lower (5–50 mA) than the current applied for the<strong>electric</strong> field measurement experiments (600–800 mA).A digital video camera mounted on a sliding track abovethe pen recorded the response <strong>of</strong> the <strong>sharks</strong> as theyoriented <strong>to</strong>ward the <strong>electric</strong> fields.Two variables were manipulated in the experiments.In one set <strong>of</strong> experiments, a constant current <strong>of</strong> 5.0 mAwas applied across a variety <strong>of</strong> electrode separationdistances (1, 3, 5 cm). The other manipulation varied theamount <strong>of</strong> <strong>electric</strong> current (5.0, 25.0, 50.0 mA) across afixed, 1 cm electrode separation distance. The range <strong>of</strong>generated <strong>electric</strong> fields was within the range measuredfrom prey (Kalmijn, 1972, 1974) and was chosenbased upon literature values that had successfullyelicited feeding behavior in other elasmobranch species(Kalmijn, 1971, 1978, 1982a). The manipulation <strong>of</strong>electrode separation distance and applied currentstrength produced a range <strong>of</strong> DC dipole moments. Forexample, 5 mA <strong>of</strong> <strong>electric</strong> current applied across a 1 cmelectrode separation distance results in a dipole moment<strong>of</strong> 5 mA cm, whereas the same 5 mA current appliedacross a 5 cm electrode separation distance results in adipole moment <strong>of</strong> 25 mA cm.To initiate a trial, a barrier net was used <strong>to</strong> separate anindividual test subject within the shallow (o0.5 m) part<strong>of</strong> the pen from the other <strong>sharks</strong> that swam freelythroughout the deeper part <strong>of</strong> the pen. The test shark wasallowed <strong>to</strong> acclimate for several minutes within the testingarena. Approximately 20–60 ml <strong>of</strong> food odor (squid rinse)was then slowly introduced through the odor deliverytube in the center <strong>of</strong> the electrode array and allowed <strong>to</strong>dissipate throughout the pen. The odor was introducedonly at the start <strong>of</strong> an experiment <strong>to</strong> initially arouse theshark and cause it <strong>to</strong> start searching for food. Once theshark became aroused by the odor, the odor delivery wasterminated and one <strong>of</strong> the electrode pairs was activated.The response <strong>of</strong> the shark was recorded with theoverhead video camera at 30 frames per second.To quantify the orientation <strong>to</strong> the <strong>electric</strong> field, thevideo footage was analyzed frame-by-frame <strong>to</strong> determinein which frame the shark initiated its orientation<strong>to</strong>ward the active dipole. This frame was extracted and adeinterlace filter applied with the image analysisprogram NIH ImageJ. The ImageJ s<strong>of</strong>tware was thencalibrated with a known frame <strong>of</strong> reference (20 cmdiameter circle drawn on the plate) and used <strong>to</strong> measurethe distance from the center <strong>of</strong> the dipole <strong>to</strong> the closestedge <strong>of</strong> the shark’s head. The angle described from thepoint on the shark’s head <strong>to</strong> the center <strong>of</strong> the dipole,then along the dipole axis was also measured and used inconjunction with the distance <strong>to</strong> calculate the voltagegradient (V cm 1 ) at the point where the shark initiatedits turn (cf. Kajiura and Holland, 2002, Fig. 3). Thisprovided a more conservative estimate <strong>of</strong> orientationdistance than measuring <strong>to</strong> the center <strong>of</strong> the head whichwould add several cm <strong>to</strong> the maximum orientationdistance. This technique has been used by previousinvestiga<strong>to</strong>rs <strong>to</strong> estimate the minimum voltage gradientthat elicits a response by elasmobranchs (Kalmijn, 1971,1978, 1982a; Johnson et al., 1984; Kajiura and Holland,2002; Kajiura, 2003).
ARTICLE IN PRESSS.M. Kajiura, T.P. Fitzgerald / Zoology 112 (2009) 241–250 245Voltage (mV)Voltage (µV)1.21.00.80.60.40.20.06050403020100For each individual, the maximum orientation distancewas selected for analysis which resulted in amaximum <strong>of</strong> 19 values with no replication. For someindividuals, a response <strong>to</strong> a particular stimulus was notrecorded which resulted in a smaller sample size forsome treatments. The orientation distance data weretested for normality and homoscedasticity and logtransformed if necessary prior <strong>to</strong> analysis with individual1-way ANOVA tests using dipole separation andapplied current strength as separate treatments.Results0 5 10 15 20Distance (cm)Electric field measurement180°1cm3cm5cm0 10 20 30 40 50 60 70 80 90AngleThe voltages were measured for 1, 3 and 5 cm dipolesand the measured voltages closely matched the modeledvalues for an ideal dipole charge distribution in halfspace (Griffiths, 1989; Kalmijn, 1982a). For all threedipole sizes the voltage decreased as a square <strong>of</strong>dd90°270°Fig. 3. Measured values (mean7SD) <strong>of</strong> the voltage plottedwith the calculated theoretical values. (A) The voltagedecreases as a square <strong>of</strong> distance and (B) it also decreases asa cosine function from a maximum at 01 <strong>to</strong> a minimum at 901.The measured values (symbols) closely fit the modeled values(lines) for both parameters. For (A), the measurements weretaken along the dipole axis at 01. For (B), the measurementswere taken at a radius <strong>of</strong> 15 cm from the center <strong>of</strong> the dipole.0°rdistance, and the standard deviation error bars enclosedthe modeled values (Fig. 3A). The inverse squarerelationship was maintained even though the actualmagnitude <strong>of</strong> the voltage increased proportionally withdipole size (Fig. 3A). This resulted in a given voltagebeing present at a greater distance with correspondinglylarger dipole sizes.The voltage also varied as a cosine function <strong>of</strong> anglearound the dipole axis. The voltage was greatest in theplane <strong>of</strong> the dipole axis (01) and decreased <strong>to</strong> zero in theperpendicular plane (901) (Fig. 3B). Although notshown, when the angle exceeded 901, there was apredictable change in sign from positive <strong>to</strong> negative.The close match between measured and modeledvoltages indicates that the <strong>electric</strong> field intensity can beaccurately interpolated for any position around thedipole.Behavioral responseAs the relatively small volume <strong>of</strong> odor stimulusdissipated through the large testing arena, the experimentalshark would become aroused and dramaticallychange its swimming behavior. The <strong>sharks</strong> would swimat an increased velocity close <strong>to</strong> the bot<strong>to</strong>m anddemonstrate apparently exaggerated head yaw. Becausethe odor was so diffuse, and the odor delivery wass<strong>to</strong>pped well before the <strong>sharks</strong> approached the acrylicplate, they did not orient <strong>to</strong>ward or bite at the odorsource, but bit only at the <strong>electric</strong> stimulus. Feedingresponses (bites) were obtained for all dipole sizes andapplied current strengths. Sharks oriented <strong>to</strong> the center<strong>of</strong> the dipole by turning sharply (defined by Kajiura andHolland, 2002 as 4201 change in trajec<strong>to</strong>ry), swimming<strong>to</strong>ward the center <strong>of</strong> the dipole and biting at theelectrodes. This behavior was initiated from a maximumdistance <strong>of</strong> 46.1 cm. Sharks that were motivated <strong>to</strong>search for food always bit at the active dipole when theypassed within the 10 cm radius frame-<strong>of</strong>-reference circledrawn around each electrode pair. Sharks never bit atthe non-active (control) electrodes. Multiple bites at theactive dipole were sometimes observed. Sharks wouldbite once then immediately swim away, turn back andbite at the dipole again, <strong>of</strong>ten repeatedly. In theseinstances, only the initial orientation was included in theanalysis as subsequent orientations might have derivedfrom the shark knowing the location <strong>of</strong> the dipole fromthe initial interaction.The <strong>electric</strong> field is strongly influenced by theenvironmental parameters <strong>of</strong> temperature and salinity.Throughout the course <strong>of</strong> the behavioral trials, temperatureranged from 26.8 <strong>to</strong> 27.7 1C and the salinityranged from 34.90 <strong>to</strong> 35.27 ppt. These values yieldedseawater resistivities <strong>of</strong> 17.69–18.22 O cm. Because thesize <strong>of</strong> the <strong>electric</strong> field increases proportionally with
ARTICLE IN PRESSS.M. Kajiura, T.P. Fitzgerald / Zoology 112 (2009) 241–250 247(Griffiths, 1989; Kalmijn, 1982a). The variables include:r is the resistivity <strong>of</strong> the seawater (O cm), I is the applied<strong>electric</strong> current (A), d is the electrode separation distance(i.e. distance between positive and negative poles <strong>of</strong> thedipole) (cm), r is the radius (i.e. distance from the center<strong>of</strong> the dipole <strong>to</strong> the position in space for which thepotential is being calculated) (cm) and y is the anglefrom the position in space <strong>to</strong> the center <strong>of</strong> the dipolewith respect <strong>to</strong> the dipole axis. This equation describesthe voltage in half space, with the electrodes mounted <strong>to</strong>the base <strong>of</strong> an insulating plate such that the conductingmedium is a hemisphere above the electrodes (Kalmijn,1982a). From this equation, it is apparent that thevoltage (V) varies as an inverse square <strong>of</strong> distance (r).The voltage also varies as a function <strong>of</strong> angle withrespect <strong>to</strong> the dipole axis, being maximal in the plane <strong>of</strong>the dipole axis (01) and decreasing as a cosine function<strong>to</strong> a theoretical null in the perpendicular plane (901).The empirically measured values closely matched thecalculated ideal values for both components (Fig. 3).Although it was the voltage that was directlymeasured in these experiments, it is thought thatelasmobranch electrorecep<strong>to</strong>rs act as voltage gradientdetec<strong>to</strong>rs (Kalmijn, 1971, 1974, 1978, 1988). The voltagegradient, or <strong>electric</strong> field (E), is the spatial derivative <strong>of</strong>the voltage and hence has the units V m 1 . For an idealdipole, the voltage gradient varies not as an inversesquare, but as an inverse cube with distance. A cosineangular dependency is retained granting the greatest<strong>electric</strong> field intensity in the plane parallel <strong>to</strong> the dipoleaxis with a minimal field strength in the perpendicularplane (Griffiths, 1989; Denny, 1993). For each experimentaltrial, the appropriate values <strong>of</strong> distance (r) andangle (y) were used <strong>to</strong> determine the <strong>electric</strong> fieldintensity at the point where the shark initiated itsorientation <strong>to</strong> the dipole. The close concordancebetween the measured and calculated values confirmsthat the response thresholds calculated for the <strong>sharks</strong>based upon distance (r) and angle (y) accuratelyrepresent the actual field intensities encountered by the<strong>sharks</strong>. There is also behavioral evidence <strong>to</strong> support thatthe <strong>electric</strong> field intensity is greatest in the plane parallel<strong>to</strong> the dipole axis. Both <strong>scalloped</strong> <strong>hammerhead</strong> andsandbar <strong>sharks</strong> initiate orientations from a greaterdistance at small axis angles and need <strong>to</strong> be closer <strong>to</strong>the dipole <strong>to</strong> demonstrate a response when they are inthe orthogonal plane (Kajiura and Holland, 2002).The equation used <strong>to</strong> model the <strong>electric</strong> field intensityassumes that the orientation distance exceeds that <strong>of</strong> theelectrode separation distance (r4d) (Kalmijn, 1982a;Denny, 1993; Benedek and Villars, 2000). This assumptionhas been accepted in other studies <strong>of</strong> elasmobranchelectroreception (Kalmijn, 1982a; Johnson et al., 1984;Kajiura and Holland, 2002; Kajiura, 2003) and issufficient for the resolution obtained in this study. Thatis, since the head <strong>of</strong> the shark is large with respect <strong>to</strong> thedipole separation distance, and it is covered withthousands <strong>of</strong> electrorecep<strong>to</strong>r pores (Kajiura, 2001),there is no single point along the head that can betaken as the detection point. Therefore, the calculatedfield intensity should be used as an approximation andnot a definitive measure <strong>of</strong> threshold sensitivity. Thevalue <strong>of</strong> this technique lies in its ability <strong>to</strong> comparerelative field intensities rather than determiningthe absolute sensory capabilities which would bebest addressed by using neurophysiological techniques(Tricas and New, 1998).This study chose the point along the side <strong>of</strong> the headthat was closest <strong>to</strong> the center <strong>of</strong> the dipole as the pointused <strong>to</strong> calculate the <strong>electric</strong> field intensity. This isparticularly important for sphyrnid <strong>sharks</strong> in which thedistance from the lateral margin <strong>to</strong> the center <strong>of</strong> thehead can be large. Therefore, if the measurement hadbeen taken <strong>to</strong> the center <strong>of</strong> the head it would increase theorientation distance by several cm yielding a greatersensitivity value. Ideally, measurements should be taken<strong>to</strong> the actual location <strong>of</strong> the electrorecep<strong>to</strong>r ampullaewithin the head. However, in S. lewini, most electrorecep<strong>to</strong>rson the lateral margins <strong>of</strong> the head converge inthe large infraorbital cluster which extends along much<strong>of</strong> the width <strong>of</strong> the cephal<strong>of</strong>oil (Chu and Wen, 1979).This precludes measuring <strong>to</strong> a single point within thecluster which is why the more conservative estimate <strong>of</strong>the periphery <strong>of</strong> the head was chosen.Behavioral responseThe fact that the <strong>sharks</strong> bit at the dipoles attests <strong>to</strong> theadequacy <strong>of</strong> the stimulus <strong>to</strong> represent prey. The <strong>sharks</strong>initiated orientations from distances in excess <strong>of</strong> 40 cmand demonstrated their ability <strong>to</strong> precisely locate thedipole source by biting only when directly over thecenter <strong>of</strong> the dipole. The non-active (control) electrodeswere never bitten even though they were visuallyidentical <strong>to</strong> the activated electrodes. In addition, thefood odor that diffused throughout the pen served only<strong>to</strong> arouse the <strong>sharks</strong> and did not present a point stimulusfor orientation. Indeed, the <strong>sharks</strong> never bit at the odorsource on the acrylic plate.Two parameters, electrode separation distance andapplied current strength, were independently manipulated<strong>to</strong> test for differences in orientation distance <strong>to</strong>different stimulus conditions. The 1, 3 and 5 cm dipolessimulated small, medium and large prey items for thissize <strong>of</strong> shark and the <strong>electric</strong> current strengths, from 5.0<strong>to</strong> 50.0 mA, were used <strong>to</strong> generate prey-simulating, weak<strong>electric</strong> fields similar <strong>to</strong> the 50–500 mV fields measuredaround crustaceans and teleosts (Kalmijn, 1974).A given <strong>electric</strong> field intensity will occur at a greaterdistance from the center <strong>of</strong> the dipole when theseparation distance between the poles is increased, thus
248ARTICLE IN PRESSS.M. Kajiura, T.P. Fitzgerald / Zoology 112 (2009) 241–2505µA1cm5µA5cm5µA1cm50µA1cm5.4cm5.4cm1.0µV12.0cm1.0µV16.9cm1.0µV1.0µVFig. 6. Diagrammatic representation <strong>of</strong> how <strong>electric</strong> fieldintensity varies with changes in dipole separation and appliedcurrent strength. Any given voltage (V) will occur at a greaterdistance from the center <strong>of</strong> the dipole when (A) dipoleseparation is increased and current strength is constant; orwhen (B) current strength is increased and dipole separation isconstant. In (A), the applied <strong>electric</strong> current is held constant at5 mA for dipole separations <strong>of</strong> 1 and 5 cm creating DC dipolemoments <strong>of</strong> 5 and 25 mA cm, respectively. A voltage <strong>of</strong> 1.0 mVis produced at 5.4 cm from the center <strong>of</strong> a dipole with a 1 cmseparation distance. That same voltage (1.0 mV) occurs at adistance <strong>of</strong> 12.0 cm from the center <strong>of</strong> a dipole with a 5 cmseparation distance. Therefore, increasing the electrode separationfrom 1 <strong>to</strong> 5 cm would more than double the possibledetection distance in this example. In (B), the dipole separationis held constant at 1 cm for applied current strengths <strong>of</strong> 5 mAand 50 mA. A voltage <strong>of</strong> 1.0 mV is produced at 5.4 cm from thecenter <strong>of</strong> a dipole that has an applied current strength <strong>of</strong> 5 mA.That same voltage (1.0 mV) occurs at a distance <strong>of</strong> 16.9 cmfrom the center <strong>of</strong> a dipole that has an applied current strength<strong>of</strong> 50 mA. Therefore, increasing the current strength from 5.0 <strong>to</strong>50.0 mA would provide a three-fold increase in possibledetection distance. Both <strong>of</strong> these examples assume a seawaterresistivity <strong>of</strong> 18.0 O cm, and an orientation angle <strong>of</strong> 01.creating a greater DC dipole moment (Fig. 6A).Therefore, it was predicted that for a given <strong>electric</strong> fieldintensity (E) the <strong>sharks</strong> would orient <strong>to</strong> a dipole from agreater distance (r) when the separation between thepoles (d) was increased: ((Ep(d/r)). Thus the <strong>sharks</strong> willencounter a given <strong>electric</strong> field intensity at a greaterdistance from the center <strong>of</strong> the dipole when the electrodeseparation is increased (Fig. 6A). The prediction <strong>of</strong>increased orientation distance with increased dipole sizewas supported by the data. The <strong>sharks</strong> oriented from asignificantly greater distance when exposed <strong>to</strong> a 5 cmdipole compared <strong>to</strong> a 1 cm dipole (Fig. 4).Although the <strong>sharks</strong> oriented from a significantlygreater distance when the electrode separation distancewas increased, if the electrode separation distanceexceeds the size <strong>of</strong> a natural prey item the <strong>sharks</strong> mightnot interpret the larger <strong>electric</strong> field as prey (Fitzgerald,2002). Therefore, the behavior <strong>of</strong> the <strong>sharks</strong> may beinfluenced by their perception <strong>of</strong> the stimulus and theymight not respond as predicted if the parameters areextrapolated beyond certain limits. For instance, if theelectrode separation is exceedingly large, the <strong>sharks</strong>might not bite at the dipole but might actually berepelled. Because this study examined only preysimulating<strong>stimuli</strong>, this hypothesis invites further investigation.A given <strong>electric</strong> field intensity will also occur at agreater distance from the center <strong>of</strong> the dipole when theapplied current strength is increased (Fig. 6B). Therefore,if <strong>sharks</strong> respond by orienting <strong>to</strong> the dipole whenthey detect some threshold <strong>electric</strong> field intensity (E), itwas predicted that the <strong>sharks</strong> would orient from agreater distance (r) when exposed <strong>to</strong> dipoles <strong>of</strong> aconstant size but with greater applied current strengths(I): (Ep(I/r)). The prediction <strong>of</strong> increased orientationdistance at greater applied current strength was alsosupported by the data (Fig. 5).The range <strong>of</strong> <strong>electric</strong> currents used in these experimentswas chosen based upon literature values that hadsuccessfully elicited feeding behavior by various elasmobranchspecies (Kalmijn, 1971, 1978, 1982a; Johnsonet al., 1984; Kajiura and Holland, 2002; Kajiura, 2003).The applied currents were constrained within a rangeknown <strong>to</strong> be stimula<strong>to</strong>ry <strong>to</strong> the <strong>sharks</strong>, therefore it is notsurprising that the <strong>sharks</strong> responded as predicted byinitiating feeding orientations at successively greaterdistances with increased applied current. However, thecorrelation <strong>of</strong> orientation distance with applied currentmust be qualified by recalling that the nature <strong>of</strong> theresponse is dependent upon the shark perceiving thestimulus as prey. If the stimulus is not perceived as prey,the shark may detect the <strong>electric</strong> field but not bite at it.Alternatively, a shark that detects and orients <strong>to</strong> an<strong>electric</strong> field at a distance may abandon that orientationonce the stimulus strength no longer resembles that <strong>of</strong> aprey item. Although the <strong>sharks</strong> would theoreticallyrespond from a greater distance at higher currentstrengths, their behavior might differ from that predictedby simply scaling the model.Threshold sensitivityIt was predicted that the <strong>sharks</strong> would demonstratethe best response <strong>to</strong> <strong>stimuli</strong> that most closely matchedtheir natural prey items. Although a variety <strong>of</strong> preyitems <strong>of</strong> different sizes are found in the s<strong>to</strong>mach <strong>of</strong><strong>juvenile</strong> <strong>hammerhead</strong> <strong>sharks</strong> in Kaneohe Bay, the mostcommon prey items are benthic shrimp (Family:Alpheidae) and gobies (Family: Gobiidae) (Clarke,1971; Bush, 2003). Both <strong>of</strong> these prey items are mostclosely approximated in size by the 1 and 3 cm dipoles.
ARTICLE IN PRESSS.M. Kajiura, T.P. Fitzgerald / Zoology 112 (2009) 241–250 249Although the <strong>sharks</strong> demonstrated the lowest medianresponse threshold (11.0 nV cm 1 ) when presented withthe smallest dipole size (1 cm), the responses did notdiffer significantly among the different size dipoles.Because the range <strong>of</strong> tested dipole sizes reflects the sizerange <strong>of</strong> their natural prey items, it is perhaps notsurprising that there was no difference. However, it ispredicted that as the <strong>sharks</strong> increase in size throughou<strong>to</strong>n<strong>to</strong>geny, they will become increasingly attuned <strong>to</strong>larger dipole sizes that will more accurately representtheir correspondingly larger prey.The behavioral response used as the indica<strong>to</strong>r that theshark had detected the dipole represents a conservativeestimate <strong>of</strong> the position at which the shark actuallydetected the <strong>electric</strong> field. The shark may have detectedthe <strong>electric</strong> field at a greater distance (i.e. at a lower<strong>electric</strong> field intensity) but continued <strong>to</strong> swim along thesame trajec<strong>to</strong>ry until it reached an <strong>electric</strong> field intensitythat triggered a behavioral response (i.e. a change indirection) (Kim, 2007). This behavioral response thresholdis the value quantified in these experiments and isthus a conservative estimate <strong>of</strong> the <strong>sharks</strong>’ sensorycapabilities.The minimum response thresholds determined in thisstudy are similar <strong>to</strong>, but slightly lower than, the valuespreviously reported for this species (Kajiura and Holland,2002). In the study by Kajiura and Holland (2002),a single stimulus (6 mA, 1 cm electrode separation)yielded a median <strong>electric</strong> field threshold <strong>of</strong> 25.2 nV cm 1whereas in this study, a 5.0 mA current applied across a1 cm electrode separation distance yielded a median<strong>electric</strong> field threshold <strong>of</strong> 11.0 nV cm 1 . These values aremuch lower than the threshold determined for neonatalbonnethead <strong>sharks</strong>, Sphyrna tiburo, which had a medianthreshold <strong>of</strong> 47 nV cm 1 (Kajiura, 2003). In this study,37.5% <strong>of</strong> orientations by the <strong>juvenile</strong> <strong>scalloped</strong> <strong>hammerhead</strong><strong>sharks</strong> were <strong>to</strong> a stimulus <strong>of</strong> less than 10 nV cm 1and 4.5% <strong>of</strong> all orientations were <strong>to</strong> a stimulus <strong>of</strong> lessthan 1 nV cm 1 . These values compare favorably withother non-sphyrnid shark species. The smooth dogfish,Mustelus canis, demonstrated the ability <strong>to</strong> detectvoltage gradients as low as 5 nV cm 1 (Kalmijn, 1978,1982a). Trained captive nurse <strong>sharks</strong>, Ginglymos<strong>to</strong>macirratum, demonstrated minimum threshold sensitivities<strong>of</strong> 5–10 nV cm 1 in the presence <strong>of</strong> a 20 nV cm 1 appliedbackground field (Johnson et al., 1984). The sandbarshark, Carcharhinus plumbeus, responded <strong>to</strong> a minimumvoltage gradient <strong>of</strong> 0.5 nV cm 1 and a median voltagegradient <strong>of</strong> 30.3 nV cm 1 which did not differ significantlyfrom the <strong>scalloped</strong> <strong>hammerhead</strong> (Kajiura andHolland, 2002). Although the experimental apparatusand <strong>stimuli</strong> used in this study were similar <strong>to</strong> thosedescribed by Kalmijn (1978, 1982a), differences inanalytical methods might not allow the results <strong>to</strong> bedirectly compared. For instance, some previous studiesmerely estimated orientation distance and were unable<strong>to</strong> analyze footage frame-by-frame <strong>to</strong> determine preciseorientation distance (Kalmijn, 1971, 1978, 1982a). Inaddition, whereas those previous studies groupedorientation angles as either along the dipole axis, normal<strong>to</strong> the dipole axis or intermediate, this study was able <strong>to</strong>accurately measure orientation angle <strong>to</strong> the nearestdegree from the individual video frames. The limitation<strong>of</strong> different methodologies can be overcome by testingdifferent species under identical conditions and comparingthe minimum response thresholds obtained for thedifferent species (cf. Kajiura and Holland, 2002).These experiments deliberately tested only <strong>stimuli</strong> thatsimulated natural prey items. Thus, the range <strong>of</strong>stimulus size and intensity was limited. However,elasmobranch fishes are capable <strong>of</strong> detecting non-prey<strong>electric</strong> fields. Elasmobranchs respond <strong>to</strong> the <strong>electric</strong>fields <strong>of</strong> conspecifics (Tricas et al., 1995), <strong>of</strong> preda<strong>to</strong>rs(Sisneros et al., 1998) and can theoretically respond <strong>to</strong>induced fields caused by swimming through the earth’smagnetic field (Kalmijn, 1974; Paulin, 1995) or neargeomagnetic anomalies (Klimley, 1993). Therefore, awide range <strong>of</strong> detectable <strong>electric</strong> <strong>stimuli</strong> remains <strong>to</strong> betested.AcknowledgementsWe thank K.N. Holland for the project guidance anduse <strong>of</strong> the shark pens and F.T. LeRand for help withanimal husbandry. T.C. Tricas provided valuable insightfor measurement <strong>of</strong> the <strong>electric</strong> fields. A.C. Rivera-Vicente and D.M. McComb assisted with behavioraltrials and M.E. Porter and L.A. Weiland assisted with<strong>electric</strong> field measurements. K. Sorge illuminated thephysics <strong>of</strong> <strong>electric</strong> fields and any errors remain our own.Partial support for this project was provided by theRaney Fund for Ichthyological Research, the Lerner-Gray Fund for Marine Research, the Lord Scholarshipand NSF (IOS-0639949). This is HIMB contribution1325.ReferencesBenedek, G.B., Villars, F., 2000. Physics, with IllustrativeExamples from Medicine and Biology. AIP Press, NewYork.Bush, A., 2003. Diet and diel feeding periodicity <strong>of</strong> <strong>juvenile</strong><strong>scalloped</strong> <strong>hammerhead</strong> <strong>sharks</strong>, Sphyrna lewini, in Kane’oheBay, O’ahu, Hawai’i. Environ. Biol. Fishes 67, 1–11.Camperi, M., Tricas, T.C., Brown, B.R., 2007. Frommorphology <strong>to</strong> neural information: the <strong>electric</strong> sense <strong>of</strong>the skate. PLoS Comput. Biol. 3, 1–14.Chu, Y.T., Wen, M.C., 1979. A study <strong>of</strong> the lateral-line canalssystem and that <strong>of</strong> Lorenzini ampullae and tubules <strong>of</strong>elasmobranchiate fishes <strong>of</strong> China. In: Monograph <strong>of</strong> Fishes
250ARTICLE IN PRESSS.M. Kajiura, T.P. Fitzgerald / Zoology 112 (2009) 241–250<strong>of</strong> China 2. Shanghai Science and Technology Press, pp.117–126.Clarke, T.A., 1971. Ecology <strong>of</strong> <strong>scalloped</strong> <strong>hammerhead</strong> shark,Sphyrna lewini, in Hawaii. Pac. Sci. 25, 133–144.Denny, M.W., 1993. Air and Water: The Biology and Physics<strong>of</strong> Life’s Media. Prince<strong>to</strong>n University Press, Prince<strong>to</strong>n, NJ.Fitzgerald, T.P., 2002. Behavioral responses <strong>of</strong> <strong>juvenile</strong>sandbar <strong>sharks</strong>, Carcharhinus plumbeus, <strong>to</strong> direct currentand alternating current <strong>stimuli</strong>. MS Thesis, University <strong>of</strong>Hawaii, Honolulu.Griffiths, D.J., 1989. Introduction <strong>to</strong> Electrodynamics. PrenticeHall, Englewood Cliffs, NJ.Johnson, C.S., Scronce, B.L., McManus, M.W., 1984. Detection<strong>of</strong> DC <strong>electric</strong> dipoles in background fields by thenurse shark. J. Comp. Physiol. 155, 681–687.Kajiura, S.M., 2001. Head morphology and electrosensorypore distribution <strong>of</strong> carcharhinid and sphyrnid <strong>sharks</strong>.Environ. Biol. Fishes 61, 125–133.Kajiura, S.M., 2003. Electroreception in neonatal bonnethead<strong>sharks</strong>, Sphyrna tiburo. Mar. Biol. 143, 603–611.Kajiura, S.M., Holland, K.N., 2002. Electroreception in<strong>juvenile</strong> <strong>scalloped</strong> <strong>hammerhead</strong> and sandbar <strong>sharks</strong>. J.Exp. Biol. 205, 3609–3621.Kalmijn, A.J., 1971. Electric sense <strong>of</strong> <strong>sharks</strong> and rays. J. Exp.Biol. 55, 371–383.Kalmijn, A.J., 1972. Bio<strong>electric</strong> fields in sea water and thefunction <strong>of</strong> the ampullae <strong>of</strong> Lorenzini in elasmobranchfishes. SIO Reference Series no. 72–83, pp. 1–21.Kalmijn, A.J., 1974. The detection <strong>of</strong> <strong>electric</strong> fields frominanimate and animate sources other than <strong>electric</strong> organs.In: Autrum, H. (Ed.), Handbook <strong>of</strong> Sensory Physiology,vol. 3. Springer, New York, pp. 149–199.Kalmijn, A.J., 1978. Electric and magnetic sensory world <strong>of</strong><strong>sharks</strong>, skates, and rays. In: Hodgson, E.S., Mathewson,R.F. (Eds.), Sensory Biology <strong>of</strong> Sharks, Skates and Rays. USGovernment Printing Office, Washing<strong>to</strong>n, DC, pp. 507–528.Kalmijn, A.J., 1981. Biophysics <strong>of</strong> geomagnetic-field detection.IEEE Trans. Magn. 17, 1113–1124.Kalmijn, A.J., 1982a. Electric and magnetic-field detection inelasmobranch fishes. Science 218, 916–918.Kalmijn, A.J., 1982b. Theory <strong>of</strong> electromagnetic orientation: afurther analysis. In: Bolis, L., Keynes, R.D., Maddrell,S.H.P. (Eds.), Comparative Physiology <strong>of</strong> Sensory Systems.Cambridge University Press, Cambridge, pp. 525–560.Kalmijn, A.J., 1988. Detection <strong>of</strong> weak <strong>electric</strong> fields. In:Atema, J., Fay, R.R., Popper, A.N., Tavolga, W.N. (Eds.),Sensory Biology <strong>of</strong> Aquatic Animals. Springer, New York,pp. 151–186.Kalmijn, A.J., 1997. Electric and near-field acousticdetection, a comparative study. Acta Physiol. Scand. 161,25–38.Kim, D., 2007. Prey detection mechanism <strong>of</strong> elasmobranchs.Biosystems 87, 322–331.Klimley, A.P., 1993. Highly directional swimming by <strong>scalloped</strong><strong>hammerhead</strong> <strong>sharks</strong>, Sphyrna lewini, and subsurfaceirradiance, temperature, bathymetry, and geomagneticfield. Mar. Biol. 117, 1–22.Paulin, M.G., 1995. Electroreception and the compass sense <strong>of</strong><strong>sharks</strong>. J. Theor. Biol. 174, 325–339.Sisneros, J.A., Tricas, T.C., Luer, C.A., 1998. <strong>Response</strong>properties and biological function <strong>of</strong> the skate electrosensorysystem during on<strong>to</strong>geny. J. Comp. Physiol. A 183,87–99.Tricas, T.C., 1982. Bio<strong>electric</strong>-mediated predation by swell<strong>sharks</strong>, Cephaloscylium ventriosum. Copeia 1982, 948–952.Tricas, T.C., New, J.G., 1998. Sensitivity and responsedynamics <strong>of</strong> elasmobranch electrosensory primary afferentneurons <strong>to</strong> near threshold fields. J. Comp. Physiol. A 182,89–101.Tricas, T.C., Michael, S.W., Sisneros, J.A., 1995. Electrosensoryoptimization <strong>to</strong> conspecific phasic signals formating. Neurosci. Lett. 202, 129–132.