Estimating Stock Price Volatility in the Black-Scholes-Merton Model
Estimating Stock Price Volatility in the Black-Scholes-Merton Model
Estimating Stock Price Volatility in the Black-Scholes-Merton Model
- No tags were found...

Create successful ePaper yourself
Turn your PDF publications into a flip-book with our unique Google optimized e-Paper software.
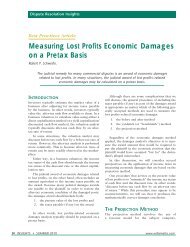
November/December 2011Current risk-free <strong>in</strong>terest rateCumulative normal distribution functionTheoretical option price = pN(d 1) - se -rt N(d 2)Time rema<strong>in</strong><strong>in</strong>g until expiration, expressed as a % of a yearwhere d 1=p v– – 2s 2 tln( ) + (r + )v √ t<strong>Volatility</strong> measured by annual standard deviationd 2= d 1-v √ t
A PROFESSIONAL DEVELOPMENT JOURNAL for <strong>the</strong> CONSULTING DISCIPLINESv a l u a t i o n•<strong>Estimat<strong>in</strong>g</strong> <strong>Stock</strong> <strong>Price</strong> <strong>Volatility</strong> <strong>in</strong> <strong>the</strong><strong>Black</strong>-<strong>Scholes</strong>-<strong>Merton</strong> <strong>Model</strong>•By Aaron M. Rotkowski, CFA, ASAClosely held companies that issue stock options need to know <strong>the</strong> fairmarket value of <strong>the</strong>se stock options for a variety of purposes, <strong>in</strong>clud<strong>in</strong>gdispute resolution, gift and estate tax compliance, transaction-related,report<strong>in</strong>g requirements, and o<strong>the</strong>rs. This article presents analyticalprocedures that can be used to estimate <strong>the</strong> fair market value of stock optionspayment <strong>in</strong> a transaction••When options are part of an estatethat is subject to estate tax••The divorce of an executive whoholds optionsissued by companies whose shares arenot listed on a stock exchange or quotedon <strong>the</strong> NASDAQ.The <strong>Black</strong>-<strong>Scholes</strong>-<strong>Merton</strong> (BSM)option pric<strong>in</strong>g model is perhaps <strong>the</strong>most widely used option pric<strong>in</strong>g modelused by valuation analysts to estimate<strong>the</strong> fair market value of non-tradedstock options issued by closely heldcompanies. I will focus on <strong>the</strong> stockprice volatility component of <strong>the</strong> BSMmodel. <strong>Stock</strong> price volatility is an importantfactor <strong>in</strong> many option valuationmodels—usually <strong>the</strong> most importantfactor. This particular <strong>in</strong>put is difficultto estimate, is subject to <strong>the</strong> judgmentof <strong>the</strong> valuator, and exerts a significanteffect on <strong>the</strong> fair market value of <strong>the</strong>subject stock option.The BSM option pric<strong>in</strong>g model’spopularity and acceptance have <strong>in</strong>creaseds<strong>in</strong>ce it was first <strong>in</strong>troduced <strong>in</strong><strong>the</strong> early 1970s. It is noteworthy that <strong>in</strong>1997 <strong>the</strong> BSM model authors won <strong>the</strong>Nobel Prize for <strong>the</strong>ir work <strong>in</strong> develop<strong>in</strong>g<strong>the</strong> option pric<strong>in</strong>g model.In this article I will not addressshare-based compensation for f<strong>in</strong>ancialstatement report<strong>in</strong>g purposes. Forf<strong>in</strong>ancial statement report<strong>in</strong>g purposes,share-based compensation is regulatedby FASB’s Account<strong>in</strong>g StandardsCodification (ASC) 718, formerly SFASNo. 123R.I will first present a list of commonreasons why valuation analysts are askedto estimate <strong>the</strong> fair market value of closelyheld company stock options. Second,I will discuss analytical procedures thatcan be used to estimate stock price volatilityfor closely held company stock.Reasons to Value <strong>Stock</strong>OptionsEmployer companies and <strong>the</strong>ir advisersneed to know <strong>the</strong> fair marketvalue of stock options <strong>in</strong> a variety ofsituations, <strong>in</strong>clud<strong>in</strong>g (but not limitedto) <strong>the</strong> follow<strong>in</strong>g:••Transferr<strong>in</strong>g ownership of optionsto a third party••Damage suits <strong>in</strong> which <strong>the</strong> value ofoptions is at issue, such as a breachof contract suit between an exist<strong>in</strong>gor former executive and <strong>the</strong> issu<strong>in</strong>gcompany••The repurchase of options by <strong>the</strong> issu<strong>in</strong>gcompany••When options are issued as a form of<strong>Estimat<strong>in</strong>g</strong> <strong>Stock</strong> <strong>Price</strong><strong>Volatility</strong>The five basic components of <strong>the</strong>BSM option pric<strong>in</strong>g model are: (1) optiontime to expiration, (2) option exerciseprice, (3) risk-free <strong>in</strong>terest rate, (4)current price of <strong>the</strong> underly<strong>in</strong>g stock,and (5) expected volatility of <strong>the</strong> stockprice over <strong>the</strong> life of <strong>the</strong> stock option.The first three items listed are typicallyknown with certa<strong>in</strong>ty; those values are notcontroversial <strong>in</strong> a dispute. However, when<strong>the</strong> company that issues <strong>the</strong> stock optionis closely held, estimat<strong>in</strong>g <strong>the</strong> fourth andfifth items, stock price and stock volatility,require judgment by <strong>the</strong> analyst.<strong>Estimat<strong>in</strong>g</strong> <strong>the</strong> stock price of a closelyheld company is a complicated issue. Forpurposes of this discussion, we shall assumethat <strong>the</strong> stock price of <strong>the</strong> subjectclosely held company is known as of <strong>the</strong>option valuation date. Therefore, thisdiscussion focuses on <strong>the</strong> stock pricevolatility estimate <strong>in</strong> <strong>the</strong> BSM model.As stock price volatility <strong>in</strong>creases, <strong>the</strong>likelihood that a stock's performance willbe extreme (ei<strong>the</strong>r positive or negative)<strong>in</strong>creases. S<strong>in</strong>ce <strong>the</strong> employee owns a calloption, he or she would be expected tobenefit from price <strong>in</strong>creases, but would<strong>the</strong> value exam<strong>in</strong>erNovember/December 201113
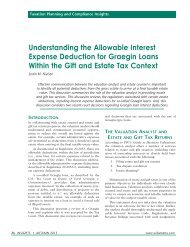
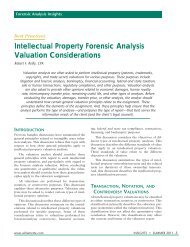
A PROFESSIONAL DEVELOPMENT JOURNAL for <strong>the</strong> CONSULTING DISCIPLINESTable 1: <strong>Stock</strong> Option Value Sensitivity to <strong>Volatility</strong>Option Characteristics<strong>Stock</strong> <strong>Price</strong> $10.00Exercise <strong>Price</strong> $12.00Risk-free Rate 0.30%Time To Expiration1 YearExpected <strong>Volatility</strong> 20% 30% 40% 50% 60% 70%Indicated <strong>Stock</strong> Option Value 0.22 0.55 0.93 1.32 1.72 2.12be protected from <strong>the</strong> downside risk thatcould o<strong>the</strong>rwise occur from hold<strong>in</strong>g <strong>the</strong>stock directly. This is because <strong>the</strong> employeehas noth<strong>in</strong>g to lose (assum<strong>in</strong>g no considerationwas exchanged for <strong>the</strong> option).Table 1 shows <strong>the</strong> sensitivity of a hypo<strong>the</strong>ticalstock option to changes <strong>in</strong><strong>the</strong> expected volatility of <strong>the</strong> stock price,us<strong>in</strong>g <strong>the</strong> BSM option pric<strong>in</strong>g model.As shown <strong>in</strong> Table 1, when expectedvolatility <strong>in</strong>creases from 30 to 40 percent,<strong>the</strong> <strong>in</strong>dicated stock option value<strong>in</strong>creases from $0.55 to $0.93, or by 69percent. As expected volatility <strong>in</strong>creases,<strong>in</strong>cremental volatility changes of 10 percenthave less of an effect on <strong>the</strong> <strong>in</strong>dicatedoption value. That is, an <strong>in</strong>crease <strong>in</strong>expected volatility from 20 to 30 percenthas a greater effect on <strong>the</strong> option valuethan an <strong>in</strong>crease <strong>in</strong> expected volatilityfrom 60 to 70 percent, all o<strong>the</strong>r factorsequal. The example <strong>in</strong> Table 1 illustrates<strong>the</strong> importance of <strong>the</strong> expected volatilityestimate <strong>in</strong> <strong>the</strong> BSM model.The volatility component of <strong>the</strong>BSM option pric<strong>in</strong>g model is a forward-look<strong>in</strong>gmeasure. The mostlogical start<strong>in</strong>g place to look for an estimateof future volatility is past volatility.1 Historical stock price volatility is1 Don M. Chance, Analysis of Derivatives for <strong>the</strong>CFA Program, Baltimore, MD, 2003, pg. 226.a function of <strong>the</strong> past variability <strong>in</strong> <strong>the</strong>returns on <strong>the</strong> stock as measured bychanges <strong>in</strong> <strong>the</strong> stock price. These historicaldata are generally available forpublicly traded companies. However,when valu<strong>in</strong>g <strong>the</strong> options of a closelyheld company, reliable historical pricestypically are not available.The rema<strong>in</strong>der of this article willpresent analytical procedures and o<strong>the</strong>rfactors that valuation analysts can considerto estimate <strong>the</strong> expected stockprice volatility for a closely held company.The analytical procedures and factorsdiscussed <strong>in</strong> this article are not <strong>in</strong>tendedto provide a set of rules that valuationanalysts must follow to estimate volatilityfor every closely held company. Determ<strong>in</strong><strong>in</strong>g<strong>the</strong> appropriate proceduresto estimate <strong>the</strong> expected stock pricevolatility for a closely held company (a)should be determ<strong>in</strong>ed on a case-by-casebasis and (b) requires substantial professionaljudgment.Valuators often estimate <strong>the</strong> expectedvolatility for a closely held company stockprice by analyz<strong>in</strong>g <strong>the</strong> volatility of reasonablycomparable publicly traded companies(PTCs). There are several ways toperform this type of guidel<strong>in</strong>e companyanalysis. I will present three methods toconduct a guidel<strong>in</strong>e PTC volatility analysis.The first procedure <strong>in</strong> any guidel<strong>in</strong>ecompany analysis is to select a groupof PTCs that are similar to <strong>the</strong> subjectcompany. A rule of thumb for <strong>the</strong> numberof guidel<strong>in</strong>e companies required fora mean<strong>in</strong>gful comparison is betweenthree and 10 companies. Of course, <strong>the</strong>comparability—<strong>in</strong> terms of l<strong>in</strong>e of bus<strong>in</strong>ess,size, geographic diversity, productl<strong>in</strong>e diversification, and o<strong>the</strong>r factors—of<strong>the</strong> selected guidel<strong>in</strong>e PTCs to<strong>the</strong> subject company affects how manyguidel<strong>in</strong>e PTCs are required for a mean<strong>in</strong>gfulcomparison.If <strong>the</strong> subject closely held companystock was appraised us<strong>in</strong>g a market approachvaluation method, <strong>the</strong> same companiesthat were used <strong>in</strong> <strong>the</strong> market approachvaluation method can be used as<strong>the</strong> guidel<strong>in</strong>e PTCs to estimate volatilityfor <strong>the</strong> stock of <strong>the</strong> subject company.After <strong>the</strong> valuation analyst selects agroup of guidel<strong>in</strong>e PTCs that are sufficientlycomparable to <strong>the</strong> subject company,<strong>the</strong> next step is to analyze <strong>the</strong> volatilityof <strong>the</strong>se companies.The first method of estimat<strong>in</strong>g volatilityis to review and analyze <strong>the</strong> volatilitythat each guidel<strong>in</strong>e PTC reports <strong>in</strong> its SECForm 10-K. Publicly traded companiesthat grant employees some form of sharebasedcompensation (e.g., stock appreciationrights) are required under ASC 718to measure <strong>the</strong> cost of all share-based paymentplans at fair value. The f<strong>in</strong>ancial statementfootnotes of PTCs that follow ASC718 typically <strong>in</strong>clude a description of how<strong>the</strong> fair value of <strong>the</strong> company’s share-basedcompensation was determ<strong>in</strong>ed. If <strong>the</strong> companyused <strong>the</strong> BSM option pric<strong>in</strong>g model,<strong>the</strong>n it would disclose <strong>the</strong> expected stockprice volatility. 22 It is important to reiterate that this discussionfocuses on estimat<strong>in</strong>g <strong>the</strong> fair market value of closelyheld company stock options; it is not <strong>in</strong>tended toprovide account<strong>in</strong>g or valuation advice for <strong>the</strong> valuationof stock options for f<strong>in</strong>ancial report<strong>in</strong>g purposes.14November/December 2011<strong>the</strong> value exam<strong>in</strong>er
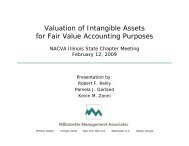
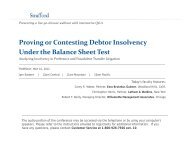
A PROFESSIONAL DEVELOPMENT JOURNAL for <strong>the</strong> CONSULTING DISCIPLINESThe methods that PTCs use to estimatevolatility vary from firm to firm.These estimates may be (a) forward-look<strong>in</strong>g,(b) based on historical trad<strong>in</strong>g prices,or (c) a comb<strong>in</strong>ation of those two factors.For example, <strong>the</strong> expected stockprice volatility estimated by CDI Corp.“is based on <strong>the</strong> historical volatility of<strong>the</strong> company’s common stock over <strong>the</strong>previous five years.” 3Conversely, Manpower estimatesexpected volatility, “us<strong>in</strong>g a weightedaverage of daily historical volatility(weighted 75 percent) of our stock priceover <strong>the</strong> past five years and impliedvolatility (weighted 25 percent) basedupon exchange traded options for ourcommon stock.” 4A second method to estimate expectedvolatility for a closely held companystock price is to calculate <strong>the</strong> actual historicalvolatility of <strong>the</strong> stock prices for<strong>the</strong> selected guidel<strong>in</strong>e PTCs. This volatilityis backward-look<strong>in</strong>g. Historical volatilitycan be estimated over any period<strong>the</strong> valuation analyst selects. It is oftenappropriate to calculate historical volatilitybased on <strong>the</strong> same term as <strong>the</strong> subjectstock option. That is, if <strong>the</strong> subjectstock option has two years to expiration,<strong>the</strong>n <strong>the</strong> valuator may want to calculatehistorical stock price volatility for <strong>the</strong> selectedguidel<strong>in</strong>e PTCs over <strong>the</strong> two yearsprior to <strong>the</strong> option valuation date.Representative results from <strong>the</strong> twocomparable company analyses discussedabove are presented <strong>in</strong> Table 2.This table shows <strong>the</strong> volatility analysisfor a subject company that providesstaff<strong>in</strong>g services to companies located<strong>in</strong> <strong>the</strong> western United States. Therefore,<strong>the</strong> selected guidel<strong>in</strong>e PTCs also providestaff<strong>in</strong>g services.3 CDI Corp., SEC Form 10-k for <strong>the</strong> fiscal yearended December 31, 2010, page 54.4 Manpower, Inc., annual report for <strong>the</strong> fiscal yearended December 31, 2010, page 57.A third method to analyze <strong>the</strong> expectedvolatility for a closely held companystock price is to analyze <strong>the</strong> impliedvolatility <strong>in</strong> <strong>the</strong> guidel<strong>in</strong>e PTCspublicly traded stock options.Us<strong>in</strong>g this method, <strong>the</strong> valuator canset <strong>the</strong> option price <strong>in</strong> <strong>the</strong> BSM optionpric<strong>in</strong>g model equal to <strong>the</strong> market priceof <strong>the</strong> publicly traded stock option andwork backwards to f<strong>in</strong>d <strong>the</strong> impliedvolatility. The implied volatility can beestimated this way because all o<strong>the</strong>r<strong>in</strong>puts required by <strong>the</strong> BSM optionpric<strong>in</strong>g model—<strong>in</strong>clud<strong>in</strong>g <strong>the</strong> optionvalue—are known. This implied volatilityrepresents <strong>the</strong> volatility that optiontraders are us<strong>in</strong>g to price <strong>the</strong> publiclytraded stock option. The process usedto <strong>in</strong>fer <strong>the</strong> implied volatility is an iterativeprocess that <strong>in</strong>volves trial and error.After (a) select<strong>in</strong>g guidel<strong>in</strong>e PTCs,(b) collect<strong>in</strong>g <strong>the</strong> self-reported stockprice volatility for <strong>the</strong> selected guidel<strong>in</strong>ePTCs, (c) calculat<strong>in</strong>g <strong>the</strong> historical stockprice volatility for <strong>the</strong> selected guidel<strong>in</strong>ePTCs, and (d) calculat<strong>in</strong>g <strong>the</strong> impliedvolatility of <strong>the</strong> guidel<strong>in</strong>e PTCs publiclytraded stock options (if available),<strong>the</strong> valuator has a reasonable basis forestimat<strong>in</strong>g a level of volatility that is appropriatefor <strong>the</strong> subject company andits underly<strong>in</strong>g stock and stock options.This is arguably <strong>the</strong> most important step<strong>in</strong> <strong>the</strong> comparable company analysis. Itis also <strong>the</strong> step that requires <strong>the</strong> mostjudgment on <strong>the</strong> part of <strong>the</strong> valuator.Factors to ConsiderThe factors <strong>in</strong> <strong>the</strong> follow<strong>in</strong>g list maybe considered by <strong>the</strong> valuation analystwhen estimat<strong>in</strong>g stock price volatilityfor a closely held company based onguidel<strong>in</strong>e PTC data. This list is not comprehensive,and not all of <strong>the</strong> factorslisted will apply <strong>in</strong> every engagement.You should use your professional judgmentto estimate stock price volatilityfor a closely held company when us<strong>in</strong>g<strong>the</strong> BSM option pric<strong>in</strong>g model.••If <strong>the</strong> subject company was previouslyappraised (e.g., if <strong>the</strong> subjectcompany had quarterly or annualvaluations prepared for ESOP adm<strong>in</strong>istrationpurposes), <strong>the</strong>n youcan compare <strong>the</strong> historical change<strong>in</strong> <strong>the</strong> company stock price with <strong>the</strong>historical change <strong>in</strong> <strong>the</strong> stock pricesof <strong>the</strong> selected guidel<strong>in</strong>e PTCs.••Analyze <strong>the</strong> range of guidel<strong>in</strong>e PTCstock price volatility. If <strong>the</strong>re are outliers,you may attempt to understandwhy a company has a particularly highor particularly low stock price volatilityrelative to <strong>the</strong> o<strong>the</strong>r guidel<strong>in</strong>e PTCs.••Review guidel<strong>in</strong>e PTC volatility fora period of five or 10 years prior to<strong>the</strong> valuation date. If <strong>the</strong>re was a significantchange (e.g., merger, significanttransaction, or restructur<strong>in</strong>g)regard<strong>in</strong>g a company, you may berequired to analyze <strong>the</strong> company or<strong>in</strong>dustry <strong>in</strong> greater depth to determ<strong>in</strong>ewhat caused <strong>the</strong> change.••Stratify <strong>the</strong> selected guidel<strong>in</strong>e PTCsto produce a smaller group of companiesthat is very similar to <strong>the</strong>subject company. For example, if <strong>the</strong>subject company operates conventionalgrocery stores, and <strong>the</strong> guidel<strong>in</strong>ePTCs operate both conventionaland “all natural” grocery stores, youmay want to analyze both (a) <strong>the</strong> entiregroup of guidel<strong>in</strong>e PTCs and (b)a subset of that group that only <strong>in</strong>cludesconventional grocers.••Analyze summary statistics from<strong>the</strong> reported volatilities. These summarystatistics may <strong>in</strong>clude <strong>the</strong> high,<strong>the</strong> low, <strong>the</strong> median, and <strong>the</strong> average.••Compare <strong>the</strong> guidel<strong>in</strong>e PTC historicalvolatility with <strong>the</strong> guidel<strong>in</strong>e<strong>the</strong> value exam<strong>in</strong>er November/December 201115
A PROFESSIONAL DEVELOPMENT JOURNAL for <strong>the</strong> CONSULTING DISCIPLINESTable 2: <strong>Black</strong>-<strong>Scholes</strong>-<strong>Merton</strong> Option Pric<strong>in</strong>g <strong>Model</strong>Self-Reported <strong>Stock</strong> <strong>Price</strong> <strong>Volatility</strong> for <strong>the</strong> Guidel<strong>in</strong>e Publicly Traded Companies (%)5-Year 10-Year <strong>Volatility</strong> [a]Company Name Mean Median Mean Median 2010 2009 2008 2007 2006 2005 2004 2003 2002 2001Barrett Bus<strong>in</strong>essServices60.7 61.5 59.8 60.0 58.8 61.9 61.5 NA NA 59.0 61.0 62.0 58.0 56.0CDI Corp. 44.3 40.5 40.5 37.5 52.5 55.5 40.5 36.0 37.0 35.0 34.0 38.0 36.0 40.0Hudson HighlandGroup57.7 58.0 62.1 59.0 NA NA 58.0 60.0 55.0 55.0 55.0 65.0 73.5 75.0Insperity NA NA 85.2 89.0 NA NA NA NA NA 89.0 90.0 92.0 86.0 69.0Kelly Services 21.3 21.3 28.5 30.0 NA NA NA NA 21.3 27.0 30.0 31.7 31.0 30.0Kforce 73.6 73.0 58.9 50.0 NA NA 75.4 73.0 72.5 50.0 50.0 50.0 50.0 50.0Manpower Group 34.0 30.0 33.9 34.9 41.0 42.0 30.0 27.0 30.0 30.0 39.8 40.1 40.9 17.7On Assignment 59.3 51.7 58.5 58.0 73.3 73.1 51.5 47.1 51.7 58.0 58.0 59.0 58.0 55.0Robert HalfInternational38.5 38.5 49.2 50.2 NA NA NA NA 38.5 47.1 49.4 50.9 55.5 54.0SFN Group 63.2 50.0 59.9 53.5 99.0 78.0 50.0 40.0 49.0 52.0 55.0 59.0 68.0 49.0TrueBlue 48.0 43.5 61.9 56.3 59.6 53.0 43.5 40.5 43.5 50.0 79.0 89.0 79.0 82.0MINIMUM 21.3 21.3 28.5 30.0MAXIMUM 73.6 73.0 85.2 89.0AVERAGE 48.9 45.2 53.8 51.8MEDIAN 48.0 43.5 58.7 51.8[a] Based on <strong>the</strong> implied and historical volatility of <strong>the</strong> company’s stock options, as provided <strong>in</strong> <strong>the</strong> company’s SEC Forms 10-K.PTC self-reported volatility (whichgenerally is a forward-look<strong>in</strong>g measure).You should seek to understandany material differences between <strong>the</strong>two measures.••Consider <strong>the</strong> strengths and weaknessesof <strong>the</strong> guidel<strong>in</strong>e PTC self-reportedvolatility. Strengths are: <strong>the</strong> measureis often forward-look<strong>in</strong>g, and it is estimatedspecifically for use <strong>in</strong> <strong>the</strong> BSMoption pric<strong>in</strong>g model. Weaknessesare: little detail is known about how<strong>the</strong> volatility was estimated, and it issubject to management judgment.••Consider <strong>the</strong> strengths and weaknessesof <strong>the</strong> guidel<strong>in</strong>e PTC historicalvolatility. Strengths are: thismeasure is objective and can becalculated for <strong>the</strong> same term as <strong>the</strong>subject option. The primary weaknessof this measure is that it isbackward-look<strong>in</strong>g.••You may consider <strong>the</strong> operationsand f<strong>in</strong>ancial situation of <strong>the</strong> subjectcompany and <strong>the</strong> selected guidel<strong>in</strong>ePTCs. For example, if <strong>the</strong> companiesoperate <strong>in</strong> different regions,have vary<strong>in</strong>g amounts of <strong>in</strong>tangibleassets, are capitalized with differentamounts of debt, or are disparate <strong>in</strong>16November/December 2011<strong>the</strong> value exam<strong>in</strong>er
A PROFESSIONAL DEVELOPMENT JOURNAL for <strong>the</strong> CONSULTING DISCIPLINESHistorical <strong>Stock</strong> <strong>Price</strong> <strong>Volatility</strong> Estimates for <strong>the</strong> Guidel<strong>in</strong>e Publicly Traded Companies (%)5-Year 10-Year Historical <strong>Volatility</strong> [b]Company Name Mean Median Mean Median 2010 2009 2008 2007 2006 2005 2004 2003 2002 2001Barrett Bus<strong>in</strong>essServices46.6 41.6 49.8 47.0 37.6 41.6 67.0 39.9 47.0 61.6 53.9 NA NA NACDI Corp. 58.7 48.8 48.2 44.2 48.8 75.5 80.7 40.1 48.2 26.7 35.9 31.4 39.4 55.0Hudson HighlandGroup79.2 66.3 73.3 66.3 60.3 115.1 98.9 55.4 66.3 84.9 32.2 NA NA NAInsperity 50.7 47.4 62.4 50.4 46.5 47.4 65.5 46.7 47.5 53.3 46.2 63.8 124.8 82.4Kelly Services 48.7 55.9 42.3 38.2 55.9 69.0 61.4 34.4 23.0 23.9 27.7 34.3 42.0 51.3Kforce 49.3 44.6 61.7 58.0 41.6 60.5 61.9 37.8 44.6 41.7 55.4 82.9 97.7 92.9Manpower Group 42.1 35.2 37.5 33.5 35.2 54.6 63.8 29.6 27.0 26.4 24.5 31.8 43.5 38.5On Assignment 64.7 50.7 62.6 54.8 50.7 103.4 74.2 48.8 46.4 48.5 50.6 59.0 79.1 65.5Robert HalfInternational39.5 32.3 40.4 36.4 32.3 48.3 55.1 31.0 30.6 33.5 32.3 39.4 49.3 52.4SFN Group 79.1 64.7 65.6 59.2 64.7 123.1 107.5 56.1 44.3 40.3 39.8 54.6 63.1 62.3TrueBlue 56.0 52.7 56.9 50.5 52.7 70.4 65.4 48.4 43.0 40.3 40.4 42.8 74.5 91.6MINIMUM 39.5 32.3 37.5 33.5MAXIMUM 79.2 66.3 73.3 66.3AVERAGE 56.8 49.9 55.1 49.2MEDIAN 53.3 49.8 59.3 50.5[b] Equals <strong>the</strong> one-year (260 trad<strong>in</strong>g days) historical volatility at calendar year-end, per Bloomberg.Sources: SEC Forms 10-K, Bloomberg, and Willamette Management Associates calculations.size, <strong>the</strong>n <strong>the</strong> stock price volatilityfor <strong>the</strong> guidel<strong>in</strong>e PTCs may be greaterthan or less than what is appropriatefor <strong>the</strong> subject stock option.The analyses listed above relate primarilyto comparisons between <strong>the</strong> subjectcompany and <strong>the</strong> selected guidel<strong>in</strong>ePTCs. However, <strong>the</strong> valuator shouldalso consider <strong>the</strong> subject company attributesthat make it unique. For starters,<strong>the</strong> company is a closely held company(and not a company whose shares arelisted on a national stock exchange orquoted on <strong>the</strong> NASDAQ).The fact that <strong>the</strong> company is closelyheld exerts both positive and negative<strong>in</strong>fluences when it comes to stock pricevolatility. On one hand, closely held companiesgenerally (although certa<strong>in</strong>ly notalways) are smaller, are less geographicallydiversified, are less vertically <strong>in</strong>tegrated,and have <strong>in</strong>ferior access to capital, comparedwith <strong>the</strong>ir publicly traded peers.These factors typically cause <strong>the</strong> requiredrate of return on an equity <strong>in</strong>vestment<strong>in</strong> a closely held company to begreater than <strong>the</strong> required rate of returnon an equity <strong>in</strong>vestment <strong>in</strong> a publiclytraded company. A greater cost of equi-<strong>the</strong> value exam<strong>in</strong>er November/December 201117
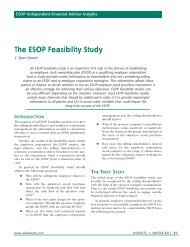
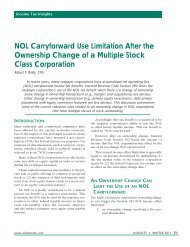
A PROFESSIONAL DEVELOPMENT JOURNAL for <strong>the</strong> CONSULTING DISCIPLINESTable 3: Daily Index Value ChangeDate (2011)Clos<strong>in</strong>g<strong>Price</strong>Dowty generally is characterized by greatervolatility of returns.To illustrate this po<strong>in</strong>t, let’s consider<strong>the</strong> volatility of two <strong>in</strong>vestments: onewith a low required rate of return (i.e.,long-term U.S. treasury bonds) and onewith a high required rate of return (i.e.,equity of a start-up biotech company).The volatility of returns for <strong>the</strong> start-upcompany typically will be greater thanvolatility of returns for <strong>the</strong> debt <strong>in</strong>vestment.That is, <strong>the</strong> <strong>in</strong>vestment with <strong>the</strong>higher required rate of return has <strong>the</strong>higher expected stock price volatility.Therefore, if (a) <strong>the</strong> required return onequity is greater for a closely held companythan its publicly traded peers, and(b) a higher required return on equityis associated with a higher expectedvolatility, <strong>the</strong>n <strong>the</strong> stock price volatilityof a closely held company generallyshould be higher than <strong>the</strong> stock pricevolatility of its publicly traded peers.However, <strong>the</strong>re are at least fourreasons why this may not necessarilybe true:••Closely held companies typicallyare owned by a small number ofshareholders.Daily Change(Percent)Staff<strong>in</strong>g Companies [a]Clos<strong>in</strong>g<strong>Price</strong>Daily Change(Percent)August 12 11,269.02 + 1.1 163.97 - 0.1August 11 11,143.31 + 3.9 164.20 + 5.7August 10 10,719.94 - 4.6 155.40 - 5.3August 9 11,239.77 + 3.7 164.12 + 5.0August 8 10,809.85 - 5.5 156.36 - 8.3August 5 11,444.61 170.46[a] Based on an <strong>in</strong>dex comprised of <strong>the</strong> selected guidel<strong>in</strong>e PTCs identified <strong>in</strong> Table 2.••Shares of closely held company stocktypically trade <strong>in</strong>frequently.••Closely held companies are not subjectto <strong>the</strong> same disclosure and report<strong>in</strong>grequirements as PTCs.••Publicly traded company stock pricesoften are affected by short termand macroeconomic factors thatgenerally do not exert <strong>the</strong> same levelof <strong>in</strong>fluence on <strong>the</strong> fair market valueof closely held company stock.Those four related factors cause <strong>the</strong>volatility of closely held companies tobe lower than <strong>the</strong> volatility of publiclytraded companies.To illustrate this po<strong>in</strong>t, consider <strong>the</strong>stock of a closely held staff<strong>in</strong>g company(ABC Co.) whose shares are owned by(a) <strong>the</strong> ABC founder and (2) <strong>the</strong> companyemployees through an ESOP. Let’sfur<strong>the</strong>r assume that ABC is appraisedannually for ESOP adm<strong>in</strong>istration purposes.In <strong>the</strong> annual ESOP appraisal ofABC, <strong>the</strong> valuator will consider, amongo<strong>the</strong>r factors:••The historical, recent, and projectedresults of ABC Co.••The state of <strong>the</strong> <strong>in</strong>dustry and <strong>the</strong>economy <strong>in</strong> which ABC operates••The prices of guidel<strong>in</strong>e PTCs••How <strong>the</strong> change <strong>in</strong> value from <strong>the</strong>last appraisal corresponds to <strong>the</strong>prior three factorsAs a sanity check on <strong>the</strong> annual stockprice change, <strong>the</strong> valuator may compare,for example, <strong>the</strong> annual percent change <strong>in</strong><strong>the</strong> ABC Co. share price with <strong>the</strong> percentchange <strong>in</strong> <strong>the</strong> ABC aggregate projectedcash flow. This comparison may <strong>in</strong>volve<strong>the</strong> values <strong>in</strong> <strong>the</strong> current appraisal and <strong>the</strong>values <strong>in</strong> <strong>the</strong> prior appraisal.Compare this to <strong>the</strong> factors that cause<strong>the</strong> share price of publicly traded companystock to change. The share price ofa PTC stock <strong>in</strong>creases or decreases basedon many of <strong>the</strong> same factors that cause <strong>the</strong>share price of closely held company stockto change. However, a PTC share pricealso is largely affected by macroeconomicnews, short-term factors, and <strong>the</strong> whimsof non-employee <strong>in</strong>vestors.Just look at <strong>the</strong> results dur<strong>in</strong>g <strong>the</strong>week end<strong>in</strong>g August 12, 2011, of (a) <strong>the</strong>Dow Jones Industrial Average <strong>in</strong>dex and(b) a staff<strong>in</strong>g company <strong>in</strong>dex that wascreated us<strong>in</strong>g <strong>the</strong> guidel<strong>in</strong>e PTCs identified<strong>in</strong> Table 2. The clos<strong>in</strong>g price of <strong>the</strong>Dow and a staff<strong>in</strong>g company <strong>in</strong>dex dur<strong>in</strong>gthat week is presented <strong>in</strong> Table 3.The change <strong>in</strong> Dow clos<strong>in</strong>g pricefrom August 5 to August 12 <strong>in</strong> Table 3was a 1.5 percent decrease. The absolutedaily change dur<strong>in</strong>g that period exceeded3 percent <strong>in</strong> four out of five days. Inone 15-m<strong>in</strong>ute period on August 11, <strong>the</strong>Dow decl<strong>in</strong>ed by 130 po<strong>in</strong>ts; on that day<strong>the</strong> Dow was up nearly 4 percent.Major news events around <strong>the</strong>sedates contributed to <strong>the</strong> <strong>in</strong>dex valuefluctuation: <strong>the</strong> U.S. economy rema<strong>in</strong>edweak and a recession was loom<strong>in</strong>g, U.S.debt had recently been downgraded, and<strong>the</strong> recent debt ceil<strong>in</strong>g fight was trouble-18November/December 2011<strong>the</strong> value exam<strong>in</strong>er
A PROFESSIONAL DEVELOPMENT JOURNAL for <strong>the</strong> CONSULTING DISCIPLINESsome to <strong>in</strong>vestors. These negative factorsexpla<strong>in</strong> why stock market <strong>in</strong>vestors werepessimistic and/or cautious, but <strong>the</strong>yalone do not expla<strong>in</strong> <strong>the</strong> significant volatilitythat occurred dur<strong>in</strong>g that week.Accord<strong>in</strong>g to Christopher Blum, <strong>the</strong>chief <strong>in</strong>vestment officer of <strong>the</strong> U.S. BehavioralF<strong>in</strong>ance Group at J.P. Morgan AssetManagement, “Markets have been absolutely<strong>in</strong> panic mode. Rumors were go<strong>in</strong>garound that were wildly fantastic, and <strong>the</strong>market sells off on it anyway—you can seehow irrational behavior is.” 5The same dramatic daily sw<strong>in</strong>gs thatoccurred <strong>in</strong> <strong>the</strong> Dow also occurred <strong>in</strong> astaff<strong>in</strong>g company <strong>in</strong>dex. The staff<strong>in</strong>g company<strong>in</strong>dex analyzed <strong>in</strong> Table 3 is based on<strong>the</strong> guidel<strong>in</strong>e PTCs identified <strong>in</strong> Table 2.As presented <strong>in</strong> Table 3, <strong>the</strong> daily <strong>in</strong>dexvalue change for staff<strong>in</strong>g companies wasgreater than or equal to 5 percent <strong>in</strong> fourof <strong>the</strong> five days reviewed.Let’s take a step back for a moment,consider <strong>the</strong> examples above, and makesome common-sense observations.First, <strong>the</strong> collective outlook regard<strong>in</strong>g<strong>the</strong> companies that comprise <strong>the</strong> Dow didnot decl<strong>in</strong>e 5.5 percent Monday, <strong>in</strong>crease3.7 percent Tuesday, decl<strong>in</strong>e 4.6 percentWednesday, and <strong>the</strong>n <strong>in</strong>crease 3.9 percenton Thursday. Nor did <strong>the</strong> staff<strong>in</strong>g companies’outlook change this dramaticallyfrom day to day. There were o<strong>the</strong>r factorsat play besides <strong>the</strong> chang<strong>in</strong>g outlook of <strong>the</strong><strong>in</strong>dividual companies that comprise <strong>the</strong><strong>in</strong>dexes listed on Table 3.Second, <strong>the</strong> share price of closely heldcompany stock, like that of <strong>the</strong> made-upABC Co., would probably not change <strong>the</strong>same way that <strong>the</strong> Dow or <strong>the</strong> staff<strong>in</strong>gcompany <strong>in</strong>dex changed between August5 and August 12, 2011.For example, assume that a hypo<strong>the</strong>ticalbuyer of ABC Co. equity had spent5 “Hitt<strong>in</strong>g <strong>the</strong> Panic Button,” Wall Street JournalMarketBeat, April 12, 2011, http://blogs.wsj.com/marketbeat/2011/08/12/hitt<strong>in</strong>g-<strong>the</strong>-panic-button/.months conduct<strong>in</strong>g due diligence on ABCand was ready to close <strong>the</strong> transaction <strong>in</strong>mid-August 2011. That hypo<strong>the</strong>tical buyerwould probably not be will<strong>in</strong>g to paymore for ABC if <strong>the</strong> transaction closedon ei<strong>the</strong>r August 9 or August 11 (dayswhen <strong>the</strong> stock market was up) than heor she would be will<strong>in</strong>g to pay on ei<strong>the</strong>rAugust 10 or August 12 (days <strong>the</strong> stockmarket was down). Instead, <strong>the</strong> purchaseprice would probably be fixed <strong>in</strong> <strong>the</strong> daysor even <strong>the</strong> weeks preced<strong>in</strong>g <strong>the</strong> clos<strong>in</strong>gof <strong>the</strong> transaction. The purchase price<strong>in</strong> this hypo<strong>the</strong>tical transaction may besubject to certa<strong>in</strong> clos<strong>in</strong>g adjustments.However, clos<strong>in</strong>g adjustments are typicallyrelated to <strong>the</strong> f<strong>in</strong>al target companyf<strong>in</strong>ancial statements, and not to regionalor national economic news. Put ano<strong>the</strong>rway, could a private equity buyer reallydemand a reduced price for closely heldcompany equity because (for example)<strong>the</strong> monthly hous<strong>in</strong>g starts failed to meetanalyst’s expectation?The above example is meant to expla<strong>in</strong>why a closely held company’s stockprice may not be affected by <strong>the</strong> sameshort-term, macroeconomic, or behavioralfactors (at least not to <strong>the</strong> same degree)that lead to significant volatility <strong>in</strong><strong>the</strong> stock of PTCs.These common-sense observationssuggest that <strong>the</strong> stock price of closely heldcompany shares should be less volatilethan PTC stock prices.To reiterate, a higher required rate ofreturn for closely held company equitycompared with PTC equity generally supportsa higher level of volatility for closelyheld company stock. Conversely, <strong>the</strong> additionalfactors that affect <strong>the</strong> share price ofPTC stock—which exert less immediateand less significant impact on closely heldcompany stock—supports a lower level ofvolatility for closely held company stockthan PTC stock.ConclusionAfter <strong>the</strong> valuator has analyzed <strong>the</strong>guidel<strong>in</strong>e PTC volatility and estimated<strong>in</strong>dustry volatility, how does <strong>the</strong> valuatorrelate this estimate to <strong>the</strong> subject closelyheld company for use <strong>in</strong> <strong>the</strong> BSM optionpric<strong>in</strong>g model? The answer is: it depends.It depends on <strong>the</strong> judgment of <strong>the</strong>analyst, <strong>the</strong> outlook for <strong>the</strong> subject company,and many o<strong>the</strong>r factors. If, for example,a subject company is a one-yearoldsoftware provider with no sales andrapid projected growth, <strong>the</strong>n <strong>the</strong> companystock price volatility may be greaterthan <strong>the</strong> selected guidel<strong>in</strong>e PTCs. If, on<strong>the</strong> o<strong>the</strong>r hand, <strong>the</strong> company is 50 yearsold and operates two dozen grocerystores, <strong>the</strong>n that company’s stock pricevolatility may be lower than <strong>the</strong> selectedguidel<strong>in</strong>e PTCs stock price volatility.The po<strong>in</strong>t of this discussion is not toprovide a roadmap or formula that youcan follow to estimate stock price volatilityfor closely held companies us<strong>in</strong>g<strong>the</strong> BSM option pric<strong>in</strong>g model. Instead,<strong>the</strong> po<strong>in</strong>t is to provide <strong>the</strong> reader with anumber of factors that can be consideredwhen mak<strong>in</strong>g <strong>the</strong> volatility estimate. Byconsider<strong>in</strong>g <strong>the</strong> factors presented above,you will reach a more supportable conclusionand produce a more supportablenarrative report.VEAaron M. Rotkowski,CFA, ASA, is a manager atWillamette ManagementAssociates, a valuationconsult<strong>in</strong>g, economicanalysis, and f<strong>in</strong>ancialadvisory services firm.He has over 10 yearsof valuation experience. His practicefocuses on forensic analysis and disputeresolution, bus<strong>in</strong>ess and stock valuations,and valuations for o<strong>the</strong>r purposes. E-mail:amrotkowski@willamette.com.<strong>the</strong> value exam<strong>in</strong>er November/December 201119