
Create successful ePaper yourself
Turn your PDF publications into a flip-book with our unique Google optimized e-Paper software.
TEMPERATE SoilS<br />
TRoPic SoilS<br />
BoREAl SoilS<br />
SuBTRoPicS SoilS<br />
PolAR SoilS<br />
leader to capture growth<br />
<strong>ANNUAL</strong><br />
<strong>REPORT</strong><br />
<strong>2007</strong><br />
Restoring<br />
nature’s<br />
balance
OPENING SECTION<br />
1 uralkali at a glance 4<br />
1.1 Assets 4<br />
1.2 operations 4<br />
2 From the chairman 5<br />
2.1 <strong>2007</strong> financial highlights 6<br />
2.2 <strong>2007</strong> macro highlights 6<br />
3 From the cEo 7<br />
MARKET SECTION<br />
1 What is potash 10<br />
2 Why is potash important to agriculture 10<br />
3 Why demand for potash is rising 10<br />
4 Why supply is currently limited 11<br />
5 Potash demand and supply imbalance 12<br />
6 Geographic market overview and outlook 13<br />
india 13<br />
china 14<br />
Brazil 15<br />
Southeast Asia 16<br />
Europe 16<br />
Russia 17<br />
uSA 17<br />
STRATEGY SECTION<br />
1 Pure potash player 20<br />
2 Focus on BRic markets 21<br />
3 ownership of the entire value chain 22<br />
4 Production today and tomorrow 23<br />
4.1 current production 23<br />
4.2 low cost producer 24<br />
4.3 capacity additions programme 24<br />
5 Distribution 25<br />
5.1 Baltic Bulk Terminal (BBT) 25<br />
5.2 Rail 25<br />
5.3 Warehousing 25<br />
FINANCIAL MANAGEMENT<br />
DISCUSSION AND ANALYSIS SECTION<br />
1 Gross sales 30<br />
1.1 Price increase 30<br />
1.2 Geography of sales 31<br />
2 Transportation 32<br />
2.1 Freight 32<br />
2.2 Railway tariff 32<br />
2.3 Transhipment 32<br />
3 Net sales 33<br />
4 cash cost of goods sold 33<br />
4.1 labour 33<br />
4.2 Energy 34<br />
4.2.1 Electricity 34<br />
OTHER SECTIONS<br />
iFRS consolidated Financial Statements<br />
and auditor’s report for the year<br />
ended December 31, <strong>2007</strong> 44<br />
Shareholder structure 94<br />
Dividends declared 94<br />
composition of the Board of Directors 95<br />
Mineral resources and ore reserves 96<br />
Risk factors 102<br />
uRAlkAli<br />
6 Trading and pricing 26<br />
6.1 Trading 26<br />
6.2 Pricing 26<br />
7 our people — a valuable resource 27<br />
8 Environment 27<br />
4.2.2 Gas 35<br />
4.3 Materials 35<br />
4.4 Transportation between mines 36<br />
5 General and administrative (G&A) expenses 36<br />
5.1 labour costs 36<br />
5.2 New post-employment benefit plans 36<br />
5.3 Expenses related to the share offering 37<br />
6 cost reduction programme 37<br />
6.1 Headcount reduction 37<br />
6.2 Power generation programme 37<br />
7 EBiTDA discussion 38<br />
8 Mine flooding costs 38<br />
coNTENT<br />
Annual report<br />
9 cAPEX 39<br />
9.1 ust-Yayvo — Mine-5 40<br />
10 cash flow 41<br />
11 Dividends 41
Annual report<br />
01<br />
uralkali at<br />
a glance<br />
<strong>Uralkali</strong> is a potash<br />
producer with leading<br />
market penetration in the<br />
major developing markets<br />
for fertiliser consumption.<br />
It is a low cost producer with<br />
access to a major global<br />
distribution platform<br />
1 iN MAY 2008, the shareholder structure of JSc<br />
«Belarusian Potash company» has changed and it’s currently as follows:<br />
JSc «uralkali» owns 50% of the BPc's ordinary shares;<br />
Republican unitary Enterprise «Po «Belaruskali» owns 45% of the<br />
BPc's ordinary shares; and<br />
State corporation «Belarusian Rail Road» owns 5% of the BPc's<br />
ordinary shares.<br />
<strong>2007</strong><br />
Opening<br />
section<br />
operations in Berezniki, Northern urals<br />
company has office in Moscow and<br />
port facilities in St. Petersburg<br />
Focuses on the production of potash<br />
fertiliser<br />
Founded in 1930 as a state-owned enterprise,<br />
privatised in 1992<br />
1.1 Assets<br />
2 cAlculATED AS THE ToTAl EXPoRT volume<br />
deliveries from Belaruskali and uralkali (including<br />
railway deliveries to china)<br />
oPENiNG SEcTioN<br />
2 mines and rights for an additional<br />
mine<br />
5 plants, 4 of which process potash<br />
and 1 which processes carnallite<br />
owner of Baltic Bulk Terminal, fully<br />
constructed in 2004<br />
Joint owner of the trading company<br />
Belarusian Potash company (BPc) 1 , the<br />
largest potash trading company in the<br />
world by volume, with 33% 2 of world export<br />
market<br />
1.2 operations<br />
<strong>2007</strong> potash production 5.1 million<br />
tonnes, or 10.5% 3 of world total<br />
Brownfield expansion to take potash<br />
production to 7 million tonnes by 2010<br />
Greenfield expansion to take potash<br />
production to up to 11 million tonnes<br />
Produces two potassium based fertiliser<br />
products — Granular and Standard<br />
Exports about 90% of total output,<br />
principally to china, Brazil, Southeast Asia<br />
and india<br />
Russian sales account for 10% of<br />
output<br />
uralkali is a potash producer with leading<br />
market penetration in the major developing<br />
markets for fertiliser consumption. its<br />
reserves are located in the Verkhnekamskoe<br />
Deposit, the second-largest known<br />
potash deposit in the world. it is a low cost<br />
producer with access to a major global<br />
distribution platform.<br />
3 FERTEcoN<br />
4
02<br />
From the chairman<br />
Restoring nature’s balance<br />
uRAlkAli<br />
Dmitry rybolovlev,<br />
Chairman of the board of Directors<br />
i would like to extend a warm welcome<br />
to all shareholders in uralkali. You have<br />
invested in the largest publicly-traded<br />
company to focus purely on potash, and<br />
one of the fastest-growing companies<br />
in that industry. i trust we have already<br />
demonstrated what an excellent investment<br />
opportunity uralkali is. i have been<br />
in the potash industry for over a decade<br />
and possess a strong personal belief in<br />
the industry and a solid commitment to<br />
it. i am excited by the prospects.<br />
The past year, <strong>2007</strong>, was a very important<br />
year in our industry. We are now in a<br />
position very different from the historical<br />
situation of steady supply, at what i would<br />
call the dawn of a new era in potash. We<br />
are at the beginning of a long-term and<br />
sustainable growth trend based on the<br />
continuing rise in world population and<br />
incomes. There are actual and predicted<br />
increases in demand for potash, which<br />
show no signs of abating.<br />
This bodes well for companies in the potash<br />
industry which have the plans or the<br />
means to increase their capacity. uralkali is<br />
one such company. if <strong>2007</strong> was an important<br />
year for the industry in general, it was<br />
a special one for uralkali. We successfully<br />
offered a shareholding on the london<br />
Annual report<br />
I have been in the potash industry<br />
for over a decade and<br />
possess a strong personal<br />
belief in the industry and a<br />
solid commitment to it. I am<br />
excited by the prospects<br />
Stock Exchange, and now the world’s best<br />
and most renowned investors have an interest<br />
in our business. We are delighted<br />
to share with them the advantages of this<br />
financially attractive industry, and of this<br />
unique company, which i believe is now<br />
positioned to realise its true potential.<br />
5
1 HERE AND FuRTHER<br />
in the text — all<br />
financial indicators are<br />
calculated in million<br />
RuR based on iFRS<br />
consolidated Financial<br />
Statements unless<br />
otherwise stated<br />
Annual report<br />
2.1<br />
<strong>2007</strong> financial<br />
highlights 1<br />
<strong>2007</strong><br />
Production 5.1 Mt<br />
Net Sales 2 22.673<br />
EBiTDA 3 12.098<br />
Margin 4 53%<br />
Net Profit 8.045<br />
operating cash Flow 8.195<br />
capex 6.316<br />
2.2<br />
<strong>2007</strong> macro<br />
highlights 5<br />
CPI (Dec’07 to Dec’06) 11.9%<br />
PPi (Dec’07 to Dec’06) 10.3% 6<br />
RuR/uS$ (<strong>2007</strong> average) 25.57<br />
RuR/uS$ (<strong>2007</strong> year-end) 24.55<br />
2 BASED oN ADJuSTED<br />
sales (sales net of freight,<br />
railway tariff and transhipment<br />
costs)<br />
uralkali demonstrates the best financial<br />
performance in the industry in all traditional<br />
financial measurements. The most<br />
important are the lowest cost of goods and<br />
highest EBiTDA margin. These reflect our<br />
competitive advantage of being a Russian<br />
company with access to affordable labour<br />
and energy, as well as geographic proximity<br />
to the main markets. We believe these<br />
competitive advantages are sustainable.<br />
Production volume increased in <strong>2007</strong><br />
by 21%, net sales increased by 36%,<br />
EBiTDA by 42%.<br />
3 ADJuSTED EBiTDA<br />
does not include mine<br />
flooding costs<br />
4 ADJuSTED EBiTDA<br />
MARGiN is calculated<br />
as Adj. EBiTDA divided<br />
by Net Sales<br />
oPENiNG SEcTioN<br />
While <strong>2007</strong> was a great year, we believe<br />
2008 will be better, as we maintain control<br />
over costs and we expect <strong>2007</strong> price<br />
increases to remain in full, with further<br />
price increases in 2008. in fact we believe<br />
the weighted average price for 2008 will<br />
more than double from the <strong>2007</strong> figure.<br />
in addition, in 2008 we have a bigger<br />
exposure to the spot markets, which is<br />
more attractive for us in the environment<br />
of rising prices, as these will go directly<br />
to the bottom line. Therefore we expect<br />
our EBiTDA margin to rise even higher in<br />
2008.<br />
5 FEDERAl STATE<br />
STATiSTicS SERVicE<br />
statistical review on<br />
social and economic<br />
situation in Russian<br />
Federation for <strong>2007</strong><br />
6 FoR MiNiNG<br />
iNDuSTRY (except<br />
of energy producting<br />
materials)<br />
6
Restoring nature’s balance<br />
uRAlkAli<br />
vlaDislav baumgertner<br />
Ceo<br />
03<br />
From the cEo<br />
Both the potash industry as a whole, and<br />
uralkali as part of it, share underlying fundamental<br />
strengths which this report will<br />
describe in detail. Put simply, the world<br />
needs more food and is choosing better<br />
food. Farmers are seeking to maximise<br />
the productivity of their land by replenishing<br />
or maintaining the nutrient content<br />
of the soil. Therefore they require more<br />
fertiliser, particularly potash. The reasoning<br />
behind this sequence of behaviour will<br />
not change in the near future.<br />
Yet potash suppliers are stretched to their<br />
production limits, and any surplus capacity<br />
will be quickly absorbed by the growing<br />
demand. The shortfall in supply cannot<br />
immediately be rectified. New mines<br />
are extremely costly and take over seven<br />
years to begin production. Therefore the<br />
potash industry is now driven by demand,<br />
which is a major transformation. Not only<br />
has this led to spectacular price rises, but it<br />
has also created an outstanding opportunity<br />
for those companies who can expand<br />
capacity to meet the shortfall.<br />
in this report we explain how uralkali is<br />
well positioned to capitalise on this scenario<br />
and has established a platform for<br />
sustainable growth. We are able to add<br />
significant annual capacity — two million<br />
In this report we are<br />
presenting excellent news<br />
for our new shareholders,<br />
and I share completely the<br />
optimism of our Chairman.<br />
We have set out our<br />
promises, and I accept the<br />
responsibility of achieving<br />
them on your behalf<br />
Annual report<br />
tonnes over the next three years — on the<br />
cheapest basis in the industry. in addition,<br />
our new mine, due to offer an additional<br />
annual capacity of almost four million<br />
tonnes, is also significantly cheaper per<br />
tonne added than the average greenfield<br />
project in our industry. We also control<br />
the whole value chain from our mines to<br />
the end customer, delivering our products<br />
more cheaply and quickly than other suppliers.<br />
on top of all this, we have unrivalled<br />
access to the fast-growing markets<br />
of Brazil, Russia, india and china, who<br />
will account for approximately 80% of<br />
the growth in the market over the coming<br />
five years.<br />
For these reasons i believe that in this report<br />
we are presenting excellent news for<br />
our new shareholders, and i share completely<br />
the optimism of our chairman. We<br />
have set out our promises, and i accept<br />
the responsibility of achieving them on<br />
your behalf.<br />
7
Annual report<br />
Sunflower:<br />
729 kt<br />
compensation<br />
K 2 O<br />
<strong>2007</strong><br />
8<br />
Temperate soils<br />
restoring nature’s balance<br />
UrAlkAli<br />
USA<br />
Russia<br />
Brazil<br />
Europe<br />
China<br />
Temperate<br />
soil facts<br />
21.9 mln. sq. km or<br />
16.4%of world total<br />
area<br />
66.3% reclamation<br />
45%world cultivated<br />
area<br />
Temperate soils — 45% world<br />
cultivated area.<br />
The thermal conditions allow<br />
only one harvest a year. Wheat,<br />
barley, soybean, sugar beet,<br />
sunflower, corn are the major<br />
crops.<br />
Typical soils: brown forests,<br />
chestnut soils, gray-brown<br />
soils.<br />
Typical Uptake K 2 O kg World Annual K 2 O<br />
crops per 1 t of product production, Mt compensation, t<br />
Barley 8 132 1,056,000<br />
Soybean 20 220 4,400,000<br />
Sunflower 27 27 729,000<br />
1 t К 2 О (nutrient) is equal<br />
to around 1.67 t kCl (product)<br />
Annual report<br />
9
Annual report<br />
01<br />
What is potash<br />
02<br />
Why is potash<br />
important to<br />
agriculture<br />
03<br />
Why demand for<br />
potash is rising<br />
<strong>2007</strong><br />
Market<br />
section<br />
Potash is mined from deposits that were<br />
formed when ancient oceans evaporated.<br />
Potash, along with nitrogen and phosphorus,<br />
plays an important role in agriculture,<br />
where approximately 95% of world potash<br />
production is used as fertiliser, replenishing<br />
the natural nutrients lost through<br />
continued farming.<br />
Potassium is found in every cell of<br />
plants and animals and is essential for<br />
their growth.<br />
Nearly every aspect of plant development,<br />
yield and quality depends on having<br />
adequate potash, including water retention,<br />
strong stalks, resistance to disease,<br />
suitability for transportation, nutritional<br />
value — and even taste.<br />
There is no substitute — the functions<br />
potash performs cannot be carried out by<br />
other nutrients.<br />
Potash helps improve the efficiency of<br />
other nutrients.<br />
The above factors all hold true for<br />
GMo plants, which need potassium just<br />
as much. Since potassium regulates plant<br />
water content, it is especially important<br />
for drought-resistant GMo crops.<br />
There will always be a need for food. So<br />
the increasing world population, shrinking<br />
arable land and changing diets will all<br />
put pressure on agricultural yield performance.<br />
This, and higher crop prices, motivate<br />
farmers to maximise production and<br />
purchase fertilisers. Therefore there is an<br />
unmistakeable long-term trend of growing<br />
demand for potash, which is likely to<br />
increase still further.<br />
Potash Is an essentIal<br />
soIl nUtrIent<br />
Plant growth requireS<br />
PotaSh<br />
MARkET SEcTioN<br />
once soil is used for agriculture,<br />
the balance of its<br />
nutritional content is changed<br />
drastically, especially if it is intensively<br />
farmed. quite simply,<br />
agriculture upsets the balance<br />
of the natural ecosystem and<br />
depletes the soil of nutrients<br />
essential to plant growth by far<br />
more than are returned to the<br />
soil naturally.<br />
with each harvest the soil<br />
loses about 60 – 70% of its<br />
nutritional elements. the<br />
effect of average harvests<br />
on different soils are varied,<br />
and nutrients are depleted in<br />
varying amounts: for nitrogen,<br />
from 65 to 285 kilograms per<br />
hectare; phosphorus, 26 to<br />
67 kg/ha; and potassium,<br />
45 to 235 kg/ha.<br />
to preserve the soil’s fertility,<br />
farmers should compensate<br />
for the loss of the nutrients<br />
by applying at least the same<br />
amount back to the soil. normally<br />
farmers apply nitrogen<br />
as a first choice as it facili-<br />
10
tates quick growth, whereas<br />
they use potash last, often at<br />
the minimum required level.<br />
Consequently, farmers are not<br />
able to cut significantly the application<br />
of potash.<br />
therefore the current level<br />
of potash consumption can<br />
be viewed as an absolute<br />
minimum, which cannot be<br />
reduced.<br />
Restoring nature’s balance<br />
uRAlkAli<br />
The potash sector — the global market<br />
in which uralkali operates<br />
04<br />
Why supply is<br />
currently limited<br />
1 EcoNoMiST<br />
intelligence unit data<br />
World population — this has risen from<br />
2.5 billion people to 6.6 billion people<br />
since 1950, and is expected to continue<br />
growing by approximately 75 million<br />
people a year, mostly in Asia and Africa 1 .<br />
Arable land — the population growth<br />
and increasing urbanisation is decreasing<br />
the available land for agriculture per head<br />
of population.<br />
income growth — rising incomes in<br />
developing regions are creating a switch<br />
to higher meat consumption. More grain<br />
will be required as feed for livestock.<br />
Potential new sources of demand<br />
— while the impact is hard to predict<br />
at present, increasing demand for<br />
biofuels will add to demand for potash.<br />
There are only a small number of potash<br />
mining, production and trading companies,<br />
and deposits are scarce. These facts,<br />
along with high barriers to entry of the<br />
industry, combine to create a quantifiable<br />
and limited current supply of potash.<br />
Highly concentrated industry — the<br />
top seven producers account for 85% of<br />
global production capacity.<br />
Deposits are scarce — only 12 countries<br />
produce potash 2 , whereas it is used in<br />
2 FERTEcoN<br />
3 FERTEcoN<br />
Annual report<br />
Production of biofuels has been growing<br />
at record rates, and the crops used in their<br />
production are the most potash-intensive<br />
crops.<br />
Scientific recommendations — in some<br />
regions fertilisers have been historically<br />
under-utilised when compared to scientific<br />
recommendation, and farmers need<br />
to redress the balance to improve yields. if<br />
potash was consumed an optimal recommended<br />
level (NPk ratio of approximately<br />
2 : 1 : 1), world demand would increase<br />
40% from the current level. Regionally,<br />
this projected increase in demand would<br />
be 43% in china, 75% in Brazil, 80% in<br />
india and 200% in Russia 3 .<br />
over 160 countries. Almost 70% of proven<br />
resources are in Russia and canada 4 .<br />
Barriers to entry — industry calculations<br />
estimate that to add a new ‘greenfield’<br />
capacity of 2 million tonnes would<br />
take uS$ 2.5 billion of investment and<br />
would take seven to ten years to begin<br />
production and cash generation.<br />
4 ERcoSPlAN, iFA, FERTcoN, cRu, uSGS<br />
and canadian GS, 2008<br />
11
Annual report<br />
05<br />
Potash demand and<br />
supply imbalance<br />
there is a limited availability<br />
of immediate supply,<br />
balanced by prices more<br />
than doubling in many<br />
markets in <strong>2007</strong>. a similar<br />
situation is envisaged for<br />
2008<br />
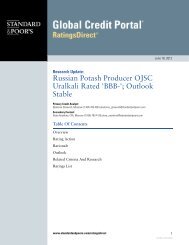
Evolution of potash prices<br />
Source: FERTECON<br />
uS$/t<br />
400<br />
350<br />
300<br />
250<br />
200<br />
150<br />
100<br />
50<br />
Further tightening<br />
of the market in 2008<br />
Deficit of product<br />
on major market in <strong>2007</strong><br />
First signs of shortage<br />
of product in 2004<br />
Soviet union collapse<br />
FoB Vancouver<br />
FoB Baltic<br />
<strong>2007</strong><br />
increases in demand and limitations to<br />
supply have led to growing prices, and<br />
a mismatch between demand and supply.<br />
Thus, the potash industry is in good<br />
shape. The shortfall in supply will be<br />
met by those producers who can readily<br />
extend their production capacity, and<br />
these will be able to increase their market<br />
share.<br />
imbalance — global incremental demand<br />
will increase by approximately 10 million<br />
tonnes over the next five years. This is a<br />
conservative estimate based on both independent<br />
figures, and those of our trader,<br />
BPc. During the same period, based on<br />
all the publicly announced capacity additions<br />
by existing players expanding their<br />
facilities, global production will increase<br />
by 8.7 million tonnes. No newcomers<br />
93 94 95 96 97 98 99 00 01 02 03 04 05 06 07 08<br />
MARkET SEcTioN<br />
to the industry are expected due to the<br />
long lead times. Therefore, this suggests<br />
an imbalance of over 1.2 million tonnes<br />
by 2012, which can be met only by price<br />
rises.<br />
Price evolution — product shortage has<br />
also led to growth in prices. Following the<br />
collapse of the Soviet union, former Soviet<br />
producers switched focus from local to<br />
export markets and there was a period of<br />
stable prices as the market absorbed these<br />
extra volumes. By 2004 there was a deficit<br />
in major markets and prices doubled.<br />
Again now there is a limited availability<br />
of immediate supply, balanced by prices<br />
more than doubling in many markets in<br />
<strong>2007</strong>. A similar situation is envisaged for<br />
2008 .<br />
12
06<br />
Geographic market<br />
overview and outlook<br />
Restoring nature’s balance<br />
India<br />
market size: 4.5 mt KCl 1<br />
share of world<br />
potash market: 8.1% 1<br />
uralkali sales in <strong>2007</strong>: 0.4 mt KCl<br />
2008 demand growth: 7.5% 1<br />
Population growth: 14.6%<br />
(<strong>2007</strong>—2018) 2<br />
1 FERTEcoN<br />
uRAlkAli<br />
Seven countries or regions can be said to<br />
make up the prime demand for potash.<br />
Here we summarise the factors driving<br />
potash demand in each market, and future<br />
trends. it is worth noting the importance<br />
of the BRic (Brazil, Russia, india, china)<br />
countries, which in <strong>2007</strong> accounted for<br />
approximately 47% 1 of potash demand.<br />
india’s economy is growing at a steady and sustainable pace, and it is politically stable.<br />
Already close to 1.1 billion, india’s population represents 17.5% of the world’s population,<br />
in only 2.4% of the world’s landmass. The population continues to rise and is expected to<br />
overtake china’s by 2030. This is creating demand for more food. coupled with this, the<br />
higher spending power of the emerging middle class — estimated at 50 – 60 million people<br />
but expected to reach 583 million by 2025 — is creating demand for a more diverse diet.<br />
india clearly needs to maximise its agricultural yield 3 .<br />
Traditionally, use of fertilisers has been low. This has affected the nutrient composition of<br />
much of the land, and agricultural growth has suffered. india is now responding to this by<br />
investing in more mechanised, advanced agriculture practices, and better use of fertilisers<br />
— though there is no local production of MoP and no known reserves. Agriculture<br />
sector growth is expected to rise to 4 – 5% in the coming years 4 and there is unused agricultural<br />
land available. More organised retail networks indicates better returns for farmers,<br />
thus more potential to invest in fertilisers. Some of india’s more arid land is now also being<br />
used for potash-dependent biofuel plantations.<br />
2 EcoNoMiST<br />
intelligence<br />
unit data<br />
1t k2o (nutrient)<br />
is equal to around<br />
1.67t kcl (product)<br />
3 Mc kiNSEY REPoRT:<br />
Next big spenders:<br />
india’s middle class<br />
Annual report<br />
K2O<br />
Cotton — K o uptake or<br />
2<br />
removal is 10 kg per tonne<br />
of product, world annual<br />
production is 119 Mt, therefore<br />
annual compensation<br />
required 1,190,000 tonnes<br />
of K o. 2<br />
Cultivate actively: India, Usa,<br />
Brazil.<br />
These four countries together make up<br />
half the world’s population. Their economies<br />
account for approximately 32% of<br />
global GDP and are expected to grow<br />
at an average of 8 – 9% over the period<br />
<strong>2007</strong>— 2010.<br />
4 FERTiliSER<br />
Association of india<br />
13
Annual report<br />
1 FERTEcoN<br />
China<br />
market size: 11.7 mt KCl 1<br />
share of world potash<br />
market: 21.4% 1<br />
uralkali sales in <strong>2007</strong>: 2.0 mt KCl<br />
Population growth: 6% in <strong>2007</strong> 2<br />
2 EcoNoMiST<br />
intelligence<br />
unit data<br />
<strong>2007</strong><br />
1t k2o (nutrient)<br />
is equal to around<br />
1.67t kcl (product)<br />
3 AccoRDiNG<br />
To MiNiSTRY<br />
of land and Resources<br />
of china<br />
K2O<br />
rice — K o uptake or<br />
2<br />
removal 3.2 kg per tonne of<br />
product, world annual production<br />
420 Mt, therefore<br />
annual compensation required<br />
1,344,000 tonnes<br />
of K o. 2<br />
Cultivate actively: Vietnam,<br />
China, India.<br />
china has the world’s largest population, at 1.3 billion 3 and, like<br />
india, its population is rising. Similarly, rising incomes are increasing<br />
the demand for different foods, especially meat, fruit and<br />
vegetables. At the same time, the amount of available arable land<br />
in china has been shrinking, largely due to increasing urbanisation,<br />
but also due to reforestation in support of eco-systems. in<br />
order to feed the population, the Government has taken steps to<br />
decrease the speed of shrinking by rigidly protecting arable land.<br />
it vows to preserve a minimum limit of 120 million hectares of<br />
arable land, a target which it is unlikely to alter before 2020 unless<br />
grain yields can be altered dramatically 4 .<br />
For years, china has under-utilised potash, but the need for balanced<br />
fertilisation is now better understood. Biofuel production is<br />
also driving fertiliser demand — china has currently devoted four<br />
million hectares to growing oil-bearing trees, with an expected<br />
fruit output of four million tons. With the right fertilisation, 57<br />
million hectares, of what is now underdeveloped wilderness,<br />
could be used in this way. in <strong>2007</strong> increased agricultural commodities<br />
prices prompted a number of Government measures<br />
to encourage domestic grain production — such as cancelled<br />
agricultural taxes, greater Government purchases, and subsidies<br />
and allowances for transport, seed, machinery and fertiliser<br />
purchase.<br />
4 STATE FoRESTRY<br />
ADMiNiSTRATioN<br />
MARkET SEcTioN<br />
14
Restoring nature’s balance<br />
uRAlkAli<br />
Brazil<br />
market size: 7.1 mt KCl 5<br />
share of world potash<br />
market: 12.7 % 5<br />
uralkali sales in <strong>2007</strong>: 1.0 mt KCl<br />
2008 demand growth: 13.8% 5<br />
Population growth: 13.5%<br />
(<strong>2007</strong>—2018) 6<br />
5 FERTEcoN<br />
6 EcoNoMiST<br />
intelligence<br />
unit data<br />
1t k2o (nutrient)<br />
is equal to around<br />
1.67t kcl (product)<br />
Another big producer of crops, Brazil exports much of its produce<br />
to Europe, the uS, and in more recent years, to china. Thanks to<br />
lower production costs, readily available land, labour and water,<br />
and advanced farming techniques, Brazil has become the world’s<br />
largest exporter of many products including sugar, coffee, beef,<br />
poultry and orange juice. Brazil looks set to consolidate these<br />
positions, as with 60 million hectares under cultivation, it also<br />
has the potential of a further 300 million hectares available to<br />
be cultivated 7 .<br />
Сrop prices are rising, and with the growth in world population<br />
predictions, Brazil, as the country best placed to supply the necessary<br />
food, is in a favourable situation for agribusiness, which<br />
is already modern, efficient and profitable. This is also the case<br />
with biofuel production. Brazil is a leading producer and exporter<br />
of soybeans, an essential raw material for biodiesel production,<br />
and one of the most potash-intensive crops. Brazil is also one of<br />
the world’s most efficient producers of ethanol. As many key<br />
growing areas in Brazil are potassium deficient, using potash will<br />
be key to maximising agricultural production.<br />
7 FooD AND AGRiculTuRE<br />
organization of united Nations (FAo)<br />
K2O<br />
sugar cane — K o uptake or<br />
2<br />
removal 1.32 kg per tonne<br />
of product, world annual<br />
production 1,324 Mt, therefore<br />
annual compensation<br />
required 1,747,680 tonnes<br />
of K o. 2<br />
Cultivate actively: India,<br />
Brazil.<br />
Annual report<br />
15
1 FERTEcoN<br />
Annual report<br />
Southeast Asia<br />
market size: 4.6 mt KCl 1<br />
share of world potash market: 9% 1<br />
uralkali sales in <strong>2007</strong>: 0.6 mt KCl<br />
2008 demand growth: 3.4% 1<br />
Population growth:<br />
varies from 12% —21%<br />
(<strong>2007</strong>—2018) in major<br />
countries of the region 2<br />
Europe<br />
market size: 7.4 mt KCl 3<br />
share of world<br />
potash market: 13.5% 3<br />
uralkali sales in <strong>2007</strong>: 0.4 mt KCl<br />
2008 demand<br />
growth: 3% 3<br />
Population growth: 1.2% 4<br />
2 EcoNoMiST<br />
intelligence<br />
unit data<br />
3 FERTEcoN<br />
<strong>2007</strong><br />
1t k2o (nutrient)<br />
is equal to around<br />
1.67t kcl (product)<br />
As the economy strengthens in many Southeast Asian countries,<br />
maximising crop yields has become essential to meet the<br />
growing food demand. Biofuel production is also big business in<br />
this part of the world. indonesia has now overtaken Malaysia to<br />
become the world’s leading producer of palm oil, which is very<br />
potash-intensive. The indonesian and Malaysian governments<br />
have policies in place to ensure that biofuels for transport use<br />
include a component of crude palm oil. The growing demand<br />
for green fuels in Europe is also driving palm oil production in<br />
this region.<br />
Severe droughts, followed by heavy rainfall, affected crop yields<br />
in much of Europe in <strong>2007</strong>. That, together with the increasing<br />
demand for cereals as raw materials for biofuels (and Eu targets<br />
for biofuels in transportation), has boosted crop prices, making<br />
the need to maximise yields even greater. There is also no longer<br />
a requirement in Europe that a certain ratio of land is agricultural,<br />
so the amount of available space for growing crops could<br />
be declining. Given all these factors, the use of fertilisers is rising,<br />
particularly in Eastern and central Europe, and the former Soviet<br />
union countries where there are increased investments and subsidies<br />
for agriculture. Poland, for example, imported 20% more<br />
potash in <strong>2007</strong> than it had in the previous year 5 .<br />
4 EcoNoMiST<br />
intelligence<br />
unit data<br />
5 iFA STATiSTicS<br />
and Eurostat<br />
MARkET SEcTioN<br />
K2O<br />
Palm oil — K o uptake or<br />
2<br />
removal is 13.2 kg per tonne<br />
of product, world annual<br />
production is 40,6 Mt, therefore<br />
annual compensation<br />
required 535,920 tonnes<br />
of K o. 2<br />
Cultivate actively: Malaysia,<br />
Indonesia.<br />
16
6 uRAlkAli<br />
Restoring nature’s balance<br />
uRAlkAli<br />
Russia<br />
market size: 1.4 mt KCl 6<br />
share of world<br />
potash market: 2.5% 7<br />
uralkali sales in <strong>2007</strong>: 0.5 mt KCl<br />
2008 demand growth: 13.3% 8<br />
7 uRAlkAli,<br />
FERTEcoN<br />
USA<br />
market size: 9.8 mt KCl 9<br />
share of world<br />
potash market: 17.8% 9<br />
2008 demand growth: 4% 9<br />
Population growth: 9.9%<br />
(<strong>2007</strong>—2018) 10<br />
8 FERTEcoN<br />
1t k2o (nutrient)<br />
is equal to around<br />
1.67t kcl (product)<br />
With a strengthening economy, Russia’s agricultural sector is<br />
growing. The country has 160 million hectares available to be<br />
cultivated, second only to Brazil in this resource. So, as well as<br />
producing a large proportion of the world’s potash, much of<br />
which is exported worldwide, Russia also uses potash domestically<br />
— particularly as a raw material in the production of compound<br />
fertilisers, but also with applications in oil production.<br />
over the next few years, the Russian Government will be partially<br />
subsidising the purchase of agricultural fertilisers with plans<br />
to spend around 2.2 billion roubles in 2008 alone. it is expected<br />
overall fertiliser consumption will increase by 190 thousand<br />
tonnes in 2008 11 .<br />
Much of the world’s food is grown in the united States, with<br />
around 40 percent of the global trade in wheat, corn, soybeans and<br />
cotton originating from there. As one of the world’s most proficient<br />
agricultural producers, the critical role of efficient fertilisation is well<br />
understood. crop stocks are on the decline due to competition for<br />
acreage between crops, and the weakened dollar stimulating exports.<br />
Prices are rising as a result of this and the tight demand/<br />
supply balance, and the trend is forecast to continue.<br />
The mounting priority to produce renewable energy is also increasing<br />
demand for corn and soybeans for ethanol and biodiesel<br />
respectively, and therefore greater fertiliser application, as well as<br />
price rises for these crops and competing crops such as cotton and<br />
wheat. So while North America provides lower growth than some<br />
other export markets, it still offers significant opportunities for fertiliser<br />
sales.<br />
9 FERTEcoN<br />
10 EcoNoMiST<br />
intelligence<br />
unit data<br />
11 RuSSiAN<br />
Ministry for<br />
Agriculture<br />
Annual report<br />
K2O<br />
Corn — K o uptake or remov-<br />
2<br />
al 4 kg per tonne of product,<br />
world annual production<br />
766 Mt, therefore annual<br />
compensation required<br />
3,064,000 tonnes of K o. 2<br />
Cultivate actively: Usa,<br />
China, Brazil, India.<br />
17
Annual report<br />
Coffee:<br />
162.8 kt<br />
compensation<br />
K 2 O<br />
<strong>2007</strong><br />
18<br />
Tropic soils<br />
South-East<br />
Asia<br />
Brazil<br />
Argentina<br />
restoring nature’s balance<br />
UrAlkAli<br />
Tropic<br />
soils facts<br />
43.5 mln. sq. km or<br />
42.3% of world total<br />
area<br />
20.8% reclamation<br />
23%world cultivated<br />
area<br />
Temperate soils — 23% world<br />
cultivated area.<br />
The thermal conditions are<br />
perfect for many different<br />
crops: coffee, oil palm, rice.<br />
it is possible to get three<br />
harvests a year.<br />
Typical soils: red-yellow,<br />
yellow, red, brown soils.<br />
Typical Uptake K 2 O kg World Annual K 2 O<br />
crops per 1 t of product production, Mt compensation, t<br />
Coffee 22 7.4 162,800<br />
Palm Oil 13.2 40.6 535,920<br />
Rice 3.2 420 1,344,000<br />
1 t К 2 О (nutrient) is equal<br />
to around 1.67 t kCl (product)<br />
Annual report<br />
19
Potash<br />
Source:<br />
ABG research, <strong>Uralkali</strong><br />
others 15%<br />
Top 85%<br />
Annual report<br />
01<br />
Pure potash<br />
player<br />
<strong>2007</strong><br />
Strategy<br />
section<br />
uralkali has taken a strategic decision<br />
to focus purely on potash, rather than<br />
the other major fertilisers, nitrogen and<br />
phosphate, or a combination of the three.<br />
Potash is an industry which offers growth,<br />
transparency and stability for the following<br />
reasons:<br />
The potash business is not cyclical<br />
— potash is an essential nutrient and<br />
there is robust, steady and growing<br />
demand.<br />
Potash has a stable and growing<br />
price — two major export associations<br />
Phosphate<br />
Top 39%<br />
Диаграммы<br />
others 61%<br />
Nitrogen<br />
Top 25%<br />
others 75%<br />
STRATEGY SEcTioN<br />
ensure stability and the demand/supply<br />
imbalance ensures price growth.<br />
There is not the price volatility associated<br />
with other fertilisers such as nitrogen,<br />
which is affected by energy prices.<br />
Potash is unique and cannot be<br />
substituted.<br />
The supply-side factors addressed<br />
previously in the market section add to<br />
attractiveness of the potash sector — limited<br />
geographic availability, high industry<br />
concentration and high barriers to entry.<br />
20
Restoring nature’s balance<br />
uRAlkAli<br />
uralkali — leader to capture growth<br />
02<br />
Focus on BRic<br />
markets<br />
<strong>Uralkali</strong> <strong>2007</strong> sales<br />
portfolio<br />
india 7%<br />
Europe 8%<br />
S-E Asia 11%<br />
china sea 15%<br />
our focus on the BRic markets (Brazil,<br />
Russia, india and china) allows us a comprehensive<br />
exposure to the world’s most<br />
attractive markets. As described in the market<br />
section, the key factors which drive up<br />
potash demand — fast-growing population<br />
and rising incomes — are evident in these<br />
markets. We already have leading positions<br />
in these countries and this presents us with<br />
the potential to grow faster than producers<br />
with less exposure to these markets. The<br />
facts are as follows:<br />
1 FERTEcoN, BPc<br />
Annual report<br />
BRic countries account for nearly half<br />
the potash market, and demand is growing<br />
at above industry level.<br />
They will account for more than 80% 1<br />
of market growth over the next five years.<br />
Sales to BRic countries accounted for<br />
78% of uralkali volumes in <strong>2007</strong>.<br />
We are number one by market share in<br />
the BRic markets.<br />
Potash can be sold at a premium in<br />
BRic markets compared to the mature<br />
markets of North America and Europe.<br />
We are competitive with other players<br />
in distribution to these markets, and have<br />
the unique advantage of rail delivery to<br />
northern china.<br />
other 2%<br />
china rail 25%<br />
Russia 10%<br />
Brazil 21%<br />
21
Annual report<br />
03<br />
ownership<br />
of the entire<br />
value chain<br />
<strong>2007</strong><br />
uralkali is vertically integrated, controlling<br />
the whole chain from reserve potash<br />
base to end customer. This is a major differentiator<br />
and allows us to manage the<br />
business efficiently, control logistics costs<br />
and negotiate prices. This value chain is<br />
described in the subsequent sections of<br />
the report and includes:<br />
Two mines developing the world’s<br />
second largest deposit, and four potash<br />
mills. These offer current capacity of 5.1<br />
million tonnes with the possibility to raise<br />
capacity to 7 million tonnes by 2010 on<br />
the cheapest basis in the industry.<br />
Entire Value Chain — from Reserve Base to End Customer<br />
PRoDucTioN<br />
Existing Assets — 2 MiNES, 4 PLANTS<br />
1 Plant<br />
Products:<br />
Standard<br />
3 Plant<br />
Products:<br />
Granular,<br />
Standard<br />
TRADiNG<br />
<strong>Uralkali</strong><br />
Domestic sales<br />
>4,300 special mineral railcars<br />
160kt warehouses<br />
2 Mine and Plant<br />
Resources: 359 Mt of ore 1<br />
Products: Granular, Standard<br />
Ore transportation<br />
(motorway)<br />
4 Mine and Plant<br />
Resources: 1 895 Mt of ore 1<br />
Products: Standard<br />
Ore transportation<br />
(railway)<br />
1 JoRc<br />
as of January 1, 2008<br />
Baltic Bulk Terminal<br />
Shortest transp. leg<br />
(from uk mines to St. Petersburg)<br />
capacity: 6.2 Mt<br />
240 kt warehouses<br />
New Licence — MiNE 5<br />
Resources: 1,300 Mt of ore<br />
Grade — 30%<br />
35 years of reserves<br />
PRE-FESIBILITY STUDY RESULTS:<br />
Production volume planned – 3,7 Mt of kcl<br />
cAPEX — uS $ 800 per tonne of production, including:<br />
New mine<br />
New plant at Ru-4 of 2,2 Mt<br />
New plant at Ru-3 of 1,5 Mt<br />
No additional infrastructure required<br />
cost efficiency of ~uS $17 mln per annum due to the<br />
elimination of ore transportation between mines<br />
STRATEGY SEcTioN<br />
licence for a new mine, with the potential<br />
to add almost 4 million tonnes annual<br />
capacity for only uS $ 800 per tonne<br />
added.<br />
The biggest private fleet of rail cars, a<br />
wholly-owned sea port facility, and our<br />
own warehouses<br />
A 50/50 joint venture trading partner,<br />
Belarusian Potash company, the world’s<br />
number one potash export trader 2 , allowing<br />
direct access to customers and price<br />
negotiations in major markets.<br />
Belarussian Potash<br />
Company <strong>Uralkali</strong> Trading<br />
leading export platform<br />
with 33% share<br />
2 iN MAY 2008, the shareholder structure of JSc<br />
«Belarusian Potash company» has changed and it’s currently as follows:<br />
JSc «uralkali» owns 50% of the BPc's ordinary shares;<br />
Republican unitary Enterprise «Po «Belaruskali» owns 45% of the<br />
BPc's ordinary shares; and<br />
State corporation «Belarusian Rail Road» owns 5% of the BPc's<br />
ordinary shares.<br />
22
04<br />
Production today<br />
and tomorrow<br />
Victor Zapivalov<br />
winning machine operator,<br />
ru-4<br />
i am 49. i came to Berezniki from ordynski District in<br />
1981, with my wife. i now have a grown up son and<br />
daughter, and a granddaughter. i knew some people<br />
who worked at the uralkali mine and they said it was<br />
a good place, and the wages were the highest, so in<br />
1982, i enrolled in a vocational training school to become<br />
an operator of winning machines.<br />
i continued to train-up as time passed. i came to the<br />
4th Mine as operator Grade 5 of winning machines,<br />
and reached level 6. in 2000 i was elected team manager.<br />
it was difficult at first. i love it now. The team is<br />
superb, closely knit, and works well together. i have<br />
clearances for servicing and repairing self-propelled<br />
cars and i learned to use a gas analyzer — we are constantly<br />
monitoring gas levels.<br />
uralkali is not standing still. it is always on the move.<br />
ours is a reliable operation with stable wages. There<br />
are bonuses as well.<br />
Thanks to uralkali i can provide material support to<br />
my kids. Three years ago i bought an apartment and<br />
a car for my son. The family is growing and i think<br />
there will be more grandchildren. So my support will<br />
come in handy.<br />
Restoring nature’s balance<br />
uRAlkAli<br />
4.1 current<br />
production<br />
uralkali budgeted for production of 5<br />
million tonnes in <strong>2007</strong> and produced<br />
100,000 tonnes over this amount due to<br />
productivity and debottlenecking programme<br />
coming on line early.<br />
our two mines exploit the Verkhnekamskoe<br />
Deposit, the world’s second largest:<br />
Mine 2 at the Durymansky field has<br />
been operating since 1970 and has resources<br />
of 359 Mt of ore 2 . it has an associated<br />
plant, Plant 2.<br />
Chemical<br />
Enrichment<br />
Standard<br />
White<br />
Potash<br />
Pink<br />
Potash<br />
Annual report<br />
Mine 4 at the Bygelsko-Troitsky field<br />
has been operating since 1987 and has<br />
resources of 1,895 Mt of ore 3 . it has an<br />
associated plant, Plant 4.<br />
Plant 1 has a number of different facilities<br />
including a potash processing plant<br />
supplied by motorway from Mine 4.<br />
Plant 3 processes ore delivered by rail<br />
from Mine 4.<br />
We produce two major products, Granular<br />
and Standard. They vary in potassium content,<br />
consistency and production method.<br />
Granular is used by countries with advanced<br />
fertilisation techniques.<br />
Mining Ore<br />
Crushing<br />
2 JoRc<br />
as of January 1, 2008<br />
Flotation<br />
Granular<br />
Potash<br />
3 JoRc<br />
as of January 1, 2008<br />
1/3 kcl<br />
(Potassium chloride)<br />
1/2 Nacl<br />
(Sodium chloride)<br />
Compacting<br />
23
Annual report<br />
4.2 low cost<br />
producer<br />
We believe we are the lowest cost potash<br />
producer, benefiting from low labour and<br />
energy costs, two of the main cost components<br />
of our business. cost of gross<br />
sales in <strong>2007</strong> was RuR 1,128 a tonne,<br />
significantly below the industry average.<br />
in recent years (2003-<strong>2007</strong>) we have<br />
been able to reduce Group head count by<br />
32%, and by 43% at the main production<br />
unit. A continuing programme is aiming to<br />
reduce this still further, creating further a<br />
increase in productivity per employee. in<br />
addition we are currently implementing a<br />
new power generation programme — we<br />
believe we can achieve cost savings by<br />
supplying our own electricity and heat<br />
from turbines powered by natural gas.<br />
1,500 kt: 2nd production line brownfield<br />
debottlenecking<br />
on Pu-2,4<br />
150 kt: shafts modernisation on<br />
Pu-2,4<br />
150 kt: additional flotation equipment<br />
on Pu-2,4<br />
200 kt: additional flotation equipment<br />
on Pu-2,4<br />
Historical production<br />
Existing capacity<br />
New capacity<br />
<strong>2007</strong><br />
4.3 capacity<br />
additions<br />
programme<br />
Through modernisations and de-bottlenecking<br />
we will add 2 million tonnes of<br />
capacity in the coming three years. in addition<br />
our new greenfield project, mine 5,<br />
has potential to lift our total annual capacity<br />
to almost 11 million tonnes.<br />
Brownfield projects — we intend to<br />
add 2 Mt of capacity on the cheapest basis<br />
in the industry, at uS$ 160 per tonne<br />
of expansion. The chart shows where<br />
and when we expect these expansions<br />
to come on line. We have established a<br />
new subsidiary, llc uralkali Engineering,<br />
with a highly regarded German engineering<br />
company Ercosplan, to implement the<br />
modernisation and the de-bottlenecking<br />
plans.<br />
4.2<br />
5.1<br />
5.3<br />
5.1<br />
5.5<br />
STRATEGY SEcTioN<br />
Greenfield project, Mine 5 — uralkali<br />
was granted the licence for a new greenfield<br />
resource in 2004. We expect this<br />
to be the most cost-effective greenfield<br />
project in the industry — the depth of the<br />
deposit is only 400 metres, while the mine<br />
is just 30 km from our existing operations,<br />
so much of the infrastructure is in place.<br />
in fact it will be almost two times cheaper<br />
than average industry greenfield projects,<br />
at $uS 800 per tonne of expansion.<br />
Planned production volume will be up to<br />
3.7 Mt a year.<br />
7.0<br />
10.7<br />
2006 <strong>2007</strong> 2008 2009 2010 Mine 5<br />
5.3<br />
5.5<br />
Mine-5:<br />
3.7 mln<br />
tonnes<br />
upside<br />
7.0<br />
Mmt<br />
12.0<br />
10.0<br />
8.0<br />
6.0<br />
4.0<br />
2.0<br />
0.0<br />
24
Restoring nature’s balance<br />
05<br />
Distribution<br />
ivan Sokolov<br />
Project mechanic, ru-4<br />
i’m 26, married with a 3 year-old daughter. i studied<br />
a correspondence course at the Perm State Technical<br />
university Berezniki Department, where i majored in<br />
Machines and Apparatuses for Production Processes,<br />
graduating in 2005. uralkali has cooperated closely<br />
with the university in recent years, taking care of students<br />
who may become their future employees.<br />
i started as an apprentice to a pump unit operator at<br />
BkPRu-1.<br />
A year ago i was offered a job as a project mechanic<br />
for the BkRu-4 order Department. i took the job<br />
and consider it a definite step forward. i still keep in<br />
touch with my former colleagues at BkPRu-1. i think<br />
that such close relationships are very typical of our<br />
company.<br />
uralkali provides for the compensation of interest<br />
payments under the mortgage financing, which is not<br />
common practice elsewhere. uralkali is very dynamic<br />
in its development. i can see continual changes in our<br />
conveyor system, and if it keeps up with the current<br />
rate of retooling, i am sure the company will make<br />
significant progress, which will be mean progress and<br />
advancement for me as well.<br />
uRAlkAli<br />
A fleet of rail cars, warehouse estate and<br />
full-owned port facilities in St. Petersburg<br />
allow us to control logistics costs, react<br />
to peaks in demand and ensure a reliable<br />
supply to our customers.<br />
5.1 Baltic<br />
Bulk Terminal (BBT)<br />
We are the sole owner of JSc Baltic Bulk<br />
Terminal, which in turn owns the bulk<br />
terminal fully constructed in 2004, a<br />
state-of-the-art sea port facility in St.<br />
Petersburg designed specifically for handling<br />
fertilisers. it is considered one of<br />
the best and most efficient fertiliser terminals<br />
in the world, with a ship-loading<br />
speed of 3,000 tonnes an hour. The 2000<br />
km transportation leg from the mines to<br />
the marine port is serviced by rail and is<br />
the shortest route available, and the terminal<br />
offers the scheduling flexibility of<br />
our own warehouses with capacity for<br />
240,000 tonnes.<br />
BBT has an annual throughput capacity of<br />
6.2 million tonnes, providing availability<br />
for future capacity additions, as well as<br />
generating shipping sales to a third party<br />
mixed fertiliser (NPk) producer, one of<br />
our potash customers. ownership of BBT<br />
affords us the option to make investments<br />
in efficiency where necessary. importantly,<br />
it also offers control over the handling<br />
and transportation process, as potash<br />
quality can deteriorate if mishandled.<br />
5.2 Rail<br />
Annual report<br />
Rail transportation is vital to uralkali, mitigating<br />
the risk of non-supply, delivering<br />
to our bulk terminal for export by sea, and<br />
allowing us the competitive advantage<br />
of land shipments to northern china. As<br />
such, we are one of the largest customers<br />
of the Russian Railways. importantly,<br />
we own our own fleet of around 4,500<br />
special railcars so we are not dependent<br />
on the availability of those owned by the<br />
Russian Railways, for which demand far<br />
outstrips supply.<br />
in support of this rail distribution network<br />
our logistics management system monitors<br />
our rail car movement down to the<br />
location of each car, and each processing<br />
plant has outlets in the Berezniki train<br />
terminal.<br />
5.3 Warehousing<br />
inevitably we need to store potash from<br />
time to time to overcome distribution<br />
scheduling issues. in addition to our<br />
240,000 tonne warehouse capacity at<br />
BBT, our warehouses in Berezniki hold<br />
160,000 tonnes of potash, with separate<br />
sections for different products. Each is<br />
connected to the rail freight terminal by a<br />
conveyor belt system, which is protected<br />
from the environment.<br />
25
6.1 Trading<br />
Annual report<br />
06<br />
Trading<br />
and pricing<br />
BPc offers us worldwide coverage with<br />
sales offices in six countries. Through BPc<br />
we have leading positions and can increase<br />
share in our target markets of the BRic<br />
countries — and with our partner in BPc<br />
we command around 30% of the chinese<br />
market, the biggest potash market in the<br />
world. BPc offers the scale and authority<br />
that achieves cost efficiencies, increases<br />
profitability and crucially, which means it is<br />
the chosen price negotiator in the largest<br />
markets, including china and india, leading<br />
important price negotiations in those countries.<br />
This role as a price ‘setter’ affords us<br />
longer visibility and certainty.<br />
Major Potash<br />
Players by Export Trading<br />
Source: ABG research, <strong>Uralkali</strong><br />
1 iN MAY 2008, the shareholder structure of JSc<br />
«Belarusian Potash company» has changed and it’s currently as follows:<br />
JSc «uralkali» owns 50% of the BPc's ordinary shares;<br />
Republican unitary Enterprise «Po «Belaruskali» owns 45% of the<br />
BPc's ordinary shares; and<br />
State corporation «Belarusian Rail Road» owns 5% of the BPc's<br />
ordinary shares.<br />
<strong>2007</strong><br />
Belarusian Potash company (BPc) is a<br />
50/50 joint venture between uralkali and<br />
Belaruskali 1 . it delivers us all the advantages<br />
of being the number one potash export<br />
trading company in the world, with<br />
33% of the export market in <strong>2007</strong>.<br />
6.2 Pricing<br />
our strategy in a demand-driven market<br />
is to maintain a balance between spot<br />
markets and contract markets. Spot prices<br />
are determined by the market, whereas<br />
contract prices are determined annually<br />
or semi-annually. india and sales to china<br />
by sea are contract markets, and our <strong>2007</strong><br />
sales ratio of contract : spot was 40 : 60.<br />
k+S 14%<br />
uralkali/Belaruskali<br />
(BPc+ukT) 33%<br />
icl 10%<br />
APc 5%<br />
canpotex 26%<br />
Silvinit 12%<br />
Andrey kharintsev<br />
Deputy Head of uralkali’s<br />
Department for technical<br />
Development of mining<br />
operations<br />
STRATEGY SEcTioN<br />
i’m 39, married with three children, originally from<br />
Gremyachinsk, Perm Territory, which is a coal-mining<br />
area. All my family were connected to coal mining so<br />
i didn’t imagine any different for me. i graduated from<br />
the Perm State Technical university in 1996, majoring<br />
in underground Development of Mineral Deposits.<br />
coal mines were closing down and, thinking about<br />
my prospects, we decided to move to Berezniki. i was<br />
hired as an apprentice to an underground electrical<br />
fitter at the BkRu-4 mine in 1990. BkRu-4 has an<br />
underground passage from the shafts to the mine,<br />
and there are benches in the passage. Now, almost 18<br />
years later, i look at them and feel nostalgia, thinking<br />
to myself, was it really me who made them? i remember<br />
being very inexperienced at work, and i learned a<br />
lot from the team of miners i was with. They treated<br />
me with understanding and gave me confidence. i still<br />
get together with them today.<br />
in 1996 i became a foreman, then from 1997, a deputy<br />
head of the unit and in 1999, i was appointed as<br />
the unit head. in 2003, i was offered the position of<br />
a senior specialist at the Mining Department of uralkali’s<br />
Technical Directorate. in 2005, i took up my new<br />
position as a deputy head of the Mining Department<br />
of the Technical Directorate. Since January 2006 i’ve<br />
held a similar position but at the Production Directorate.<br />
last March i completed training under the Personnel<br />
Reserve programme, which helped me feel<br />
that the company needed me and that i was noticed.<br />
i also finished an MBA programme last year.<br />
in the 1990s, compared with other businesses in Russia<br />
and Berezniki, uralkali paid low wages, but they<br />
were stable and that was a big advantage. Now, the<br />
serious and long-term intentions of the company are<br />
to grow and to develop. This is noticeable to people<br />
at every level — equipment replacement, downtime<br />
prevention, and a search for optimum patterns of<br />
work are all underway. So i’m glad to be a promising<br />
employee of a promising, developing company.<br />
26
07<br />
our people —<br />
a valuable<br />
resource<br />
Restoring nature’s balance<br />
08<br />
Environment<br />
uRAlkAli<br />
At uralkali, people are the foundation<br />
of our strategy, producing potash and<br />
providing our customers worldwide with<br />
potash. People are clearly our main assets.<br />
But they are also our most scarce assets,<br />
as today, such professional people are in<br />
great demand. This is because the number<br />
of professionals in our industry has been<br />
declining for many years, and we are not<br />
alone in suffering a shortage of qualified<br />
specialists.<br />
our products increase the productivity of<br />
agricultural land, thus helping feed the<br />
world’s growing population and reducing<br />
the need for deforestation. This is important<br />
to the environment, as forests help<br />
negate the world’s greenhouse gas emissions.<br />
However, as a responsible company<br />
operating in a global market, we also<br />
have a duty to conduct our operations in<br />
an environmentally conscientious way.<br />
Therefore we run an Environment Protection<br />
programme, approved annually,<br />
which includes 16 different projects.<br />
in <strong>2007</strong> the programme’s projects were<br />
aimed at air pollution control, water-resources<br />
conservation, waste utilization,<br />
and promoting environmental matters to<br />
employees. our efforts are made in accordance<br />
with international best practice<br />
and standards. in addition our Environment<br />
Management System is integrated<br />
with the corporate Quality Management<br />
System. in <strong>2007</strong> we spent 463 million<br />
roubles on environmental measures, almost<br />
ten times as much as in 1997.<br />
it is crucial that our management and<br />
employees should be environmentallyminded,<br />
and we run ecological training<br />
for employees, include ecological issues<br />
in job descriptions include, and audit employees’<br />
environmental knowledge and<br />
compliance with the relevant rules and<br />
guidelines regularly.<br />
Annual report<br />
our strategy at uralkali is one of growth,<br />
as described in this report. We have many<br />
new projects underway, including the<br />
construction of Mine 5. it is critical to our<br />
success that these projects are managed<br />
and developed by professionals able to<br />
meet the challenges with distinction. We<br />
have introduced a major new initiative to<br />
achieve these objectives. We want people<br />
to enjoy working at uralkali, an employer<br />
which not only commands and recognises<br />
high performance, but which offers<br />
the means for personal growth, fulfilment<br />
and a high standard of living.<br />
Air pollution — in <strong>2007</strong> we conducted air<br />
monitoring at our main facilities, which allowed<br />
clear identification of their impact<br />
on the air condition in Berezniki. We managed<br />
to decrease air pollutant emissions<br />
significantly by starting to use gas for our<br />
Drying Plant and cHPP at Mine Group 4.<br />
Water pollution — To control the quality<br />
of subterranean and surface waters, specialists<br />
from the Department for Environment<br />
Protection conduct geological and<br />
hydro-geological monitoring in the operational<br />
area. last year, to prevent pollution,<br />
we purified the rain pool area at<br />
BkPRu-3 and its Salt-Solution collector.<br />
Water consumption — By using stricter<br />
technological discipline, we managed<br />
to decrease the amount of water used<br />
in production by 6%, from 2.45 cu m/<br />
tonne in 2006 down to 2.30 cu m/tonne<br />
in <strong>2007</strong>. We also decreased our waste<br />
discharge almost two-fold due to: more<br />
rational use of water resources, extensive<br />
water recycling and re-circulating<br />
systems at our production facilities, and<br />
the pumping of brines into the BkPRu-1<br />
mine. As a result, the actual basin waste<br />
discharges were 48.6% lower than the<br />
permissible level, with the pollutant content<br />
in our discharges not exceeding the<br />
acceptable value.<br />
27
Annual report<br />
Potato:<br />
1600 kt<br />
compensation<br />
K 2 O<br />
<strong>2007</strong><br />
28<br />
Boreal soils<br />
USA<br />
Russia<br />
Canada<br />
China<br />
Europe<br />
restoring nature’s balance<br />
UrAlkAli<br />
Boreal<br />
soil facts<br />
23.7 mln. sq. km or<br />
17.7% of world total<br />
area<br />
8.4% reclamation<br />
15%world cultivated<br />
area<br />
Boreal soils — 15% world<br />
cultivated area.<br />
The thermal conditions restrict<br />
the ability for cropping. The<br />
major crops are rapeseed,<br />
potato, sugar beet.<br />
Typical soils: podzolic soils,<br />
sod-glay.<br />
Typical Uptake K 2 O kg World Annual K 2 O<br />
crops per 1 t of product production, Mt compensation, t<br />
Rapeseed 9 48 432,000<br />
Potato 5 320 1,600,000<br />
Sugar beet 6.3 420 1,524,600<br />
1 t К 2 О (nutrient) is equal<br />
to around 1.67 t kCl (product)<br />
Annual report<br />
29
Annual report<br />
Financial management<br />
discussion<br />
and analysis section<br />
01<br />
Gross sales<br />
Average gross sales prices<br />
for key markets, US$ per tonne<br />
Notes:<br />
1 Average CFR price<br />
2 Average DAF price<br />
3 Average FCA price<br />
200<br />
SEA 1<br />
4 Average FOB price<br />
grossed up for average freight rates in the region<br />
5 All price are given on the gross basis<br />
260 258<br />
184<br />
<strong>2007</strong><br />
in <strong>2007</strong> uralkali demonstrated an outstanding<br />
growth in sales. Gross sales increased<br />
by 32%, achieving a record RuR<br />
29,499M (uS$ 1,153M). Net sales 1 increased<br />
by 36% reaching RuR 22,673M<br />
(uS$ 887M). The major reasons behind<br />
the increase were sales prices increases and<br />
a significant increase in sales volumes.<br />
179<br />
238<br />
206<br />
227<br />
141<br />
1 NET SAlES = GRoSS SAlES NET<br />
of freight expenses, railway tariff<br />
expenses and transhipment expenses<br />
1.1 Price increase<br />
FiNANciAl MANAGEMENT<br />
DiScuSSioN AND ANAlYSiS<br />
SEcTioN<br />
Favourably for the company, global demand<br />
growth led to a 1 million tonne world<br />
deficit by the end of <strong>2007</strong>. This mismatch<br />
caused significant global price rises in <strong>2007</strong>,<br />
that are continuing in 2008. uralkali’s average<br />
gross prices were higher in <strong>2007</strong> on<br />
average by almost uS$ 40 per tonne (22%<br />
year-to-year growth).<br />
The gross sales growth was also supported<br />
by the significant sales volume increase.<br />
We produced and sold 5.1 million tonnes<br />
of potash, 0.1 million tonnes above our<br />
budget. We reached this surplus through<br />
the success of the productivity and debottlenecking<br />
programme we implemented<br />
in <strong>2007</strong>.<br />
2006 <strong>2007</strong> 2006 <strong>2007</strong> 2006 <strong>2007</strong> 2006 <strong>2007</strong> 2006 <strong>2007</strong> 2006 <strong>2007</strong> 2006 <strong>2007</strong><br />
Brazil 1<br />
Europe 1<br />
China Rail 2<br />
113<br />
Russia 3<br />
218<br />
India 1<br />
253<br />
208<br />
227<br />
China Sea 4<br />
300<br />
250<br />
200<br />
150<br />
100<br />
50<br />
0<br />
30
Potash sales structure, <strong>2007</strong><br />
Export structure, <strong>2007</strong><br />
Restoring nature’s balance<br />
uRAlkAli<br />
uralkali — leader to capture growth<br />
other 2%<br />
india 7%<br />
Europe 8%<br />
Russia 10%<br />
china rail 25%<br />
S-E Asia 11%<br />
Brazil 22%<br />
china sea 15%<br />
Transhipment services 2%<br />
Non-core products 1%<br />
other services 1%<br />
Potash 96%<br />
china rail 27%<br />
Europe rail 8%<br />
Sea export (through<br />
St. Petersburg) 70%<br />
1.2 Geography<br />
of sales<br />
uralkali sold its products to more than 20 countries. our major<br />
customers are located in developing countries, which provide<br />
for more favourable prices compared to mature economies. The<br />
four major developing economies (described as the BRic countries<br />
— Brazil, Russia, india, china) accounted for 79% of our<br />
sales volume.<br />
in addition, sales recovered in <strong>2007</strong> after prolonged contract<br />
negotiations with major chinese customers in 2006, which have<br />
historically accounted for a large proportion of our sales, and this<br />
contributed to the gross sales increase.<br />
other (non-potash) sales increased by 15% in <strong>2007</strong> and achieved<br />
RuR 1,104M (uS$ 43M). The major components of such sales<br />
include the transhipment services rendered by the Baltic Bulk Terminal<br />
to third party mixed fertiliser (NPk) producers, and sales<br />
of non-core products (such as sodium chloride, carnallite and<br />
carnallite processing).<br />
The majority of export sales in <strong>2007</strong> were shipped by sea<br />
through St. Petersburg port. Distribution costs for sea export<br />
include the railway tariff from Berezniki to St. Petersburg and<br />
freight cost (except for deliveries on FoB basis). The second largest<br />
part of export sales was made to china by rail and a minor<br />
part was sold to European customers by rail. Distribution costs<br />
for these deliveries include railway tariff costs to china and Europe<br />
respectively.<br />
Annual report<br />
31
Annual report<br />
02<br />
Transportation<br />
2.1 Freight<br />
<strong>2007</strong><br />
Global freight rates increased rapidly in<br />
<strong>2007</strong>, however the effective freight rates<br />
to us did not change significantly. This<br />
was due to long-term freight contracts for<br />
approximately two-thirds of our freight<br />
costs that hedged us from the negative<br />
trends in this market.<br />
2.2 Railway tariff<br />
FiNANciAl MANAGEMENT<br />
DiScuSSioN AND ANAlYSiS<br />
SEcTioN<br />
We exported goods to several main destinations:<br />
to several European customers<br />
overland, to northern china market overland,<br />
and to the rest of the world through<br />
our terminal in St. Petersburg. The railway<br />
tariffs for all destinations are regulated by<br />
the State. The general policy for <strong>2007</strong><br />
was an increase of approximately 8% on<br />
tariffs to seaports, while all other destinations<br />
were charged at 2006 tariffs.<br />
Freight cost structure, <strong>2007</strong> St. Petersburg railway tariff,<br />
RUR per tonne<br />
Effective freight rates RUR<br />
per tonne<br />
1,156<br />
+3%<br />
1,190<br />
2006 <strong>2007</strong><br />
long term freight<br />
contracts 68%<br />
Spot freight rates<br />
32%<br />
2,000<br />
1,000<br />
0<br />
2.3 Transhipment<br />
527<br />
+8%<br />
All sea exports are processed through our 100% subsidiary Baltic Bulk Terminal (BBT) in<br />
St. Petersburg. Due to the high volumes of shipped goods, the effective cost is relatively<br />
stable at approximately uS$ 3.5 per tonne.<br />
569<br />
2006 <strong>2007</strong><br />
China railway tariff,<br />
RUR per tonne<br />
1,220<br />
0%<br />
1,220<br />
2006 <strong>2007</strong><br />
600<br />
400<br />
0<br />
2,000<br />
1,000<br />
0<br />
32
Restoring nature’s balance<br />
03<br />
Net sales<br />
04<br />
cash cost<br />
of goods sold 1<br />
Cash COGS<br />
uRAlkAli<br />
Net sales are defined as the gross sales<br />
for the period net of certain distribution<br />
costs — freight costs, railway tariffs and<br />
transhipment costs. Despite rise in tariffs<br />
and freight costs, the effect of the price<br />
increase significantly overlapped this<br />
growth and led to 36% increase to RuR<br />
22,673M in <strong>2007</strong>.<br />
Average cash coGS per tonne in <strong>2007</strong><br />
increased by 1% compared to 2006 and<br />
was RuR 1,128 (uS$ 44) per tonne, significantly<br />
below the industry average.<br />
The cash coGS in <strong>2007</strong> included 40% of<br />
variable costs and 60% of fixed costs. This<br />
structure gives the company flexibility in<br />
expanding production capacity without<br />
escalation of coGS.<br />
The largest components of uralkali’s cost<br />
of sales are labour, materials and energy.<br />
other 11%<br />
Transportation<br />
between mines 6%<br />
Materials 24%<br />
Energy 26%<br />
labour 33%<br />
4.1 labour<br />
1 cASH coST oF GooDS<br />
Sold = cost of goods sold less depreciation<br />
Annual report<br />
As a Russian company uralkali benefits<br />
from low labour costs. in 2006 our average<br />
monthly labour cost per production<br />
employee was RuR 13,000 (cuS$ 500).<br />
To prevent the loss of highly-qualified<br />
manpower we have started a programme<br />
to align the salary of production employees<br />
with the average regional salary. in<br />
<strong>2007</strong> our average monthly labour cost<br />
per production employee increased by<br />
31% on the 2006 figure, to RuR 17,000<br />
(cuS$ 670).<br />
We expect this increase to be offset by<br />
headcount reduction in the coming years,<br />
achieved as a result of the restructuring<br />
programme we are developing, which is<br />
covered in the cost Reduction section of<br />
this report.<br />
33
Annual report<br />
<strong>2007</strong><br />
Fuel and Energy Breakdown (<strong>2007</strong>)<br />
Electricity consumption (<strong>2007</strong>)<br />
Effective electricity tariff,<br />
RUR/kWh<br />
1.5<br />
+13 %<br />
1.04<br />
1.18<br />
1,2 1.2<br />
1.2<br />
0.9<br />
0.6<br />
0.3<br />
0.0<br />
2006 <strong>2007</strong><br />
1.0<br />
0.8<br />
0.6<br />
0<br />
0.4<br />
0.2<br />
0.0<br />
Electricity 18 %<br />
Gas 4 %<br />
Fuel oil 2 %<br />
Heat 2 %<br />
other cash costs 74 %<br />
Nonregulated<br />
market 13 %<br />
Regulated<br />
market 87 %<br />
4.2 Energy<br />
4.2.1 Electricity<br />
FiNANciAl MANAGEMENT<br />
DiScuSSioN AND ANAlYSiS<br />
SEcTioN<br />
The potash production process requires<br />
significant amounts of electricity and<br />
heat energy. Energy-related expenses<br />
represented 26% of total cash coGS,<br />
the majority of which was attributed<br />
to electricity expenses. The next three<br />
largest components during the period<br />
under review were natural gas, fuel oil<br />
and heat expenses.<br />
currently between 90% and 95% of domestic<br />
electricity prices are regulated by<br />
the Russian Government. The Government<br />
is currently implementing a restructuring<br />
plan for the power sector aimed<br />
at introducing greater competition, liberalising<br />
the wholesale electricity market<br />
and moving to a market-based system by<br />
2011.<br />
in <strong>2007</strong>, our supplier wholesale company<br />
purchased from 90% to 95% of electricity<br />
from the energy producers on the regulated<br />
price basis. The rest (from 5% to<br />
10%) was purchased on the non-regulated<br />
market, which historically meant higher<br />
prices. The wholesale company charges<br />
these costs on to customers. Residential<br />
consumers are billed first at the regulated<br />
tariffs, and the remainder is charged to<br />
industrial customers who, in effect, sponsor<br />
residential consumption. Through<br />
the Government plans, the percentage<br />
of the electricity to be sold through the<br />
unregulated market is subject to further<br />
increase. in <strong>2007</strong> the electricity tariff on<br />
the regulated market was approximately<br />
24% lower than that on the non-regulated<br />
market. in 2008 the share of electricity<br />
purchased on the non-regulated market is<br />
expected to increase. our average effective<br />
electricity price increased in <strong>2007</strong> by<br />
13% compared to 2006, to RuR 1.18 per<br />
kWh (uS$ 0.05 per kWh).<br />
34
4.2.2 Gas<br />
Natural gas is a small part of our cash cost.<br />
our operations require some amounts<br />
of natural gas, primarily purchased from<br />
subsidiaries of oAo Gazprom. This is a<br />
Government-controlled company and<br />
the dominant producer and monopoly<br />
transporter of natural gas within Russia.<br />
Starting from <strong>2007</strong> the Russian Government<br />
has fixed the volume of natural<br />
gas supplied by Gazprom to industrial<br />
consumers on a regulated tariff for the<br />
level consumed in 2006. Gas consumed<br />
exceeding this level should be purchased<br />
on open market. in <strong>2007</strong> the gas price on<br />
the open market was 20% higher than<br />
the regulated tariff. our average effective<br />
gas price increased in <strong>2007</strong> by 18%<br />
compared to 2006, to RuR 1,379 per one<br />
thousand m 3 (uS$ 53.93 per one thousand<br />
m 3 ).<br />
4.3 Materials<br />
Expenses for materials and components<br />
include costs related to materials used in<br />
the production process (including chemicals<br />
reagents needed and spare parts for<br />
mining equipment), which are dependent<br />
on production volume, and other materials,<br />
which include materials and parts used<br />
in repairs and maintenance conducted by<br />
our in-house repairs and maintenance departments.<br />
in general materials and components<br />
costs in <strong>2007</strong> increased by 6%<br />
compared to 2006, which is less than the<br />
inflation rate.<br />
Restoring nature’s balance<br />
uRAlkAli<br />
Gas consumption (<strong>2007</strong>)<br />
Effective gas tariff,<br />
kRUR/1000m 3<br />
1.17<br />
+18 %<br />
1.38<br />
2006 <strong>2007</strong><br />
Materials (<strong>2007</strong>)<br />
1.5 1.5<br />
1.2<br />
0.9<br />
0.6<br />
0.3<br />
0<br />
1.2<br />
0.9<br />
0.6<br />
0.3<br />
0.0<br />
Nonregulated<br />
market 13%<br />
Regulated<br />
market 87%<br />
other materials<br />
24%<br />
Production<br />
materials 24%<br />
Annual report<br />
1.2<br />
1.0<br />
0.8<br />
0.6<br />
0.4<br />
0.2<br />
0.0<br />
35
Annual report<br />
4.4 Transportation<br />
between mines<br />
We incur these costs in transporting ore<br />
by rail from Mine 4 to Plant 3, which does<br />
not have an adjoining mine. These costs<br />
include railway tariff and corresponding<br />
shunting operations. in <strong>2007</strong> they increased<br />
by 76% compared to 2006 due<br />
to an increase in volume of transported<br />
ore, and an increase in the railway tariff.<br />
These costs will be eliminated following<br />
the start of ust-Yava operations.<br />
05<br />
General<br />
and administrative<br />
(G&A) expenses<br />
General and administrative<br />
costs, <strong>2007</strong><br />
<strong>2007</strong><br />
Effective railway tariff, RUR<br />
per tonne<br />
+11%<br />
35<br />
38<br />
2006 <strong>2007</strong><br />
Average cash general and administrative<br />
expenses 1 per tonne increased in <strong>2007</strong> by<br />
53% compared to 2006 and were RuR<br />
637 (uS$ 25) per tonne. The increase was<br />
mainly explained by one-off expenses relating<br />
to our share offering, and new post<br />
employment benefits. Without these expenses<br />
average cash G&A per tonne in<br />
<strong>2007</strong> would have been RuR 452 (uS$<br />
18) per tonne, an increase of 8% on their<br />
2006 level, which is in line with the inflation<br />
rate.<br />
The largest components of our general<br />
and administrative expenses are labour<br />
costs, costs related to the shares offering,<br />
consulting, insurance and security costs.<br />
other 19%<br />
labour 35%<br />
Security 5%<br />
insurance 6%<br />
consulting 6%<br />
New post employment<br />
benefits 5%<br />
Expenses related to<br />
shares offering 24%<br />
50<br />
25<br />
0<br />
Volume of ore transported,<br />
thousands tonnes<br />
+41%<br />
4748<br />
6688<br />
2006 <strong>2007</strong><br />
5.1 labour costs<br />
FiNANciAl MANAGEMENT<br />
DiScuSSioN AND ANAlYSiS<br />
SEcTioN<br />
labour costs include all kind of wages<br />
and bonuses, and related social taxes for<br />
administrative personnel and senior management.<br />
in <strong>2007</strong> the average monthly<br />
payroll for managerial and administrative<br />
personnel increased by 13% compared to<br />
2006, at RuR 31,200 (app. uS$ 1,220).<br />
5.2 New<br />
post-employment<br />
benefit plans<br />
in <strong>2007</strong> we signed a new collective Bargaining<br />
Agreement with our employees<br />
for a three-year term, which introduced<br />
several post-employment benefits for<br />
employees and pensioners. These plans<br />
provide for payment of retirement benefits<br />
starting from the statutory retirement<br />
age, which is currently 55 for women and<br />
60 for men (a quarterly payment from<br />
RuR 250 to 600 depending on the length<br />
of service), payment of a lump-sum benefit<br />
upon death of current employees and<br />
pensioners (RuR 5,000) and a lump-sum<br />
payment upon retirement (equivalent to<br />
1 cASH GENERAl AND ADMiNiSTRATiVE<br />
expenses — General and administrative expenses<br />
less depreciation and amortization.<br />
8<br />
4<br />
0<br />
36
06<br />
cost reduction<br />
programme<br />
Restoring nature’s balance<br />
uRAlkAli<br />
6.1 Headcount<br />
reduction<br />
Headcount<br />
(period average), employees<br />
16,900<br />
15,140<br />
We are working continuously on a programme<br />
to increase cost efficiency. This<br />
programme is expected to be complete<br />
by 2010, and will lead to a further reduction<br />
of headcount and corresponding increase<br />
in productivity<br />
in recent years we have achieved a significant<br />
reduction in headcount. From 2003 to<br />
<strong>2007</strong> consolidated headcount of the Group<br />
decreased by 5,400 employees to 11,500,<br />
and headcount of the main production unit<br />
by 6,580 employees to 8,560.<br />
2003 2004 2005 2006 <strong>2007</strong><br />
Main production unit<br />
<strong>Uralkali</strong> group consolidation<br />
two monthly payrolls). The major part of<br />
<strong>2007</strong> expenses relates to a one-off recognition<br />
of past service in benefits payable<br />
to current pensioners. The company does<br />
not expect the costs related to these postemployment<br />
benefits will be significant in<br />
forthcoming periods.<br />
14,600 14,000<br />
13,140 12,360<br />
12,700<br />
10,170<br />
11,500<br />
8,560<br />
6.2 Power<br />
generation<br />
programme<br />
Annual report<br />
5.3 Expenses related<br />
to the share offering<br />
in october <strong>2007</strong> we made a global offering<br />
of shares on london Stock Exchange.<br />
one-off expenses related to the offering<br />
include fees paid to legal and financial<br />
consultants and bonuses paid to senior<br />
management upon the successful listing.<br />
We are currently implementing a power<br />
generation programme, which we expect<br />
to be fully operational by 2009. We aim<br />
to reduce our reliance on external sources<br />
of electricity by building our own power<br />
generation facility using electricity turbines<br />
powered by natural gas.<br />
in 1Q2008 we launched the first two<br />
electricity generation turbines at Production<br />
unit 4 and we are planning to launch<br />
another two in 2009. We estimate that<br />
after the full implementation of this programme<br />
we will achieve energy cost savings<br />
of approximately RuR 50 per tonne<br />
of potash production.<br />
20,000<br />
10,000<br />
0<br />
37
Annual report<br />
EBiDTA discussion<br />
51 %<br />
8,558<br />
Adj.<br />
EBITDA<br />
2006<br />
+7 %<br />
+2,753<br />
Volume<br />
of sales<br />
increase<br />
07<br />
EBiTDA<br />
discussion 1<br />
08<br />
Mine flooding<br />
costs<br />
+3,247<br />
Price<br />
increase<br />
60 %<br />
+6 % -4 %<br />
-869<br />
Budgeted<br />
costs<br />
increase<br />
<strong>2007</strong><br />
-4 %<br />
-1,006<br />
One-off<br />
costs<br />
-3 %<br />
-586<br />
Increase in<br />
Labour in<br />
2H <strong>2007</strong><br />
in <strong>2007</strong> adjusted EBiTDA increased by<br />
41% in comparison to 2006. The main<br />
reasons behind this EBiTDA growth in<br />
<strong>2007</strong> were the growing volumes and<br />
prices, partly offset by the budgeted cost<br />
increase and one-off costs relating to the<br />
successful share offering. These one-off<br />
on october 28, 2006 we stopped production<br />
operations in Mine 1 due to an increase<br />
in the inflow of natural groundwater<br />
to the level where we could not control it.<br />
According to a governmental commission,<br />
the cause of flooding was a previously unknown<br />
anomaly of geological structure<br />
and has consequently been determined<br />
to be beyond the control of the company<br />
(force majeure).<br />
in order to substantially reduce the risk of<br />
subsidence within the town of Berezniki,<br />
we began the injection of brine into the<br />
1 ADJuSTED EBiTDA REPRESENTS oPERATiNG profit<br />
plus depreciation and amortisation. Adj. EBiTDA does not<br />
reflect the impact of finance income and expenses and<br />
mine flooding costs<br />
53 %<br />
12,098<br />
Adj.<br />
EBITDA<br />
<strong>2007</strong><br />
15,000<br />
12,000<br />
9,000<br />
6,000<br />
3,000<br />
0<br />
FiNANciAl MANAGEMENT<br />
DiScuSSioN AND ANAlYSiS<br />
SEcTioN<br />
expenses and increase in labour costs decreased<br />
the level of EBiTDA margin from<br />
60% down to 53%, which is still a good<br />
result. For 2008 and the coming years we<br />
believe the EBiTDA margin will far exceed<br />
the record level of 2005, and this level will<br />
be sustainable in the long-term.<br />
cavities in 2006, as advised by the governmental<br />
commission and institute of Geological<br />
Sciences. We expect most of the<br />
cavities in Mine 1 to be filled with water<br />
during the next three years given expected<br />
natural groundwater inflow of 3,000 cubic<br />
metres per hour. A technical plan for brine<br />
injection operations prepared in 2006 for<br />
<strong>2007</strong> was based on our maximum brine<br />
production capacity. Based on this technical<br />
plan and best estimates, the management<br />
as at December 31, 2006 estimated<br />
a provision for present value of cash out-<br />
38
Restoring nature’s balance<br />
09<br />
cAPEX<br />
Capital<br />
expenditure 1 , RURbn<br />
1.5<br />
uRAlkAli<br />
2003 2004 2005 2006 <strong>2007</strong><br />
Expansion<br />
Maintenance<br />
2.0<br />
5.7<br />
flows to be incurred by these brine injection<br />
operations.<br />
in <strong>2007</strong> the Group performed brine injection<br />
operations pursuant to the plan. However,<br />
in october <strong>2007</strong> the natural groundwater<br />
inflow increased to 7000 – 8000<br />
cubic metres per hour. in December <strong>2007</strong><br />
the institute of Geological Sciences issued<br />
an expert opinion that further brine injection<br />
operations would be impractical. in<br />
December <strong>2007</strong> the management of the<br />
Group agreed with the State authorities<br />
to cease brine injection operations and re-<br />
in <strong>2007</strong> uralkali continued to execute its<br />
capital expenditure (cAPEX) programme.<br />
Total cAPEX amounted to RuR 6,316M<br />
and mainly was attributable to expansion<br />
cAPEX, maintenance cAPEX, and cost<br />
reduction.<br />
Expansion and cost reduction cAPEX<br />
amounted to approximately half of all<br />
capital expenditures. Main projects included:<br />
second production line on Plant 4;<br />
additional flotation equipment at Plant-2;<br />
additional granulation capacities, power<br />
generation and infrastructure.<br />
5.2<br />
6.3<br />
1 NoT iNcluDiNG Mine-5 greenfield project. For description<br />
of our greenfield project see ust-Yayvo section<br />
6<br />
4<br />
2<br />
0<br />
Annual report<br />
leased the remaining balance of the mine<br />
flooding provision. The brine injection<br />
operations were stopped on January 12,<br />
2008.<br />
Mine flooding costs include the costs related<br />
with write-off of fixed assets at Mine<br />
1, dismantling costs, monitoring costs and<br />
changes in brine injection provision. in<br />
<strong>2007</strong> we recognized income of RuR 274M<br />
in respect of mine flooding mainly due to<br />
release of the provision for brine injection<br />
described above.<br />
The second production line on Plant 4 is<br />
one of the major expansion projects, and<br />
is expected to increase our production capacity<br />
significantly. Plant 4 was constructed<br />
in 1987 and has one of the biggest<br />
potash mines in the world with potential<br />
capacity of 19 million tonnes of ore a year.<br />
The first production line was operational<br />
from the time of the plant’s construction.<br />
The plan is for the second to become operational<br />
by 2010. This line will contribute<br />
an additional 1.5 Mt. of potash production.<br />
We plan to achieve this expansion at<br />
the cheapest price in industry — only uS$<br />
160 per tonne of expansion.<br />
Additionally we plan to install new granulation<br />
equipment in 2008 –2009, which<br />
will increase our capacity for granulated<br />
product by 470,000 tonnes up to 1.7 Mt<br />
per year. We also plan to implement our<br />
storage capital expenditure programme<br />
to increase warehouse capacity by more<br />
than 150,000 tonnes of potash by 2011.<br />
in the first half of 2009 we plan to complete<br />
a power generation programme,<br />
which aims is to reduce energy-related<br />
costs by operating our own electricity<br />
generation turbines. This power generation<br />
programme will cost us uS$ 2,000<br />
per 1 MgW of capacity and will bring cost<br />
savings of approximately uS$2 per tonne<br />
of potash production in 2011. See “cost<br />
reduction programme — Power Generation<br />
Programme” for more details.<br />
in the recent years we have made sustainable<br />
capital investments in capacity,<br />
39
Annual report<br />
Expansion CAPEX, <strong>2007</strong><br />
infrastructure 22%<br />
Additional flotation machine<br />
ad Plant-2 (+150 kt) 6%<br />
Maintenance CAPEX, <strong>2007</strong><br />
Processing facilties<br />
39%<br />
liquidation of<br />
flooding 8%<br />
<strong>2007</strong><br />
and renewal of equipment. in 2006 we<br />
completed the fourth production section<br />
on Plant 3, with additional capacity<br />
of 440,000 tonnes per year. in 1Q <strong>2007</strong><br />
we completed the installation of additional<br />
flotation equipment on Plant 2 with<br />
150,000 tonnes of additional capacity per<br />
year. These projects allowed us to produce<br />
5.1 Mt. in <strong>2007</strong> and to raise our production<br />
projection for 2008 up to 5.3 Mt.<br />
Expansion was achieved on the cheapest<br />
Second line at Plant-4<br />
(+1,5 kt) 41%<br />
Additional granulation<br />
(+400 kt) 7%<br />
Power generation<br />
programme 24%<br />
infrastructure 12%<br />
other 9%<br />
Transport 9%<br />
1t k2o (nutrient)<br />
is equal to around<br />
1.67t kcl (product)<br />
Mining<br />
facilites 23%<br />
K2O<br />
FiNANciAl MANAGEMENT<br />
DiScuSSioN AND ANAlYSiS<br />
SEcTioN<br />
Barley — K 2 o uptake or removal<br />
8kg per tonne of product,<br />
world annual production<br />
132 Mt, therefore annual<br />
compensation required<br />
1,056,000 tonnes of K 2 o.<br />
Cultivate actively: Usa, russia,<br />
europe.<br />
basis in the industry — approximately uS$<br />
41 per tonne.<br />
Another part of cAPEX in <strong>2007</strong> was attributed<br />
to maintenance and mainly consisted<br />
of projects related to processing and mining<br />
facilities and infrastructure.<br />
Since we are a strong cash-generating<br />
company, our cAPEX is financed by operating<br />
cash-flow.<br />
9.1 ust-<br />
Yayvo — Mine-5<br />
We estimate our new greenfield project<br />
could be executed at the cost of uS$ 800<br />
per tonne, almost two times cheaper than<br />
the average greenfield industry project.<br />
currently we are finalising the feasibility<br />
study on the construction of Mine-5<br />
in ust-Yayva. Based on the pre-feasibility<br />
study, we are planning to add 3.7 Mt of<br />
new capacity, which will increase our total<br />
production capacity up to almost 11 Mt.<br />
This project will include construction of<br />
a new mine with capacity of 15 Mt of<br />
ore per year and two plants at Ru-4 and<br />
Ru-3. We estimate the cost of Mine-5<br />
project on the level of uS$ 3 billion or<br />
uS$ 800 per tonne of production capacity.<br />
Additionally the new mine will be situated<br />
not far from Plant-3 and will supply it<br />
with ore, which will allow us to eliminate<br />
costs related to ore transportation between<br />
mines and increase cost efficiency<br />
by uS$ 17 million at current prices.<br />
40
uRAlkAli<br />
Operating cash flow vs. CAPEX, RUR bln<br />
4.1<br />
2.1<br />
2004 2005 2006 <strong>2007</strong><br />
Operating cash flow<br />
CAPEx<br />
Restoring nature’s balance<br />
9.5<br />
5.7<br />
6.6<br />
10<br />
cash flow<br />
11<br />
Dividends<br />
5.2<br />
1t k2o (nutrient)<br />
is equal to around<br />
1.67t kcl (product)<br />
8.2<br />
6.3<br />
K2O<br />
soybean — K o uptake or<br />
2<br />
removal 20 kg per tonne of<br />
product, world annual production<br />
220 Mt, therefore<br />
annual compensation required<br />
4,400,000 tonnes<br />
of K o. 2<br />
Cultivate actively: Brazil,<br />
India.<br />
Net cash generated from operations increased in <strong>2007</strong> by 24%<br />
compared to 2006 up to RuR 8,194M. in recent years the company<br />
has shown strong cash-generating capabilities and has financed<br />
its cAPEX programme by operating cash flow.<br />
As at the end of <strong>2007</strong> the company had a net debt position of<br />
RuR 3,309M (uS$ 135M).<br />
From 2006, and for the foreseeable future, we have adopted<br />
a policy of declaring and paying annual dividends of not less than<br />
15% of iFRS net income. Dividends for <strong>2007</strong> will be declared at the<br />
Annual General Meeting of shareholders, to be held in June 2008.<br />
See more in the Report on Payment of Declared (Accrued) Share<br />
Dividends section.<br />
10<br />
5<br />
0<br />
Annual report<br />
41
Annual report<br />
Corn:<br />
3064 kt<br />
compensation<br />
K 2 O<br />
<strong>2007</strong><br />
42<br />
Subtropics soils<br />
restoring nature’s balance<br />
UrAlkAli<br />
India<br />
China<br />
USA<br />
Brazil<br />
South-East<br />
Asia<br />
Subtropic<br />
soil facts<br />
25.8 mln. sq. km or<br />
19.3%of world total<br />
area<br />
52.9% reclamation<br />
17.0%world cultivated<br />
area<br />
Subtropics soils — 17% world<br />
cultivated area. The thermal<br />
conditions are perfect for<br />
cotton, rice, wheat, corn, sugar<br />
cane. it is possible to get two<br />
harvests a year.<br />
Typical soils: yellow, red,<br />
gray brown, gray desert soils,<br />
cinnamonic soils.<br />
Typical Uptake K 2 O kg World Annual K 2 O<br />
crops per 1 t of product production, Mt compensation, t<br />
Cotton 10 119 1,190,000<br />
Wheat 8.5 603 5,125,500<br />
Corn 4 766 3,064,000<br />
Sugar cane 1.32 1324 1,747,680<br />
1 t К 2 О (nutrient) is equal<br />
to around 1.67 t kCl (product)<br />
Annual report<br />
43
Annual report<br />
IFRS Consolidated<br />
Financial Statements<br />
and auditor’s report<br />
for the year ended<br />
December 31, <strong>2007</strong><br />
<strong>2007</strong><br />
independent auditor<br />
ZAo Pricewaterhouse<br />
coopers Audit<br />
kosmodamianskaya nab. 52, bld. 5<br />
115054 Moscow, Russia<br />
Telephone +7 (495) 967-6000<br />
Facsimile +7 (495) 967-6001<br />
www.pwc.ru<br />
licence #376 as of 20.05.02<br />
issued by Ministry of Finance<br />
of Russian Federation.<br />
Valid untill 20.05.12<br />
iFRS<br />
coNSoliDATED<br />
FiNANciAl<br />
STATEMENTS<br />
44
independent<br />
auditor’s report<br />
Restoring nature’s balance<br />
1<br />
2<br />
3<br />
4<br />
uRAlkAli<br />
To the Shareholders and Board<br />
of Directors of uralkali Group<br />
We have audited the accompanying consolidated financial statements of open joint stock company<br />
“uralkali” (the “company”) and its subsidiaries (the “Group”) which comprise the consolidated<br />
balance sheet as of December 31, <strong>2007</strong> and the consolidated statement of income,<br />
consolidated statement of changes in equity and consolidated statement of cash flows for the<br />
year then ended and a summary of significant accounting policies and other explanatory notes.<br />
Management’s Responsibility for the Financial Statements<br />
Management is responsible for the preparation and fair presentation of these consolidated<br />
financial statements in accordance with international Financial Reporting Standards. This<br />
responsibility includes: designing, implementing and maintaining internal control relevant<br />
to the preparation and fair presentation of financial statements that are free from material<br />
misstatement, whether due to fraud or error; selecting and applying appropriate accounting<br />
policies; and making accounting estimates that are reasonable in the circumstances.<br />
Auditor’s Responsibility<br />
our responsibility is to express an opinion on these consolidated financial statements<br />
based on our audit. We conducted our audit in accordance with international Standards<br />
on Auditing. Those Standards require that we comply with ethical requirements and<br />
plan and perform the audit to obtain reasonable assurance whether the financial statements<br />
are free from material misstatement.<br />
An audit involves performing procedures to obtain audit evidence about the amounts and<br />
disclosures in the financial statements. The procedures selected depend on the auditor’s<br />
judgment, including the assessment of the risks of material misstatement of the financial<br />
statements, whether due to fraud or error. in making those risk assessments, the auditor<br />
considers internal control relevant to the entity’s preparation and fair presentation of the<br />
financial statements in order to design audit procedures that are appropriate in the circumstances,<br />
but not for the purpose of expressing an opinion on the effectiveness of the<br />
entity’s internal control. An audit also includes evaluating the appropriateness of accounting<br />
policies used and the reasonableness of accounting estimates made by management,<br />
as well as evaluating the overall presentation of the financial statements.<br />
We believe that the audit evidence we have obtained is sufficient and appropriate to<br />
provide a basis for our audit opinion.<br />
Opinion<br />
in our opinion, the accompanying consolidated financial statements present fairly, in<br />
all material respects, the financial position of the Group as of December 31, <strong>2007</strong>, and<br />
its financial performance and its cash flows for the year then ended in accordance with<br />
international Financial Reporting Standards.<br />
Moscow, Russian Federation<br />
April 14, 2008<br />
ZAo Pricewaterhousecoopers Audit<br />
kosmodamianskaya nab. 52, bld. 5<br />
115054 Moscow, Russia<br />
Telephone +7 (495) 967-6000<br />
Facsimile +7 (495) 967-6001<br />
www.pwc.ru<br />
1 The firm is an authorized licensee of the tradename and logo of Pricewaterhousecoopers.<br />
Annual report<br />
1<br />
45
Assets<br />
Annual report<br />
<strong>Uralkali</strong> Group<br />
Consolidated balance sheet as of December 31, <strong>2007</strong><br />
(in millions of Russian Roubles unless otherwise stated)<br />
Approved on behalf of the Board<br />
of Directors<br />
April 11, 2008<br />
<strong>2007</strong><br />
President _____________________<br />
The accompanying notes form an integral part of these consolidated financial statements<br />
iFRS<br />
coNSoliDATED<br />
FiNANciAl<br />
STATEMENTS<br />
Non-current assets:<br />
Property, plant and equipment 8 24,205 20,162<br />
Goodwill 10 366 366<br />
intangible assets 11 147 171<br />
Restricted cash 14 - 80<br />
Related parties loans 6 - 2,659<br />
Financial assets 223 248<br />
Total non-current assets 24,941 23,686<br />
Current assets:<br />
inventories 12 1,522 1,481<br />
Trade and other receivables 13 5,875 4,375<br />
current income tax prepayments 6 253<br />
Related parties loans 6 - 431<br />
cash and cash equivalents 14 7,291 2,812<br />
Total current assets 14,694 9,352<br />
Total assets 39,635 33,038<br />
Equity:<br />
Share capital 15 648 648<br />
Treasury shares 15 (12) (9)<br />
Share premium/(discount) (849) (514)<br />
Revaluation reserve 150 150<br />
cumulative translation reserve (478) (195)<br />
Retained earnings 25,591 17,549<br />
Equity attributable to the Company’s equity holders 25,050 17,629<br />
Minority interest 24 21<br />
Total equity 25,074 17,650<br />
Liabilities<br />
Note December 31, <strong>2007</strong> December 31, 2006<br />
Non-current liabilities:<br />
Borrowings 17 6,444 3,555<br />
Post employment benefits obligations 28 247 28<br />
Mine flooding provision 16 23 679<br />
Deferred income tax liability 27 396 423<br />
Total non-current liabilities 7,110 4,685<br />
Current liabilities:<br />
Borrowings 17 4,621 8,040<br />
Trade and other payables 18 2,400 2,487<br />
current income tax payable 252 10<br />
other taxes payable 178 166<br />
Total current liabilities 7,451 10,703<br />
Total liabilities 14,561 15,388<br />
Total liabilities and equity 39,635 33,038<br />
Finance<br />
Vice-President _____________________<br />
46
<strong>Uralkali</strong> Group<br />
Consolidated statement of income for the year ended December 31, <strong>2007</strong><br />
(in millions of Russian Roubles unless otherwise stated)<br />
The accompanying notes form an integral part of these consolidated financial statements.<br />
Restoring nature’s balance<br />
uRAlkAli<br />
Note <strong>2007</strong> 2006<br />
Revenues 19 29,499 22,290<br />
cost of sales 20 (7,108) (6,307)<br />
Gross profit 22,391 15,983<br />
Distribution costs 21 (7,957) (6,691)<br />
General and administrative expenses 22 (3,473) (2,058)<br />
Taxes other than income tax (283) (258)<br />
other operating expenses 24 (556) (426)<br />
Operating profit 10,122 6,550<br />
Mine flooding costs 26 274 (2,054)<br />
Finance income 25 1,251 914<br />
Finance expense 25 (1,524) (1,084)<br />
Profit before income tax 10,123 4,326<br />
income tax expense 27 (2,078) (832)<br />
Profit for the year 8,045 3,494<br />
Profit is attributable to:<br />
Equity holders of the company 8,042 3,494<br />
Minority interest 3 -<br />
Net profit for the year 8,045 3,494<br />
Earnings per share — basic and diluted (in RR) 29 3,83 1,66<br />
Annual report<br />
47
Annual report<br />
<strong>Uralkali</strong> Group<br />
Consolidated statement of cash flows for the year ended December 31, <strong>2007</strong><br />
(in millions of Russian Roubles unless otherwise stated)<br />
The accompanying notes form an integral part of these consolidated financial statements<br />
<strong>2007</strong><br />
iFRS<br />
coNSoliDATED<br />
FiNANciAl<br />
STATEMENTS<br />
Note <strong>2007</strong> 2006<br />
Cash flows from operating activities<br />
Profit before income tax and minority interest 10,123 4,326<br />
Adjustments for:<br />
Depreciation of property, plant and equipment<br />
and amortization of intangible assets 1,976 2,008<br />
Net loss/(gain) on disposal of property, plant and equipment 24 215 (2)<br />
loss on fixed assets disposed on mine flooding 26 64 1,208<br />
impairment of trade and other receivables 24 13 20<br />
Net change in provision for earth replacement and mine flooding (656) 483<br />
Finance income and expense, net 523 317<br />
Foreign exchange gains 25 (498) (286)<br />
Operating cash flows before working capital changes 11,760 8,074<br />
(increase)/decrease in trade and other receivables (1,740) 9<br />
increase in inventories (41) (48)<br />
increase in accounts payable, accrued expenses and other creditors 538 128<br />
increase/(decrease) in other taxes payable 12 (18)<br />
Cash generated from operations 10,529 8,145<br />
interest paid 17 (725) (521)<br />
income taxes paid (1,610) (998)<br />
Net cash generated from operating activities 8,194 6,626<br />
Cash flows from investing activities<br />
Purchase of intangible assets 11 (47) (23)<br />
Purchase of property, plant and equipment (6,073) (5,232)<br />
Proceeds from sales of property, plant and equipment 22 351<br />
Sale of investments, net 16 27<br />
Decrease/(increase) in restricted cash balances 14 27 (125)<br />
loans issued to related party (753) (4,034)<br />
Repayment of loans issued to related party 3,575 1,194<br />
Dividends and interest received 261 196<br />
Net cash used in investing activities (2,972) (7,646)<br />
Cash flows from financing activities<br />
Repayments of borrowings 17 (8,257) (3,808)<br />
Proceeds from borrowings 17 8,188 11,891<br />
Acquisition of treasury shares 15 (79) (234)<br />
Finance lease payments 17 (38) (38)<br />
Dividends paid to shareholders (552) (7,959)<br />
Net cash used in financing activities (738) (148)<br />
Effect of foreign exchange rate changes on cash and cash equivalents (58) (141)<br />
Net increase/(decrease) in cash and cash equivalents 4,426 (1,309)<br />
Cash and cash equivalents at the beginning<br />
of the year, net of restricted cash 14 2,767 4,076<br />
Cash and cash equivalents at the end of the year, net of restricted cash 14 7,193 2,767<br />
48
Restoring nature’s balance<br />
uRAlkAli<br />
<strong>Uralkali</strong> Group<br />
Consolidated statement of changes in equity for the year ended December 31, <strong>2007</strong><br />
(in millions of Russian Roubles unless otherwise stated)<br />
Share capital<br />
(Note 15)<br />
Treasury shares<br />
(Note 15)<br />
Balance at January 1, 2006 648 (6) (288) 150 45 17,409 17,958 21 17,979<br />
Translation movement - - - - (240) - (240) - (240)<br />
Net income recognised<br />
directly in equity - - - - (240) - (240) - (240)<br />
Net income for the year<br />
Total recognised income<br />
- - - - - 3,494 3,494 - 3,494<br />
for the year - - - - (240) 3,494 3,254 - 3,254<br />
Dividends declared (Note 15)<br />
Acquisition of treasury shares<br />
- - - - - (3,354) (3,354) - (3,354)<br />
(Note 15) - (3) (226) - - - (229) - (229)<br />
Balance<br />
at December 31, 2006 648 (9) (514) 150 (195) 17,549 17,629 21 17,650<br />
Balance at January 1, <strong>2007</strong> 648 (9) (514) 150 (195) 17,549 17,629 21 17,650<br />
Translation movement<br />
Net income recognised<br />
- - - - (283) - (283) - (283)<br />
directly in equity - - - - (283) - (283) - (283)<br />
Net income for the year<br />
Total recognised income<br />
- - - - - 8,042 8,042 3 8,045<br />
for the year<br />
Acquisition of treasury shares<br />
- - - - (283) 8,042 7,759 3 7,762<br />
(Note 15) - (3) (335) - - - (338) - (338)<br />
Balance at December 31, <strong>2007</strong> 648 (12) (849) 150 (478) 25,591 25,050 24 25,074<br />
The accompanying notes form an integral part of these consolidated financial statements.<br />
Attributable to equity holders of the Company<br />
Share premium/<br />
(discount)<br />
Revaluation<br />
reserve<br />
Cumulative<br />
translation<br />
reserve<br />
Retained<br />
earnings<br />
Total<br />
attributable to<br />
equity holders<br />
Minority<br />
interest<br />
Annual report<br />
Total<br />
equity<br />
49
Annual report<br />
01<br />
The uralkali Group<br />
and its operations<br />
<strong>2007</strong><br />
Notes<br />
to the consolidated<br />
financial statements<br />
for the year ended<br />
December 31, <strong>2007</strong><br />
(in Millions of Russian Roubles unless<br />
otherwise stated)<br />
iFRS<br />
coNSoliDATED<br />
FiNANciAl<br />
STATEMENTS<br />
JSc “uralkali” (the “company”) and its subsidiaries (together the “Group”) produce<br />
mineral fertilisers, primarily potassium based, which are extracted and processed<br />
in the vicinity of the city of Berezniki, Russia, and which are distributed both in domestic<br />
and foreign markets. The Group manufactures around 10 types of products, the most<br />
significant of which is a wide range of potassium salts. The Group produces approximately<br />
9.2% (for the year ended December 31, 2006: 8.3%) of the global volumes<br />
of potassium fertilisers and is one of two major potash manufacturers in the Russian<br />
Federation. For the year ended December 31, <strong>2007</strong> approximately 91% (for the year<br />
ended December 31, 2006: 90%) of potash fertiliser production is exported.<br />
The company holds operating licenses for the extraction of potassium, magnesium<br />
and sodium salts issued by authorities of Perm region. All the licenses expire in<br />
2013 except for the “Verhnekamskoe” mine “ust’-Yaivinskoe” license, which expires<br />
in 2024, however based on the statutory license regulation and prior experience the<br />
management of the company believes that licenses will be prolonged without any<br />
significant cost.<br />
The company was incorporated as an open joint stock company in the Russian<br />
Federation on october 14, 1992. The principal subsidiaries and joint-ventures are disclosed<br />
in Note 9. All the companies of the Group are incorporated under the laws of the<br />
Russian Federation with the exception of llc “SP Terminal”, a company incorporated<br />
under the laws of the ukraine, “uralkali Trading SA”, a company incorporated in Switzerland,<br />
“uralkali Trading (Gibraltar) ltd.”, a company incorporated in Gibraltar. JSc<br />
“Belorussian Potash company“ (“BPc”) is a company incorporated in Belorussia.<br />
As of December 31, <strong>2007</strong> “Madura Holdings limited”, registered in cyprus,<br />
was a parent company of the Group. The Group is ultimately controlled by Dmitry<br />
Rybolovlev.<br />
The registered office of the company is 63 Pyatiletki, Berezniki, Perm region, Russian<br />
Federation. All of the Group’s productive capacities and all long-term assets are<br />
located in the Russian Federation.<br />
As of December 31, <strong>2007</strong> the Group employed approximately 11.8 thousand employees<br />
(December 31, 2006: 11.5 thousand).<br />
50
02<br />
Basis of preparation<br />
and significant<br />
accounting policies<br />
Restoring nature’s balance<br />
uRAlkAli<br />
The principal accounting policies applied in the preparation of these consolidated<br />
financial statements are set out below. These policies have been consistently applied to<br />
all the periods presented, unless otherwise stated.<br />
2.1 Basis of preparation<br />
These consolidated financial statements have been prepared in accordance with international<br />
Financial Reporting Standards (“iFRS”) under the historical cost convention except<br />
for certain financial instruments that are presented at fair value as described in Note 2.14.<br />
Group companies maintain their accounting records in Russian Roubles (“RR”) and<br />
prepare their statutory financial statements in accordance with the Federal law on Accounting<br />
of the Russian Federation, except for “uralkali Trading SA”, “uralkali Trading<br />
(Gibraltar) ltd.”, “SP Terminal”. “uralkali Trading SA” and “uralkali Trading (Gibraltar)<br />
ltd”. maintain its accounting records in uS Dollars (“uS$”) and prepare their financial<br />
statements in accordance with iFRS. “SP Terminal” maintains its accounting records in<br />
“ukrainian hryvnya” (“uAH”) and in accordance with ukraine laws and Regulations.<br />
“BPc” maintains its accounting records in Belorussian Roubles (“BYR”) and in accordance<br />
with Belorussian laws and Regulations. These consolidated financial statements<br />
are based on the statutory records, with adjustments and reclassifications recorded for<br />
the purpose of fair presentation in accordance with iFRS.<br />
2.2 Accounting for the effect of inflation<br />
The Russian Federation has previously experienced relatively high levels of inflation<br />
and was considered to be hyperinflationary as defined by iAS 29 “Financial Reporting<br />
in Hyperinflationary Economies”. iAS 29 requires that financial statements prepared in<br />
the currency of a hyperinflationary economy be stated in terms of the measuring unit<br />
current at the balance sheet date. Hyperinflation in the Russian Federation ceased effective<br />
from January 1, 2003. Restatement procedures of iAS 29 are therefore only applied<br />
to assets acquired or revalued and liabilities incurred or assumed prior to that date. For<br />
these balances, the amounts expressed in the measuring unit current at December 31,<br />
2002 are treated as the basis for the carrying amounts in these consolidated financial<br />
statements.<br />
2.3 Reclassifications certain reclassifications have been made to prior year balances in the consolidated<br />
balance sheet, statement of income and cash flows to conform to the current period<br />
presentation.<br />
2.4 Consolidated financial statements<br />
Subsidiaries are those companies and other entities in which the Group, directly or<br />
indirectly, has an interest of more than one half of the voting rights or otherwise has power<br />
to govern the financial and operating policies so as to obtain economic benefits.<br />
The existence and effect of potential voting rights that are presently exercisable or<br />
presently convertible are considered when assessing whether the Group controls another<br />
entity. Subsidiaries are consolidated from the date on which control is transferred to the<br />
Group (acquisition date) and are deconsolidated from the date that control ceases.<br />
Annual report<br />
51
Annual report<br />
<strong>2007</strong><br />
iFRS<br />
coNSoliDATED<br />
FiNANciAl<br />
STATEMENTS<br />
The purchase method of accounting is used to account for the acquisition of subsidiaries.<br />
The cost of an acquisition is measured at the fair value of the assets given up,<br />
equity instruments issued and liabilities incurred or assumed at the date of exchange,<br />
plus costs directly attributable to the acquisition. The date of exchange is the acquisition<br />
date where a business combination is achieved in a single transaction, and is the date of<br />
each share purchase where a business combination is achieved in stages by successive<br />
share purchases.<br />
The excess of the cost of acquisition over the fair value of the net assets of the acquiree<br />
at each exchange transaction represents goodwill. The excess of the acquirer’s<br />
interest in the net fair value of the identifiable assets, liabilities and contingent liabilities<br />
acquired over cost (”negative goodwill”) is recognised immediately in profit or loss.<br />
identifiable assets acquired and liabilities and contingent liabilities assumed in a business<br />
combination are measured at their fair values at the acquisition date.<br />
intercompany transactions, balances and unrealized gains on transactions between<br />
group companies are eliminated. unrealized losses are also eliminated but considered<br />
an impairment indicator of the assets transferred. The company and all of its subsidiaries<br />
use uniform accounting policies consistent with the Group’s policies.<br />
2.5 Minority interest Minority interest is that part of the net results and of the net assets of a subsidiary,<br />
including the fair value adjustments, which is attributable to interests which are not<br />
owned, directly or indirectly, by the Group. Minority interest forms a separate component<br />
of the Group’s equity.<br />
Difference, if any, between the carrying amount of a minority interest and the<br />
amount paid to acquire the relevant share is recognized as goodwill.<br />
Disposals to minority interests result in gains and losses for the Group that are recorded<br />
in statement of income.<br />
2.6 Joint ventures Jointly controlled entities<br />
A joint venture is a contractual arrangement whereby two or more parties undertake<br />
an economic activity, which is subject to joint control. investments in joint ventures<br />
are accounted for by the equity method of accounting. unrealized gains on transactions<br />
between the Group and its joint ventures are eliminated to the extent of the Group’s<br />
interest in the joint ventures; unrealized losses are also eliminated unless the transaction<br />
provides evidence of an impairment of the asset transferred.<br />
2.7 Investments in associates<br />
Associates are entities over which the Group has significant influence, but not control,<br />
generally accompanying a shareholding of between 20 and 50 percent of the voting<br />
rights. investments in associates are accounted for by the equity method of accounting<br />
and are initially recognized at cost. The carrying amount of associates includes goodwill<br />
identified on acquisition less accumulated impairment losses, if any. The Group’s share<br />
of the post-acquisition profits or losses of associates is recorded in the consolidated<br />
statement of income, and its share of post-acquisition movements in reserves is recognized<br />
in reserves. When the Group’s share of losses in an associate equals or exceeds<br />
its interest in the associate, including any other unsecured receivables, the Group does<br />
not recognize further losses, unless it has incurred obligations or made payments on<br />
behalf of the associate.<br />
unrealized gains on transactions between the Group and its associates are eliminated<br />
to the extent of the Group’s interest in the associates; unrealized losses are also<br />
eliminated unless the transaction provides evidence of an impairment of the asset<br />
transferred.<br />
52
uRAlkAli<br />
2.8 Property, plant and equipment<br />
Property, plant and equipment acquired or constructed prior to January 1, 1997<br />
is recorded at the amounts determined by an independent valuation as of January 1,<br />
1997 less accumulated depreciation and impairment. Property, plant and equipment<br />
acquired or constructed subsequent to January 1, 1997 is recorded at cost less accumulated<br />
depreciation. cost includes all costs directly attributable to bringing the asset<br />
to its working condition for its intended use.<br />
The amounts determined by the independent valuation represent gross replacement<br />
cost less accumulated depreciation to arrive at an estimate of depreciated replacement<br />
cost. This independent valuation was performed in order to determine a basis<br />
for cost because the historical accounting records for property, plant and equipment,<br />
which were required for the purposes of iFRS financial statements preparation, were<br />
not available. Therefore, this independent valuation is not a recurring feature, since it<br />
was intended to determine the historical costs. The changes in carrying value arising<br />
from this valuation were recorded directly to retained earnings.<br />
At each reporting date management assess whether there is any indication of impairment<br />
of property, plant and equipment. if any such indication exists, the management estimates<br />
the recoverable amount, which is determined as the higher of an asset’s fair value<br />
less costs to sell and its value in use. The carrying amount is reduced to the recoverable<br />
amount and the impairment loss is recognised in the statement of income. An impairment<br />
loss recognised for an asset in prior years is reversed if there has been a change in the<br />
estimates used to determine the asset’s value in use and fair value less costs to sell.<br />
Repair and maintenance expenditure is expensed as incurred. Major renewals and<br />
improvements are capitalised. Gains and losses on disposals determined by comparing<br />
proceeds with carrying amount are recognised in profit or loss.<br />
Depreciation on property, plant and equipment items is calculated using the<br />
straight-line method to allocate their cost to their residual values over their estimated<br />
useful lives:<br />
Restoring nature’s balance<br />
Useful lives in years<br />
Buildings 30 to 45<br />
Mine development costs 10 to 30<br />
Plant and equipment 4 to 15<br />
Transport 5 to 15<br />
others 5 to 15<br />
land Not depreciated<br />
The residual value of an asset is the estimated amount that the Group would currently<br />
obtain from disposal of the asset less the estimated costs of disposal, if the asset<br />
were already of the age and in the condition expected at the end of its useful life. The<br />
residual value of an asset is nil if the Group expects to use the asset until the end of its<br />
physical life. The assets’ residual values and useful lives are reviewed, and adjusted if<br />
appropriate, at each balance sheet date.<br />
2.9 Operating leases leases where a significant portion of the risks and rewards of ownership are retained<br />
by the lessor are classified as operating leases. Payments made under operating leases<br />
(net of any incentives received from the lessor) are charged to the consolidated statement<br />
of income.<br />
Annual report<br />
53
Annual report<br />
<strong>2007</strong><br />
iFRS<br />
coNSoliDATED<br />
FiNANciAl<br />
STATEMENTS<br />
2.10 Finance lease liabilities<br />
Where the Group is a lessee in a lease which transferred substantially all the risks and<br />
rewards incidental to ownership to the Group, the assets leased are capitalised in property,<br />
plant and equipment at the commencement of the lease at the lower of the fair value of the<br />
leased asset and the present value of the minimum lease payments. Each lease payment is<br />
allocated between the liability and finance charges so as to achieve a constant rate on the<br />
finance balance outstanding. The corresponding rental obligations, net of future finance<br />
charges, are included in borrowings. The interest cost is charged to the income statement<br />
over the lease period using the effective interest method. The assets acquired under finance<br />
leases are depreciated over their useful life or the shorter lease term if the Group is not reasonably<br />
certain that it will obtain ownership by the end of the lease term.<br />
2.11 Goodwill<br />
Goodwill represents the excess of the cost of an acquisition over the fair value of<br />
the acquirer’s share of the net identifiable assets, liabilities and contingent liabilities of<br />
the acquired subsidiary or associate at the date of exchange. Goodwill on acquisitions<br />
of subsidiaries is presented separately in the consolidated balance sheet. Goodwill on<br />
acquisitions of associates is included in the investment in associates. Goodwill is carried<br />
at cost less accumulated impairment losses, if any.<br />
The Group tests goodwill for impairment at least annually and whenever there are<br />
indications that goodwill may be impaired. Goodwill is allocated to the cash-generating<br />
units, or groups of cash-generating units, that are expected to benefit from the synergies<br />
of the business combination. Such units or group of units represent the lowest level<br />
at which the Group monitors goodwill and are not larger than a segment.<br />
Gains or losses on disposal of an operation within a cash generating unit to which<br />
goodwill has been allocated include the carrying amount of goodwill associated with<br />
the operation disposed of, generally measured on the basis of the relative values of the<br />
operation disposed of and the portion of the cash-generating unit which is retained.<br />
2.12 Other intangible assets<br />
Expenditure on software, patents, trademarks, mineral and non-mineral licences is<br />
capitalised and amortised using the straight-line method over their useful lives.<br />
if impaired, the carrying amount of intangible assets is written down to the higher<br />
of value in use and fair value less cost to sell.<br />
2.13 Classification of financial assets<br />
The Group classifies its financial assets into the following measurement categories:<br />
trading, available-for-sale, held to maturity and loans and receivables.<br />
Trading investments are securities or other financial assets, which are either acquired<br />
for generating a profit from short-term fluctuations in price or trader’s margin, or are<br />
included in a portfolio in which a pattern of short-term trading exists.<br />
The Group classifies financial assets into trading investments if it has an intention to<br />
sell them within a short period after acquisition. Trading investments are not reclassified<br />
out of this category even when the Group’s intentions subsequently change.<br />
loans and receivables are unquoted non-derivative financial assets with fixed or determinable<br />
payments other than those that the Group intends to sell in the near term.<br />
Held to maturity classification includes quoted non-derivative financial assets with<br />
fixed or determinable payments and fixed maturities that the Group has both the intention<br />
and ability to hold to maturity. Management determines the classification of<br />
investment securities held to maturity at their initial recognition and reassesses the appropriateness<br />
of that classification at each balance sheet date.<br />
All other financial assets are included in the available-for-sale category.<br />
54
uRAlkAli<br />
2.14 Initial recognition of financial instruments<br />
Trading investments and derivatives are initially recorded at fair value. All other financial<br />
assets and liabilities are initially recorded at fair value plus transaction costs. Fair<br />
value at initial recognition is best evidenced by the transaction price.<br />
A gain or loss on initial recognition is only recorded if there is a difference between<br />
fair value and transaction price which can be evidenced by other observable current<br />
market transactions in the same instrument or by a valuation technique whose inputs<br />
include only data from observable markets.<br />
change in fair value is recognized in profit or loss for trading investments and in<br />
equity for assets classified as available for sale.<br />
All regular way purchases and sales of financial instruments are recognized on the trade<br />
date, which is the date that the Group commits to purchase or sell the financial instrument.<br />
2.15 Derecognition of financial assets<br />
The Group derecognises financial assets when (i) the assets are redeemed or the rights to<br />
cash flows from the assets have otherwise expired, or (ii) the Group has transferred substantially<br />
all the risks and rewards of ownership of the assets, or (iii) the Group has neither transferred nor<br />
retained substantially all risks and rewards of ownership but has not retained control. control is<br />
retained if the counterparty does not have the practical ability to sell the asset in its entirety to<br />
an unrelated third party without needing to impose additional restrictions on the sale.<br />
2.16 Available-for-sale investments<br />
Available-for-sale investments are carried at fair value. interest income on available<br />
for sale debt securities is calculated using the effective interest method and recognised in<br />
profit or loss. Dividends on available-for-sale equity instruments are recognised in profit<br />
or loss when the Group’s right to receive payment is established. All other elements of<br />
changes in the fair value are deferred in equity until the investment is derecognised or impaired<br />
at which time the cumulative gain or loss is removed from equity to profit or loss.<br />
impairment losses are recognised in profit or loss when incurred as a result of one or<br />
more events (“loss events”) that occurred after the initial recognition of available-for-sale<br />
investments. A significant or prolonged decline in the fair value of an equity security below<br />
its cost is an indicator that it is impaired. The cumulative impairment loss – measured as the<br />
difference between the acquisition cost and the current fair value, less any impairment loss<br />
on that asset previously recognised in profit or loss — is removed from equity and recognised<br />
in profit or loss. impairment losses on equity instruments are not reversed through profit<br />
or loss. if, in a subsequent period, the fair value of a debt instrument classified as available<br />
for sale increases and the increase can be objectively related to an event occurring after the<br />
impairment loss was recognised in profit or loss, the impairment loss is reversed through<br />
current period’s profit or loss.<br />
2.17 Income taxes<br />
Restoring nature’s balance<br />
income taxes have been provided for in the consolidated financial statements in<br />
accordance with legislations enacted or substantively enacted by the balance sheet date<br />
in the Russian Federation for entities incorporated in the Russian Federation, in Switzerland<br />
for “uralkali Trading SA”, in Gibraltar for “uralkali Trading (Gibraltar) limited”,<br />
in ukraine for “SP Terminal” and in Belorussia for “Belorussian Potash company”. The<br />
income tax charge comprises current tax and deferred tax and is recognised in the consolidated<br />
statement of income unless it relates to transactions that are recognised, in<br />
the same or a different period, directly in equity.<br />
current tax is the amount expected to be paid to or recovered from the taxation<br />
authorities in respect of taxable profits or losses for the current and prior periods. Taxes,<br />
other than on income, are recorded within operating expenses.<br />
Annual report<br />
55
Annual report<br />
2.18 Inventories<br />
<strong>2007</strong><br />
iFRS<br />
coNSoliDATED<br />
FiNANciAl<br />
STATEMENTS<br />
Deferred income tax is provided using the balance sheet liability method for tax loss<br />
carry forwards and temporary differences arising between the tax bases of assets and liabilities<br />
and their carrying amounts for financial reporting purposes. in accordance with the<br />
initial recognition exemption, deferred taxes are not recorded for temporary differences on<br />
initial recognition of an asset or a liability in a transaction other than a business combination<br />
if the transaction, when initially recorded, affects neither accounting nor taxable profit.<br />
Deferred tax liabilities are not recorded for temporary differences on initial recognition of<br />
goodwill and subsequently for goodwill which is not deductible for tax purposes.<br />
Deferred tax balances are measured at tax rates enacted or substantively enacted at<br />
the balance sheet date which are expected to apply to the period when the temporary<br />
differences will reverse or the tax loss carry forwards will be utilised.<br />
Deferred tax assets and liabilities are netted only within the individual companies of<br />
the Group. Deferred tax assets for deductible temporary differences and tax loss carry<br />
forwards are recorded only to the extent that it is probable that future taxable profit will<br />
be available against which the deductions can be utilised.<br />
Deferred income tax is provided on post acquisition retained earnings of subsidiaries,<br />
except where the Group controls the subsidiary’s dividend policy and it is probable that<br />
the difference will not reverse through dividends or otherwise in the foreseeable future.<br />
inventories are recorded at the lower of cost and net realisable value. cost of inventory<br />
is determined on the weighted average basis. The cost of finished products and work<br />
in progress comprises raw material, direct labour, other direct costs and related production<br />
overhead (based on normal operating capacity) but excludes borrowing costs.<br />
Net realisable value is the estimated selling price in the ordinary course of business,<br />
less the cost of completion and selling expenses.<br />
2.19 Trade and other receivables<br />
Trade and other receivables are carried at amortised cost using the effective interest<br />
method. A provision for impairment of trade receivables is established when there is<br />
objective evidence that the Group will not be able to collect all amounts due according<br />
to the original terms of receivables. The amount of the provision is the difference<br />
between the asset’s carrying amount and the present value of estimated future cash<br />
flows, discounted at the original effective interest rate. The amount of the provision is<br />
recognised in the consolidated statement of income.<br />
2.20 Cash and cash equivalents<br />
cash and cash equivalents includes cash in hand, deposits held at call with banks, and<br />
other short-term highly liquid investments with original maturities of three months or less.<br />
cash and cash equivalents are carried at amortised cost using the effective interest method.<br />
Restricted balances are excluded from cash and cash equivalents for the purposes of the<br />
statement of cash flows. Restricted balances being exchanged or used to settle liability for at<br />
least twelve months after the balance sheet date are shown separately from cash and cash<br />
equivalents for the purposes of the balance sheet and included in non-current assets.<br />
Bank overdrafts which are repayable on demand form are included as a component<br />
of cash and cash equivalents.<br />
2.21 Share capital<br />
ordinary shares are classified as equity. incremental costs directly attributable to<br />
the issue of new shares, other than on a business combination, are shown in equity as a<br />
deduction, net of tax, from the proceeds. Any excess of the fair value of consideration<br />
received over the par value of shares issued is presented as a share premium.<br />
56
2.22 Treasury shares<br />
2.23 Dividends<br />
Restoring nature’s balance<br />
uRAlkAli<br />
Where any Group company purchases the company’s equity share capital, the<br />
consideration paid, including any directly attributable incremental costs (net of income<br />
taxes) is deducted from equity attributable to the company’s equity holders until the<br />
shares are cancelled, reissued or disposed of. Where such shares are subsequently sold<br />
or reissued, any consideration received, net of any directly attributable incremental<br />
transaction costs and the related income tax effects, is included in equity attributable<br />
to the company’s equity holders.<br />
Dividends are recognised as a liability and deducted from equity at the balance<br />
sheet date only if they are declared before or on the balance sheet date. Dividends<br />
are disclosed when they are proposed before the balance sheet date or proposed or<br />
declared after the balance sheet date but before the consolidated financial statements<br />
are authorised for issue.<br />
2.24 Value added tax output value added tax is payable to tax authorities on the earlier of (a) collection<br />
of the receivables from customers or (b) delivery of the goods or services to customers.<br />
input VAT is generally recoverable against output VAT upon receipt of the VAT<br />
invoice. The tax authorities permit the settlement of VAT on a net basis. VAT related to<br />
sales and purchases is recognized in the balance sheet on a gross basis and disclosed<br />
separately as an asset and liability. Where provision has been made for impairment<br />
of receivables, impairment loss is recorded for the gross amount of the debtor, including<br />
VAT.<br />
2.25 Borrowings<br />
2.26 Provisions<br />
Borrowings are initially recognized at fair value less transactions costs. Borrowings<br />
are carried at amortised cost using the effective interest method. Borrowing costs are<br />
recognised as an expense on a time proportion basis using the effective interest method.<br />
The Group does not capitalise borrowing costs. Borrowings are classified as current<br />
liabilities unless the Group has an unconditional right to defer settlement of the liability<br />
for at least 12 months after the balance sheet date.<br />
Provisions are recognized when the Group has a present legal or constructive obligation<br />
as a result of past events, and it is probable that an outflow of resources will be<br />
required to settle the obligation, and a reliable estimate of the amount can be made.<br />
Where the Group expects a provision to be reimbursed, for example by a grant from<br />
the local authorities in Berezniki, the reimbursement is recognized as a separate asset<br />
but only when the reimbursement is virtually certain.<br />
Earth replacement costs were accrued specifica lly in relation to cavities resulting from<br />
the extraction of ore beneath the town of Berezniki during mining activities (Note 5).<br />
The Group made no provision for warranties based on past experience of zero level<br />
of warranty claims.<br />
2.27 Trade and other payables<br />
Trade payables are accrued when the counterparty performed its obligations under<br />
the contract and are carried at amortised cost using the effective interest method.<br />
Annual report<br />
57
Annual report<br />
<strong>2007</strong><br />
iFRS<br />
coNSoliDATED<br />
FiNANciAl<br />
STATEMENTS<br />
2.28 Foreign currency transactions<br />
Functional and presentation currency. items included in the financial statements of<br />
each of the Group’s entities are measured using the currency of the primary economic<br />
environment in which the entity operates (‘the functional currency’). The company’s<br />
functional currency and the Group’s presentation currency is the national currency of<br />
the Russian Federation, Russian Roubles (“RR”).<br />
Transactions and balances. Foreign currency transactions are translated into the functional<br />
currency using the exchange rates prevailing at the dates of the transactions. Foreign<br />
exchange gains and losses resulting from the settlement of such transactions and<br />
from the translation at year-end official exchange rates of monetary assets and liabilities<br />
denominated in foreign currencies are recognized in the statement of income. Translation<br />
at year-end rates does not apply to non-monetary items, including equity investments.<br />
Group companies. The results and financial positions of all group entities (none of which<br />
has the currency of a hyperinflationary economy) that have a functional currency different<br />
from the presentation currency are translated to the presentation currency as follows:<br />
(i) assets and liabilities for each balance sheet presented are translated at the closing<br />
rate at the date of that balance sheet;<br />
(ii) income and expenses for each statement of income are translated at average<br />
exchange rates (unless this average is not a reasonable approximation of the cumulative<br />
effect of the rates prevailing on the transaction dates, in which case income and<br />
expenses are translated at the dates of the transactions); and<br />
(iii) all resulting exchange differences are recognised as a separate component of equity.<br />
At December 31, <strong>2007</strong>, the official rate of exchange, as determined by the The<br />
central Bank of the Russian Federation (cBRF), was uS dollar 1 = Rouble 24.55 (December<br />
31, 2006: uS dollar 1 = Rouble 26.33). The official Euro to RR exchange rate at<br />
December 31, <strong>2007</strong>, as determined by the cBRF, was Euro 1= Rouble 35.93 (December<br />
31, 2006: Euro 1 = Rouble 34.69).<br />
2.29 Revenue recognition<br />
Revenues are recognised on the date of risks transfer under appropriate iNcoTERMS specified<br />
in the sales contracts, as this is the date when the risks and rewards of ownership are transferred<br />
to the customers. For “Free on Board” (FoB) transactions title to goods transfers as soon<br />
as the goods are loaded on the ship. For “Delivery At Frontier” (DAF) transactions title to goods<br />
transfers only when goods cross the Russian border. For “Free carrier” (FcA) terms title transfers<br />
when goods are loaded on the first carrier (railway carriages). For “cost and Freight” (cFR) terms<br />
title transfers when goods pass the rail of the ship in the port of shipment.<br />
Sales of services are recognized in the accounting period in which the services are<br />
rendered.<br />
Sales are shown net of VAT and discounts, and after eliminating sales within the Group.<br />
Revenues are measured at the fair value of the consideration received or receivable.<br />
2.30 Transhipment costs Transhipment costs incurred by JSc “Baltic Bulker Terminal” (“BBT”), a 100% subsidiary<br />
whose activity is related to transhipment of fertilisers produced by the Group,<br />
presented by the Group within distribution costs. These costs include depreciation, payroll,<br />
material expenses and various general and administrative expenses.<br />
2.31 Employee benefits Wages, salaries, contributions to the Russian Federation state pension and social<br />
insurance funds, paid annual leave and sick leave, bonuses, and non-monetary benefits<br />
(such as health services and kindergarten services) are accrued in the year in which the<br />
associated services are rendered by the employees of the Group.<br />
58
2.32 Social costs<br />
2.33 Pension costs<br />
Restoring nature’s balance<br />
uRAlkAli<br />
The Group incurs employee costs related to the provision of benefits such as health<br />
services and charity costs related to various social programmes. These amounts have<br />
been charged to other operating expenses.<br />
in the normal course of business the Group contributes to the Russian Federation<br />
state pension scheme on behalf of its employees. Mandatory contributions to the governmental<br />
pension scheme are expensed when incurred.<br />
For defined benefit pension plans, the cost of providing benefits is determined using<br />
the Projected unit credit Method and is charged to the consolidated statement of income<br />
so as to spread the service cost over the service lives of the employees. An interest<br />
cost representing the unwinding of the discount rate on the scheme liabilities is charged<br />
to the consolidated statement of income. The liability recognized in the consolidated<br />
balance sheet, in respect of defined benefit pension plans, is the present value of the defined<br />
benefit obligation at the balance sheet date. The plans are not externally funded.<br />
The defined benefit obligation is calculated annually by the Group. The present value of<br />
the defined benefit obligation is determined by discounting the estimated future cash<br />
outflows using interest rates of government bonds that are denominated in a currency<br />
in which the benefits will be paid and that have terms of maturity approximating to the<br />
terms of the relevant pension liability.<br />
All actuarial gains and losses which arise in calculating the present value of the<br />
defined benefit obligation are recognized immediately in the consolidated statement<br />
of income.<br />
2.34 Earnings per share Earnings per share is determined by dividing the net income attributable to equity<br />
holders of the company by the weighted average number of participating shares outstanding<br />
during the reporting year.<br />
2.35 Segment reporting A geographical segment is engaged in providing products within a particular economic<br />
environment that are subject to risks and returns that are different from those of<br />
segments operating in other economic environments.<br />
A business segment is a group of assets and operations engaged in providing products<br />
that are subject to risks and returns that are different from those of other business<br />
segments.<br />
2.36 Research and development costs<br />
Research expenditure is recognised as an expense as incurred. costs incurred on<br />
development projects (relating to the design and testing of new or improved products)<br />
are recognised as intangible assets when it is probable that the project will be a success<br />
considering its commercial and technological feasibility, and costs can be measured<br />
reliably. other development expenditures are recognised as an expense as incurred.<br />
Development costs previously recognised as an expense are not recognised as an asset<br />
in a subsequent period. Development costs with a finite useful life that have been<br />
capitalised are amortised from the commencement of the commercial production of the<br />
product on a straight-line basis over the period of its expected benefit.<br />
Annual report<br />
59
Annual report<br />
03<br />
Adoption of new<br />
or revised standards<br />
and interpretations<br />
04<br />
New accounting<br />
pronouncements<br />
<strong>2007</strong><br />
iFRS<br />
coNSoliDATED<br />
FiNANciAl<br />
STATEMENTS<br />
certain new iFRSs became effective for the Group from January 1, <strong>2007</strong>. listed<br />
below are those new or amended standards or interpretations which are or in the future<br />
could be relevant to the Group’s operations and the nature of their impact on the<br />
Group’s accounting policies.<br />
IFRS 7, Financial Instruments: Disclosures and a complementary Amendment<br />
to IAS 1, Presentation of Financial Statements — Capital Disclosures (effective<br />
from January 1, <strong>2007</strong>). The iFRS introduced new disclosures to improve the information<br />
about financial instruments, including about quantitative aspects of risk exposures<br />
and the methods of risk management. The new quantitative disclosures provide information<br />
about the extent of exposure to risk, based on information provided internally to<br />
the entity’s key management personnel. Qualitative and quantitative disclosures cover<br />
exposure to credit risk, liquidity risk and market risk including sensitivity analysis to<br />
market risk. iFRS 7 replaced iAS 30, Disclosures in the Financial Statements of Banks and<br />
Similar Financial institutions, and some of the requirements in iAS 32, Financial instruments:<br />
Disclosure and Presentation. The Amendment to iAS 1 introduced disclosures<br />
about the level of an entity’s capital and how it manages capital. The new disclosures<br />
are made in these consolidated financial statements.<br />
Other new standards or interpretations. The following revised and issued standards<br />
were adopted in accordance with their transitional provisions and effective date<br />
and have no material impact on these consolidated financial statements:<br />
iFRic 7, Applying the Restatement Approach under iAS 29 “Financial Reporting in<br />
Hiperinflationary Economies” (effective for periods beginning on or after March 1,<br />
2006, that is from January 1, <strong>2007</strong>).<br />
iFRic 8, Scope of iFRS 2 (effective for periods beginning on or after May 1, 2006,<br />
that is from January 1, <strong>2007</strong>).<br />
iFRic 9, Reassessment of Embedded Derivatives (effective for annual periods beginning<br />
on or after June 1, 2006).<br />
iFRic 10, interim Financial Reporting and impairment (effective for annual periods<br />
beginning on or after November 1, 2006).<br />
certain new standards and interpretations have been published that are mandatory<br />
for the Group’s accounting periods beginning on or after January 1, 2008 or later<br />
periods and which the entity has not early adopted:<br />
IFRS 8, Operating Segments (effective for annual periods beginning on or after<br />
January 1, 2009). The standard applies to entities whose debt or equity instruments<br />
are traded in a public market or that file, or are in the process of filing, their financial<br />
statements with a regulatory organisation for the purpose of issuing any class of instruments<br />
in a public market. iFRS 8 requires an entity to report financial and descriptive<br />
information about its operating segments and specifies how an entity should report<br />
such information. The Group is currently assessing what impact the standard will have<br />
on segment disclosures in the consolidated financial statements.<br />
Puttable financial instruments and obligations arising on liquidation—IAS 32 and<br />
IAS 1 Amendment (effective from January 1, 2009). The amendment requires classification<br />
as equity of some financial instruments that meet the definition of a financial liability.<br />
The Group does not expect the amendment to affect its consolidated financial statements.<br />
IAS 23, Borrowing Costs (revised March <strong>2007</strong>; effective for annual periods beginning<br />
on or after January 1, 2009). The revised iAS 23 was issued in March <strong>2007</strong>.<br />
The main change to iAS 23 is the removal of the option of immediately recognising as<br />
an expense borrowing costs that relate to assets that take a substantial period of time<br />
to get ready for use or sale. An entity is, therefore, required to capitalise such borrowing<br />
costs as part of the cost of the asset.<br />
The revised standard applies prospectively to borrowing costs relating to qualifying<br />
assets for which the commencement date for capitalisation is on or after January 1,<br />
2009. The Group is currently assessing what impact the standard will have the consolidated<br />
financial statements.<br />
60
Restoring nature’s balance<br />
uRAlkAli<br />
IAS 1, Presentation of Financial Statements (revised September <strong>2007</strong>; effective<br />
for annual periods beginning on or after January 1, 2009). The main change in<br />
iAS 1 is the replacement of the income statement by a statement of comprehensive income<br />
which will also include all non-owner changes in equity, such as the revaluation of<br />
available-for-sale financial assets. Alternatively, entities will be allowed to present two<br />
statements: a separate income statement and a statement of comprehensive income.<br />
The revised iAS 1 also introduces a requirement to present a statement of financial position<br />
(balance sheet) at the beginning of the earliest comparative period whenever the<br />
entity restates comparatives due to reclassifications, changes in accounting policies, or<br />
corrections of errors. The Group expects the revised iAS 1 to affect the presentation of<br />
its financial statements but to have no impact on the recognition or measurement of<br />
specific transactions and balances.<br />
IAS 27, Consolidated and Separate Financial Statements (revised January<br />
2008; effective for annual periods beginning on or after July 1, 2009). The revised<br />
iAS 27 will require an entity to attribute total comprehensive income to the owners of<br />
the parent and to the non-controlling interests (previously “minority interests”) even if<br />
this results in the non-controlling interests having a deficit balance (the current standard<br />
requires the excess losses to be allocated to the owners of the parent in most cases). The<br />
revised standard specifies that changes in a parent’s ownership interest in a subsidiary<br />
that do not result in the loss of control must be accounted for as equity transactions. it<br />
also specifies how an entity should measure any gain or loss arising on the loss of control<br />
of a subsidiary. At the date when control is lost, any investment retained in the former<br />
subsidiary will have to be measured at its fair value. The Group does not expect the<br />
amendment to affect its consolidated financial statements.<br />
IFRS 3, Business Combinations (revised January 2008; effective for business<br />
combinations for which the acquisition date is on or after the beginning of the<br />
first annual reporting period beginning on or after July 3, 2009). The revised iFRS<br />
3 will allow entities to choose to measure non-controlling interests using the existing<br />
iFRS 3 method (proportionate share of the acquiree’s identifiable net assets) or on the<br />
same basis as uS GAAP (at fair value). The revised iFRS 3 is more detailed in providing<br />
guidance on the application of the purchase method to business combinations. The<br />
requirement to measure at fair value every asset and liability at each step in a step<br />
acquisition for the purposes of calculating a portion of goodwill has been removed.<br />
instead, goodwill will be measured as the difference at acquisition date between the fair<br />
value of any investment in the business held before the acquisition, the consideration<br />
transferred and the net assets acquired. Acquisition-related costs will be accounted for<br />
separately from the business combination and therefore recognised as expenses rather<br />
than included in goodwill. An acquirer will have to recognise at the acquisition date a<br />
liability for any contingent purchase consideration. changes in the value of that liability<br />
after the acquisition date will be recognised in accordance with other applicable iFRSs,<br />
as appropriate, rather than by adjusting goodwill. The revised iFRS 3 brings into its<br />
scope business combinations involving only mutual entities and business combinations<br />
achieved by contract alone. The Group is currently assessing the impact of the amended<br />
standard on its consolidated financial statements.<br />
Vesting Conditions and Cancellations—Amendment to IFRS 2, Share-based<br />
Payment (issued in January 2008; effective for annual periods beginning on or<br />
after January 1, 2008). The amendment clarifies that only service conditions and performance<br />
conditions are vesting conditions. other features of a share-based payment<br />
are not vesting conditions. The amendment specifies that all cancellations, whether by<br />
the entity or by other parties, should receive the same accounting treatment. The Group<br />
does not expect the amendment to affect its consolidated financial statements.<br />
IFRIC 13, ‘Customer loyalty programmes’ (issued in June <strong>2007</strong>; effective for<br />
annual periods beginning on or after July 1, 2008). iFRic 13 clarifies that where<br />
goods or services are sold together with a customer loyalty incentive (for example, loyalty<br />
points or free products), the arrangement is a multiple-element arrangement and<br />
the consideration receivable from the customer is allocated between the components<br />
Annual report<br />
61
Annual report<br />
05<br />
critical accounting<br />
estimates,<br />
and judgements<br />
in applying<br />
accounting policies<br />
<strong>2007</strong><br />
iFRS<br />
coNSoliDATED<br />
FiNANciAl<br />
STATEMENTS<br />
of the arrangement using fair values. iFRic 13 is not relevant to the Group’s operations<br />
because no Group companies operate any loyalty programmes.<br />
Other new standards or interpretations. The Group has not early adopted the<br />
following other new standards or interpretations:<br />
iFRic 11, iFRS 2 — Group and Treasury Share Transactions (effective for annual periods<br />
beginning on or after March 1, <strong>2007</strong>);<br />
iFRic 12, Service concession Arrangements (effective for annual periods beginning<br />
on or after January 2008);<br />
iFRic 14, iAS 19—The limit on a Defined Benefit Asset, Minimum Funding Requirements<br />
and their interaction (effective for annual periods beginning on or after January<br />
1, 2008).<br />
unless otherwise described above, the new standards and interpretations are not<br />
expected to significantly affect the Group’s consolidated financial statements.<br />
The Group makes estimates and assumptions that affect the reported amounts<br />
of assets and liabilities within the next financial year. Estimates and judgements are<br />
continually evaluated and are based on management’s experience and other factors,<br />
including expectations of future events that are believed to be reasonable under the circumstances.<br />
Management also makes certain judgements, apart from those involving<br />
estimations, in the process of applying the accounting policies. Judgements that have<br />
the most significant effect on the amounts recognised in the financial statements and<br />
estimates that can cause a significant adjustment to the carrying amount of assets and<br />
liabilities within the next financial year include:<br />
Estimated impairment of goodwill. The Group tests goodwill for impairment<br />
at least annually. The recoverable amounts of cash-generating units have been determined<br />
based on future cash flow projections. These calculations require the use of<br />
estimates (Note 10).<br />
Tax legislation. Russian tax, currency and customs legislation is subject to varying<br />
interpretations (Note 30).<br />
Remaining useful life of property, plant and equipment. Management assesses<br />
the remaining useful life of property, plant and equipment in accordance with the current<br />
technical conditions of assets and estimated period during which these assets will<br />
bring economic benefit to the Group (Note 8). The estimated remaining useful life of<br />
some property, plant and equipment is beyond expiry date of the operating licenses<br />
(Note 1). The management believes that the licenses will be renewed in due order however<br />
if the licenses are not renewed, property, plant and equipment with net book value<br />
of RR 482 (December 31, 2006: RR 471) should be assessed for impairment in 2013.<br />
Land. All facilities of JSc “BBT” situated on land occupied on an annual lease basis,<br />
but the management plans to purchase the land under the right provided by statutory<br />
legislation or to secure the assets by long-term rent agreement with municipal authorities.<br />
if the Group can not secure long-term use of this land, non-current assets of RR<br />
2,870 (December 31, 2006: RR 3,084) should be assessed for impairment.<br />
Provisions for earth replacement and mine flooding. From 2002 to the end of<br />
october 2006 the Group accrued for site restoration and reclamation costs specifically<br />
related to cavities resulting from the extraction of ore beneath the town of Berezniki<br />
during mining activities (Note 16). The provision was estimated as the present value of<br />
the present obligation based on future additional cash outflows relating to the Group’s<br />
earth replacement operations under the town of Berezniki. At the end of each year the<br />
provision was reassessed to account for earth replaced during the year, changes in the<br />
estimates of future cash outflows and passage of time. The change in provision was<br />
charged to the statement of income in the year when it occurs. The discount rate used<br />
by the Group in determining the fair value of the earth replacement reserve in 2006 was<br />
9.99%. The provision for earth replacement contains “change in estimates” as a component<br />
of calculation. The “change in estimates” consists of changes in anticipated vol-<br />
62
Restoring nature’s balance<br />
uRAlkAli<br />
ume and timing of the earth replacement work and changes in the associated costs.<br />
on october 28, 2006 the Group stopped production operations in Mine 1 due to<br />
natural groundwater inflow increase to the level when it can not be controlled by the<br />
Group. According to the act of a governmental commission, the cause of flooding was<br />
a previously unknown anomaly of geological structure and has consequently been determined<br />
to be beyond the control of the Group (force majeure).<br />
Following the closure of the Mine 1 on october 28, 2006, the Group ceased the<br />
earth replacement operations. However, in order to substantially reduce the risk of subsidence<br />
within the town Berezniki the Group as advised by the governmental commission<br />
and institute of Geological Sciences, started injection of brine into the cavities in<br />
2006. Most of the cavities in Mine 1 were expected to be filled with water during the<br />
next 3 years given expected natural groundwater inflow volume of 3,000 cubic metres<br />
per hour. A technical plan for brine injection operations prepared in 2006 for <strong>2007</strong> was<br />
based on the Group’s maximum brine production capacity and was expected to be<br />
updated annually. Based on this technical plan and its best estimates, the management<br />
as at December 31, 2006 estimated a provision for present value of cash outflows to be<br />
incurred in connection with brine injection operations (Note 16).<br />
in <strong>2007</strong> the Group performed brine injection operations pursuant to the above mentioned<br />
plan. However starting from october <strong>2007</strong> the volume of natural groundwater<br />
inflow increased to 7000-8000 cubic metres per hour. in December <strong>2007</strong> the institute<br />
of Geological Sciences issued an expert opinion, that further brine injection operation<br />
would be impractical. in December <strong>2007</strong> the management of the Group agreed with<br />
the state authorities to cease brine injection operations and released remaining balance<br />
of the mine flooding provision (Note 16). The brine injection operations were stoped<br />
on January 12, 2008.<br />
Management believes that no obligation exists at the year end other than disclosed in<br />
these consolidated financial statements and therefore no new provision has been made.<br />
Management will continue to assess mine flooding risks, consequences and costs the<br />
Group can incur in the future from subsidence within the town Berezniki and contiguous<br />
areas. Due to the complexity of the risks, management could not reasonably assess at<br />
December 31, <strong>2007</strong> the amount of expenses the Group can incur in the future in relation<br />
to mine flooding risks, however the amount could be significant for the Group.<br />
Inventory. The Group engages an independent surveyor to verify the physical<br />
quantity of finished products at the reporting dates. in accordance with the surveyor’s<br />
guidance and technical characteristics of the devices used, the possible valuation error<br />
can be +/– 4 -6%. At the reporting date the carrying amount of finished products can<br />
vary within this range.<br />
Trade and other receivables. 100% impairment provision is accrued for trade and<br />
other receivables overdue over 90 days, receivables overdue for more than 45 days, but<br />
less than 90 days are provided for 50% of its carrying amount.<br />
Annual report<br />
63
Annual report<br />
06<br />
Related parties<br />
<strong>2007</strong><br />
iFRS<br />
coNSoliDATED<br />
FiNANciAl<br />
STATEMENTS<br />
Related parties are defined in iAS 24 “Related Party Disclosures”. Parties are considered<br />
to be related if one party has the ability to control the other party, is under common<br />
control, or can exercise significant influence over the other party in making financial and<br />
operational decisions. in considering each possible related party relationship, attention<br />
is directed to the substance of the relationship, not merely the legal form. key management<br />
and close family members are also related parties.<br />
The company’s immediate parent and ultimate controlling parties are disclosed in<br />
Note 1.<br />
The nature of the related party relationships for those related parties with whom<br />
the Group entered into significant transactions or had significant balances outstanding<br />
at December 31, <strong>2007</strong> and 2006, respectively, are detailed below.<br />
Balance sheet caption Relationship December 31, <strong>2007</strong> December 31, 2006<br />
other payables Entities under common control 25 26<br />
loans to related parties Entities under common control - 431<br />
loans to related parties Parent company - 2,659<br />
Financial assets Entities under common control - 19<br />
Shareholder’s equity caption Relationship <strong>2007</strong> 2006<br />
Dividends declared Parent company - 2,701<br />
Statement of income caption Relationship <strong>2007</strong> 2006<br />
interest income Parent company 109 122<br />
interest income Entities under common control 19 18<br />
Loans to related parties<br />
in December <strong>2007</strong> llc “Permgeologodobycha” repaid to the Group RR denominated,<br />
unsecured, 4 to 6% annual interest loans which were outstanding at December 31, 2006.<br />
Loans to parent company<br />
in November <strong>2007</strong> Madura Holdings limited, parent company, repaid to the Group<br />
uS$ denominated, unsecured, 5% loan which was outstanding at December 31, 2006<br />
in the amount of RR 2,659 and uS$ denominated, unsecured, 5% loan received in <strong>2007</strong><br />
in the amount of RR 753.<br />
Financial assets<br />
in December <strong>2007</strong> llc “Permgeologodobycha” repaid to the Group RR denominated,<br />
interest free promissory notes which were outstanding at December 31, 2006.<br />
Cross shareholding<br />
At December 31, <strong>2007</strong> llc “kama”, a 100% owned subsidiary of the Group,<br />
owned 1.16% of the ordinary shares of the company (December 31, 2006: 0.85%).<br />
Shares owned by llc “kama” are accounted for as treasury shares, but retain their<br />
voting rights and rights to dividends.<br />
64
07<br />
Segment reporting<br />
Restoring nature’s balance<br />
uRAlkAli<br />
Managements’ compensation<br />
compensation of key management personnel consists of remuneration paid to<br />
members of the Board of directors, executive directors and vice-presidents for their<br />
services in full or part time positions. compensation is made up of an annual remuneration<br />
and a performance bonus depending on operating results.<br />
Total key management personnel’s compensation is represented by short-term employee<br />
benefits and included in general and administrative expenses in the consolidated<br />
statement of income amounted to RR 650 and RR 163 for the periods ended December<br />
31, <strong>2007</strong>and 2006, respectively.<br />
Primary reporting format — geographical segments<br />
The Group sells its products to customers located in three main geographical segments:<br />
domestic, export to developing and export to developed countries that are summarised<br />
in the table below. Revenues in the domestic market are to customers located<br />
in the Russian Federation, exports to developing countries are to the customers mainly<br />
located in china, Brazil, South Eastern Asia and india and exports to developed countries<br />
are mainly to the customers located in uSA and European countries.<br />
The segments results for year ended December 31, <strong>2007</strong> were as follows:<br />
Developing<br />
countries<br />
Developed<br />
countries<br />
Export Domestic<br />
Total Potash Other Total<br />
export sales sales domestic Unallocated Total<br />
Tons (thousands) 4,177 398 4,575 485 - 485 - 5,060<br />
Revenues 24,424 2,266 26,690 1,705 1,104 2,809 - 29,499<br />
Segment result/operating profit 8,293 962 9,255 648 421 1,069 (202) 10,122<br />
Finance income and expense, net - - - - - - (273) (273)<br />
Mine flooding costs (Note 26) - - - - - - 274 274<br />
Profit before income tax - 10,123<br />
income tax expense (2,078) (2,078)<br />
Net profit 8,045<br />
Developing<br />
countries<br />
The segments results for the year ended December 31, 2006 were as follows:<br />
Developed<br />
countries<br />
Export Domestic<br />
Total Potash Other Total<br />
export sales sales domestic Unallocated Total<br />
Tons (thousands) 3,369 536 3,905 438 - 438 - 4,343<br />
Revenues 17,456 2,574 20,030 1,304 956 2,260 - 22,290<br />
Segment result/operating profit 5,222 836 6,058 381 104 485 7 6,550<br />
Finance income and expense, net - - - - - - (170) (170)<br />
Mine flooding costs (Note 26) - - - - - - (2,054) (2,054)<br />
Profit before income tax - 4,326<br />
income tax expense (832) (832)<br />
Net profit 3,494<br />
Annual report<br />
65
Annual report<br />
<strong>2007</strong><br />
iFRS<br />
coNSoliDATED<br />
FiNANciAl<br />
STATEMENTS<br />
The total depreciation and amortization costs included in the statement of income<br />
for the year ended December 31, <strong>2007</strong> and December 31, 2006 were as follows:<br />
Year ended December 31, <strong>2007</strong> 1,671 159 1,830 194 - 2,024<br />
Year ended December 31, 2006 1,576 250 1,826 204 - 2,030<br />
December 31, <strong>2007</strong><br />
Export<br />
Developing Developed Total<br />
countries countries export Domestic Unallocated<br />
The total loss on disposal of fixed assets at nil consideration included in the statement<br />
of income for the year ended December 31, <strong>2007</strong> and December 31, 2006 was<br />
as follows:<br />
Year ended December 31, <strong>2007</strong> - - 279 279<br />
Year ended December 31, 2006 - - 1,367 1,367<br />
The segment assets and liabilities as at December 31, <strong>2007</strong> and December 31, 2006 and<br />
capital expenditure for the year ended December 31, <strong>2007</strong> and December 31, 2006 were as<br />
follows:<br />
Developed<br />
countries<br />
Assets 2,974 1,093 35,339 229 39,635<br />
liabilities - (905) (1,943) (11,713) (14,561)<br />
capital expenditure - 269 6,047 - 6,316<br />
December 31, 2006<br />
Developing<br />
countries<br />
Export<br />
Domestic<br />
Domestic<br />
Unallocated<br />
Unallocated<br />
Assets 1,440 3,276 24,731 3,591 33,038<br />
liabilities (35) (724) (2,601) (12,028) (15,388)<br />
capital expenditure - 74 5,124 - 5,198<br />
Total<br />
Total<br />
Total<br />
Developing Developed<br />
countries countries Domestic Unallocated Total<br />
certain assets and liabilities were allocated to geographical segments on the basis<br />
of revenues. Property, plant and equipment and capital expenditures are allocated to<br />
Russia where the assets are physically located and are not allocated to geographical<br />
segments as such allocation could be made only on an arbitrary basis.<br />
Segment assets consist primarily of property, plant and equipment, goodwill, intangible<br />
assets, investments accounted for using the equity method, inventories, receivables<br />
and cash. capital expenditure comprises additions to property, plant and equipment.<br />
Segment liabilities comprise operating liabilities. Financial assets, related parties<br />
loans, deferred and current income taxes, borrowings (including finance lease payable)<br />
and finance costs are unallocated components.<br />
66
December 31, <strong>2007</strong><br />
Restoring nature’s balance<br />
uRAlkAli<br />
Secondary reporting format – business segments<br />
At December 31, <strong>2007</strong> and December 31, 2006 the Group is organized in one operating<br />
segment: extraction, manufacture and sale of potassium fertilisers.<br />
The segment assets and capital expenditure for years ended December 31, <strong>2007</strong> and<br />
December 31, 2006 can be presented based on the location of the assets as follows:<br />
Assets 35,726 3,680 229 39,635<br />
capital expenditure 6,047 269 - 6,316<br />
December 31, 2006<br />
Russia Switzerland Unallocated<br />
Russia Switzerland Unallocated<br />
Assets 25,013 4,434 3,591 33,038<br />
capital expenditure 5,124 74 - 5,198<br />
Property, plant and equipment and related accumulated depreciation consist of the<br />
following:<br />
Cost<br />
Balance as of December 31, 2006 8,036 5,284 11,379 3,876 6,952 437 179 36,143<br />
Additions - - - 363 5,953 - - 6,316<br />
Transfers 95 185 2,578 - (2,932) 74 - -<br />
Disposals (82) (152) (672) (143) (115) (11) - (1,175)<br />
Balance as of December 31, <strong>2007</strong> 8,049 5,317 13,285 4,096 9,858 500 179 41,284<br />
Accumulated Depreciation<br />
Balance as of December 31, 2006 3,409 4,582 6,650 1,094 - 246 - 15,981<br />
Depreciation charge 252 141 1,225 318 - 36 - 1,972<br />
Disposals (57) (122) (581) (108) - (6) - (874)<br />
Balance as of December 31, <strong>2007</strong> 3,604 4,601 7,294 1,304 - 276 - 17,079<br />
Net Book Value<br />
08<br />
Property, plant<br />
and equipment<br />
Mine<br />
Assets<br />
development Plant and<br />
under<br />
Buildings costs equipment Transport construction Other Land Total<br />
Balance as of December 31, 2006 4,627 702 4,729 2,782 6,952 191 179 20,162<br />
Balance as of December 31, <strong>2007</strong> 4,445 716 5,991 2,792 9,858 224 179 24,205<br />
Annual report<br />
Total<br />
Total<br />
67
Annual report<br />
<strong>2007</strong><br />
iFRS<br />
coNSoliDATED<br />
FiNANciAl<br />
STATEMENTS<br />
Cost<br />
Balance as of December 31, 2005 8,476 5,962 12,632 3,454 4,580 457 174 35,735<br />
Additions - - - 931 4,259 - 8 5,198<br />
Transfers 14 62 1,474 - (1,563) 13 - -<br />
Disposals (454) (740) (2,727) (509) (324) (33) (3) (4,790)<br />
Balance as of December 31, 2006 8,036 5,284 11,379 3,876 6,952 437 179 36,143<br />
Accumulated Depreciation<br />
Balance as of December 31, 2005 3,443 4,967 7,422 1,144 - 230 - 17,206<br />
Depreciation charge 262 194 1,224 298 - 35 - 2,013<br />
Disposals (296) (579) (1,996) (348) - (19) - (3,238)<br />
Balance as of December 31, 2006 3,409 4,582 6,650 1,094 - 246 - 15,981<br />
Net Book Value<br />
Mine<br />
Assets<br />
development Plant and<br />
under<br />
Buildings costs equipment Transport construction Other Land Total<br />
Balance as of December 31, 2005 5,033 995 5,210 2,310 4,580 227 174 18,529<br />
Balance as of December 31, 2006 4,627 702 4,729 2,782 6,952 191 179 20,162<br />
Depreciation<br />
For the year ended December 31, <strong>2007</strong> and 2006, respectively, the depreciation<br />
was allocated to statement of income as follows:<br />
cost of sales 1,399 1,441<br />
Distribution costs (including transhipment activities – Note 2.30) 328 320<br />
General and administrative expenses 178 183<br />
loss on disposal of fixed assets and brine injection costs (Note 26) 48 22<br />
Total depreciation expense 1,953 1,966<br />
in <strong>2007</strong> the Group incurred depreciation amounting to RR 19 (2006: RR 47) directly<br />
related to construction of new fixed assets. These expenses were capitalized on the consolidated<br />
balance sheet in accordance with the Group accounting policy and included<br />
in assets under construction.<br />
Fully depreciated assets still in use<br />
As of December 31, <strong>2007</strong> and December 31, 2006 the gross carrying value of fully<br />
depreciated property, plant and equipment still in use was RR 6,737 and RR 6,752,<br />
respectively.<br />
Assets pledged under loan agreements<br />
As of December 31, <strong>2007</strong> and December 31, 2006 the carrying value of property,<br />
plant and equipment pledged under bank loans was RR 8,197 and RR 8,142 (Note 17),<br />
respectively.<br />
<strong>2007</strong><br />
2006<br />
68
09<br />
Principal subsidiaries<br />
and joint-ventures<br />
Entity<br />
Subsidiaries<br />
Restoring nature’s balance<br />
uRAlkAli<br />
The principal subsidiaries consolidated within the Group are as follows:<br />
“uralkali Trading SA” Switzerland Trading 100 100<br />
“uralkali Trading (Gibraltar) limited” Gibraltar Administrative services 100 100<br />
llc “kama” Russia Finance services and leasing 100 100<br />
llc “BshSu” Russia construction 100 100<br />
llc “uralkali-Technology” Russia Research and development 100 100<br />
JSc “BBT” Russia Maritime terminal 100 100<br />
llc “Autotranskali” Russia Transportation 100 100<br />
llc “Vagonnoe Depo Balakhonzi” Russia Repairs 100 100<br />
llc “Novaya Nedvizhimost’” Russia Repair and maintenance 100 100<br />
“SP Terminal” ukraine Dormant 98 98<br />
llc “Depo” Russia Repairs 75 75<br />
llc “Satellit-Service” Russia iT services 51 51<br />
llc “uralkali Engineering” Russia Research and development 51 51<br />
Joint-ventures<br />
Country<br />
of Incorporation<br />
JSC “Belorussian Potash Company” Belorussia Trading 50 50<br />
Activity<br />
December 31,<br />
<strong>2007</strong> % share<br />
Annual report<br />
December 31,<br />
2006 % share<br />
in october 2005, the company acquired a 50% interest in “BPc”, the remaining<br />
50% of which is owned by “Belaruskali”. The principal activity of “BPc” is marketing<br />
and exporting as agent potash fertilisers produced by its two participants.<br />
The “BPc” charter provides for separate accounting of the operations of each<br />
participant, including separate accounting for the sales of the participants’ goods and<br />
related cost of sale and distribution costs. Administrative expenses incurred by “BPc”<br />
are shared 50 : 50. Distribution of net income to each participant is on the basis of<br />
their relevant results, after administrative costs unless both participants decide not to<br />
distribute. operations of the Group through “BPc”, assets and liabilities of the Group<br />
located in “BPc” in which the Group has direct interest are fully consolidated in these<br />
financial statements.The statement of income reflects the revenue from sales by “BPc”<br />
of uralkali’s products, together with the related costs of sale and distribution and administrative<br />
costs.<br />
69
Annual report<br />
10<br />
Goodwill<br />
<strong>2007</strong><br />
iFRS<br />
coNSoliDATED<br />
FiNANciAl<br />
STATEMENTS<br />
carrying amount at January 1 366 336<br />
impairment loss - -<br />
Carrying amount at December 31 366 366<br />
Gross book value at December 31 366 366<br />
Accumulated impairment losses at December 31 - -<br />
Carrying amount at December 31 366 366<br />
Goodwill Impairment Test<br />
The goodwill primary relates to expected reduction of transportation costs to be<br />
incurred from synergies with the company when exporting potash by the Baltic Sea.<br />
Therefore the goodwill is allocated to cash generated unit JSc “uralkali”:<br />
JSc “uralkali” 366 366<br />
Total carrying amount of goodwill 366 366<br />
The recoverable amount of the goodwill is determined based on cash flow projections<br />
approved by management covering a five-year period and analysis of synergies<br />
performed by independent appraiser. cash flows beyond that five-year period have<br />
been extrapolated using a steady 4% growth rate. This growth rate does not exceed the<br />
long-term average growth rate for the markets in which the Group operates (Note 7).<br />
Pre-tax discount rate of 10.5% that reflects risks relating to JSc “uralkali” was used<br />
in the calculation of the recoverable value.<br />
<strong>2007</strong><br />
<strong>2007</strong><br />
2006<br />
2006<br />
70
11<br />
intangible assets<br />
uRAlkAli<br />
cost at January 1, 2006 304 20 324<br />
Accumulated amortization (112) - (112)<br />
Carrying amount at January 1, 2006 192 20 212<br />
Additions 23 - 23<br />
Amortization charge (64) - (64)<br />
Cost at December 31, 2006 327 20 347<br />
Accumulated amortization (176) - (176)<br />
Carrying amount at December 31, 2006 151 20 171<br />
Additions 47 - 47<br />
Amortization charge (71) - (71)<br />
Cost at December 31, <strong>2007</strong> 374 20 394<br />
Accumulated amortization (247) - (247)<br />
Carrying amount at December 31, <strong>2007</strong> 127 20 147<br />
Restoring nature’s balance<br />
12<br />
inventories<br />
The balances of intangible assets reported in these consolidated financial statements<br />
at December 31, <strong>2007</strong> and 2006 respectively mainly represent management<br />
information and accounting system costs and fees charged by an external consultant<br />
for the installation of this software. The costs of the software are amortized over the<br />
period not exceeding 5 years.<br />
other intangible assets are mainly represented by licenses (Note 1).<br />
inventories consist of the following:<br />
Software Other<br />
Total<br />
Raw materials 964 1,063<br />
Finished products 525 398<br />
Work in progress 33 20<br />
Total inventories 1,522 1,481<br />
Annual report<br />
<strong>2007</strong> 2006<br />
At December 31, <strong>2007</strong> and 2006, respectively, the balance of finished goods includes<br />
inventories bought for resale. As of December 31, <strong>2007</strong> the value of circulating<br />
finished goods valued at market prices pledged as security for bank loans was RR 4<br />
(December 31, 2006: RR 1,322) (Note 17).<br />
71
Annual report<br />
13<br />
Trade and other<br />
receivables<br />
<strong>2007</strong><br />
iFRS<br />
coNSoliDATED<br />
FiNANciAl<br />
STATEMENTS<br />
<strong>2007</strong> 2006<br />
Trade receivables 3,391 1,752<br />
other accounts receivables 206 421<br />
less: provision for impairment of trade and other receivables (90) (106)<br />
Total financial receivables 3,507 2,067<br />
VAT recoverable 1,145 1,330<br />
other taxes receivables 692 536<br />
Advances to suppliers 339 354<br />
insurance expenses prepaid 112 32<br />
other prepayments 80 56<br />
Total trade and other receivables 5,875 4,375<br />
At December 31, <strong>2007</strong> trade receivables of RR 3,340 (December 31, 2006: RR<br />
1,732) net of provision for impairment of trade and other receivables denominated in<br />
foreign currency, mainly 71% in uS$ (December 31, 2006: 74%), 21% in Euro (December<br />
31, 2006: 21%). Management believes that the fair value of accounts receivable<br />
does not differ significantly from their carrying amounts.<br />
Movements on the provision for impairment of trade and other receivables are as follows:<br />
<strong>2007</strong> 2006<br />
Trade receivables Other receivables Trade receivables<br />
Other receivables<br />
As of January 1 (20) (86) (35) (64)<br />
Provision accrued (35) (30) (10) (30)<br />
Provision reversed 4 48 16 4<br />
Provision written off - 29 9 4<br />
As of December 31 (51) (39) (20) (86)<br />
72
Restoring nature’s balance<br />
uRAlkAli<br />
The accrual and reversal of provision for impaired receivables have been included in<br />
other operating expenses in the consolidated statement of income (Note 24). Amounts<br />
charged to the provision account are generally written off when there is no expectation<br />
of recovering additional cash.<br />
Analysis by credit quality of trade and other receivables is as follows:<br />
<strong>2007</strong> 2006<br />
Trade receivables Other receivables Trade receivables<br />
Other receivables<br />
Current and not impaired<br />
customers from developed countries 464 6 440 -<br />
customers from developing countries 2,557 - 1,212 -<br />
Domestic customers 264 161 41 332<br />
Total current and not impaired 3,285 167 1,693 332<br />
Past due but not impaired<br />
less than 45 days overdue 8 - 34 -<br />
60 to 90 days overdue 13 - - -<br />
over 90 days overdue 22 - - -<br />
Total past due but not impaired 43 - 34 -<br />
Determined to be impaired (gross)<br />
45 to 90 days overdue 24 - 10 6<br />
over 90 days overdue 39 39 15 83<br />
Total gross amount of impaired accounts receivables 63 39 25 89<br />
Total financial receivables (gross) 3,391 206 1,752 421<br />
Less impairment provision (51) (39) (20) (86)<br />
Total financial receivables 3,340 167 1,732 335<br />
As of December 31, <strong>2007</strong> no trade and other receivables were pledged as collateral<br />
(December 31, 2006: nil).<br />
Annual report<br />
73
Annual report<br />
14<br />
cash and cash<br />
equivalents<br />
<strong>2007</strong><br />
cash and cash equivalents comprise the following:<br />
iFRS<br />
coNSoliDATED<br />
FiNANciAl<br />
STATEMENTS<br />
<strong>2007</strong> 2006<br />
RR denominated cash on hand and bank balances (interest rate:<br />
from 1.25% p.a. to 6.0% p.a. (2006: from 0.5% p.a. to 6.2% p.a.)) 260 1,404<br />
uS$ denominated bank balances 306 607<br />
other currencies denominated balances<br />
uS$ term deposits (interest rate: from 4.3% p.a. to 5.21% p.a.<br />
719 26<br />
(2006: from 2,5% p.a. to 4.95% p.a.)) 388 430<br />
RR term deposits (interest rate: from 8.5% to 9% p.a. (2006: 8% p.a)) 5,520 300<br />
Cash and cash equivalents, net of restricted cash 7,193 2,767<br />
Restricted cash<br />
limited guarantee deposit 78 80<br />
Three month bank deposits (interest rate: 6.77% p.a. (2006: from 4.8% p.a. to 6.19% p.a. )) 20 45<br />
Total restricted cash 98 125<br />
Total cash and cash equivalents 7,291 2,892<br />
15<br />
Shareholders’ equity<br />
Term deposits have original maturities of less than three months.<br />
Number of ordinary<br />
shares (in millions) Ordinary shares Treasury shares<br />
Total<br />
At January 1, 2006 2,124 648 (6) 642<br />
Treasury shares purchased - - (3) (3)<br />
At December 31, 2006 2,124 648 (9) 639<br />
At January 1, <strong>2007</strong> 2,124 648 (9) 639<br />
Treasury shares purchased - - (3) (3)<br />
At December 31, <strong>2007</strong> 2,124 648 (12) 636<br />
The number of unissued authorised ordinary shares is 1,500 mln. (December 31, 2006:<br />
1,500 mln.) with a nominal value per share of 0.5 Roubles. All shares stated in the table above<br />
have been issued and fully paid.<br />
Treasury shares. At December 31, <strong>2007</strong> treasury shares comprise 24,601,344 ordinary<br />
shares of the company (December 31, 2006: 17,966,905) with a nominal value per share of<br />
0.5 Roubles owned by llc “kama”, wholly owned subsidiary of the Group (Note 6). Purchase<br />
price of shares acquired during the year ended December 31, <strong>2007</strong> amounted to RR 338 (for the<br />
year ended December 31, 2006: RR 229), comprised consideration paid in cash of RR 79 and<br />
non-cash of RR 259 (for the year ended December 31, 2006: all shares have been fully paid in<br />
cash). These ordinary shares carry voting rights in the same proportion as other ordinary shares.<br />
Voting rights of ordinary shares of the company held by the entities within the Group are effectively<br />
controlled by the management of the Group.<br />
74
16<br />
Mining provisions<br />
Restoring nature’s balance<br />
uRAlkAli<br />
Profit distribution. in accordance with Russian legislation, the company distributes profits<br />
as dividends or transfers them to reserves (fund accounts) on the basis of financial statements<br />
prepared in accordance with Russian Accounting Rules.<br />
The statutory accounting reports of the company are the basis for profit distribution and<br />
other appropriations. Russian legislation identifies the basis of distribution as the net profit. For<br />
the year ended December 31, <strong>2007</strong>, the current period net statutory profit for the company as<br />
reported in the published annual statutory reporting forms was RR 6,013 (for the year ended<br />
December 31, 2006: RR 3,706) and the closing balance of the accumulated profit including the<br />
current period net statutory profit totalled RR 18,449 (December 31, 2006: RR 12,440). However,<br />
this legislation and other statutory laws and regulations are open to legal interpretation and<br />
accordingly management believes at present it would not be appropriate to disclose an amount<br />
of the distributable reserves in these consolidated financial statements.<br />
Dividends. in December 2006 the General Meeting of Shareholders of the company approved<br />
dividends (based on the financial results for the first nine months of 2006) amounting<br />
to RR 3,378 (1.59 Roubles per share).<br />
Earth replacement provision<br />
During the year ended December 31, 2006 the local authorities in Berezniki and<br />
regional authorities in Perm reimbursed a part of the operating costs incurred by the<br />
Group in filling-up cavities under the city of Berezniki (Note 2.26) pursuant to the<br />
law of the Perm Region W381-69 passed on october 25, 2002. The reimbursement<br />
amounted to RR 55 (December 31, 2006: RR 57).<br />
Due to mine flooding which occurred in october 2006 the Group ceased its earth<br />
replacement activities (Note 5).<br />
Mine flooding provision<br />
Note <strong>2007</strong><br />
2006<br />
Balance as of January 1 - 196<br />
Reduction of provision for cavities filled during the year - (146)<br />
change in estimate - (69)<br />
increase in provision as a result of passage of time 25 - 19<br />
Balance as of December 31 - -<br />
Note <strong>2007</strong><br />
2006<br />
Balance as of January 1 679 -<br />
increase in provision as a result of passage of time 25 67 -<br />
Reduction of provision for cavities filled during the year 26 (353) -<br />
Accrual of provision 26 - 679<br />
Release of provision 26 (370) -<br />
Balance as of December 31 23 679<br />
The Group stoped brine injection operations on January 12, 2008 (Note 5) and released<br />
corresponding provision. Balance of provision as of December 31, <strong>2007</strong> relates<br />
to present obligation based on expenses actually incurred by the Group in connection<br />
with brine injection operations in 2008.<br />
Annual report<br />
75
Annual report<br />
<strong>2007</strong><br />
iFRS<br />
coNSoliDATED<br />
FiNANciAl<br />
STATEMENTS<br />
Bank loans 10,600 11,088<br />
company loans 137 179<br />
Finance lease payable 328 328<br />
Total borrowings 11,065 11,595<br />
As at December 31, <strong>2007</strong> and December 31, 2006 the fair value of the current and noncurrent<br />
borrowings is not materially different from their carrying amounts.<br />
The Group does not apply hedge accounting and has not entered into any hedging arrangements<br />
in respect of its interest rate exposures.<br />
company loans are represented by a short-term unsecured, interest-free loan from JSc “St.<br />
Petersburg Sea Port” in the amount of RR 45 (December 31, 2006: RR 45) and a short-term<br />
uS$ denominated, unsecured, liBoR six months plus 1% per annum interest bearing bridge<br />
loan from Dessault Aviation S.A in the amount of RR 92 (December 31, 2006: RR nil). The<br />
loan is repayable in September 2008. The loan was oblained to postpone the downpayments<br />
under capital construction agreement between “Dessault Aviation S.A” and the Group in the<br />
non-cash form. in <strong>2007</strong> the Group reconsidered repayment schedule for the loan from JSc “St.<br />
Petersburg Sea Port” from December 31, <strong>2007</strong> to December 31, 2008.<br />
company loan from “Ermina Ventures limited” of RR 134 which was outstanding at December<br />
31, 2006 was repaid in <strong>2007</strong>.<br />
JSc “BBT” leases a berth No. 107 from FGuP “Rosmorport” under a finance lease for 49<br />
years. As of December 31, <strong>2007</strong> the leased dock was included in buildings, with a net book value<br />
of RR 280 (December 31, 2006: RR 286) (Note 8).<br />
Balance at January 1 11,088 3,484<br />
Bank loans received, denominated in uS$ 8,112 11,664<br />
Bank loans received, denominated in RR 94 270<br />
Bank loans repaid, denominated in uS$ (7,884) (3,688)<br />
Bank loans repaid, denominated in RR (239) (120)<br />
interest accrued 698 560<br />
interest paid (725) (521)<br />
Recognition of syndication fees (18) (43)<br />
Amortization of syndication fees 30 10<br />
currency translation difference (556) (528)<br />
Balance at December 31 10,600 11,088<br />
Short-term borrowings<br />
17<br />
Borrowings<br />
<strong>2007</strong><br />
<strong>2007</strong><br />
2006<br />
2006<br />
Table below provides interest rates at December 31, <strong>2007</strong> and December 31, 2006<br />
and split of the bank loans between short-term and long-term.<br />
Interest rates <strong>2007</strong><br />
2006<br />
Bank loans in uS$ – fixed interest 7.5% (2006: from 7.6% to 8%) 1,759 1,781<br />
from libor +1.95% to libor +2.5%<br />
Bank loans in uS$ – floating interest (2006: from libor +2% to libor +3%) 2,720 5,<br />
Bank loans in RR – fixed interest 13% (2006: 9.60%) 5 150<br />
Total short-term bank loans 4,484 7,861<br />
76
Long-term borrowings<br />
Lender<br />
Restoring nature’s balance<br />
uRAlkAli<br />
uS$ denominated bank loans bear a weighted average interest of 7.12% (December<br />
31, 2006: 7.81%).<br />
During the year ended December 31, <strong>2007</strong> the Group received borrowings from<br />
the following banks:<br />
international Moscow Bank May – November 2010 6,265<br />
Sberbank April — May 2008 1,908<br />
Bank ural FD March 2008 33<br />
Total bank loans received 8,206<br />
Lender<br />
Interest rates <strong>2007</strong><br />
2006<br />
Bank loans in uS$ — floating interest libor +1.95%<br />
(2006: from libor +2.25% to libor +3%) 6,116 3,227<br />
Total long-term bank loans 6,116 3,227<br />
Maturity date<br />
During the year ended December 31, <strong>2007</strong> the Group repaid the following loans:<br />
Maturity date<br />
ABN AMRo Bank March 2008 1,298<br />
international Moscow Bank February – September <strong>2007</strong>, March 2008 2,514<br />
Sberbank March – May <strong>2007</strong>, April 2008 1,953<br />
Bank of Moscow July <strong>2007</strong> 2,331<br />
Bank ural FD March 2008 27<br />
Total bank loans repaid 8,123<br />
Annual report<br />
Amount, RR<br />
Amount, RR<br />
As at December 31, <strong>2007</strong> and December 31, 2006 loans, including short-term borrowings,<br />
are guaranteed by collateral of equipment (Note 8) and finished goods (Note 12).<br />
The Group’s bank borrowings mature as follows:<br />
within 1 year 4,484 7,861<br />
between 2 and 5 years 6,116 3,227<br />
Total bank loans 10,600 11,088<br />
Minimum lease payments under finance leases and their present values are as follows:<br />
within 1 year 38 38<br />
between 2 and 5 years 152 152<br />
after 5 years 1,485 1,523<br />
Minimum lease payments at the end of the year 1,675 1,713<br />
less future finance charges (1,347) (1,385)<br />
Present value of minimum lease payments 328 328<br />
<strong>2007</strong><br />
<strong>2007</strong><br />
2006<br />
2006<br />
77
Annual report<br />
18<br />
Trade and other<br />
payables<br />
<strong>2007</strong><br />
iFRS<br />
coNSoliDATED<br />
FiNANciAl<br />
STATEMENTS<br />
Trade payables 1,181 695<br />
Accrued liabilities 593 781<br />
Dividends payable 80 632<br />
other payables 306 198<br />
Total financial payables 2,160 2,306<br />
Advances received 106 38<br />
Deferred consideration of subsidiary acquisition 134 143<br />
Total trade and other payables 2,400 2,487<br />
19<br />
Revenues<br />
Export<br />
Potassium chloride 18,559 14,949<br />
Potassium chloride (granular) 8,131 5,081<br />
Domestic<br />
Potassium chloride 1,705 1,304<br />
karnalite - 303<br />
other 122 154<br />
Transportation and other revenues 982 499<br />
Total revenues 29,499 22,290<br />
During the year ended December 31, <strong>2007</strong> and 2006, respectively, the Group’s<br />
export sales were primarily on cost and Freight (cFR), Free on Board (FoB) or Delivered<br />
At Frontier (DAF) terms. All domestic sales were carried out on FcA Berezniki terms.<br />
<strong>2007</strong><br />
<strong>2007</strong><br />
2006<br />
2006<br />
78
Restoring nature’s balance<br />
20<br />
cost of sales<br />
uRAlkAli<br />
labour costs 1,898 1,665<br />
Fuel and energy 1,473 1,307<br />
Depreciation 1,399 1,441<br />
Materials and components used 1,385 1,301<br />
Repairs and maintenance 746 312<br />
Transportation between mines 306 174<br />
utilities 28 25<br />
change in earth replacement provision 16 - (137)<br />
change in work in progress, finished goods and goods in transit 12 (140) 188<br />
other costs 13 31<br />
Total cost of sales 7,108 6,307<br />
21<br />
Distribution costs<br />
Railway tariff 3,553 3,050<br />
Freight 2,986 2,218<br />
Transport repairs and maintenance 417 251<br />
Transhipment 287 349<br />
Depreciation 246 215<br />
Travel expenses 99 110<br />
labor costs 105 100<br />
commissions 21 37<br />
other 243 361<br />
Total distribution costs 7,957 6,691<br />
Note<br />
<strong>2007</strong><br />
<strong>2007</strong><br />
Annual report<br />
2006<br />
Total<br />
79
Annual report<br />
22<br />
General<br />
and administrative<br />
expenses<br />
<strong>2007</strong><br />
iFRS<br />
coNSoliDATED<br />
FiNANciAl<br />
STATEMENTS<br />
labour costs 1,929 774<br />
consulting, audit and legal services 329 269<br />
Depreciation and amortization 249 247<br />
insurance 181 177<br />
communication and iS services 88 84<br />
Security 85 85<br />
Mine-rescue crew 81 72<br />
Bank charges 29 34<br />
other 502 316<br />
Total general and administrative expenses 3,473 2,058<br />
23<br />
labor costs<br />
Labor costs — Cost of sales 1,898 1,665<br />
Wages, salaries, bonuses and other compensations 1,487 1,351<br />
unified social tax 343 317<br />
Post employment benefits 28 68 (3)<br />
Labor costs — Distribution costs 105 100<br />
Wages, salaries, bonuses and other compensations 105 100<br />
Labor costs — General and administrative expenses 1,929 774<br />
Wages, salaries, bonuses and other compensations 1,601 651<br />
unified social tax 164 123<br />
Post employment benefits 28 164 -<br />
Total labor costs 3,932 2,539<br />
Note<br />
<strong>2007</strong><br />
<strong>2007</strong><br />
2006<br />
2006<br />
80
24<br />
other operating<br />
expenses<br />
uRAlkAli<br />
loss/(gain) on disposal of fixed assets 215 (2)<br />
Social cost and charity 289 236<br />
Provision for impairment of receivables 13 20<br />
Net result on sale of Belaruskali goods (14) (5)<br />
other expenses 53 177<br />
Total other operating expenses 556 426<br />
25<br />
Finance income<br />
and expense<br />
interest income 223 215<br />
Fair value gains on investments 20 131<br />
Foreign exchange gain 1,008 568<br />
Finance income 1,251 914<br />
interest expense 728 576<br />
change in provision as a result of passage of time 16 67 19<br />
Finance lease expense 38 38<br />
Foreign exchange loss 510 282<br />
Fair value losses on investments - 49<br />
letters of credit fees 181 120<br />
Finance expense 1,524 1,084<br />
Restoring nature’s balance<br />
Total<br />
Annual report<br />
<strong>2007</strong> 2006<br />
The Group entered in sales agreement with “BPc” for processing of sales of “Beloruskali”<br />
goods through “uralkali Trading SA” in <strong>2007</strong> and 2006, respectively, to overcome certain drawbacks<br />
in Belorussian export legislation.<br />
The components of finance income and expense were as follows:<br />
<strong>2007</strong> 2006<br />
81
Annual report<br />
26<br />
Mine flooding costs<br />
<strong>2007</strong><br />
iFRS<br />
coNSoliDATED<br />
FiNANciAl<br />
STATEMENTS<br />
Dismantling costs 87 -<br />
loss on disposal of fixed assets 64 1,300<br />
State financing (55) -<br />
Brine injection costs 353 153<br />
change in provision for mine flooding 16 (723) 601<br />
Total mine flooding costs (274) 2,054<br />
27<br />
income tax expense<br />
current income tax expense 2,105 1,284<br />
Deferred tax (27) (452)<br />
Income tax expense 2,078 832<br />
Profit before income tax 10,123 4,326<br />
Theoretical tax charge at effective statutory rates 2,430 1,038<br />
Tax effect of items which are not deductible or assessable for taxation purposes:<br />
Mine flooding costs include costs associated with flooding at Mine 1 (Note 5):<br />
<strong>2007</strong> 2006<br />
non-deductible expenses 289 185<br />
non-taxable income - (5)<br />
Difference in tax rates* (327) (161)<br />
Regional tax allowance (314) (225)<br />
Consolidated tax charge 2,078 832<br />
Note<br />
Dismantling costs are mainly represented by labour costs, depreciation expenses and<br />
costs paid to service organisations for dismantling of equipment in shafts on Mine 1.<br />
At December 31, 2006 loss on disposal of fixed assets included VAT reversed of RR 92.<br />
income before taxation and minority interests for financial reporting purposes is<br />
reconciled to tax expense as follows:<br />
<strong>2007</strong><br />
2006<br />
in March 2006 the parliament of the Perm region in the Russian Federation, where the<br />
company is located, approved an amendment to the regional law on Perm regional part of the<br />
income tax. The amendment provides for a reduced to 20% income tax rate for companies with<br />
average number of personnel exceeding 10 persons and income, calculated in accordance with<br />
the statutory Tax code exceeding RR 0,1. Previously reduced income tax rate was allowed to the<br />
companies with capital expenditures of more than 20% of annual taxable net income.<br />
in <strong>2007</strong> and 2006 the company met all requirements specified above that qualifies for reduced<br />
to 20% income tax rate approved by the parliament of the Perm region.<br />
* Profit before taxation on Switzerland, Gibraltar and Belorussian operations is assessed based on effective rate of 7% (December 31, 2006: 8%).<br />
<strong>2007</strong><br />
2006<br />
82
Restoring nature’s balance<br />
uRAlkAli<br />
As the company qualified for the above amendments it was taxed during the year ended<br />
December 31, <strong>2007</strong> and 2006, respectively, at a rate 20% instead of standard rate of 24%.<br />
Deferred tax has been computed in these consolidated financial statements using the standard<br />
rate applicable for future periods (i.e. 24%) as it is not certain whether the company will meet<br />
the requirements established by the statutory law to qualify for reduced rates in future years.<br />
December 31,<br />
2006<br />
Charged/<br />
(credited)<br />
to profit or loss<br />
Tax effects of taxable temporary differences:<br />
Property, plant and equipment (659) 121 (538)<br />
investments (54) (1) (55)<br />
inventories (59) (1) (60)<br />
Borrowings (25) 20 (5)<br />
(797) 139 (658)<br />
Tax effects of deductible temporary differences:<br />
Finance lease 79 - 79<br />
Mine flooding reserve 163 (158) 5<br />
Accounts receivable 10 - 10<br />
Accounts payable 57 51 108<br />
other 65 (5) 60<br />
374 (112) 262<br />
Total net deferred tax liability (423) 27 (396)<br />
Tax effects of taxable temporary differences:<br />
December 31,<br />
2005<br />
Charged/<br />
(credited)<br />
to profit or loss<br />
Annual report<br />
December 31,<br />
<strong>2007</strong><br />
December 31,<br />
2006<br />
Property, plant and equipment (909) 250 (659)<br />
investments (15) (39) (54)<br />
inventories (87) 28 (59)<br />
Borrowings (28) 3 (25)<br />
(1,039) 242 (797)<br />
Tax effects of deductible temporary differences:<br />
Finance lease 79 - 79<br />
Earth replacement reserve 47 (47) -<br />
Mine flooding reserve - 163 163<br />
Accounts receivable 8 2 10<br />
Accounts payable - 57 57<br />
other 30 35 65<br />
164 210 374<br />
Total net deferred tax liability (875) 452 (423)<br />
The Group has not recognized a deferred tax liability in respect of temporary differences<br />
associated with investments in subsidiaries in the amount of RR 39 (December 31, 2006: RR<br />
39). The Group controls the timing of the reversal of those temporary differences and does<br />
not expect their reversal in the foreseeable future.<br />
83
Annual report<br />
28<br />
Post employment<br />
benefits obligations<br />
<strong>2007</strong><br />
iFRS<br />
coNSoliDATED<br />
FiNANciAl<br />
STATEMENTS<br />
in addition to statutory pension benefits, the company also has several post-employment<br />
benefit plans, which cover most of its employees.<br />
The company provides financial support of a defined benefit nature to its pensioners.<br />
The plans provide for payment of retirement benefits starting from the statutory<br />
retirement age, which is currently 55 for women and 60 for men. The amount of benefit<br />
depends on a number of parameters, including the length of service in the company at<br />
retirement. The benefits do not vest until and are subject to the employee retiring from<br />
the company on or after the above-mentioned ages. This plan was introduced in the<br />
collective Bargaining Agreement concluded in <strong>2007</strong>.<br />
The company further provides other long-term employee benefits such as lumpsum<br />
payments upon death of its current employees and pensioners and a lump-sum<br />
payment upon retirement of a defined benefit nature.<br />
As at December 31, <strong>2007</strong> and December 31, 2006 the net liabilities of defined benefit plan<br />
and other post-employment benefit plans comprised the following:<br />
Present value of defined benefit obligations (DBO) 324 28<br />
Present value of unfunded obligations 324 28<br />
unrecognised past service cost (77) -<br />
Post employment benefits obligations 247 28<br />
The amount of net expense for the defined benefit pension plans recognized in the consolidated<br />
statement of income (Note 23) was as follows:<br />
current service cost 9 4<br />
interest cost 15 2<br />
Net actuarial losses/(gains) recognised during the year 63 (9)<br />
Amortization of past service cost 4 -<br />
immediate recognition of vested prior service cost 106 -<br />
other 35 -<br />
Post employment benefits 232 (3)<br />
The movements in the liability for post-employment benefit plans were as follows:<br />
Present value of defined benefit obligations (DBO) as of January 1 28 37<br />
Service cost 9 4<br />
interest cost 15 2<br />
Actuarial loss/(gain) 63 (9)<br />
Past service cost 187 -<br />
Benefits paid (13) (6)<br />
other 35 -<br />
Present value of defined benefit obligations (DBO) as of December 31 324 28<br />
<strong>2007</strong><br />
<strong>2007</strong><br />
<strong>2007</strong><br />
2006<br />
2006<br />
2006<br />
84
Restoring nature’s balance<br />
uRAlkAli<br />
As at December 31, <strong>2007</strong> and 2006, respectively, the principle actuarial assumptions for the<br />
post-employment benefit plans were as follows:<br />
<strong>2007</strong><br />
2006<br />
Discount rate 6.60% 6.80%<br />
Salary increase 8.12% 7.10%<br />
inflation 6.00% 5.00%<br />
Benefits increase (fix-amounted) 6.00% 5.00%<br />
Mortality tables Russia (1986-87) Russia (1986-87)<br />
Net deficit on the post-employment benefit plans and the amount of experience adjustments<br />
for the years ended December 31, <strong>2007</strong> and 2006, respectively, were as follows:<br />
Present value of defined benefit obligations (DBo) 324 28<br />
Deficit in plan 324 28<br />
Losses/(gains) arising of experience adjustments on plan liabilities 5 (9)<br />
29<br />
Earnings per share<br />
Basic earnings per share are calculated by dividing the net profit attributable to equity<br />
holders of the company by the weighted average number of ordinary shares in issue during<br />
the year, excluding treasury shares (Note 15).<br />
The company has no dilutive potential ordinary shares, therefore, the diluted earnings<br />
per share equals the basic earnings per share.<br />
Net profit 8,045 3,494<br />
Weighted average number of ordinary shares in issue (millions) 2,102 2,110<br />
Basic and diluted earnings per share (expressed in RR per share) 3.83 1.66<br />
<strong>2007</strong><br />
<strong>2007</strong><br />
Annual report<br />
2006<br />
2006<br />
85
Annual report<br />
30<br />
contingencies,<br />
commitments<br />
and operating risks<br />
<strong>2007</strong><br />
iFRS<br />
coNSoliDATED<br />
FiNANciAl<br />
STATEMENTS<br />
i Legal proceedings<br />
From time to time and in the normal course of business, claims against the Group<br />
are received. in March 2006, the prosecutor’s office of St.-Petersburg filed a claim with<br />
the Arbitration court of St.-Petersburg and leningrad Region seeking to render nul and<br />
void an agreement between JSc “BBT” and FGuP “Rosmorport“, pursuant to which<br />
JSc “BBT” currently leases one of its berths, on the grounds that this lease agreement<br />
was executed without appropriate consent of state authorities and in violation of established<br />
procedures. At court hearing held on August 21, <strong>2007</strong> the Arbitration court of<br />
St.-Peterburg and leningrad region dismissed the prosecutor’s claim. The court decision<br />
came into force in February 2008 after the prosecutor’s appeal was defeated.<br />
in April <strong>2007</strong> the Federal Antimonopoly Service concluded that the Group breached<br />
the Federal law “on defence of competition” law by abusing its dominant position<br />
and establishing monopolistically high domestic potash prices in <strong>2007</strong>. Based on these<br />
findings, the FAS sought to set a maximum average weighted domestic potash price<br />
for <strong>2007</strong> and required “uralkali” to pay approximately RuR 62 million to the federal<br />
budget for the first quarter of <strong>2007</strong>. The FAS findings, prescriptions and penalties were<br />
invalidated by the Russian arbitration court in october <strong>2007</strong>. However, the FAS appealed<br />
this decision and the parties have agreed to sign a settlement agreement to<br />
resolve the dispute. According to the settlement agreement, which was approved by<br />
the Russian arbitration court on March 12, 2008, the Group has agreed to pay RuR 49<br />
million to the federal budget in respect of domestic potash prices for the nine months<br />
ended September 30, <strong>2007</strong>. The FAS has acknowledged in the agreement that Group’s<br />
domestic potash prices for the fourth quarter of <strong>2007</strong> were compliant with Russian antimonopoly<br />
law. in addition, the Group and the FAS have agreed a formula for determining<br />
Group’s domestic potash prices going forward. The formula links domestic prices<br />
to certain minimum export market prices (currently — FoB china), while adjusting for<br />
certain export costs. According to the agreement, this formula will be effective for five<br />
years, subject to an automatic extension for a further five years if neither party objects<br />
to the extension.<br />
on the basis of its own estimates and both internal and external professional advice<br />
the Management is of the opinion that no material losses will be incurred in respect<br />
of claims in excess of provisions that have been made in these consolidated financial<br />
statements.<br />
ii Tax legislation<br />
Russian tax, currency and customs legislation is subject to varying interpretations,<br />
and changes, which can occur frequently. Management’s interpretation of such legislation<br />
as applied to the transactions and activity of the Group may be challenged by the<br />
relevant regional and federal authorities. Recent events within the Russian Federation<br />
suggest that the tax authorities may be taking a more assertive position in their interpretation<br />
of the legislation and assessments, and it is possible that transactions and<br />
activities that have not been challenged in the past may be challenged. The Supreme<br />
Arbitration court issued guidance to lower courts on reviewing tax cases providing a<br />
systemic roadmap for anti-avoidance claims, and it is possible that this will significantly<br />
increase the level and frequency of tax authorities scrutiny. As a result, significant additional<br />
taxes, penalties and interest may be assessed. Fiscal periods remain open to<br />
review by the authorities in respect of taxes for three calendar years preceding the year<br />
of review. under certain circumstances reviews may cover longer periods.<br />
The Russian transfer pricing rules, which were introduced from January 1, 1999,<br />
provide the possibility for the Russian tax authorities to make transfer pricing adjustments<br />
and impose additional tax liabilities in respect to certain controllable transactions,<br />
provided that the tax authorities prove that the transaction price established by the<br />
parties differs from the market price by more than 20%.<br />
The controllable transactions include transactions with interdependent parties under<br />
the Russian Tax code, all cross-border transactions (irrespective of whether performed<br />
between related or unrelated parties), transactions where the price applied by<br />
86
Restoring nature’s balance<br />
uRAlkAli<br />
a taxpayer differs by more than 20% from the price applied in similar transactions by<br />
the same taxpayer within a short period of time. There is no formal guidance as to how<br />
these rules should be applied in practice. in the past, the arbitration court practice with<br />
this respect has been contradictory.<br />
The form of the uralkali Group intercompany and related party (Note 6) transactions<br />
would generally meet the literal requirements of the applicable tax legislation<br />
and as such have not been challenged in the past. However, it is possible with the<br />
evolution of the interpretation of the Russian transfer pricing rules in the Russian<br />
Federation and the changes in the approach of the Russian tax authorities, that such<br />
past transactions could potentially be challenged in the future by relevant local and<br />
federal tax authorities. Given the brief nature of the current Russian transfer pricing<br />
rules, the impact of any such challenge cannot be reasonably estimated, however<br />
it may be significant. The management believes that the tax position taken by the<br />
Group in respect of such transactions complies with the relevant legislation and therefore<br />
is defensible in the event of a challenge by the tax authorities. The management<br />
believes that no significant additional taxes, penalties, and interest would be imposed<br />
by the tax authorities.<br />
The Group’s management believes that its interpretation of the relevant legislation<br />
is appropriate and the Group’s tax, currency legislation and customs positions will be<br />
sustained. Accordingly, at December 31, <strong>2007</strong> and December 31, 2006 no provision<br />
for potential tax liabilities had been recorded. Management will continue to monitor<br />
the situation as legislation and practice evolve in the jurisdictions in which the Group<br />
operates.<br />
iii Insurance policies<br />
The company holds an insurance policy with cJSc “AiG Russia insurance company”<br />
and JSc “Russia insurance company”. These agreements cover main risks relating<br />
to company’s assets situated above and under ground, risks relating to suspension of<br />
production and risks related to civil responsibility. However risks reflected in Note 5 are<br />
not covered, therefore no losses from the flooding of the Mine 1 are expected to be<br />
compensated.<br />
The insurance agreements do not cover the risks of damage to third parties’ property<br />
resulting from the Group’s underground activities.<br />
The total insurance premium related to abovementioned agreements of RR 181 was<br />
recognized as an expense for the year ended December 31, <strong>2007</strong> (for the year ended<br />
December 31, 2006: RR 177) (Note 22).<br />
iv Environmental matters<br />
The enforcement of environmental regulation in the Russian Federation is evolving<br />
and the enforcement posture of government authorities is continually being reconsidered.<br />
The Group periodically evaluates its obligations under environmental regulations.<br />
As obligations are determined, they are recognised immediately. Potential liabilities,<br />
which might arise as a result of changes in the existing regulations, civil litigation or<br />
legislation, cannot be estimated.<br />
in the current enforcement climate under existing legislation, management believes<br />
that there are no significant liabilities for environmental damage due to legal requirements<br />
except for those mentioned in Note 5. Provision for site restoration and reclamation<br />
costs was created for the constructive obligation attributable to earth replacement<br />
and brine injection activities under the town of Berezniki. No provision is recognized for<br />
cavities excavated in other areas, not located under the town of Berezniki.<br />
The company’s mining activities and the recent mine flooding may cause subsidence<br />
that may affect the company’s facilities, and those of the city of Berezniki, State<br />
organizations and others. The company has no claims from state organisations and<br />
others against it, nor expects any, but can not estimate the likelihood or amount of the<br />
economic outflows arising from subsidence, which could be significant.<br />
Annual report<br />
87
Annual report<br />
<strong>2007</strong><br />
iFRS<br />
coNSoliDATED<br />
FiNANciAl<br />
STATEMENTS<br />
v Operating environment of the Group<br />
Whilst there have been improvements in economic trends in the Russian Federation,<br />
the country continues to display certain characteristics of an emerging market. These<br />
characteristics include, but are not limited to, the existence of<br />
a currency that is in practice not convertible in most countries outside of the Russian<br />
Federation and relatively high inflation. The tax, currency and customs legislation<br />
within the Russian Federation is subject to varying interpretations, and changes, which<br />
can occur frequently.<br />
The future economic direction of the Russian Federation is largely dependent upon<br />
the effectiveness of economic, financial and monetary measures undertaken by the<br />
Government, together with tax, legal, regulatory, and political developments.<br />
vi Capital expenditure commitments<br />
At December 31, <strong>2007</strong> the Group had contractual commitments for the purchase<br />
of property, plant and equipment from third parties for RR 1,390 (December 31, 2006:<br />
RR 879).<br />
The Group has already allocated the necessary resources in respect of these commitments.<br />
The Group believes that future net income and funding will be sufficient to<br />
cover this and any similar such commitments.<br />
vii Guarantees<br />
Guarantees are irrevocable assurances that the Group will make payments in the<br />
event that another party cannot meet its obligations. At December 31, <strong>2007</strong> the Group<br />
issued guarantees in favour of third parties in the amount of RR 25 (December 31,<br />
2006: RR 12).<br />
viii Registration of rights for berth No. 106<br />
JSc “BBT” has no registered rights in respect of berth No. 106, which is essential<br />
for its operations. Effective operation of JSc “BBT” depends on its access to berths<br />
No. 107 and No. 106, the only two berths available to JSc “BBT” for loading mineral<br />
fertilisers to sea vessels. Both berths are owned by the Russian Federation. From August<br />
2005 JSc “BBT” has been operating berth No. 106 without having any right to such<br />
berth registered and without a clear legal background to utilise such berth under the<br />
so-called “regime of experimental operation,” the legal status of which is not regulated<br />
by Russian law and remains highly uncertain. JSc “BBT” intends to enter into a lease<br />
agreement in respect of berth No. 106 but the conclusion of the lease agreement was<br />
complicated because FGuP “Rosmorport” has not completed in time the necessary<br />
formalities to register the berth as a real estate unit and perform market valuation of this<br />
asset. Registration of the berth as a real estate was obtained by FGuP “Rosmorport”<br />
only in <strong>2007</strong> and its valuation is expected to be completed in 2008. JSc “BBT” is now<br />
negotiating with FGuP “Rosmorport” with respect to entering into a lease agreement<br />
on berth No. 106 and expects it to be concluded in 2008.<br />
88
Restoring nature’s balance<br />
31<br />
Financial risk<br />
management<br />
uRAlkAli<br />
31.1 Financial risk factors<br />
The Group’s activities expose it to a variety of financial risks: market risk (including<br />
currency risk, fair value interest rate risk, cash flow interest rate risk and price risk),<br />
credit risk and liquidity risk. overall risk management procedures adopted by the Group<br />
focus on the unpredictability of financial and commodity markets and seek to minimise<br />
potential adverse effects on the Group’s financial performance.<br />
(a) Market risk<br />
(i) Foreign exchange risk<br />
The Group operates internationally and exports approximately 91% of potash fertilisers<br />
produced. As a result the Group is exposed to foreign exchange risk arising from<br />
various currency exposures, primarily with respect to the uS dollar. Export sales are<br />
denominated in hard currency and settlements are made primarily in uS$.<br />
Foreign exchange risk arises when future commercial transactions or recognised<br />
assets or liabilities are denominated in a currency that is different from the functional<br />
currency of the companies of the Group. Management of the Group believes that the<br />
exposure to the foreign exchange risk is partially mitigated by the fact that both most<br />
of the Group’s borrowings (Note 17) and most of the Group’s export revenue proceeds<br />
are denominated in uS$. in addition from March <strong>2007</strong> the Group has certain arrangements<br />
with banks to hedge the Group’s foreign exchange risk exposure covering mainly<br />
future export revenue exercisable during the period ending February 2008.<br />
As of December 31, <strong>2007</strong>, if the RR had weakened/strengthened by 5% against uS$<br />
with all other variables held constant, post-tax profit for the year would have been RR 366<br />
lower/higher (December 31, 2006: 370 lower/higher), mainly as a result of foreign exchange<br />
gains/losses on translation of uS$ denominated trade receivables, cash in bank,<br />
deposits and foreign exchange losses/gains on translation of uS$ denominated borrowings.<br />
Equity would have been RR 218 (December 31, 2006: RR 151) lower/higher, due to change<br />
in translation reserve arising from Group companies, which functional currency is uS$.<br />
(ii) Price risk<br />
The Group is not exposed to commodity price risk because the Group does not enter<br />
in any operations with financial instruments whose value is exposed to value of commodities<br />
traded on the public market.<br />
(iii) Interest rate risk<br />
The Group’s income and operating cash flows are exposed to changes in market<br />
interest rates. The Group is exposed to fair value interest rate risk through market value<br />
fluctuations of interest bearing short-term and long-term borrowings, whose interest<br />
rates comprise a fixed component (Note 17). The Group has interest-bearing assets<br />
which are at fixed interest rates (Note 6, 14).<br />
The objective of managing interest rate risk is to prevent losses due to adverse<br />
changes in market interest rate level. The Group analyses its interest rate exposure on<br />
a dynamic basis. Various scenarios are simulated taking into consideration refinancing,<br />
renewal of existing positions and alternative financing.<br />
At December 31, <strong>2007</strong>, if liBoR rates on uS$ denominated borrowings had been<br />
10 basis points higher/lower with all other variables held constant, post-tax profit for<br />
the year would have been RR 75 (December 31, 2006: RR 56) lower/higher, mainly as<br />
a result of higher/lower interest expense on floating rate borrowings.<br />
Annual report<br />
89
Annual report<br />
<strong>2007</strong><br />
iFRS<br />
coNSoliDATED<br />
FiNANciAl<br />
STATEMENTS<br />
(b) Credit risk<br />
credit risk arises from the possibility that counterparties to transactions may default<br />
on their obligations, causing financial losses for the Group. The objective of managing<br />
credit risk is to prevent losses of liquid funds deposited with or invested in such counterparties.<br />
Financial assets, which potentially subject Group entities to credit risk, consist<br />
principally of trade receivables, cash and bank deposits. The maximum exposure to<br />
credit risk resulting from financial assets is equal to the carrying amount of the Group’s<br />
financial assets. The Group has no other significant concentrations of credit risk.<br />
cash and short-term deposits are placed in banks and financial institutions, which<br />
are considered at the time of deposit to have minimal risk of default.<br />
Trade receivables are subject to a policy of active credit risk management which focuses<br />
on an assessment of ongoing credit evaluation and account monitoring procedures. The<br />
objective of the management of trade receivables is to sustain the growth and profitability<br />
of the Group by optimising asset utilisation whilst maintaining risk at an acceptable level.<br />
The effective monitoring and controlling of credit risk is performed by the corporate treasury<br />
function of the Group. The credit quality of each new customer is analyzed before the<br />
Group enters into contractual agreements. The credit quality of other customers is assessed<br />
taking into account their financial position, past experience, country of origin and other factors.<br />
The management believes that the country of origin is one of the major factors affecting<br />
credit quality of the customer and makes corresponding analisys (Note 13). Most of the customers<br />
from developing countries are supplied on prepayment basis on the secured payment<br />
terms. These terms include deliveries against opened letters of credit and arrangements with<br />
banks on non-recourse discounting of promissory notes received from customers. only customers<br />
from developed countries with high reputation are supplied on credit basis.<br />
Although the collection of receivables could be influenced by economic factors,<br />
management believes that there is no significant risk of loss to the Group beyond the<br />
provision already recorded (Note 13).<br />
The table below shows the credit quality of cash and cash equivalents balances on<br />
the balance sheet date:<br />
Banks Agency<br />
Rating<br />
<strong>2007</strong><br />
2006<br />
Sberbank Moody`s Ааа.ru 2,251 1,271<br />
Vneshtorgbank S&P ruAA+ 2,020 78<br />
ural FD Moody`s Baa2.ru 1,027 330<br />
Hypovereinsbank Moody`s A1 630 254<br />
unrated 1,363 959<br />
Total 7,291 2,892<br />
(c) Liquidity risk<br />
in accordance with prudent liquidity risk management, the management of the<br />
Group aims to maintain sufficient cash in order to meet its obligations. Group treasury<br />
aims to maintain sufficient level of liquidity basing on monthly cash flow budgets, which<br />
are prepared for the year ahead and continuesly updated during the year.<br />
liquidity risk is defined as the risk that an entity will encounter difficulty in meeting<br />
obligations associated with financial liabilities.<br />
The table below analyses the Group’s financial liabilities into relevant maturity<br />
groupings based on the time remaining from the balance sheet to the contractual maturity<br />
date. The amounts disclosed in the table are the contractual undiscounted cash<br />
flows at spot rates.<br />
90
Restoring nature’s balance<br />
uRAlkAli<br />
Note Less than 1 year<br />
Between 2<br />
and 5 years<br />
Over 5 years<br />
As of December 31, <strong>2007</strong><br />
Trade and other payables 18 2,160 - -<br />
Borrowings 5,163 6,744 -<br />
Finance leasing 17 38 152 1,485<br />
As of December 31, 2006<br />
Trade and other payables 18 2,306 - -<br />
Borrowings 8,622 3,251 -<br />
Finance leasing 17 38 152 1,523<br />
31.2 Capital risk management<br />
The Group’s objectives when managing capital are to safeguard the Group’s ability<br />
to continue as a going concern, to provide returns for shareholders and benefits<br />
for other stakeholders and to maintain an optimal capital structure in order to reduce<br />
the cost of capital. The Group considers total capital to be total equity as shown in the<br />
consolidated balance sheet.<br />
consistent with others in the industry, the Group monitors capital on a debt to<br />
equity ratio basis. This ratio is calculated as sum of long-term and short-term bank borrowings<br />
divided by total equity.<br />
The debt to equity ratios as of December 31, <strong>2007</strong> and December 31, 2006 were<br />
as follows:<br />
Annual report<br />
December 31, <strong>2007</strong> December 31, 2006<br />
Total bank borrowings (Note 17) 10,600 11,088<br />
Total equity 25,074 17,650<br />
Debt to equity ratio 42% 63%<br />
As of December 31, <strong>2007</strong> management has set a level of 30% D/E ratio as strategic<br />
goal. Ratios as at December 31, <strong>2007</strong> and 2006, respectively, exceed the strategic goal<br />
level due to the considerably high dividend payout in 2006 and preceeding periods.<br />
91
Annual report<br />
32<br />
Fair value of financial<br />
instruments<br />
<strong>2007</strong><br />
iFRS<br />
coNSoliDATED<br />
FiNANciAl<br />
STATEMENTS<br />
Fair value is the amount at which a financial instrument could be exchanged in a<br />
current transaction between willing parties, other than in a forced sale or liquidation,<br />
and is best evidenced by an active quoted market price.<br />
The estimated fair values of financial instruments have been determined by the<br />
Group using available market information, where it exists, and appropriate valuation<br />
methodologies. However, judgement is necessarily required to interpret market data to<br />
determine the estimated fair value. The Russian Federation continues to display some<br />
characteristics of an emerging market and economic conditions continue to limit the<br />
volume of activity in the financial markets. Market quotations may be outdated or reflect<br />
distress sale transactions and therefore not represent fair values of financial instruments.<br />
Management has used all available market information in estimating the fair<br />
value of financial instruments.<br />
Financial instruments carried at fair value. Trading and available-for-sale investments<br />
are carried on the consolidated balance sheet at their fair value. cash and cash<br />
equivalents are carried at amortised cost which approximates current fair value.<br />
Fair values were determined based on quoted market prices except for certain investment<br />
securities available for sale for which there were no available external independent<br />
market price quotations. These securities have been fair valued by the Group<br />
on the basis of results of recent sales of equity interests in the investees between unrelated<br />
third parties, consideration of other relevant information such as discounted cash<br />
flows and financial data of the investees and application of other valuation methodologies.<br />
Valuation techniques required certain assumptions that were not supported by<br />
observable market data. changing any such used assumptions to a reasonably possible<br />
alternative would not result in a significantly different profit, income, total assets or<br />
total liabilities.<br />
Financial assets carried at amortised cost. The fair value of floating rate instruments<br />
is normally their carrying amount. The estimated fair value of fixed interest rate<br />
instruments is based on estimated future cash flows expected to be received discounted<br />
at current interest rates for new instruments with similar credit risk and remaining maturity.<br />
Discount rates used depend on credit risk of the counterparty. carrying amounts<br />
of trade receivables approximate fair values.<br />
Liabilities carried at amortised cost. The fair value is based on quoted market<br />
prices, if available. The estimated fair value of fixed interest rate instruments with stated<br />
maturity, for which a quoted market price is not available, was estimated based on expected<br />
cash flows discounted at current interest rates for new instruments with similar<br />
credit risk and remaining maturity. The fair value of liabilities repayable on demand or<br />
after a notice period (“demandable liabilities”) is estimated as the amount payable on<br />
demand, discounted from the first date that the amount could be required to be paid.<br />
Estimated fair values of borrowings are presented in Note 17.<br />
92
33<br />
Events after balance<br />
sheet date<br />
Restoring nature’s balance<br />
uRAlkAli<br />
Results of the auction for rights to develop “Verkhnekamskoe Potash Deposit”<br />
The auction for licenses to develop “Verkhnekamskoe Potash Deposit” in Perm Region<br />
took place on March 12, 2008. Three licences, two of which were for “Talitski” and<br />
“Polovodovski” sections of the “Verkhnekamskoe Potash Deposit”, were auctioned.<br />
Given the Group’s positioning to develop the fields, the company saw them as potentially<br />
interesting. Group’s unique position and ability to explore these fields encouraged<br />
it to take part in the auction and the Group was ready to offer a premium. However,<br />
none of these licences were acquired by the Group during the auctions.<br />
Export duties<br />
in March 2008 the Government of the Russian Federation introduced duties, effective<br />
from April 2008, on exports of potassium chloride destined for countries outside<br />
the ciS members of the customs union with the Russian Federation. The duty applicable<br />
to uralkali’s potassium chloride is 5% of the declared customs value, which the Group<br />
expects to be charged on almost all of the Group’s potassium chloride exports.<br />
The Group does not expect the Export Duties Resolution to have a materially adverse<br />
impact on its business, prospects, financial condition or strategy. However, the<br />
Group expects the Export Duties Resolution to be an additional factor affecting prices<br />
of potassium chloride in the international market.<br />
Borrowings<br />
in January-February 2008 the Group entered into two short-term loan agreements<br />
with “Sberbank” for approximately RR 2,450 (uS$ 100 million).<br />
in January 2008 the Group has also entered into renewable credit line agreement<br />
with “Sberbank” for RR 2,450, of which RR 2,400 is repayable in January 2009 and the<br />
rest progressively until January 2011.<br />
Social commitments<br />
in February 2008 the company commited to finance the construction of a health<br />
center and a kindergarten in Berezniki and signed a cooresponding agreement with the<br />
authorities of the town. currently the construction price estimate is being prepared by<br />
the subcontractors of the company. Basing on preliminary estimation the construction<br />
cost could amount to RR 300.<br />
Annual report<br />
93
Annual report<br />
Shareholder<br />
structure<br />
Trading floors:<br />
Shareholders structure<br />
January 1, <strong>2007</strong><br />
Dividends<br />
declared<br />
legal entities<br />
an individuals 19,99%<br />
Madura Holding<br />
limited 80%<br />
<strong>2007</strong><br />
in <strong>2007</strong>, the charter capital of uralkali remained unchanged and as of December 31,<br />
<strong>2007</strong> was equal to 1,062,195,000 rubles. The charter capital of uralkali is split into<br />
2,124,390,000 registered ordinary shares, each having a nominal value of 0,5 RuR.<br />
Directive of the Federal commission for the Securities Market of Russia No. 04-81/r,<br />
dated January 16, 2004, united the additional issuances of securities of uralkali. As a<br />
result, the state registration number 1-01-00296A was assigned to the issuances of<br />
registered ordinary shares of uralkali issued in non-documentary form.<br />
on August 1, 2006, the Extraordinary General Meeting of Shareholders of uralkali<br />
approved the execution of an underwriting agreement by uralkali. in August 2006,<br />
uralkali signed a depositary agreement with The Bank of New York under which the<br />
issue of Global Depositary Receipts (GDRs) began in <strong>2007</strong>. The shares in uralkali are<br />
converted into GDRs on a 5 : 1 ratio.<br />
As of December 31, <strong>2007</strong>, the ordinary shares in uralkali and global depositary receipts<br />
certifying the righst in respect of the ordinary shares in uralkali are traded on the following<br />
trading floors: RTS; MicEX; lSE.<br />
2 Shareholders structure<br />
December 31, <strong>2007</strong><br />
The Bank<br />
of New York 15,9%<br />
legal entities<br />
an individuals 18,43%<br />
Madura Holding<br />
limited 65,62%<br />
in <strong>2007</strong>, the General Meeting of Shareholders of uralkali did not adopt a resolution on<br />
the payment of dividends. in the accounting year, the company paid dividends accrued<br />
for the company’s performance in previous years to shareholders whose client accounts<br />
were assigned the status of “securities of a non-identified person” and shareholders<br />
that failed to specify yield payment method. The company discloses information about<br />
the amount of dividends actually paid for the above-mentioned periods in the issuer’s<br />
quarterly reports available to each shareholder from the website of the company.<br />
94
composition<br />
of the Board of<br />
Directors 1<br />
4<br />
5<br />
6<br />
7<br />
8<br />
9<br />
Restoring nature’s balance<br />
uRAlkAli<br />
1<br />
DMiTRY Y. RYBoloVlEV<br />
chairman of the Board of Directors since 1999.<br />
Born in 1966. obtained a degree in General<br />
Medicine from the Perm Medical institute.<br />
D. E. Rybolovlev is a member of the Audit<br />
committee under the Board of Directors of uralkali.<br />
Member of the Russian union of industrialists<br />
and Entrepreneurs.<br />
2 ANATolY A. lEBEDEV<br />
Member of the Board of Directors since 2004.<br />
Deputy chairman of the Board of Directors since<br />
2006. Vice President for legal Matters since 2004.<br />
Born in 1974. in 1996, he obtained a degree in law<br />
from the Moscow State university.<br />
Member of the information Disclosure committee<br />
of the Board of Directors of uralkali.<br />
3<br />
VlADiSlAV A. BAuMGERTNER<br />
Member of the Board of Directors since 2004.<br />
President since 2004.<br />
General Director and chairman of the Board of<br />
managers since 2005<br />
Born in 1972. in 1994, he obtained a degree in<br />
Power Plants and the qualifications of Electrical<br />
Engineer from the urals State Technical university. in<br />
2000, he obtained an МВА from kingston Business<br />
School; in 2003, MSc in Financial Management from<br />
the university of london.<br />
4<br />
ilYA A. YuZHANoV<br />
Member of the Board of Directors since 2006.<br />
Born in 1960. in 1982, he graduated from Zhdanov<br />
leningrad State university as economist.<br />
Holds a Ph.D. in Economics.<br />
i. A. Yuzhanov chairs the Audit committee of the<br />
Board of Directors of uralkali.<br />
Since 2000, he has been a member of the Board of<br />
Directors and since 2004 chairman of the Appraisal<br />
committee of RAo uES of Russia.<br />
Since 2006, he has been a member of the Board<br />
of Directors of Novatek, kirovskiy Zavod and the<br />
Supervisory Board of Joint-Stock investment and<br />
commercial Bank Novaya Moskva (Nomos Bank).<br />
5<br />
YuRi V. GAVRiloV<br />
Member of the Board of Directors since 2000.<br />
Born in 1969. in 1994, he obtained a degree in<br />
Mechanical Engineering and Research from the Perm<br />
State Technical university.<br />
chairman of the information Disclosure committee<br />
of the Board of Directors of uralkali and member of<br />
the Audit committee of the Board of Directors of<br />
uralkali.<br />
Since 1999, he has held the position of Director<br />
General of ik Finansovy Dom.<br />
6<br />
AlEXANDER R. ZuEV<br />
Member of the Board of Directors since 2002.<br />
Vice President for Regional Development since<br />
2005.<br />
Born in 1957. in 1988, he obtained a degree in law<br />
from the Perm State university.<br />
Member of the Audit committee of the Board of<br />
Directors of uralkali.<br />
1 THE DATA<br />
as of December 31,<br />
<strong>2007</strong><br />
1<br />
2<br />
3<br />
Annual report<br />
7<br />
kuZMA V. MARcHuk<br />
Member of the Board of Directors since <strong>2007</strong>. Vice<br />
President for Finance since 2004.<br />
Born in 1973. in 1996, he obtained a degree in<br />
Physics from the Moscow State university. in 1995,<br />
he obtained a degree in Foreign Economic Activities<br />
of Enterprises and organizations and the qualifications<br />
of international Business Expert from the<br />
Plekhanov Russian Academy of Economics.<br />
8<br />
AlEXEY N. STARkoV<br />
Member of the Board of Directors since <strong>2007</strong>.<br />
Born in 1962. in 1988, he obtained a degree in Aircraft<br />
Engines from the Perm Polytechnical institute.<br />
Member of the information Disclosure committee<br />
of the Board of Directors of uralkali.<br />
Since 1995, he has held the position of Executive<br />
Director of kapital Private Pension Fund.<br />
Since 1998, he has held the position of Director<br />
General of kamenny Poyas.<br />
9<br />
VlADiMiR A. SHEVTSoV<br />
Member of the Board of Directors since 2000.<br />
Born in 1951. in 1982, he obtained a degree in<br />
History and Social Science from V. i. lenin Military<br />
and Political Academy. Holds a Ph.D. in Economics.<br />
The membership of the Board of Directors was approved by the<br />
resolution of the Annual General Meeting of Shareholders of<br />
uralkali of June 21, <strong>2007</strong>. The previous membership approved<br />
in June 2006 was as follows: D. E. Rybolovlev (chairman),<br />
M. P. Bakshinsky, V. A. Baumgartner, Yu. V. Gavrilov, A. R. Zuyev,<br />
V. A. karpov, A. A. lebedev, V. A. Shevtsov, i. A. Yuzhanov.<br />
95
Annual report<br />
Mineral<br />
resources<br />
and ore<br />
reserves<br />
introduction<br />
<strong>2007</strong><br />
This report gives SRk’s understanding of<br />
the resource and reserve estimates reported<br />
by uralkali, the work done to derive<br />
these and SRk’s view regarding the<br />
tonnes and grade of rock which has the<br />
potential to be mined by the existing and<br />
planned mining operations (the Mineral<br />
Resource) and also the quantity of product<br />
expected to be produced as envisaged<br />
by the respective Business Plan (the ore<br />
Reserve).<br />
SRk has not independently re-calculated<br />
Mineral Resource and ore Reserve estimates<br />
for uralkali’s operation but it has,<br />
rather, reviewed the quantity and quality<br />
of the underlying data and the methodologies<br />
used to derive and classify the estimates<br />
as reported by uralkali and made<br />
an opinion on these estimates, including<br />
the tonnes, grade and quality of the potash<br />
planned to be exploited in the current<br />
mine plan, based on this review. SRk has<br />
then used this knowledge to derive audited<br />
resource and reserve statements according<br />
to the guidelines and terminology<br />
proposed in the JoRc code.<br />
This report presents both the existing<br />
uralkali resource estimates according to<br />
Russian standard reporting terminology<br />
and guidelines and SRk’s audited JoRc<br />
code statements. All of these estimates<br />
are dated as of 1 January 2008. SRk has<br />
restricted its assessment to the resources<br />
and reserves at Mine 2, Mine 4 and Mine<br />
5. Mine 1 and 3 have been excluded as<br />
these have no realistic potential to be reopened<br />
in the foreseeable future. The resources<br />
to the south of Mine 5 have not<br />
been included as these licences have not<br />
yet been made available for acquisition.<br />
96
Quantity and<br />
quality of data<br />
Restoring nature’s balance<br />
uRAlkAli<br />
The resource and reserve estimates derived<br />
by uralkali are primarily based on<br />
exploration drilling undertaken between<br />
1972 and 1989. There is no exploration<br />
drilling currently being undertaken from<br />
surface. A specially laid out drilling programme<br />
was developed for each mine<br />
with the aim of enabling 10% of the contained<br />
resources to be assigned to the A<br />
category of resources as defined by the<br />
Russian Reporting code, 20% to the B<br />
category and 70% to the c1 category.<br />
The A category is the highest category<br />
in the Russian Reporting code and only<br />
used where the stated tonnage and grade<br />
estimates are considered to be known to<br />
a very high degree of accuracy. The B, c1<br />
and c2 categories are lower confidence<br />
categories, with c2 denoting the least<br />
level of confidence in the three categories.<br />
All of these categories, apart from<br />
c2, are acceptable for use in supporting<br />
mining plans and feasibility studies. in the<br />
case of uralkali, blocks are assigned to the<br />
A category where the drillhole spacing is<br />
less than 1 km, to the B category where<br />
the drillhole spacing is between 1 and<br />
2 km and to the c1 category where the<br />
drillhole spacing is 2 km. Areas drilled at<br />
a larger spacing than this, up to a 4 km<br />
spacing, are assigned to the c2 category,<br />
though only a very small proportion of<br />
uralkali’s resources have been categorised<br />
as such.<br />
As a result in the above process, each mine<br />
is drilled on a 2 km by 2 km grid or less<br />
before a decision is taken to develop the<br />
mine. This information is, however, then<br />
supplemented by underground drilling<br />
once the access development is in place.<br />
This typically creates a grid of intersections<br />
measuring 400 m by 200 m. uralkali<br />
does not upgrade the categorisation of its<br />
resources based on this drilling but rather<br />
uses this to optimise the mining layouts.<br />
The drillholes, whether drilled from surface<br />
or underground, are sampled at intervals<br />
of at least 16 cm and the samples<br />
Annual report<br />
are crushed and milled under the control<br />
of the geology department to produce an<br />
approximate 100 g sample prior to submission<br />
to the laboratory.<br />
Assaying is carried out at an in house laboratory.<br />
No samples are sent to any independent<br />
laboratories but there is an internal<br />
system of check assaying and repeat<br />
assaying. Approximately 5% of samples<br />
are repeat assayed. All assaying is by classical<br />
wet chemistry techniques.<br />
SRk considers that the exploration approach<br />
followed by uralkali has been<br />
appropriate and specifically aimed at<br />
collecting the data appropriate to the<br />
estimation of potash resources and that<br />
sufficient data of sufficient quality has<br />
been collected to support the resource<br />
estimates as derived by uralkali and as<br />
presented here.<br />
97
Annual report<br />
Resource<br />
estimation<br />
introduction<br />
<strong>2007</strong><br />
introduction<br />
The most up to date resource statements<br />
produced by uralkali are those derived<br />
for the annual 5GR reports produced earlier<br />
this year which give the status as of<br />
January 1, 2008. The completion of 5GR<br />
reports is a statutory requirement. These<br />
estimates were produced using standard<br />
classical Russian techniques and are essentially<br />
based on calculations made in<br />
previous years adjusted for mining during<br />
<strong>2007</strong>. This section therefore comments<br />
primarily on these statements.<br />
uralkali estimation<br />
methodology<br />
Each seam and each mine is treated separately<br />
in the resource estimation procedure.<br />
in each case the horizons are first<br />
divided into blocks such that each subdivided<br />
block has reasonably consistent<br />
borehole spacing within it; that is more<br />
intensely drilled areas are subdivided from<br />
less intensely drilled areas. Each resulting<br />
“resource block” is then evaluated separately<br />
using the borehole intersections<br />
falling within that block only.<br />
Specifically, composite k 2 o and Mgo<br />
grades are derived for each borehole that<br />
intersected each block and mean grades<br />
are then derived for each block by simply<br />
calculating a length weighted average of<br />
all of these composited intersections. No<br />
top cuts are applied and all intersections<br />
are allocated the same weighting.<br />
A separate plan is produced for each seam<br />
showing the results of the above calculations,<br />
the lateral extent of each sub block,<br />
and any areas where the seams are not<br />
sufficiently developed. The aerial coverage<br />
of each block is then used with the<br />
mean thickness of the contained intersections<br />
to derive a block volume. The tonnage<br />
for each block is then derived from<br />
this by applying a specific gravity factor<br />
calculated by averaging all of the specific<br />
gravity determinations made from samples<br />
within that block.<br />
The data for each resulting block is plotted<br />
on a Horizontal longitudinal Projection<br />
(HlP). This shows the horizontal projection<br />
of the extent of each block as well as<br />
its grade and contained tonnage. The HlP<br />
also shows the block classification, this being<br />
effectively a reflection of the confidence<br />
of the estimated tonnes and grade.<br />
uralkali resource<br />
statements<br />
Table 1 below summarises SRk’s understanding<br />
of the resource statements prepared<br />
by uralkali to reflect the status of its<br />
assets as of January 1, 2008. in addition to<br />
this material, uralkali also extracts and sells<br />
a certain amount of carnallite, which is a requirement<br />
of uralkali’s licence agreements,<br />
and also a very small amount of halite and<br />
so-called mixed salts. The revenues from<br />
the sale of these products is, however, not<br />
material to uralkali’s cash flows and has not<br />
therefore been included in these tables or<br />
commented on in any detail in this report.<br />
uralkali’s statements are based on a minimum<br />
mining width of 2 m and a minimum<br />
block grade of 13% k 2 o.<br />
SRk comments<br />
SRk has reviewed the estimation methodology<br />
used by uralkali to derive the above<br />
estimates and the geological assumptions<br />
made and considers these to be reasonable<br />
given the information available. SRk<br />
has also undertaken various re-calculations<br />
both of individual blocks and seams<br />
as a whole and has in all cases found no<br />
material errors or omissions and has replicated<br />
the estimates derived by uralkali<br />
to within 5%.<br />
overall, SRk considers the resource estimates<br />
reported by uralkali to be a reasonable<br />
reflection of the total quantity<br />
and quality of material demonstrated to<br />
be present at the three assets as of January<br />
1, 2008.<br />
98
uRAlkAli<br />
Tab. 1. <strong>Uralkali</strong> sylvinite mineral resource<br />
Statement as of January 1, 2008<br />
Category Tonnage (Mt) K 2 O (%) K 2 O (Mt)<br />
Mine 2<br />
A 10.4 31.1 3.2<br />
B 52.5 22.7 11.9<br />
c1 296.5 24.7 73.2<br />
c2 - - -<br />
A+B+C1 359.4 24.6 88.3<br />
Mine 4<br />
A 435.0 21.6 93.9<br />
B 442.4 22.6 99.9<br />
c1 1,017.3 20.6 209.8<br />
c2 310.3 26.8 83.3<br />
A+B+C1 1,894.7 21.3 403.6<br />
Mine 5<br />
A 173.5 19.1 33.1<br />
B 311.5 19.8 61.8<br />
c1 816.3 19.8 161.6<br />
c2 - - -<br />
A+B+C1 1,301.4 19.7 256.5<br />
All Mines<br />
A 618.9 21.0 130.3<br />
B 806.4 21.5 173.6<br />
c1 2,130.1 20.9 444.5<br />
c2 310.3 26.8 83.3<br />
Grand Total A+B+C1 3,555.5 21.1 748.4<br />
SRk audited<br />
mineral resource<br />
statements<br />
Table 2 below presents SRk’s audited resource<br />
statement. SRk has re-classified<br />
the resource estimates using the terminology<br />
and guidelines proposed in the JoRc<br />
code. in doing this, SRk has reported<br />
those blocks classified as A or B by uralkali<br />
as Measured, those blocks classified as c1<br />
as indicated and those blocks classed as<br />
c2 as inferred. SRk’s audited Mineral Resource<br />
statements are reported inclusive<br />
of those Mineral Resources converted to<br />
ore Reserves. The audited ore Reserve<br />
is therefore a sub set of the Mineral Resource<br />
and should not therefore be considered<br />
as additional to this.<br />
SRk has not attempted to optimise uralka-<br />
Restoring nature’s balance<br />
li’s Business Plan. consequently, SRk’s audited<br />
resource statements are confined to<br />
those seams that both have the potential to<br />
be mined economically and which are currently<br />
being considered for mining only.<br />
SRk comments<br />
The audited Mineral Resource statement<br />
as at January 1, 2008 presented above<br />
is different to that presented as at January<br />
1, <strong>2007</strong> partly because of mining during<br />
<strong>2007</strong> and partly because these have<br />
been derived using revised protocols. Notably<br />
some 400 Mt of material previously<br />
reported as a resource at Mine 4 has been<br />
removed from the updated statement<br />
even though still estimated to be present<br />
in the ground. Notwithstanding this,<br />
work is being undertaken on an ongoing<br />
Annual report<br />
basis to review the mining layout and pillar<br />
configuration and it remains possible<br />
that this material may be re-introduced<br />
into the resource statement at some time<br />
in the future as a result of this.<br />
99
Annual report<br />
Tab. 2. SRK audited sylvinite mineral resource<br />
Statement as of January 1, 2008<br />
Category Tonnage (Mt) K 2 O (%) K 2 O (Mt)<br />
Mine 2<br />
Measured 62.9 24.1 15.1<br />
indicated 296.5 24.7 73.2<br />
inferred - - -<br />
Measured + indicated 359.4 24.6 88.3<br />
Mine 4<br />
Measured 877.3 22.1 193.9<br />
indicated 1,017.3 20.6 209.8<br />
inferred 310.3 26.8 83.3<br />
Measured + indicated 1,894.7 21.3 403.6<br />
Mine 5<br />
Measured 485.0 19.6 94.9<br />
indicated 816.3 19.8 161.6<br />
inferred - - -<br />
Measured + indicated 1,301.4 19.7 256.5<br />
All mines<br />
Measured 1,425.3 21.3 303.9<br />
indicated 2,130.1 20.9 444.5<br />
inferred 310.3 26.8 83.3<br />
Total measured + indicated 3,555.5 21.1 748.4<br />
ore reserve<br />
estimation<br />
<strong>2007</strong><br />
introduction<br />
uralkali does not report reserves as these<br />
are typically defined by reporting guidelines<br />
and terminology developed in Europe,<br />
North America and Australia; that<br />
is, estimates of the tonnage and grade of<br />
total material that is planned to be delivered<br />
to the various processing plants over<br />
the life of the mine. SRk has therefore<br />
derived estimates of such using historical<br />
information gained during its site visits<br />
regarding the mining losses and dilution<br />
experienced during mining to date. SRk<br />
has also restricted the resulting estimates<br />
to those areas planned to be mined by<br />
uralkali’s Business Plan during the next<br />
18 years. This Business Plan assumes that<br />
uralkali will successfully re-negotiate its<br />
Mining licences in 2013 and the ore Reserve<br />
Statements therefore also assume<br />
this will be the case.<br />
Modifying factors<br />
The Modifying Factors applicable to the<br />
derivation of reserves comprise estimates<br />
for ore losses and dilution associated with<br />
the separation of the ore and waste. This is<br />
normally a function of the ore-body characteristics<br />
and mining methods selected.<br />
The Modifying Factors considered by SRk<br />
to be appropriate for the sylvinite being<br />
mined at each of the assets is shown in<br />
Table 3 below. The ore losses primarily<br />
comprise material left behind in pillars<br />
while the grade factor represents the relationship<br />
between the grade of the ore delivered<br />
to the plant and the in-situ grade.<br />
uralkali undertakes an annual reconciliation<br />
to compare the ore tonnes mined<br />
each year with the resource that has been<br />
sterilized by this mining and it is these figures<br />
that SRk has reviewed to derive the<br />
ore loss factors. Similarly uralkali keeps a<br />
record of the in situ grade of the material<br />
sterilized by mining each year and SRk<br />
has compared these with the grade of<br />
material reported to have been fed to the<br />
plants to derive the grade factors. Given<br />
100
Tab. 3. SRK modifying factors<br />
uRAlkAli<br />
Description Units Mine 2 Mine 4<br />
ore loss (%) 65 63<br />
Extraction rate (%) 35 37<br />
Grade factor (%) 85 85<br />
this SRk is confident that the Modifying<br />
Factors used reflect the geometry of the<br />
ore-bodies being mined and the mining<br />
methods currently being used.<br />
SRk audited ore<br />
reserve statements<br />
As with its audited Mineral Resource<br />
statements, SRk’s ore Reserve statements<br />
have been re-classified using the<br />
terminology and guidelines proposed in<br />
the JoRc code.<br />
SRk has not been provided with an updated<br />
Business Plan and has therefore based<br />
its review on the on the Business Plan it<br />
audited in october <strong>2007</strong>. consequently,<br />
SRk’s audited ore Reserve statements are<br />
confined to those seams that are currently<br />
being considered for mining within the next<br />
18 years only. Specifically, for the operating<br />
mines, SRk has classed that material<br />
reported in the tables above as a Measured<br />
Mineral Resource, and which is planned to<br />
be exploited within the first ten years of the<br />
Business Plan, as a Proved ore Reserve; and<br />
that material reported in the tables above as<br />
Tab. 4. SRK audited sylvinite ore reserve<br />
Statement as of January 1, 2008<br />
Restoring nature’s balance<br />
an indicated Mineral Resource, and which<br />
is planned to be exploited within the Business<br />
Plan, and also that material reported<br />
above as a Measured Mineral Resource,<br />
but which is planned to be mined during<br />
the following 8 years of the Business Plan,<br />
as a Probable ore Reserve.<br />
SRk has been informed by uralkali that<br />
no material events have occurred during<br />
<strong>2007</strong> which would change uralkali’s<br />
mining and processing plans and has<br />
confirmed that the mining and processing<br />
performance during <strong>2007</strong> matched<br />
that assumed by the Business plan for this<br />
period in all material respects.<br />
While SRk understands that a Pre-Feasibility<br />
Study has now been prepared for Mine<br />
5, SRk has not had the opportunity to audit<br />
this and has therefore not transferred<br />
any of the reported Measured or indicated<br />
Mineral Resource to ore Reserve status.<br />
in addition no inferred Mineral Resources<br />
have been converted to ore Reserve.<br />
SRk can confirm that the ore Reserve defined<br />
in Table 4 below has been derived<br />
from the resource blocks provided to SRk<br />
and incorporates sufficient estimates for<br />
ore losses and dilution based on actual<br />
historical data.<br />
Category Tonnage (Mt) K 2 O (%) K 2 O (Mt)<br />
Mine 2<br />
Proved 22.0 20.4 4.5<br />
Probable 103.8 21.0 21.8<br />
Total 125.8 20.9 26.3<br />
Mine 4<br />
Proved 171.7 18.8 32.3<br />
Probable 151.9 18.8 28.6<br />
Total 323.6 18.8 60.8<br />
All mines<br />
Proved 193.7 19.0 36.8<br />
Probable 255.7 19.7 50.3<br />
Grand total 449.4 19.4 87.1<br />
Annual report<br />
The large difference between SRk’s audited<br />
Mineral Resource statement and its audited<br />
ore Reserve statement is partly a function<br />
of the relatively low mining recovery inherent<br />
in the Room and Pillar mining method<br />
employed. it is also partly a function of the<br />
fact that SRk has limited the ore Reserve<br />
statement to that portion of the Mineral<br />
Resource on which an appropriate level of<br />
technical work has been completed. in this<br />
case this relates to the period covered by<br />
uralkali’s 18 year Business Plan.<br />
SRk comments<br />
The audited ore Reserve statement as at<br />
January 1, 2008 presented above is different<br />
to that presented as at January 1,<br />
<strong>2007</strong> as a result of mining during <strong>2007</strong>.<br />
The ore Reserve statement is not affected<br />
by the material adjustment to the Mineral<br />
Resource commented upon above in<br />
Section 1.3 because the ore Reserve relates<br />
to the remaining 18 year life of the<br />
Business Plan which is unaffected by this<br />
adjustment.<br />
101
Annual report<br />
Risk<br />
factors<br />
This section describes the main risks that<br />
could have a significant effect on uralkali’s<br />
business, financial condition and results of<br />
operations. All estimates and forecasts presented<br />
in this Annual Report should be considered<br />
in connection with the risk factors<br />
described in this section. other risks that<br />
uralkali is currently not aware of or believes<br />
to be immaterial, could become material in<br />
future and also have a material adverse effect<br />
on uralkali’s business, financial condition<br />
and results of operations.<br />
<strong>Uralkali</strong>’s mining operations are subject<br />
to significant natural risks.<br />
uralkali’s mining operations are subject to<br />
hazards and risks normally associated with<br />
the exploration, development and production<br />
of natural resources. in particular,<br />
hazards associated with uralkali’s underground<br />
mining operations include:<br />
potential flooding;<br />
cave-ins or ground falls;<br />
underground fires and explosions, including<br />
those caused by flammable gas;<br />
discharges of gases;<br />
sinkhole formation and ground subsidence;<br />
other accidents and conditions resulting<br />
from drilling, blasting and removing and<br />
processing material from an underground<br />
mine; and<br />
seismic activity.<br />
if any of such risks materialises, it could<br />
have a material adverse effect on uralkali’s<br />
business, financial condition and results of<br />
operations.<br />
Demand for potash is affected by macroeconomic<br />
factors, and a downturn in<br />
such factors could have an adverse effect<br />
on <strong>Uralkali</strong>’s business.<br />
A number of macroeconomic factors, including<br />
changes in world population, availability<br />
of arable land per capita and income<br />
growth, drive demand for potash.<br />
<strong>2007</strong><br />
The relationship between population and<br />
demand for potash is closely linked. Rising<br />
population numbers increase demand for<br />
food, including crops and meat. increased<br />
demand for crops helps drive demand for<br />
potash because potash can help increase<br />
yield from available arable land. increased<br />
demand for meat drives demand for grain<br />
to provide animal feed, which in turn drives<br />
demand for potash. Population levels in certain<br />
markets that are important to uralkali,<br />
such as china, india, Brazil and Southeast<br />
Asia, have been growing. However, annual<br />
population growth rates in china, for<br />
example, have been below global population<br />
growth rates since 2000. Furthermore,<br />
population levels in the EEA and in Russia<br />
have been shrinking. The population<br />
trends in china, the EEA and Russia could<br />
have a material adverse effect on uralkali’s<br />
business, financial condition and results of<br />
operations.<br />
Arable landmass per capita may grow if<br />
forests are felled or undeveloped land is<br />
cultivated for farming, therefore reducing<br />
demand for potash by alleviating the pressure<br />
to increase crop yields from existing<br />
farmed land.<br />
Rising income levels help drive potash demand.<br />
Rising income levels enable people<br />
to afford better diets, which are more likely<br />
to include meat. increased demand for<br />
meat generally drives demand for grain<br />
and therefore potash, as explained above.<br />
in addition, stronger economic conditions<br />
put farmers in a better position to be able<br />
to afford potash. in addition, farmers can<br />
suspend or reduce application of potash,<br />
which can have a negative effect on potash<br />
demand. Economic conditions have historically<br />
moved in cycles, and downturns of the<br />
type the world and particular economies<br />
have undergone in the past, or more or less<br />
severe downturns, could have a material<br />
adverse effect on uralkali’s business, financial<br />
condition and results of operations.<br />
Prices for potash are affected significantly<br />
by the levels of supply and expansion<br />
of available production and/or<br />
structural capacity of potash producers,<br />
and either oversupply or overcapacity<br />
could have an adverse effect on<br />
<strong>Uralkali</strong>’s business.<br />
industry-wide capacity has a key impact<br />
on potash prices. The greater the available<br />
production and/or the structural capacity,<br />
the greater the potential for downward<br />
pressure on potash prices. increases in the<br />
global available production and/or structural<br />
capacity could have a material adverse<br />
effect on uralkali’s business, financial<br />
condition and results of operations.<br />
<strong>Uralkali</strong>’s production costs could increase.<br />
uralkali currently has what it believes to be<br />
one of the lowest costs of production in the<br />
industry. However, its costs of production<br />
may increase significantly, particularly as<br />
Russia’s economic environment comes in<br />
line with those of Western countries.<br />
Sustained periods of high inflation<br />
could increase <strong>Uralkali</strong>’s costs and decrease<br />
<strong>Uralkali</strong>’s operating margins.<br />
uralkali’s production activities are located in<br />
Russia, and the majority of uralkali’s direct<br />
costs are incurred in Russia. Russia has experienced<br />
high levels of inflation since the<br />
early 1990s. inflation increased dramatically<br />
after the 1998 financial crisis, reaching<br />
a rate of 84.4% in that year, according to<br />
the Russian Federal State Statistics Service<br />
(‘‘Rosstat’’). Notwithstanding recent reductions<br />
in the inflation rate, which, according<br />
to Rosstat, was approximately 11.9% in<br />
<strong>2007</strong> 1 , uralkali is exposed to inflation-driven<br />
increases in certain of its costs.<br />
However, uralkali may not be able to<br />
increase the prices for its products sufficiently<br />
in order to preserve operating<br />
margins, particularly for its export sales,<br />
when such inflation is accompanied by<br />
real appreciation of the rouble against the<br />
uS dollar. Accordingly, increase of rates of<br />
inflation in Russia could increase uralkali’s<br />
costs and decrease its operating margins<br />
and consequently have an adverse effect<br />
on uralkali’s business, financial condition<br />
and results of operations.<br />
102
<strong>Uralkali</strong> is subject to regulatory risks<br />
and risks of political instability associated<br />
with its international distribution,<br />
which could have an adverse effect on<br />
its export sales.<br />
uralkali is subject to numerous risks and<br />
uncertainties relating to international sales<br />
and operations, including:<br />
difficulties and costs associated with<br />
complying with a wide variety of complex<br />
laws, treaties and regulations;<br />
changes in regulatory environments;<br />
increased government control and regulation<br />
in the markets uralkali’s products<br />
are sold;<br />
political and economic instability, including<br />
the possibility for civil unrest;<br />
the imposition of export duties, antimonopoly<br />
and/or antidumping measures; and<br />
the imposition of tariffs, exchange controls<br />
or other restrictions.<br />
The occurrence of the events above could<br />
limit uralkali’s ability to conduct its business<br />
and could have a material adverse effect on<br />
uralkali’s financial condition and results of<br />
operations.<br />
<strong>Uralkali</strong> is subject to the economic, political<br />
and social instability risks of doing<br />
business in developing economies.<br />
During the year <strong>2007</strong>, the major part of<br />
uralkali’s total revenues was attributable<br />
to sales in developing economies such as<br />
china, Brazil, and india. Financial turmoil<br />
in any developing market country tends<br />
to adversely affect all developing market<br />
countries as investors move their money<br />
to more stable, developed markets. As has<br />
happened in the past, financial problems<br />
or an increase in the perceived risks associated<br />
with investing in developing markets<br />
could dampen foreign investment<br />
in the developing economies on which<br />
uralkali relies and adversely affect those<br />
economies. As a result, during such times,<br />
companies, such as uralkali, whose operations<br />
involve developing markets can<br />
face severe liquidity constraints as foreign<br />
funding sources are withdrawn. Thus, financial<br />
turmoil in any emerging market<br />
country could materially adversely affect<br />
uralkali’s business, prospects, financial<br />
condition and results of operations.<br />
Restoring nature’s balance<br />
uRAlkAli<br />
<strong>Uralkali</strong>’s analysis of <strong>Uralkali</strong>’s reserves<br />
and resources may be materially different<br />
from mineral quantities that <strong>Uralkali</strong><br />
may actually recover and market<br />
price fluctuations and changes in operating<br />
and capital costs may render<br />
certain ore reserves or mineral deposits<br />
uneconomical to mine.<br />
uralkali’s analysis of uralkali’s ore reserves<br />
represent quantities of ore and minerals<br />
that under present and anticipated conditions<br />
and anticipated extensions of certain<br />
licences have the potential to be economically<br />
mined and processed by the extraction<br />
of their mineral content. However, reserve<br />
engineering is a subjective process of<br />
estimating underground deposits of minerals<br />
that cannot be measured in an exact<br />
manner and the accuracy of any reserve<br />
estimate is a function of the quality of available<br />
data and engineering and geological<br />
interpretation and judgment.<br />
Fluctuations in the market price of minerals,<br />
reduced recovery rates increased production<br />
costs due to inflation or other factors<br />
or failure to obtain licence extensions may<br />
render proved and probable reserves containing<br />
relatively lower grades of mineralisation<br />
uneconomic to exploit and may ultimately<br />
result in a restatement of reserves<br />
which could have a material adverse effect<br />
on uralkali’s business, prospects, financial<br />
condition and results of operations.<br />
The environmental regulations to<br />
which <strong>Uralkali</strong> is subject, as well as its<br />
potential environmental liabilities, may<br />
have an adverse effect on its business.<br />
uralkali’s operations and properties are<br />
subject to environmental, health and<br />
safety and other laws and regulations in<br />
the jurisdictions in which it operates, principally<br />
in Russia. For instance, uralkali’s<br />
operations generate air emissions, wastewater<br />
discharges and large amounts of<br />
by-products, including waste salt, mine<br />
tailings and other waste materials, some<br />
of which are hazardous. The discharge,<br />
storage and disposal of such waste is subject<br />
to environmental regulations, some<br />
of which require the clean-up of contamination<br />
and reclamation. Additionally,<br />
under current Russian environmental legislation,<br />
uralkali must make payments for<br />
Annual report<br />
air emissions, water discharges and waste<br />
disposals. Any increase in the amount of<br />
payments or amendments to the existing<br />
regulation could have a material adverse<br />
effect on uralkali’s business, financial<br />
condition and results of operations.<br />
<strong>Uralkali</strong>’s operations are dependent on<br />
having received the required licences,<br />
permits and approvals from governmental<br />
authorities. A decision by a<br />
government agency to deny any of<br />
<strong>Uralkali</strong>’s licenses, permits and approvals<br />
or to impose restrictive conditions<br />
on <strong>Uralkali</strong> with respect to these licences,<br />
permits and approvals may have an<br />
adverse effect on its business.<br />
uralkali’s business depends on the continuing<br />
validity of its licences, the issuance<br />
to it of new licences and its compliance<br />
with the terms of its licences, including<br />
subsoil licences for uralkali’s mining operations<br />
in Russia. Regulatory authorities<br />
exercise considerable discretion in the timing<br />
of licence issuance and renewal and<br />
in monitoring licensees’ compliance with<br />
licence terms. Requirements imposed by<br />
these authorities may be costly and timeconsuming<br />
and may result in delays in<br />
the commencement or continuation of<br />
exploration or production operations.<br />
in addition to uralkali’s mining licences,<br />
uralkali is required to obtain from various<br />
Russian governmental authorities numerous<br />
licences, authorisations and permits<br />
of routine nature. The right to subsoil use<br />
may be early terminated, suspended or<br />
limited if the government authorities find<br />
that uralkali has violated the ‘‘significant’’<br />
or ‘‘material’’ terms of the licence.<br />
This could have a material adverse effect<br />
on uralkali’s business prospects, financial<br />
condition and results of operations.<br />
1 STATiSTicAl SuRVEY of the Russian Federation<br />
State Statistics committee on the social and economic<br />
situation in Russia.<br />
103
Contact<br />
Detals<br />
JSC <strong>Uralkali</strong><br />
63 Pyatiletka Street, Berezniki<br />
Perm Territory, Russia 618426<br />
E-mail: uralkali@uralkali.com<br />
<strong>Uralkali</strong> Moscow Office<br />
23A Taras Shevchenko Embankment, 21st Floor<br />
Moscow, 121151<br />
Tel.: +7 (495) 730-2371, 730-6677, 730-2372<br />
Fax: +7 (495) 730 2393, 730 2394<br />
E-mail: msc@msc.uralkali.com<br />
uRAlkAli’07