BSL PRO Lesson H11 - Biopac
BSL PRO Lesson H11 - Biopac
BSL PRO Lesson H11 - Biopac
- No tags were found...

Create successful ePaper yourself
Turn your PDF publications into a flip-book with our unique Google optimized e-Paper software.
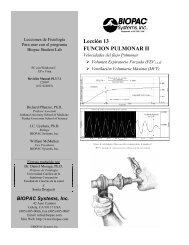
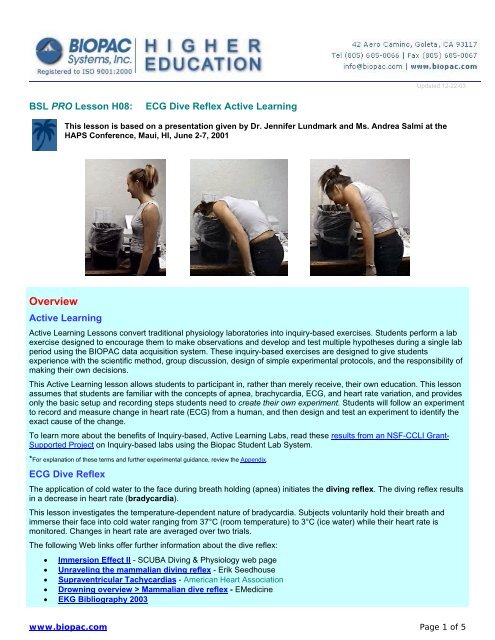
<strong>BSL</strong> <strong>PRO</strong> <strong>Lesson</strong> H08Objectives1. To record the change in heart rate that occurs when a subject immerses his face in cold water.2. To investigate the physiological reason for the observed response.Equipment• PC running Windows or Macintosh computer• BIOPAC Software: BIOPAC Student Lab <strong>PRO</strong>• BIOPAC Data Acquisition Unit (MP30/MP35)• BIOPAC electrode lead set (SS2L)—one or more, depending on experiment design• BIOPAC disposable vinyl electrodes (EL503)• Electrode gel (GEL1) and abrasive pad (ELPAD)• Shallow tub with water and ice• Thermometer• TowelExperimentDesignBIOPAC Systems, Inc.Follow the procedure in this <strong>PRO</strong> lesson to record and measure change in heart rate (ECG) from a human afterimmersing the face in cold water. Next, design an experiment to identify the exact stimulus that evokes the change inheart rate (in beats per minute or BPM). Your experiment must:1. Test only one factor at a time.2. Specify a hypothesis (in the form of a statement) that might provide an explanation for your observation.3. Record heart rate data.4. Specify what measurements will be taken and how they will be recorded (table, etc.)5. Compare data to the first experiment and interpret the findings.6. Conform to the Scientific Method.If your data do not support the hypothesis, form a new hypothesis and test it.Each time you test a hypothesis, you gain information, even if the hypothesis is not supported by the data. Use thisinformation to guide your next experiment. You will likely have to test several hypotheses before you arrive at a soundconclusion. When you are confident that you have arrived at the exact cause of the heart rate change, you are done withthis part of the lesson. Make sure that your data support your conclusion!To ensure that scientific work is acceptable, repeatable, and easy to communicate, scientists have developed a logical,stepwise progression that scientific investigation follows. This progression is known as the scientific method,summarized in the following steps.a. Identify a problem or objective.This involves recognizing that some unknown information is needed.b. Form a testable hypothesis.This is an educated guess answering how or why an event takes place, or providing a solution to a problem.Tools or technology must be available to test the hypothesis, otherwise it should be discarded.c. Test the hypothesis by observation and experimentation.Determine what tests to perform, set up proper controls, and use the correct instruments. Meticulously gatherdata from the tests.d. Interpret the data.Determine if the results are statistically significant or if they merely occurred by chance using statistical analysis.Recognize relationships between the data and previously known facts, or new observations.e. Draw conclusions.Do the data support the hypothesis? If the hypothesis is not supported, return to step two.f. Communicate observations and conclusions.Organize and present the data in such a way that others can understand what was done and observed, and reachthe same conclusion.See Additional Study for more experiment ideas.www.biopac.com Page 2 of 5
<strong>BSL</strong> <strong>PRO</strong> <strong>Lesson</strong> H08BIOPAC Systems, Inc.SetupNote: This setup demonstrates basic Lead II ECG connections on a human subject. Student experiments may requirevariations.Hardware1. Plug the Electrode Lead Set into CH 1 on the MP unit.2. Turn the MP30/MP35 acquisition unit on.3. Turn the computer on.4. Launch the <strong>BSL</strong> <strong>PRO</strong> software.5. Open the Dive Reflex lab by choosing File menu > Open >choose Files of type: Graph Template (*GTL) > FileName: DiveReflex.gtl.CalibrationNo Calibration is required.Subject — Electrode ConnectionsIMPORTANT! Selected subject must not have any known heart conditions.The electrode connections for setting up a Dive Reflex test consist of an electrode lead set attached to an MP unit.1. Abrade the anterior surface of the right wrist and the medial aspect of both ankles, then cleanse with alcohol.2. Permit the areas to dry then apply gel-filled vinyl electrodes to each area.3. Attach the electrode lead set as follows:Lead II SetupRight Wrist:Right Ankle:Left Ankle:Lead ColorWhiteBlackRedRunning the ExperimentHints for minimizing data error• The subject should not talk or laugh during any of the recording segments.• The subject should be relaxed in the position noted for each recording segment.• The subject should be as still as possible during the recording segment. The electrocardiograph is very sensitiveto small changes in voltage caused by contraction of skeletal muscles, and the subject's arms and legs need to berelaxed so that the muscle (EMG) signal does not corrupt the ECG signal.• Start recording a few seconds before the subject gets wet to give the computer time to display the data.• Subject should remain immersed for 20-30 seconds — the longer the better!• Screen subjects for smoking and drugs, which alter cardiac activity.• Prohibit caffeine intake within six hours of the experiment.• Place Subjects in a prone position on a pad until their ECG monitored heart rate stabilizes. The prone position isthe best subject orientation because it has been shown to minimize movement for facial immersion. (Marsh, N., D.Askew, K. Beer, M. Gerke, D. Muller, and C. Reichman, 1995. Relative contributions of voluntary apnea, exposure to cold and face immersion in waterto diving bradycardia in humans. Clinical and Exp. Pharmacol. and Physiol. 22:886-887.)• Conduct immersions in random order and do not advise the Subject of the water temperature before immersion.• Allow an equilibrium period of no less than 3 minutes between immersions.www.biopac.com Page 3 of 5
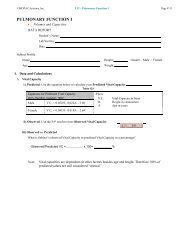
<strong>BSL</strong> <strong>PRO</strong> <strong>Lesson</strong> H08BIOPAC Systems, Inc.1. Fill a tub with water and ice until the water is 10º–15º C. Record the temperature.2. Fill another tub with room temperature water. Record the temperature.3. If possible, fill another tub with water and ice until the water is colder than the first tub. Record the temperature.4. Record a 30 second resting ECG of the subject while he is prone, next to the ice water. Click "Start" on the datascreen to begin recording data and "Stop" to end.5. Prepare the subject to immerse his face in the cold water.6. Click "Start" then press "esc" as soon as the subject immerses his face a few seconds later.7. The subject should remain immersed for 20-30 seconds (the longer the better). Click "Stop" after the subjectremoves his face from the water to end recording.8. Give the subject a towel to dry his face.9. Repeat the experiment at least once.ECG Dive Reflex Data using the <strong>BSL</strong> <strong>PRO</strong>AnalysisAverage changes in heart rate over a minimum of two trials. Define the baseline heart rate as the mean heart rate over a10 second interval, 5 seconds b efore the subject was asked to immerse his face in water. Define the final heart rate as anaverage of the last 5 seconds of immersion.Additional Study1. Record the requested data on the following worksheet and answer the questions to test your knowledge.WORKSHEET2. Design and complete another experiment using the given equipment. For example, might you see a similarchange in heart rate by immersing the subject's hand in cold water? Might postural changes or thought processesaffect heart rate?3. In addition to heart rate, monitor Lung Volume via pneumotrace to determine the effect of different breath holdlung volumes on bradycardia.Recor ding VariationsThis laboratory procedure provides a visual depiction and an online analysis of heart rate changes encountered duringimmers ion in cold water. The procedure can also be used as a platform to demonstrate physiological responses to otherconditions. Examples include:a. change in heart rate while sitting up vs. standingb. change in heart rate while breathing deeply vs. normallyc. change in heart rate while resting vs. after exercisewww.biopac.com Page 4 of 5
<strong>BSL</strong> <strong>PRO</strong> <strong>Lesson</strong> H08AppendixInquiry-based Labs / Active LearningBIOPAC Systems, Inc.GRAPH TEMPLATE SETTINGSClick here to open a PDF of the graph template file settings. The <strong>BSL</strong> <strong>PRO</strong> Graph Template file automatically establishesthe settings shown in the table.www.biopac.com Page 5 of 5