Geochimica et Cosmochimica Acta - National High Magnetic Field ...
Geochimica et Cosmochimica Acta - National High Magnetic Field ...
Geochimica et Cosmochimica Acta - National High Magnetic Field ...
- No tags were found...

Create successful ePaper yourself
Turn your PDF publications into a flip-book with our unique Google optimized e-Paper software.
<strong>Geochimica</strong> <strong>et</strong> <strong>Cosmochimica</strong> <strong>Acta</strong>Copy of e-mail Notificationgca4141Proofs of gca - PTS# 4141 and W# 2784=====Dear Author:The proof of your article to be published by Elsevier Science in <strong>Geochimica</strong> <strong>et</strong> <strong>Cosmochimica</strong> <strong>Acta</strong> can beviewed from:http://rapidproof.cadmus.com/RapidProof/r<strong>et</strong>rieval/index.jspLogin: your e-mail addressPassword: ----This file contains a PDF proof of your compl<strong>et</strong>e article, a list of author queries, and a guide to proofreader’smarks. For helpful information on PDF files, please see "Reading PDF Documents" at the end of thise-mail.If you would prefer to receive paper proof of your article or any color figures, please inform us immediatelyby replying to this e-mail with full mailing d<strong>et</strong>ails.Use this proof solely for checking types<strong>et</strong>ting, editing, and the compl<strong>et</strong>eness and correctness of the text,tables, and figures. Any significant changes to the article as accepted must be approved by the editorialoffice. Also, make sure you answer any questions that appear on the list of author queries. (AQ)Please respond with your corrections within 48 hours to the address below (if you have no corrections,please inform us) by one of the following means:* Send an e-mail message to the journal issue manager (listed below; please note this is not the journaleditor) with approval to proceed or a brief summary of the corrections to be made; Note: Numbers at theleft and right edges are line locators. You may use the acronym "LL" when referring to a specific linelocation on your proof;* Print out the list of author queries, write your answers to the queries on the printout, and fax the page tothe journal issue manager (alternatively, you can type the author queries and your answers in an e-mailmessage to the journal issue manager); or* Print out the PDF of your proofs, indicate any corrections in the margins of the proofs (using a blackpen), and fax or mail the proofs to the journal issue manager. Ignore marginal annotations (e.g., "Fn" and"F1").If there are any significant concerns about the quality of the proofs (in terms of figure layout, s<strong>et</strong>ting ofequations, <strong>et</strong>c.), please d<strong>et</strong>ail these concerns in a separate l<strong>et</strong>ter accompanying your faxed or e-mailedcorrections. As journal issue manager, I will ensure your concerns are addressed.If you submitted usable colour figures with your article they will appear in colour on the web, at no extracharge, as you can see in the attached PDF proof if your article. In the printed issue, colour reproductiondepends on journal policy and wh<strong>et</strong>her or not you agree to bear any costs.Do not attempt to edit the PDF file electronically (including adding post-it type notes); such correctionscannot be accepted at this time. Instead, please submit your corrections by one of the three means d<strong>et</strong>ailedabove. You should have already received and r<strong>et</strong>urned a copyright transfer or short license agreement andan offprint order form. If you have not y<strong>et</strong> r<strong>et</strong>urned them, please fax, and follow by mail, the signed forms.We must have the original signed copyright transfer or short license agreement to publish your article.
<strong>Geochimica</strong> <strong>et</strong> <strong>Cosmochimica</strong> <strong>Acta</strong>Copy of e-mail Notificationgca4141Reading PDF DocumentsTo view and print your article, you will need Acrobat Reader from Adobe. This program is freely availableand can be downloaded from www.adobe.com. Note that this reader is available for a whole series ofplatforms, which include PC, Mac, and Unix.There are some points that you should consider:* Any gray halftones or color figures are best viewed on screen, where they are optimized. If you haveinstructed us to reproduce your artwork in color, it should be displayed as such in this PDF proof.* If you are unable to see color, check that the Display large images tickbox under File/Preferences/Generalis ticked. If you are still unable to view your color, please contact us immediately.* If you print the PDF file and notice nonstandard output, check if the problem is also present on screen. Ifthe correct printer drive is not installed on your PC, the printer output will be distorted.Finally, may I thank you in anticipation of your prompt cooperation and for publishing your article in<strong>Geochimica</strong> <strong>et</strong> <strong>Cosmochimica</strong> <strong>Acta</strong>.Kind regards,John FotiaSenior Production EditorElsevier360 Park Avenue South6th FloorNew York, NY 10010Voice: 212-633-3870Fax: 212-633-3853Email: j.fotia@elsevier.com12
1234567891011121314151617181920212223242526272829303132333435363738394041424344454647484950515253Fn1-3AQ: 1AQ: 2AQ: 3AQ: 4AQ: 5tapraid2/gca-gca/gca-gca/gca00605/gca4141d05z xppws S1 2/2/05 1:12 Art: W#4141 DTD5.0doi:10.1016/j.gca.2004.09.007<strong>High</strong>ly siderophile element geochemistry of 187 Os-enriched 2.8 Ga Kostomuksha komatiites,Baltic ShieldIGOR S. PUCHTEL* ,† and MUNIR HUMAYUN ‡Department of the Geophysical Sciences, The University of Chicago, 5734 S. Ellis Avenue, Chicago, Illinois 60637 USA(Received April 9, 2004; accepted in revised form September 3, 2004)Abstract—New analyses of highly siderophile elements (HSE; Re, Os, Ir, Ru, Pt, and Pd) obtained by Cariustube digestion ID-ICPMS technique are reported for 187 Os-enriched 2.8 Ga komatiites from the Kostomukshagreenstone belt. As a result of a significant improvement in the yield over our previous digestions by the NiSfire-assay technique, these komatiites have now been shown to contain 22 to 25% more Os, Ir, and Pt and 34%more Ru. The emplaced komatiite lavas at Kostomuksha thus had siderophile element abundances comparabl<strong>et</strong>o those of the Abitibi belt. The discrepancies observed b<strong>et</strong>ween the two techniques are interpr<strong>et</strong>ed to be theresult of incompl<strong>et</strong>e digestion of PGE carriers (particularly chromite) during the NiS fire-assay procedure. Ourresults for UB-N peridotite reference material agree well with those obtained by the high-pressure ashingdigestion ID-ICPMS technique reported in the literature. Two types of komatiite lavas have been distinguishedin this study based on the IPGE behavior during lava differentiation. The Kostomuksha type is unique and ischaracterized by an incompatible behavior of IPGEs, with bulk solid-liquid partition coefficients for IPGEsbeing close to those for olivine. Cumulate zones in this type of komatiite lava occupy 20% of the totalthickness of the flows. The Munro type exhibits a compatible behavior of IPGEs during lava differentiation.The cumulate zone in this type of komatiite occupies 20% of the total thickness of the flows. The calculatedbulk partition coefficients indicate that, as with the other Munro-type komatiite lavas, the bulk cumulatecontained an IPGE-rich minor phase(s) in addition to olivine. The non-CI chondritic PGE pattern for thesource of the Kostomuksha komatiites calculated here is similar to that of Abitibi komatiites and to ADSL andsupports the hypothesis of a non-CI chondritic HSE composition of the Earth’s mantle. The absolute PGEabundances in the source of the Kostomuksha komatiite have been demonstrated to be comparable to thoseof the source of Abitibi komatiites, even though the two komatiites contrast in their Os isotopic compositions.This supports the earlier hypothesis that if core-mantle interaction produced the 187 Os/ 188 Os radiogenicsignature in the Kostomuksha source, it must have occurred in the form of isotope exchange at the core-mantleboundary. Other explanations of the radiogenic Os signature are similarly constrained to conserve theelemental abundance pattern in the mantle source of Kostomuksha komatiites. Copyright © 2005 ElsevierLtd1. INTRODUCTIONThe 2.8 Ga Kostomuksha greenstone belt is one of the fewArchean komatiitic lava suites on Earth that were shown tohave been derived from a mantle source with radiogenic initial187 Os/ 188 Os isotopic composition (Puchtel <strong>et</strong> al., 2001; Walkerand Nisb<strong>et</strong>, 2002). These lavas provide the type of material thatcan be used to test models of core-mantle interaction andoceanic crust recycling through studying variations in highlysiderophile element (HSE; Re, Os, Ir, Ru, Pt, and Pd) abundancesin mantle sources of these lavas, and of those thatexhibit near-chondritic initial 187 Os/ 188 Os isotopic compositions,such as Alexo (Gangopadhyay and Walker, 2003) andPyke Hill komatiites (Puchtel <strong>et</strong> al., 2004a) in Canada. Thes<strong>et</strong>ests require an accurate d<strong>et</strong>ermination of HSE abundances inthe emplaced lavas.Puchtel and Humayun (2000) reported platinum group element(PGE) abundances in komatiitic and basaltic lavas fromthe Kostomuksha greenstone belt analyzed by the NiS fireassaydigestion isotope dilution inductively coupled plasmamass-spectrom<strong>et</strong>ry (ID-ICPMS) technique. These PGE datawere used to infer the PGE abundances in the mantle source ofthe lavas to test models of ocean crust recycling and coremantleinteraction. Subsequently, the NiS fire-assay techniquewas shown to be inefficient at digesting some PGE carriers inkomatiitic samples (Puchtel <strong>et</strong> al., 2004b). Due to these shortcomings,abundances of some PGEs in the lavas were shown tobe underestimated by as much as 50%. This, in turn, results inunderestimation of PGE abundances in the mantle source of thelavas and may have broader impact on several important conclusionsin that study, including the incompatible behavior ofOs and Ir during lava differentiation.The Carius tube (CT) digestion technique (Shirey andWalker, 1995) has been recently demonstrated to be superior tothe NiS fire-assay m<strong>et</strong>hod in digesting PGE carriers in komatiites(Puchtel <strong>et</strong> al., 2004b). In this paper, we present new CTdigestion, ID-ICPMS analyses of PGEs and Re in the compl<strong>et</strong>es<strong>et</strong> of eighteen drill core samples from seven komatiite lavaflows from the Puchtel and Humayun (2000) study, as well asin nine additional samples from the same lava flows, includingsix samples from Flow 13, from which only one sample (9490)UNCORRECTED PROOF* Author to whom correspondence should be addressed(ipuchtel@umd.edu).† Present address: Isotope Geochronology Laboratory, Department ofGeology University of Maryland, College Park, Maryland 20742 USA‡ Present address: <strong>National</strong> <strong>High</strong> Magn<strong>et</strong>ic <strong>Field</strong> Laboratory & Departmentof Geological Sciences, Florida State University, Tallahassee,Florida 32310 USA1<strong>Geochimica</strong> <strong>et</strong> <strong>Cosmochimica</strong> <strong>Acta</strong>, Vol. xx, No. x, pp. xxx, 2005Copyright © 2005 Elsevier LtdPrinted in the USA. All rights reserved0016-7037/05 $30.00 .006263646566676869707172737475767778798081828384858687888990919293949596979899100101102103104105106107108109110111112113114
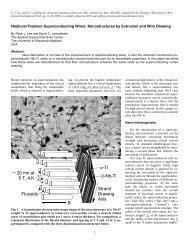
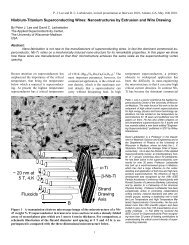
1234567891011121314151617181920212223242526272829303132333435363738394041424344454647484950515253tapraid2/gca-gca/gca-gca/gca00605/gca4141d05z xppws S1 2/2/05 1:12 Art: W#2784 DTD5.02 I. S. Puchtel and M. HumayunFig. 1. Profiles through four differentiated komatiite lava flows at Kostomuksha that were sampled in d<strong>et</strong>ail. Noterelatively thick spinifex zones and thin cumulate zones in all flows except for Flow 13. The thick flow top breccias pointto a submarine eruption environment.was previously analyzed. A much lower blank of the CTdigestion procedure compared to the NiS fire-assay techniquemade it possible to obtain Re abundances. In this study, wehave also obtained HSE abundances for a peridotite referencematerial UB-N, previously analyzed by high-pressure ashing(HPA) digestion ID-ICPMS technique (Meisel and Moser,2004). On the basis of the new data, we revised values for thePGE compositions of the Kostomuksha emplaced komatiitelava, and for its mantle source. These data, when combinedwith the results for komatiites from the Abitibi greenstone belt(Puchtel <strong>et</strong> al., 2004b), provide new constraints on the possiblenature of HSE abundances in mantle sources with both suprachondriticand chondritic 187 Os/ 188 Os isotopic compositions.2. GEOLOGICAL-GEOCHRONOLOGICAL BACKGROUNDAND SAMPLINGThe d<strong>et</strong>ails of geology, p<strong>et</strong>rology, and mineralogy, as well astrace element and Pb, Nd, and Os isotope systematics of maficand ultramafic lavas from the Kostomuksha greenstone belthave been previously reported by Puchtel <strong>et</strong> al. (1998, 2001).The mafic terrane of the Kostomuksha synform is part of theGimola-Kostomuksha greenstone belt in NW Karelia, BalticShield. The terrane contains submarine-erupted komatiite andbasalt lavas, mafic and ultramafic volcaniclastic sediments, andnumerous gabbro and peridotite sills. The komatiites and basaltshave Sm-Nd and Pb-Pb whole rock isochron ages of 2843 39 and 2813 78 Ma, respectively. The whole sequence isintruded and overlain by mafic and felsic subvolcanic, volcanic,and volcaniclastic rocks with a U-Pb zircon age of 2821 1Ma (Puchtel <strong>et</strong> al., 1998). As a result of seafloor alterationand/or greenschist facies m<strong>et</strong>amorphism, the igneous mineralogyof the lavas was almost compl<strong>et</strong>ely replaced by serpentinechlorite-magn<strong>et</strong>iteassemblages at 2757 113 Ma (Puchtel <strong>et</strong>al., 1998). However, primary volcanic textures, structures, andmost chemical features remained intact. For a selected s<strong>et</strong> ofkomatiite samples and a chromite separate, Puchtel <strong>et</strong> al. (2001)obtained a Re-Os isochron corresponding to the age of 2795 40 Ma and a radiogenic initial 187 Os 3.6 1.0. Thelithophile trace element and isotope characteristics of the komatiites(e.g., (Nb/Th) n 1.5 2.1, Nd(T) 2.8 0.2, 1 8.77 0.02) resemble those of the contemporary oceanicmantle (Puchtel <strong>et</strong> al., 1998). On the basis of geological evidenceand isotope and geochemical data, Puchtel <strong>et</strong> al. (1998)argued that the mafic terrane represented remnants of the uppercrustal part of an Archean oceanic plateau derived from partialmelting in a starting mantle plume head.Twenty-seven drill core samples from seven differentiatedkomatiite lava flows have been analyzed in this study for PGEsand Re. Out of these, six new samples from Flow 13, for whichmajor element data were not available, were also analyzed formajor elements. Samples 9487–94126 come from the fourflows (13, 17, 19, and 26) shown in Figure 1. Samples 9469,9479, and 94104 are from three other flows (#8, 10, and 18).The flows consist of an upper spinifex zone (A) and a lowercumulate zone (B). The spinifex zone contains an up to 1 mthick chilled margin at the top, which grades downward into asubzone of random, and then oriented, platy olivine spinifex. Adistinct feature of all komatiite flows studied at Kostomukshacompared to those we examined at Alexo and Pyke Hill (Puchtel<strong>et</strong> al., 2004b) is a very small thickness of cumulate zonesin the former, normally 20% of the total thickness of theflows. One exception is Flow 13, which is 11 m thick andUNCORRECTED PROOFAQ: 6F16263646566676869707172737475767778798081828384858687888990919293949596979899100101102103104105106107108109110111112113114
1234567891011121314151617181920212223242526272829303132333435363738394041424344454647484950515253tapraid2/gca-gca/gca-gca/gca00605/gca4141d05z xppws S1 2/2/05 1:12 Art: W#2784 DTD5.0contains a 7-m thick cumulate zone. Further d<strong>et</strong>ails of geology,p<strong>et</strong>rology, and mineralogy, as well as lithophile traceelement and Pb, Nd, and Os isotope geochemistry of the lavas,can be found in Puchtel <strong>et</strong> al. (1998, 2001).3. ANALYTICAL TECHNIQUES3.1. Major and Minor Element AnalysisMajor and minor (Cr, Ni) element abundances in the six whole rocksamples from Flow 13, not previously reported by Puchtel <strong>et</strong> al. (1998),were d<strong>et</strong>ermined on pressed powder pell<strong>et</strong>s by wavelength-dispersiveX-ray fluorescence spectrom<strong>et</strong>ry using a VRA-20R spectrom<strong>et</strong>er at theInstitute of Geology and Geophysics in Novosibirsk. The accuracy andreproducibility of the analyses were 1% and 3% (relative) for majorand minor elements, respectively. Major element abundances in allother samples, reported in the Puchtel <strong>et</strong> al. (1998) study, and for thesake of compl<strong>et</strong>eness presented here, were also d<strong>et</strong>ermined at theInstitute of Geology and Geophysics in Novosibirsk using the sam<strong>et</strong>echnique. The abundances of Cr and Ni in these samples were measuredon fused glass disks by wavelength-dispersive X-ray fluorescencespectrom<strong>et</strong>ry using an automated Philips PW-1404 spectrom<strong>et</strong>er at theJohannes-Gutenberg-Universität in Mainz, with an accuracy and reproducibilityof 1% (relative).3.2. HSE AnalysisIn this study, we used a mixed komatiite spike #000531, also utilizedby Puchtel <strong>et</strong> al. (2004a, 2004b) in their study of Abitibi komatiites. Bycontrast, the multielement spike used by Puchtel and Humayun (2000)had been optimized for primitive mantle abundances.PGE and Re abundances were d<strong>et</strong>ermined at The University ofChicago using a Carius tube digestion ID-ICPMS technique (Puchteland Humayun, 2001; Puchtel <strong>et</strong> al., 2004a; Puchtel <strong>et</strong> al., 2004b). Weused aliquots of the same batches of rock powders utilized by Puchteland Humayun (2000). Samples were digested in 25 mL Pyrex borosilicateglass Carius tubes at 270°C for 48 h or at 240°C for 72 h afterpreheating at 240°C for 24 h. Osmium was extracted from the aquaregia sample solutions using the CCl 4 solvent extraction technique(Cohen and Waters, 1996), and then back-extracted into HBr, followedby purification via microdistillation (Birck <strong>et</strong> al., 1997). A 50% aliquotof the residual aqua regia solution was dried, converted into chlorideform, taken up in 0.15N HCl, and Ir, Ru, Pt, Pd, and Re were separatedfrom the matrix and further double purified by cation exchangechromatography. The resulting eluate was used directly for ICPMSanalysis.Measurements of Os, Ir, Ru, Pt, Pd, and Re isotopic compositionswere performed on a Finnigan Element single-collector, magn<strong>et</strong>icsector, high-resolution ICPMS. The sample solutions were introducedinto the ICPMS torch via a CETAC MCN6000 desolvating nebulizerfor the PGE measurements, or via an ESI low-flow nebulizer with ESITeflon spray chamber for the Re measurements. Typical count ratesHSE geochemistry of Kostomuksha komatiitesTable 1. HSE data (ppb) for the UB-N peridotite standard.Sample T, °C Time, h Re Os Ir Ru Pt PdUB-N (1) 240 24 0.188 3.16 2.91 6.15 7.23 6.05UB-N (2) 240 48 0.255 4.41 3.51 8.45 8.09 6.00UB-N (3) 240 96 0.186 3.67 3.54 7.38 7.43 6.35UB-N (4) 270 24 0.187 4.03 4.10 7.71 7.07 5.80UB-N (5) 270 48 0.185 3.31 3.47 6.88 7.55 5.93UB-N (6) 270 72 0.190 3.37 3.34 6.65 7.55 6.54UB-N (7) 270 96 0.188 3.51 3.74 7.46 7.43 6.02Average 0.197 3.64 3.52 7.24 7.48 6.102 mean 0.02 (10%) 0.33 (9%) 0.27 (8%) 0.57 (8%) 0.24 (3%) 0.19 (3%)UB-N 1 0.206 3.71 3.38 6.30 7.42 6.112 mean 0.01 (2%) 0.26 (7%) 0.22 (6%) 0.30 (5%) 0.30 (4%) 0.18 (3%)Before digestion at 270°C, aliquots (4) to (7) were preheated at 240°C for 24 h.1 Data of Meisel and Moser (2004) obtained by the HPA digestion ID-ICPMS technique.were 10 5 –10 6 cps for PGEs and 10 4 –10 5 cps for Re, and the internalprecisions of individual runs were b<strong>et</strong>ter than 0.5% relative (2 mean ).Long-term reproducibilities of a 0.5 ppb in-house Ir-Ru-Pd-Pt-Re standardsolution and a 1 ppb Os standard solution, which characterize theexternal precision of the analysis, were 1% (2 stdev ) on all isotoperatios. Isobaric interferences of 102 Pd on 102 Ru and of 198 Hg on 198 Ptwere corrected, and those from Mo, NiAr , and Cd were monitored atmasses 95, 98, and 111. These corrections were normally 0.5%. Massfractionation for Ru, Pd, Ir, Pt, and Re was corrected using 99 Ru/ 102 Ru 0.4044,110 Pd/ 106 Pd 0.4288,191 Ir/ 193 Ir 0.5942,198 Pt/ 195 Pt 0.2130, and 185 Re/ 187 Re 0.5974 relative to those measured in thestandard solution that was run alternately with samples. The measured190 Os/ 192 Os ratios in the samples were corrected for fractionation usinga linear law and 192 Os/ 188 Os 3.083. The total analytical blank was 5pg Os, 0.5 pg Ir, 3 pg Ru, 31 pg Pt, 7 pg Pd, and 10 pg Re. Blankcorrections applied were 0.1% for Os, Ir, Ru, and Pd, 0.3% for Pt,and 1.5% for Re.Establishing the accuracy of PGE analysis is an unresolved issue inthe analytical community (Meisel and Moser, 2004). For interlaboratorycomparison of data reported from this lab, Puchtel <strong>et</strong> al. (2004b)carried out replicate analyses of HSE in komatiite standard KAL-1 andperidotite standard GP-13. The average PGE concentrations in KAL-1measured by Puchtel <strong>et</strong> al. (2004b) are within 1 to 8% of both ourprevious estimates (Puchtel and Humayun, 2000) and the data ofRehkämper <strong>et</strong> al. (1999b). The average PGE abundances in GP-13obtained by Puchtel <strong>et</strong> al. (2004b) are within 1 to 9% of those reportedat Durham University, Leoben University, and the Danish LithosphereCenter using the ID-ICPMS m<strong>et</strong>hod and both Carius tube and highpressureashing (HPA) digestion techniques (see review by Pearson <strong>et</strong>al., 2004).Recently, Meisel and Moser (2004) presented HPA digestion ID-ICPMS analyses of Re and PGEs in the CRPG serpentinite referencematerial UB-N, and compared those with analyses obtained by Cariustube digestions to conclude that the latter technique was less efficient inextracting PGEs, especially Os, Ir, and Ru. To test this, we performeda time-temperature series of digestions of seven powder aliquots ofCRPG serpentinite reference material UB-N using the analytical techniquesapplied here. The rationale behind this experiment was that if arefractory phase in UB-N was only partially dissolved by Carius tubeUNCORRECTED PROOFdigestion, then increasing the temperature or the run duration shouldincrease the yield of Os, Ir, and Ru extraction. Obtaining a plateau insuch a series would indicate quantitative digestion of that phase. Theresults of this experiment are reported in Table 1. The reproducibilitywas 3 to 10%, and no time dependence was observed for digestions thatlasted from 24 to 96 h at temperatures of 240°C and 270°C. For theUB-N standard, the mean Re, Os, Ir, Pt, and Pd abundances obtainedhere are within 1 to 4% of those reported by Meisel and Moser (2004),whereas our Ru abundances are 15% higher. Thus, this experimenthas indicated that the Carius tube digestion m<strong>et</strong>hod is at least asefficient in dissolving PGE carriers in serpentinized peridotitic materialsas the HPA digestion technique.3AQ: 8AQ: 9T16263646566676869707172737475767778798081828384858687888990919293949596979899100101102103104105106107108109110111112113114
1234567891011121314151617181920212223242526272829303132333435363738394041424344454647484950515253T2F2tapraid2/gca-gca/gca-gca/gca00605/gca4141d05z xppws S1 2/2/05 1:12 Art: W#2784 DTD5.04 I. S. Puchtel and M. HumayunTable 2. Major (in wt%) and minor (in ppm) element data for Kostomuksha komatiites.Depth, m SiO 2 TiO 2 Al 2 O 3 Fe 2 O 3 MnO MgO CaO Na 2 O K 2 O P 2 O 5 LOI Cr NiFlow 8 (197.5–201.0)9469 197.7 44.0 0.502 8.43 14.2 0.17 25.8 6.90 0.01 0.02 0.07 6.49 3127 1138Flow 10 (224–225.5)9479 224.8 44.6 0.430 7.31 13.0 0.17 27.8 6.55 0.01 0.02 0.07 7.05 3083 1232Flow 13 (229.0–241.1)9487 229.2 46.1 0.426 7.03 11.2 0.19 27.9 7.03 0.00 0.01 0.15 6.66 3097 13719488 233.0 46.7 0.495 8.50 12.4 0.18 24.2 7.38 0.00 0.02 0.18 5.27 3314 11089489 234.2 44.6 0.393 6.70 10.2 0.18 29.2 8.56 0.00 0.01 0.21 8.66 3027 14979490 237.3 43.4 0.261 4.48 11.0 0.17 37.3 3.32 0.01 0.01 0.03 11.6 2466 21199490A 238.1 44.2 0.264 4.53 10.5 0.18 37.1 3.08 0.11 0.01 0.08 11.0 2409 20779491 240.7 44.1 0.327 5.58 10.9 0.18 32.3 6.47 0.00 0.01 0.16 7.73 2703 16889492 241.1 46.4 0.445 7.65 11.5 0.17 26.4 7.17 0.00 0.02 0.16 5.75 3191 1274Flow 17 (247.5–254.0)9493 247.9 44.7 0.459 7.91 13.2 0.17 26.4 6.98 0.09 0.02 0.06 6.27 3120 12449495 249.3 44.4 0.469 7.55 13.4 0.17 26.6 7.32 0.02 0.03 0.07 5.93 3096 13259496 250.7 45.0 0.489 7.89 13.8 0.18 25.4 7.12 0.01 0.02 0.07 5.65 2968 11039497 252.2 45.6 0.476 7.75 13.7 0.18 24.8 7.37 0.01 0.03 0.06 5.19 3022 11479498 253.0 44.8 0.509 8.47 13.4 0.18 24.1 7.97 0.22 0.03 0.06 5.70 3244 109794100 253.9 43.7 0.290 5.19 11.2 0.21 34.8 4.49 0.01 0.02 0.06 10.1 2612 1889Flow 18 (254.0–261.0)94104 257.0 45.3 0.412 7.12 12.2 0.18 27.9 6.77 0.01 0.02 0.05 7.69 2946 1378Flow 19 (261.0–268.0)94111 261.2 46.2 0.416 7.15 11.7 0.16 27.4 6.95 0.04 0.02 0.08 6.39 3009 140194112 261.5 45.5 0.437 7.39 12.8 0.16 26.7 6.73 0.16 0.02 0.06 6.06 3040 132794114 262.6 45.5 0.398 6.97 12.2 0.17 28.3 6.31 0.01 0.02 0.07 7.21 2895 145694115 264.0 45.6 0.448 7.18 12.9 0.18 26.2 7.37 0.01 0.02 0.06 6.43 3084 130594116 266.3 45.0 0.319 5.41 11.4 0.19 32.7 4.98 0.01 0.02 0.06 9.02 2743 179794117 266.9 42.6 0.210 3.56 10.3 0.17 40.2 2.98 0.01 0.01 0.02 14.0 2273 241394118 267.7 43.6 0.241 4.17 11.2 0.19 37.1 3.38 0.01 0.01 0.04 10.9 2430 2145Flow 26 (289.5–297.0)94121 290.0 44.9 0.418 7.17 11.5 0.18 28.7 6.73 0.30 0.02 0.07 6.72 3151 135294123 292.3 44.7 0.500 8.12 13.6 0.17 25.5 7.14 0.16 0.03 0.06 6.11 3250 117594124 293.5 45.7 0.467 7.79 13.0 0.18 24.9 7.80 0.14 0.03 0.07 5.50 3109 110494126 296.5 44.2 0.300 5.07 11.6 0.19 33.6 4.94 0.01 0.01 0.05 9.90 2763 1861Analyses recalculated on an anhydrous basis.4. RESULTS4.1. Major and Minor Element Data and the MgOContent of the Emplaced Komatiite LavaMajor and minor (Cr, Ni) element data for all samplesanalyzed for HSE in this study are presented in Table 2, and theabundances of Al, Ti, Cr, and Ni are plotted against MgO onthe variation diagrams in Figure 2. Samples from Flow 13,including two chilled margin samples, plot on the same olivinefractionation trends as samples from the other flows, and thus,show no evidence of postmagmatic disturbance of these elements,as concluded by Puchtel <strong>et</strong> al. (1998). The average MgOcontent of the chilled margin samples from the four compl<strong>et</strong>elava flows studied is 27.4 0.4% and is considered here toreflect the MgO content of the emplaced komatiite lavas. Thisvalue is identical to 27 1% MgO calculated by Puchtel <strong>et</strong> al.(1998) for a larger number of komatiite lava flows using severalindependent approaches.Both compatible (MgO, Ni) and incompatible elements (Al,Ti, Cr) exhibit variations across the lava flows, typical of thosereported for other differentiated komatiite lava units worldwidewith a comparable MgO content (e.g., see recent review byPuchtel <strong>et</strong> al., 2004b). The MgO content varies b<strong>et</strong>ween 24 and28% in the A zone, generally decreasing towards the lowermostpart of it, and b<strong>et</strong>ween 29 and 40% in the B zone. The highestMgO content (40%) is observed in the cumulate portion ofFlow 19, whereas in the cumulate zone of Flow 13, the MgOcontent does not exceed 37%.4.2. PGE and Re Abundances in the EmplacedKomatiite LavaPGE and Re data for the analyzed samples are listed in Table3 and are plotted on the variation diagrams in Figure 3. PGEdata are also plotted as CI chondrite-normalized abundances inFigure 4. The PGE abundances in the emplaced komatiite lavawere calculated from an average PGE content of the chilledmargin samples, which have been shown to represent the compositionof the emplaced komatiite lava at Kostomuksha (Puchtel<strong>et</strong> al., 1998). These samples plot on the bulk differentiationtrends for PGEs (Fig. 3) and do not show any evidence ofpostmagmatic PGE mobility. Nine analyses of five samplesindicate that the emplaced komatiite lava contained 1.9 ppb Osand was characterized by a slightly supra-chondritic (Os/Ir) N 1.07 and a moderately fractionated PGE pattern with(Pd/Ir) N 5.2 (Table 3; Fig. 4).Unlike PGEs, the Re abundances display a totally irregularbehavior on the MgO vs. Re plot due to a Re mobility duringseafloor alteration and/or subsequent greenschist facies m<strong>et</strong>amorphism,as was also concluded by Puchtel <strong>et</strong> al. (2001). ThisUNCORRECTED PROOFT3,F3F46263646566676869707172737475767778798081828384858687888990919293949596979899100101102103104105106107108109110111112113114
1234567891011121314151617181920212223242526272829303132333435363738394041424344454647484950515253tapraid2/gca-gca/gca-gca/gca00605/gca4141d05z xppws S1 2/2/05 1:12 Art: W#2784 DTD5.0makes it impossible to estimate the Re content of the emplacedkomatiite lava with any degree of confidence.4.3. Comparison of PGE and Re Abundances Obtainedby Different M<strong>et</strong>hodsTo compare the results obtained using two different digestiontechniques, also presented in Figure 3 and Table 3 are PGE datafrom the Puchtel and Humayun (2000) study. The abundances ofOs, Ir, and Pt in the emplaced komatiite lava obtained here are, onaverage, 22 to 25% higher, and abundances of Ru are 34%higher, compared to those reported by Puchtel and Humayun(2000). We attribute the discrepancies b<strong>et</strong>ween the results from theNiS fire-assay and Carius tube digestion techniques to incompl<strong>et</strong>edissolution of PGE carriers, mostly chromite, during the NiSfire-assay procedure. A similar interpr<strong>et</strong>ation has been put forwardby Puchtel <strong>et</strong> al. (2004b), who have digested a large s<strong>et</strong> of samplesof Abitibi komatiites using both the Carius tube and NiS fire-assaytechniques. In their study, the observed discrepancies b<strong>et</strong>ween theresults from the two digestion techniques were even larger, likelyHSE geochemistry of Kostomuksha komatiitesFig. 2. Variation diagrams of Al, Ti (wt%), and Cr and Ni (ppm) vs. MgO (wt%) for Kostomuksha komatiites. Thecomposition of Abitibi olivine was adopted from Puchtel <strong>et</strong> al. (2004b). The trends represent best fit lines drawn throughthe komatiite analytical data points. Note that the trends pass through or close to the olivine compositions and thus representolivine control lines. The bulk cumulate was calculated from the differentiation trends assuming that its MgO abundancewas d<strong>et</strong>ermined by that of olivine (i.e., was equal to 51%). Average depl<strong>et</strong>ed spinel lherzolite (ADSL) from Puchtel <strong>et</strong> al.(2004b).due to a b<strong>et</strong>ter state of preservation of mineral phases in the Abitibisamples. The Pd contents are identical b<strong>et</strong>ween the two techniques,indicating that Pd is not hosted by a phase that is resistantin the NiS fire-assay digestion procedure.4.4. PGE Fractionation During Magmatic DifferentiationIn the variation diagrams (Fig. 3), Pt and Pd abundances inall samples show a strong (r 0.97–0.98) inverse correlationwith MgO, indicating that these PGEs behaved incompatiblyduring lava differentiation (Fig. 3). The bulk D Sol-Liq Pt, Pd of 0.1was calculated from the MgO vs. Pt and Pd differentiationtrends in Figure 3, using the MgO content of the emplacedkomatiite lava of 27% and assuming that the MgO content ofthe bulk cumulate was d<strong>et</strong>ermined by olivine and was 51%(Puchtel <strong>et</strong> al., 1998). The bulk D Sol-Liq Pt from this study (0.09)is much lower than that obtained by Puchtel and Humayun(0.52), whereas D Sol-Liq Pt is similar.According to the IPGE (IPGEs: Os, Ir, and Ru; Barnes <strong>et</strong> al.,1985) behavior during lava differentiation, all lava flows ana-UNCORRECTED PROOF5AQ: 10AQ: 116263646566676869707172737475767778798081828384858687888990919293949596979899100101102103104105106107108109110111112113114
1234567891011121314151617181920212223242526272829303132333435363738394041424344454647484950515253tapraid2/gca-gca/gca-gca/gca00605/gca4141d05z xppws S1 2/2/05 1:12 Art: W#2784 DTD5.06 I. S. Puchtel and M. HumayunUNCORRECTED PROOFlyzed in this study were subdivided into two types. Samplesfrom the first, dominant type, which we term the Kostomukshatype, in the MgO vs. Os, Ir, and Ru diagrams plot on the trendlines with negative slopes indicating an incompatible behavior.In this type of lavas, spinifex-textured samples with the lowestMgO content have the highest PGE abundances (Fig. 4). Thiswas the only type recognized in the Puchtel and HumayunTable 3. PGE and Re abundances (in ppb) in Kostomuksha komatiites.Sample Re Os Ir Ru Pt Pd (Os/Ir) N (Pd/Ir) N Pt/Ti Pd/Pt9469 1.75 1.65 5.69 10.7 11.5 1.05 5.99 3.57 1.079469 1.53 1.59 3.97 9.19 12.0 0.95 6.48 3.05 1.319479 0.939 2.01 1.88 5.59 10.5 11.0 1.06 5.03 4.05 1.059479 1.77 1.71 4.04 8.51 11.2 1.03 5.62 3.30 1.319487 0.684 1.83 1.70 5.84 10.5 11.0 1.06 5.55 4.13 1.049488 0.559 0.742 0.878 5.60 11.6 11.5 0.84 11.3 3.92 0.999489 2.44 0.774 0.889 5.92 9.78 8.80 0.86 8.50 4.16 0.909490* 0.040 5.11 4.15 5.75 6.24 4.97 1.22 1.03 3.99 0.809490* 0.045 5.26 4.26 5.87 7.12 6.60 1.22 1.33 4.56 0.939490 6.19 6.15 4.93 6.82 5.37 1.00 0.75 4.36 0.799490A 0.051 4.55 3.79 5.95 6.84 5.95 1.19 1.35 4.32 0.879491 0.739 2.94 2.47 5.93 8.03 8.26 1.18 2.88 4.10 1.039492 0.540 1.87 1.69 5.86 10.9 11.0 1.09 5.57 4.07 1.019493* 2.02 1.85 5.98 11.3 10.7 1.08 4.98 4.12 0.959493* 0.546 1.96 1.77 5.93 11.3 10.1 1.10 4.90 4.10 0.909493* 0.604 2.22 1.98 5.97 11.0 9.87 1.11 4.27 4.00 0.909493 1.50 1.39 4.31 9.13 11.1 1.04 6.40 2.96 1.289495 0.749 1.94 1.62 5.89 10.6 10.3 1.18 5.45 3.76 0.979495 1.29 1.27 3.77 8.62 10.6 1.01 7.20 2.83 1.239496 0.145 1.85 1.60 5.64 10.5 10.5 1.14 5.63 3.59 0.999496 1.53 1.53 3.69 8.62 11.2 0.99 6.33 2.94 1.309497 0.183 1.86 1.66 5.69 11.4 11.0 1.11 5.68 3.99 0.979497 1.43 1.51 3.83 8.38 11.7 0.94 6.68 2.94 1.409498 0.123 1.95 1.72 5.72 11.3 11.3 1.13 5.67 3.71 1.009498 1.50 1.61 3.90 8.27 11.4 0.92 6.05 2.71 1.3794100* 1.20 5.27 7.56 6.38 4.56 4.35 0.8494100* 1.47 1.28 5.13 7.41 6.05 1.14 4.08 4.26 0.8294100* 0.100 1.50 1.34 5.45 7.34 6.94 3.11 4.43 4.23 0.9494100 1.19 1.26 4.19 7.37 5.92 0.95 4.15 4.18 0.8394104 0.546 1.73 1.64 5.73 10.5 10.6 1.05 5.56 4.27 1.0194104 1.56 1.46 3.79 8.11 9.97 1.06 5.87 3.29 1.2394111* 1.71 1.67 5.65 10.3 11.0 1.01 5.65 4.15 1.0694111* 0.895 1.89 1.76 5.82 10.4 10.7 1.06 5.22 4.17 1.0394111* 0.920 1.81 1.67 5.76 10.2 10.4 1.08 5.37 4.10 1.0294111 1.55 1.42 4.36 8.64 11.5 1.03 6.76 3.14 1.3994112 0.574 1.78 1.53 5.56 9.79 10.4 1.15 5.81 3.74 1.0694114 0.711 1.75 1.54 5.59 9.56 9.45 1.12 5.25 4.01 0.9994114 1.38 1.33 3.67 7.78 9.60 1.00 6.23 3.26 1.2494115 0.508 1.90 1.68 5.62 10.4 11.1 1.12 5.70 3.86 1.0794116 1.58 1.43 5.41 7.44 7.51 1.09 4.50 3.89 1.0194116 1.40 1.37 3.94 7.66 7.48 1.01 4.79 4.01 0.9994117 1.24 1.18 5.22 5.20 4.90 1.04 3.56 4.14 0.9494117 1.16 1.20 4.01 5.89 5.11 0.95 3.65 4.68 0.8794118 1.32 1.15 5.27 6.37 5.98 1.13 4.45 4.41 0.9494118 1.37 1.28 3.80 6.20 6.05 1.05 4.05 4.29 0.9894121 0.278 1.86 1.74 5.68 10.4 10.5 1.06 5.20 4.16 1.0194121 1.40 1.33 3.40 9.42 10.2 1.04 6.61 3.40 1.2094123 0.275 2.01 1.77 6.00 11.5 11.0 1.13 5.35 3.85 0.9694123 1.52 1.47 3.40 9.42 11.4 1.02 6.69 3.15 1.2194124 0.398 2.01 1.71 5.69 11.3 11.0 1.16 5.52 4.04 0.9794126* 1.43 5.35 7.47 6.67 4.02 4.16 0.8994126* 1.64 1.41 5.41 7.23 7.36 1.15 4.49 4.02 1.0294126* 0.119 1.56 1.42 5.51 7.81 7.46 1.09 4.52 4.35 0.9594126 1.43 1.54 3.53 7.63 6.64 0.93 3.77 4.17 0.89Normalizing values (N) from Anders and Grevesse (1989) Plain text and boldfaced values (this study) samples digested at 240°C and 270°C for48–72 h, respectively; italicized values - data from Puchtel and Humayun (2000).* Separate CT digestions of aliquots from the same batches of sample powder.(2000) study. The bulk D Sol-Liq calculated in this study are0.37, 0.41, and 0.81 for Os, Ir, and Ru, respectively. The bulkD Sol-Liq Os, Ir are two times lower than those obtained by Puchtel andHumayun (2000) for this type of lavas (0.70 and 0.75). Alsoplotted in Figure 3 are average PGE and Re abundances inolivine from Abitibi komatiites (Puchtel <strong>et</strong> al., 2004b), whichhave compositions of emplaced lava similar to that at Kosto-6263646566676869707172737475767778798081828384858687888990919293949596979899100101102103104105106107108109110111112113114
1234567891011121314151617181920212223242526272829303132333435363738394041424344454647484950515253AQ: 12tapraid2/gca-gca/gca-gca/gca00605/gca4141d05z xppws S1 2/2/05 1:12 Art: W#2784 DTD5.0Fig. 3. Variation diagrams of HSE (ppb) vs. MgO (wt%) for Kostomuksha komatiites. The trends represent best fit linesdrawn through the komatiite analytical data points. Note that the IPGE data for samples from Flow 13 plot on trends (dashedlines) with positive slopes, indicating compatible (Munro type) behavior during lava differentiation, whereas the IPGE datafor the other flows plot on trends (solid lines) with negative slopes, indicating an incompatible (Kostomuksha type) behaviorduring lava differentiation. The latter trends also pass through or close to the composition of Abitibi olivine. Platinum andPd data for both Kostomuksha- and Munro-type komatiites plot on the olivine control lines, and the calculated compositionsof bulk cumulates are similar to that of olivine. Rhenium data exhibit a totally irregular behavior as a result of Re mobilityduring postmagmatic processes. The data from Puchtel and Humayun (2000) obtained by the NiS fire-assay ID-ICPMStechnique are shown for comparison. See also legend for Figure 2 and text for explanation.UNCORRECTED PROOFmuksha. The olivine composition plots on or close to theregression lines for all PGEs except Ru, thus confirming theconclusion of Puchtel and Humayun (2000) that PGE variationsin this type of lava were controlled by a single phase, olivine.In contrast to the Kostomuksha-type flows, Os, Ir, and Rudata for samples from the second type, represented by Flow 13and which we term the Munro type, plot along trends withHSE geochemistry of Kostomuksha komatiitespositive slopes, indicating a compatible behavior during lavadifferentiation. In this type of lava, spinifex-textured samplesand B 1 cumulates have the lowest IPGE content, and B 2–4cumulates have the highest IPGE abundances (Fig. 4). This issom<strong>et</strong>hing that was not compl<strong>et</strong>ely realized by Puchtel andHumayun (2000), who at that time analyzed only one cumulatesample from this flow (9490). This type of compatible behav-76263646566676869707172737475767778798081828384858687888990919293949596979899100101102103104105106107108109110111112113114
1234567891011121314151617181920212223242526272829303132333435363738394041424344454647484950515253tapraid2/gca-gca/gca-gca/gca00605/gca4141d05z xppws S1 2/2/05 1:12 Art: W#2784 DTD5.08 I. S. Puchtel and M. HumayunFig. 4. CI chondrite-normalized (Anders and Grevesse 1989) PGE abundances in Kostomuksha komatiites. Triangles chilled margins; diamonds A 2–3 spinifex; squares B 1 cumulate; and circles B 2–4 cumulates. Composition of theprimitive upper mantle (dashed line) is calculated assuming an Ir content of 3.3 ppb (Morgan, 1986) and CI chondriterelative abundances of Anders and Grevesse (1989).ior, with the bulk D Sol-Liq of 4.8, 4.1, and 1.1 for Os, Ir, and Ru,respectively, is similar to that found in Pyke Hill and Alexokomatiites (Puchtel <strong>et</strong> al., 2004b).5. DISCUSSION5.1. Thickness of Cumulate Zone and IPGE BehaviorDuring Lava DifferentiationThe Kostomuksha-type komatiite lavas are quite unique intheir IPGE fractionation pattern as a function of lava differentiation.Indeed, many previous studies have demonstrated astrong positive correlation b<strong>et</strong>ween Os, Ir, and MgO in lavas inwhich olivine was shown to be the major liquidus phase (Barnes<strong>et</strong> al., 1985; Crock<strong>et</strong> and MacRae, 1986; Brügmann <strong>et</strong> al.,1987; Zhou, 1994; Barnes <strong>et</strong> al., 1995; Keays, 1995; Lesher andStone, 1996; Rehkämper <strong>et</strong> al., 1999b; Puchtel and Humayun,2001; Puchtel <strong>et</strong> al., 2004b). At the same time, it becomesincreasingly clear that olivine alone played only a minor role incontrolling the IPGE budg<strong>et</strong> of mantle derived rocks. In theirstudy of Alexo and Pyke Hill komatiites, Puchtel <strong>et</strong> al. (2004b)have established that there was a minor IPGE-rich phasepresent on the liquidus of the differentiated lava flows studied,which fractionated separately from olivine and concentratedmostly in the lowermost cumulate part of the flows. However,the identity of this phase, and wh<strong>et</strong>her it was already present inthe lava upon eruption or crystallized after emplacement, couldnot be established conclusively. In contrast, the IPGEs wereincompatible during differentiation of the majority of komatiitelavas at Kostomuksha. The only other example known to theauthors, where IPGEs are characterized by a similarly incompatiblebehavior, are komatiites from the Komati formation inthe Barberton Mountain Land (Maier <strong>et</strong> al., 2003), althoughthese komatiites have relatively low PGE abundances overall.One feature that distinguishes the Kostomuksha-type flows isvery small thicknesses of cumulate zones, which constitute20% of the total thicknesses of the flows. The only exceptionis Flow 13, in which cumulate zone occupies 2/3 of its thickness,and this flow does display the commonly observed Munro-typepositive correlation b<strong>et</strong>ween IPGEs and MgO.Komatiite lava flows with thick spinifex zone and thin cumulatezone are less common than their counterparts, which areeither massive throughout or contain a thick cumulate zone.The extent to which a spinifex zone is developed in anyparticular lava flow depends on the initial concentration ofolivine phenocrysts, the temperature of the lava upon emplacement,and the thickness of the lava unit (Pyke <strong>et</strong> al., 1973;UNCORRECTED PROOF6263646566676869707172737475767778798081828384858687888990919293949596979899100101102103104105106107108109110111112113114
1234567891011121314151617181920212223242526272829303132333435363738394041424344454647484950515253tapraid2/gca-gca/gca-gca/gca00605/gca4141d05z xppws S1 2/2/05 1:12 Art: W#2784 DTD5.0Arndt <strong>et</strong> al., 1977). Where these factors combine to contribut<strong>et</strong>o slow cooling, the lava remained liquid longer, and s<strong>et</strong>tling ofliquidus phases occurred more efficiently, giving rise to athicker spinifex zone. This implies that in flows with thickspinifex zones, the conditions for effective crystal s<strong>et</strong>tling weremore favorable and thus, if the IPGE-rich phase was present inthe lava upon eruption or had crystallized during lava cooling,it would have a b<strong>et</strong>ter chance to accumulate in the lower part ofthe flow. Obviously, it did not happen in the Kostomuksha-typeflows. Because there is no reason to believe that the Munrotypeflows were more saturated with the IPGE-rich phase thanthe Kostomuksha-type, as both have the same PGE compositionof the emplaced lava and were emplaced as consecutiveflows, we conclude that in the Kostomuksha-type flows with athin cumulate zone, s<strong>et</strong>tling of this phase was inhibited,whereas in the Munro-type lavas with a thick cumulate zone,this phase was s<strong>et</strong>tling freely. The cause for such a differenceremains unclear, however.5.2. PGE Composition of the KostomukshaMantle SourceHSE geochemistry of Kostomuksha komatiitesTable 4. Results of modeling.Sample Os Ir Ru Pt Pd MgO TiO 2 Al 2 O 3Composition of emplaced komatiite lava at Kostomuksha[1] 1.90 1.75 5.81 10.7 10.6 27.4 0.432 7.39[2] 1.45 1.38 3.86 8.22 10.6 27.5 0.431 7.41Komatiite lava differentiation: calculated solid-liquid partition coefficientsBulk D1 0.38 0.42 0.81 0.09 0.01 1.9 0.01 0.03Bulk D2 4.8 4.1 1.1 0.09 0.01 1.9 0.01 0.03Olivine 0.43 0.35 0.70 0.04 0.05 1.9 0.01 0.01Composition of mantle sources[3] 4.3 3.9 5.8 6.0 5.4 38.3 0.23 4.0[4] 2.5 2.5 3.7 5.1 2.9 37.8 0.18 4.1[5] 3.9 3.6 5.4 5.7 5.7 38.3 0.19 4.1[6] 3.9 3.6 5.4 7.1 4.8 38.3 0.22 4.0The bulk D PGE Sol-Liq were calculated from the bulk differentiation trends in Fig. 3 assuming an MgO content of the bulk cumulate of 51% (i.e.,its MgO content was d<strong>et</strong>ermined by that of olivine) and using the PGE abundances in the emplaced lava [1]. Bulk D1 and D2 for IPGEs werecalculated from data for the Kostomuksha- and Munro-type lavas, respectively; bulk Ds for Pt and Pd were calculated using data for both types oflavas.D Ol-Liq are from Puchtel <strong>et</strong> al. (2004b). These apparent Ds were calculated using the average measured composition of Abitibi olivine and theaverage composition of the emplaced komatiite lava from which this olivine has crystallized.[1] PGE data from this study; major element data from Puchtel <strong>et</strong> al. (1998).[2] Data from Puchtel and Humayun (2000).[3] Calculated source for Kostomuksha komatiites from this study.[4] Calculated source for Kostomuksha komatiites from Puchtel and Humayun (2000).[5] Calculated source for Abitibi komatiites from Puchtel <strong>et</strong> al. (2004a, 2004b).[6] Average depl<strong>et</strong>ed spinel Iherzolite, ADSL (Puchtel <strong>et</strong> al., 2004b).The radiogenic 187 Os/ 188 Os isotopic composition of the Kostomukshakomatiite source established by Puchtel <strong>et</strong> al. (2001)indicates that, whatever its origin, this source evolved with atime-integrated supra-chondritic Re/Os ratio. Here, we d<strong>et</strong>ermin<strong>et</strong>he PGE abundances in the source of the Kostomukshakomatiites at the time of komatiite formation. These werecalculated on the basis of several techniques and assumptionsoutlined in d<strong>et</strong>ail by Puchtel <strong>et</strong> al. (2004a, 2004b), which areonly briefly summarized here. First, it was assumed that theabundances of moderately incompatible and compatible lithophileelements in the Kostomuksha source can be approximatedby those in an average depl<strong>et</strong>ed spinel lherzolite (ADSL; Puchtel<strong>et</strong> al., 2004b), as both are similarly depl<strong>et</strong>ed in large ionlithophile elements (LILE) such as LREE, Th, and U. As such,the degree of partial melting of the Kostomuksha source wascalculated to be 48% using a batch partial melting model(Shaw, 1970), and the abundances of moderately incompatibleelements (e.g., Al, Ti, Gd; D Sol-Liq 0.1; Green, 1994) inADSL and in the Kostomuksha emplaced komatiite lava. Atsuch high degrees of partial melting in the spinel to garn<strong>et</strong>peridotite stability field, all interstitial sulfide, which is themain host of Pt and Pd, is compl<strong>et</strong>ely consumed (Barnes <strong>et</strong> al.,1985; Keays, 1995), and the only major phase that is left behindin the residue is olivine and possibly small amounts of majoritegarn<strong>et</strong> (Arndt, 1976), as indicated by a slight depl<strong>et</strong>ion of heavyrare earth elements (HREE) in the Kostomuksha lavas (Puchtel<strong>et</strong> al., 1998). Hence, the abundances of moderately incompatibleelements, including Pt and Pd, in the lava and in the source,must plot on olivine control lines in the MgO variation diagrams.Using 38.3% MgO in ADSL as an estimate of MgOabundance in the source of the Kostomuksha komatiite, fromregressions in Figures 2 and 3, this source can be shown tocontain 4.0% Al 2 O 3 , 0.23% TiO 2 , 6.0 ppb Pt, and 5.4 ppb Pd.The calculated abundances of Al and Ti in the Kostomukshakomatiite source are identical to those in ADSL, whereas the Ptcontent is 15% lower, and Pd content is 10% higher in theKostomuksha source compared to ADSL (Table 4).The abundances of IPGEs that are compatible even duringhigh degrees of partial melting cannot be calculated in the samemanner as those of the incompatible elements, so a differentapproach was adopted here following the reasoning of Puchtel<strong>et</strong> al. (2004b). Ruthenium shows very little fractionation duringkomatiite lava differentiation, both at Kostomuksha and at PykeHill-Alexo. It is thus assumed that the bulk D Ru was close tounity also during partial melting. The average Ru abundance inUNCORRECTED PROOF9AQ: 13T46263646566676869707172737475767778798081828384858687888990919293949596979899100101102103104105106107108109110111112113114
1234567891011121314151617181920212223242526272829303132333435363738394041424344454647484950515253F5tapraid2/gca-gca/gca-gca/gca00605/gca4141d05z xppws S1 2/2/05 1:12 Art: W#2784 DTD5.010 I. S. Puchtel and M. HumayunFig. 5. CI chondrite-normalized (Anders and Grevesse, 1989) HSEabundances in the calculated source of the Kostomuksha komatiites.The PGE data for the source of Abitibi komatiites and for an averagedepl<strong>et</strong>ed spinel lherzolite (ADSL) from Puchtel <strong>et</strong> al. (2004b). Note thesupra-chondritic Pd/Ir ratios in both sources and in ADSL.the emplaced komatiite lavas is 5.8 ppb, so we assume that theRu abundance in the komatiite source was also 5.8 ppb. This isslightly higher than that in ADSL (5.4 ppb) with an overalluncertainty of 2% (2 mean ). The average (Os/Ir) N ratio in theemplaced Kostomuksha komatiitic lava is close to CI-chondritic(1.07), is identical to that in the Abitibi emplaced komatiitelava (1.07), and is taken to be also such in the Kostomukshamantle source, as Os/Ir ratios fractionate very little duringpartial melting. We assume that the Ru/Ir in the Abitibi sourcewas CI-chondritic (1.48), which then yields the Os and Irabundances in the source of 4.3 and 3.9 ppb, respectively(Table 4). These IPGE abundances are 10% higher than thosein ADSL and in the source of the Abitibi komatiites (Fig. 5).Both the Kostomuksha and Abitibi sources are depl<strong>et</strong>ed in Ptand enriched in Pd with Pd/Pt of 0.90 and 1.0, respectively,thus revealing non-CI chondritic PGE patterns. This is a significantdeparture from the approach of Puchtel and Humayun(2000), who assumed a CI-chondritic source, and then assumedthat “excess Pd” was present in the Kostomuksha emplacedlava due to melt-focusing of low-degree melt fractions fromvariable depths. It can be seen that there is no “excess” of Al,Ti, or Pt, which are equally incompatible during high degreesof partial melting, so that interpr<strong>et</strong>ation is abandoned here. ThePd/Pt ratio of the Kostomuksha komatiite source (0.90) issimilar to that of the Abitibi komatiite source (1.00) obtainedby Puchtel <strong>et</strong> al. (2004b), i.e., 60% higher than in a CIchondriticmantle (0.57), indicating that “excess” Pd relative toa CI-chondrite mantle is a feature of komatiite mantle sourceregions which exhibit both radiogenic and chondritic long-termRe/Os ratios. Pattou <strong>et</strong> al. (1996) argued that the supra-chondriticPd/Ir ratios observed in some upper mantle peridotiteswere evidence of a non-chondritic mantle PGE composition.However, Alard <strong>et</strong> al. (2000) observed high Pd/Ir- and lowPd/Ir-bearing sulfides by laser ablation ICPMS in the same s<strong>et</strong>of xenoliths studied by Pattou <strong>et</strong> al. (1996) and argued that thePGE patterns observed by these authors could be explained bythe presence of these two sulfide phases in different proportions.Thus, supra-chondritic Pd/Ir ratios have been attributedto magmatic modifications of the upper mantle source regionsof mantle xenoliths. Similarly, Rehkämper <strong>et</strong> al. (1999a) explainedsupra-chondritic Pd/Ir ratios of some abyssal peridotitesin terms of melt percolation. Our results indicate that onemust either accept that melt percolation has significantly enrichedthe Pd/Ir ratios of two independent komatiite sourceregions to almost exactly the same degree, or that such highPd/Ir ratios are genuine characteristics of the Earth’s mantle.Although the mantle sources of the Kostomuksha and Abitibikomatiites had very similar lithophile trace element, Pb- andNd-isotope characteristics, and HSE compositions, they haddistinct 187 Os/ 188 Os isotopic compositions. The source of theKostomuksha komatiites had a radiogenic 187 Os/ 188 Os ratio(Puchtel <strong>et</strong> al., 2001), whereas the source of the Abitibi komatiiteshad a nearly chondritic 187 Os/ 188 Os ratio (Gangopadhyayand Walker, 2003; Puchtel <strong>et</strong> al., 2004a). Puchtel <strong>et</strong> al.(2001) proposed that the enriched 187 Os/ 188 Os signature in theKostomuksha komatiites was derived from the outer core. Ifthis was indeed the case, the results obtained in this study havean important bearing on our understanding of the core-mantleinteraction mechanism. Walker <strong>et</strong> al. (1995) postulated thatcore-mantle exchange occurred by physical mixing of outercore material into mantle plume sources. Although this processshould have substantially enriched mantle sources of the lavasin Os, the fact that such an enrichment was not observed waslater explained by difficulties in deducing the exact abundancesof Os in the mantle sources from those in lavas (Shirey andWalker, 1998). Puchtel and Humayun (2000) demonstrated thepotential of PGE studies on komatiites for resolving theseissues. They estimated that, to account for the Os isotopicenrichment in the Kostomuksha komatiites, the amount of corematerial required by the physical mixing model is on the orderof 1%, but noted that physical addition of such amount of outercore material would have increased the PGE abundances in theKostomuksha source by about an order of magnitude. Theycompared the abundances of PGEs in their estimate of theKostomuksha komatiite source with those in the source of theAlexo komatiites derived from KAL-1 and concluded thatthere was no evidence of PGE addition to the Kostomukshasource.Using the new PGE data for the Abitibi and Kostomukshakomatiites (Table 4), it is now possible to refine the conclusionsof Puchtel and Humayun (2000) and to show that both sourcescontained essentially identical abundances of PGEs. This observationsupports the conclusion of Puchtel and Humayun(2000) that if core-mantle interaction produced the supra-chondriticinitial 187 Os/ 188 Os in the Kostomuksha komatiites, thensome kind of isotopic exchange rather than physical mixing isrequired. Importantly, this conclusion is independent of anymelting model. This means that the similarity in Ru contents ofthe Kostomuksha and Abitibi magmas can be used to comparePGE abundances in their respective mantle sources, and canthen be applied to other komatiites to d<strong>et</strong>ermine wh<strong>et</strong>her theywere derived from mantle sources with enhanced PGE abundances.UNCORRECTED PROOF6263646566676869707172737475767778798081828384858687888990919293949596979899100101102103104105106107108109110111112113114
1234567891011121314151617181920212223242526272829303132333435363738394041424344454647484950515253tapraid2/gca-gca/gca-gca/gca00605/gca4141d05z xppws S1 2/2/05 1:12 Art: W#2784 DTD5.06. SUMMARY AND CONCLUSIONS1. PGE analysis by the Carius tube digestion ID-ICPMS techniqueproduces data comparable to those obtained by theHPA digestion ID-ICPMS technique, provided Carius tubesare heated at T 240°C for 48 h.2. Incompl<strong>et</strong>e digestion of chromite, and possibly some otherPGE carriers, in samples of Kostomuksha komatiites duringthe NiS fire-assay procedure used by Puchtel and Humayun(2000) led to underestimation of Os, Ir, and Pt abundancesby 22 to 25% and Ru abundances by 34% in the emplacedkomatiite lava.3. Two types of komatiite lavas have been distinguished in thisstudy based on the IPGE behavior during lava differentiation.The first type, which we term the Kostomuksha-type, ischaracterized by an incompatible behavior of IPGEs duringthe lava differentiation. This type is quite unique, the onlyother known example being komatiites from the KomatiFormation in the Barberton greenstone belt (Maier <strong>et</strong> al.,2003). The bulk partition coefficients for IPGEs calculatedfrom the bulk differentiation trends in the Kostomukshatypekomatiite are similar to those for olivine. Cumulatezone in this type of komatiite lava occupies 20% of th<strong>et</strong>otal thickness of the flows. The second type, which wenamed the Munro type, exhibits a compatible behavior ofIPGEs during the lava differentiation, with bulk partitioncoefficients similar to those obtained for Abitibi komatiitesby Puchtel <strong>et</strong> al. (2004b). These bulk partition coefficientsindicate that, as with the other Munro-type komatiite lavas,the bulk cumulate contained an IPGE-rich minor phase inaddition to olivine. The cumulate zone in this type of komatiiteoccupies 20% of the total thickness of lava flows.4. A non-CI chondritic PGE pattern has been established forthe source of the Kostomuksha komatiites. This pattern isvery similar to that calculated for Abitibi komatiites (Puchtel<strong>et</strong> al., 2004a; Puchtel <strong>et</strong> al., 2004b). The new resultsindicate that the non-CI chondritic HSE patterns are a genuinecharacteristic of the Earth’s mantle.5. The absolute PGE abundances in the source of the Kostomukshakomatiites are calculated to be identical to those inthe source of the Abitibi komatiites to within 10%.6. The conclusion of Puchtel and Humayun (2000) that coremantleinteraction must have occurred in the form of isotopicexchange at the core-mantle boundary was confirmed inthis study. However, any other mechanism proposed to beresponsible for creating radiogenic 187 Os/ 188 Os in ancientkomatiite mantle source regions must not affect the PGEabundances in the sources by a measurable amount, either.Studies of the Pt-Os systematics in Kostomuksha komatiitesare required to further test this hypothesis.UNCORRECTED PROOFAcknowledgments—We thank Thomas Meisel for sharing PGE resultson UB-N, KAL-1 and other standards before publication, and AndyCampbell for support on the Element. We are grateful to Mark Rehkämper,Cin-Ty Lee, and Ed Mathez for constructive reviews, and toEd Ripley for editorial handling. This study was supported by NSFEAR-0106974 and NSF EAR-0309786, which are gratefully acknowledged.Associate editor: E. M. RipleyHSE geochemistry of Kostomuksha komatiitesREFERENCESAlard O., Griffin W. L., Lorand J. P., Jackson S. E., and O’Reilly S. Y.(2000) Non-chondritic distribution of the highly siderophile elementsin mantle sulfides. Nature 407, 891–894.Anders E. and Grevesse N. (1989) Abundances of the elements: M<strong>et</strong>eoriticand solar. Geochim. Cosmochim. <strong>Acta</strong> 53, 197–214.Arndt N. T. (1976) Melting relations of ultramafic lavas (komatiites) atone atmosphere and high pressure. J. Yb. Carnegie Inst. Wash. 75,555–562.Arndt N. T., Naldr<strong>et</strong>t A. J., and Pyke D. R. (1977) Komatiitic andiron-rich tholeiitic lavas of Munro Township, northeast Ontario. J.P<strong>et</strong>rol. 18, 319–369.Barnes S.-J., Naldr<strong>et</strong>t A. J., and Gorton M. P. (1985) The origin of thefractionation of platinum-group elements in terrestrial magmas.J. Chem. Geol. 53, 303–323.Barnes S.-J., Lesher C. M., and Keays R. R. (1995) Geochemistry ofmineralised and barren komatiites from the Perseverance nickeldeposit, Western Australia. Lithos 34, 209–234.Birck J. L., Roy-Barman M., and Capman F. (1997) Re-Os isotopicmeasurements at the femtomole level in natural samples. GeostandardsNewsl<strong>et</strong>ter 20, 19–27.Brügmann G. E., Arndt N. T., Hofmann A. W., and Tobschall H. J.(1987) Noble m<strong>et</strong>al abundances in komatiite suites from Alexo,Ontario and Gorgona Island, Colombia. Geochim. Cosmochim.<strong>Acta</strong> 51, 2159–2169.Cohen A. S. and Waters F. G. (1996) Separation of osmium fromgeological materials by solvent extraction for analysis by thermalionisation mass spectrom<strong>et</strong>ry. J. Anal. Chim. <strong>Acta</strong> 332, 269–275.Crock<strong>et</strong> J. H. and MacRae W. E. (1986) Platinum-group elementdistribution in komatiitic and tholeiitic volcanic rocks from MunroTownship, Ontario. Econ. Geol. 81, 1242–1251.Gangopadhyay A. and Walker R. J. (2003) Re-Os systematics of the ca.2.7 Ga komatiites from Alexo, Ontario, Canada. Chem. Geol. 196,147–162.Green T. H. (1994) Experimental studies of trace-element partitioningapplicable to igneous p<strong>et</strong>rogenesis - Sedona 16 years later. J. Chem.Geology 117, 1–36.Keays R. R. (1995) The role of komatiitic and picritic magmatism andS-saturation in the formation of ore deposits. Lithos 34, 1–18.Lesher C. M. and Stone W. E (1996) Exploration geochemistry ofkomatiites. In Igneous Trace Element Geochemistry: Applicationsfor Massive Sulphide Exploration, Short Course, (ed. D. A.Wyman), pp. 153–204, Geological Association of Canada.Maier W. D., Roelofse F., and Barnes S.-J. (2003) The concentration ofthe platinum-group-elements in South African komatiites: Implicationsfor mantle sources, melting regime and PGE fractionationduring crystallization. J. P<strong>et</strong>rol. 44, 1787–1804.Meisel T. and Moser J. (2004) Reference materials for geochemicalPGE analysis: new analytical data for Ru, Rh, Pd, Os, Ir, Pt and Reby isotope dilution ICP-MS in 11 geological reference materials.Chem. Geol. 208, 319–338.Morgan J. W. (1986) Ultramafic xenoliths: Clues to Earth’s late accr<strong>et</strong>ionaryhistory. J. Geophys. Res. 91, 12375–12387.Pattou L., Lorand J. P., and Gros M. (1996) Non-chondritic platinumgroupelement ratios in the Earth’s mantle. Nature 379, 712–715.Pearson D. G., Irvine G. J., Ionov D. A., Boyd F. R., and Dreibus G. E.(2004) Re-Os isotope systematics and platinum-group-elementfractionation during mantle melt extraction: A study of massif andxenolith peridotite suites. J. Chem. Geol. 208, 29–59.Puchtel I. S. and Humayun M. (2000) Platinum group elements inKostomuksha komatiites and basalts: Implications for oceanic crustrecycling and core-mantle interaction. Geochim. Cosmochim. <strong>Acta</strong>64, 4227–4242.Puchtel I. S. and Humayun M. (2001) PGE fractionation in a komatiiticbasalt lava lake. Geochim. Cosmochim. <strong>Acta</strong> 17, 2979–2993.Puchtel I. S., Hofmann A. W., Mezger K., Jochum K. P., ShchipanskyA. A., and Samsonov A. V. (1998) Oceanic plateau model forcontinental crustal growth in the Archaean: A case study from theKostomuksha greenstone belt, NW Baltic Shield. Earth Plan<strong>et</strong>. Sci.L<strong>et</strong>t. 155, 57–74.Puchtel I. S., Brügmann G. E., and Hofmann A. W. (2001) 187 Osenricheddomain in an Archaean mantle plume: Evidence from 2.8116263646566676869707172737475767778798081828384858687888990919293949596979899100101102103104105106107108109110111112113114
1234567891011121314151617181920212223242526272829303132333435363738394041424344454647484950515253tapraid2/gca-gca/gca-gca/gca00605/gca4141d05z xppws S1 2/2/05 1:12 Art: W#2784 DTD5.012 I. S. Puchtel and M. HumayunGa komatiites of the Kostomuksha greenstone belt, NW BalticShield. Earth Plan<strong>et</strong>. Sci. L<strong>et</strong>t. 186, 513–526.Puchtel I. S., Brandon A. D., and Humayun M. (2004a) Precise Pt-Re-Os isotope systematics of the mantle from 2.7-Ga komatiites.Earth Plan<strong>et</strong>. Sci. L<strong>et</strong>t. 224, 157–174.Puchtel I. S., Humayun M., Campbell A., Sproule R., and Lesher C. M.(2004b) Platinum group element geochemistry of komatiites fromthe Alexo and Pyke Hill areas, Ontario, Canada. Geochim. Cosmochim.<strong>Acta</strong> 68, 1361–1383.Pyke D. R., Naldr<strong>et</strong>t A. J., and Eckstrand O. R. (1973) Archeanultramafic flows in Munro Township, Ontario. Geol. Soc. Amer.Bull. 84, 955–978.Rehkämper M., Halliday A. N., Alt J., Fitton J. G., Zipfel J., andTakazawa E. (1999a) Non-chondritic platinum-group element ratiosin oceanic mantle lithosphere: p<strong>et</strong>rogen<strong>et</strong>ic signature of meltpercolation? Earth Plan<strong>et</strong>. Sci. L<strong>et</strong>t. 172, 65–81.Rehkämper M., Halliday A. N., Fitton J. G., Lee D.-C., Wieneke M.,and Arndt N. T. (1999b) Ir, Ru, Pt and Pd in basalts and komatiites:New constraints for the geochemical behavior of the platinumgroup elements in the mantle. Geochim. Cosmochim. <strong>Acta</strong> 63,3915–3934.Shaw D. M. (1970) Trace element fractionation during anatexis.Geochim. Cosmochim. <strong>Acta</strong> 40, 73.Shirey S. B. and Walker R. J. (1995) Carius tube digestion for lowblankrhenium-osmium analysis. J. Anal. Chem. 67, 2136–2141.Shirey S. B. and Walker R. J. (1998) The Re-Os isotope system incosmochemistry and high-temperature geochemistry. J. Ann. Rev.Earth Plan<strong>et</strong>. Sci. 26, 423–500.Walker R. J. and Nisb<strong>et</strong> E. (2002) 187 Os isotopic constraints on Archeanmantle dynamics. Geochim. Cosmochim. <strong>Acta</strong> 66, 3317–3325.Walker R. J., Morgan J. W., and Horan M. F. (1995) 187 Os enrichmentin some plumes: evidence for core-mantle interaction. Science 269,819–822.Zhou M. F. (1994) PGE distribution in 2.7-Ga layered komatiite flowsfrom the Belingwe greenstone belt, Zimbabwe. Chem. Geol. 118,155–172.UNCORRECTED PROOF6263646566676869707172737475767778798081828384858687888990919293949596979899100101102103104105106107108109110111112113114
JOBNAME: AUTHOR QUERIES PAGE: 1 SESS: 1 OUTPUT: Wed Feb 2 01:12:58 2005/tapraid2/gcagca/gcagca/gca00605/gca4141d05zAUTHOR QUERIESAUTHOR PLEASE ANSWER ALL QUERIES 1AQ1— Please define ID-ICPMS in abstract.AQ2— Please define PGE in abstract.AQ3— Please define IPGE in abstract.AQ4— Please define ADSL in abstract.AQ5— Please define HSE in abstract.AQ6— Please review this range, which includes 94104. Your next sentence includes 94104 as beingtaken from other flows.AQ7— Inserted en dash, please verify that this is a range.AQ8— Inserted en dash, please verify that this is a range.AQ9— Please define CRPG.AQ10— Please provide the year for this reference citation.AQ11— Please define first occurrence of IPGE after abstract.AQ12— Please verify: removed “s” from “lava” for verb agreement, okay?AQ13— Please define LREE.