downloaded - WCS Fiji - Wildlife Conservation Society
downloaded - WCS Fiji - Wildlife Conservation Society
downloaded - WCS Fiji - Wildlife Conservation Society
- No tags were found...

You also want an ePaper? Increase the reach of your titles
YUMPU automatically turns print PDFs into web optimized ePapers that Google loves.
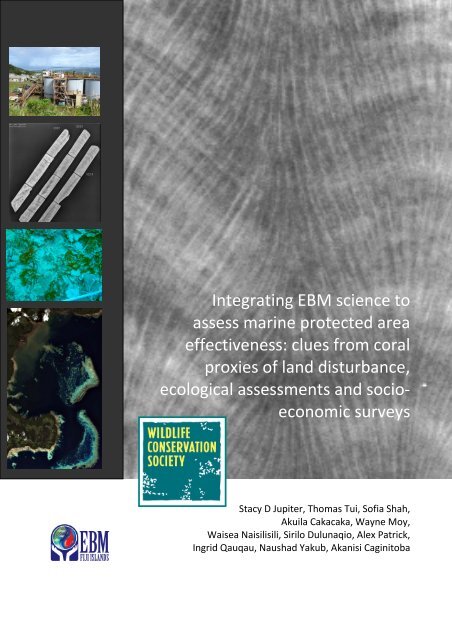
Integrating EBM science toassess marine protected areaeffectiveness: clues from coralproxies of land disturbance,ecological assessments and socioeconomicsurveysStacy D Jupiter, Thomas Tui, Sofia Shah,Akuila Cakacaka, Wayne Moy,Waisea Naisilisili, Sirilo Dulunaqio, Alex Patrick,Ingrid Qauqau, Naushad Yakub, Akanisi Caginitoba
This study was supported by grants from the David and Lucile Packard Foundation (2007-31847) and the Gordon and Betty Moore Foundation (540.01).© 2010 <strong>Wildlife</strong> <strong>Conservation</strong> <strong>Society</strong>This document to be cited as:Jupiter SD, Tui T, Shah S, Cakacaka A, Moy W, Naisilisili W, Dulunaqio S, Patrick A, Qauqau I,Yakub N, Caginitoba A (2010) Integrating EBM science to assess marine protected areaeffectiveness: clues from coral proxies of land disturbance, ecological assessments andsocioeconomic surveys. <strong>Wildlife</strong> <strong>Conservation</strong> <strong>Society</strong>-<strong>Fiji</strong> Technical Report no. 02/10. Suva,<strong>Fiji</strong>, 24 pp.Page | 1
Executive SummaryResearch for this study was carried out under a two-year project to support theimplementation of Ecosystem-Based Management (EBM) at two catchment-to-reef sites onVanua Levu, <strong>Fiji</strong>, during which period a pilot study was initiated to evaluate whether longlivedcoral records could be used to detect land-based disturbance to <strong>Fiji</strong>an reefs. Traceelement ratios of barium (Ba) to calcium (Ca) were measured at high (~weekly) resolutionwith laser ablation inductively coupled mass spectrometry (LA-ICP-MS) in cores collectedfrom inshore and offshore Porites colonies. The Ba/Ca records from the inshore colonycollected approximately 5 km south-east of the Yanawai River mouth and 3 km due west ofthe Nasue marine protected area (MPA) indicate heavy Ba/Ca enrichment between 1996-1998, which may be related to high levels of sediment delivery to the nearshore while theMt. Kasi gold mine was operational. Ba/Ca values from the offshore coral collected near theNamena MPA show consistently low baseline values during the same period and over theentire record. Underwater visual census (UVC) surveys of fish biomass, abundance andspecies richness from 2007 show significantly lower values inside the Nasue MPA than atadjacent sites open to fishing, while the opposite patterns are generally true for theNamena MPA. By synthesizing interdisciplinary data from multiple sources, deductive logiccan be used to decipher major drivers of differences in effectiveness of the two districtMPAs. Benthic survey data from Nasue closed and open areas showed no significantdifferences in specific factors which may indicate recent disturbance (e.g. macroalgal cover,rubble) and/or play strong roles in structuring reef fish communities (e.g. live coral cover,presence of fast growing branching corals, reef complexity). Therefore, we conclude that thehistorical disturbance from the Yanawai River either had minimal effect on benthiccommunities in Nasue MPA in sites surveyed or they have subsequently recovered andshould therefore be able to support healthy reef fish populations if not subject to othertypes of disturbance. Socioeconomic surveys indicate that Kubulau residents areoccasionally witness to infringements of MPA rules and the majority offenders come fromoutside the district. However, at the same time, Kubulau residents themselves haveindicated catch locations within the Nasue (but not Namena) district MPA, suggesting thataccidental or deliberate poaching occurs regularly, likely due to lack of awareness of MPArules and boundaries and inability to see the Nasue MPA from the shore. Recommendationsto improve the effectiveness of the MPA are discussed.Results from this study were presented locally in <strong>Fiji</strong> at the inaugural <strong>Fiji</strong> Islands<strong>Conservation</strong> Science Forum in August 2009 and overseas at the International Marine<strong>Conservation</strong> Congress in Fairfax, VA, in May 2009. The scientific findings have beenpresented to residents of Kubulau to provide background information for development ofthe Kubulau Ecosystem-Based Management (EBM) plan.Page | 2
Table of ContentsExecutive Summary .................................................................................................................... 2Table of Contents ....................................................................................................................... 3Introduction ............................................................................................................................... 4Methods ..................................................................................................................................... 5Study region ........................................................................................................................... 5Ecological surveys .................................................................................................................. 9Reef fish composition ........................................................................................................ 9Benthic substrate composition ........................................................................................ 10Statistical analyses ............................................................................................................... 10Socio-economic surveys ....................................................................................................... 10Results ...................................................................................................................................... 11Coral Ba/Ca .......................................................................................................................... 11Fish biomass, abundance and species richness ................................................................... 11Variation in benthic structure .............................................................................................. 12Socioeconomic survey results .............................................................................................. 14Discussion................................................................................................................................. 16Conclusions and Recommendations ........................................................................................ 18Acknowledgments.................................................................................................................... 20References ............................................................................................................................... 21Page | 3
IntroductionHuman activity on land has increased global sediment loss by an order of magnitude overnatural weathering rates due to human population growth driving land clearing foragriculture and development (Pimentel et al. 1993; Wilkinson 2005). Urbanization andmining have also contributed to localised increases in sedimentation to the nearshore(Fallon et al. 2002). While sediment supply and turbidity are limiting factors in coral reefdevelopment (Hopley 1995; Smithers et al. 2006), nearshore reefs are adapted to oftenhighly turbid conditions and, when distant from human disturbance, can be highly diverse(Veron 1995; Mallela et al. 2004; Fabricius et al. 2005). However, nearshore reefs adjacentto highly modified catchments or those with large point-sources of terrestrial pollution maybe particularly vulnerable to ecological shifts if chronically degraded water quality reducesresilience to disturbance (McCook 1999). If these disturbances take place within theboundaries of marine protected areas (MPAs), the accompanying loss of resilience maygreatly affect the ability of management to yield fisheries benefits and biodiversityconservation.Field studies from recent decades suggest that coral assemblages from sites withinproximity to land based pollution are shifting in response to both point (Smith et al. 1981)and non-point sources (Lapointe 1997; van Woesik et al. 1999). Along natural andanthropogenically enhanced water quality gradients, scleractinian corals living closest toterrestrial and fluvial sources are generally characterized by: (1) high rates of partialmortality; (2) low rates of recruitment; (3) reduced skeletal density; (4) decreased tissuethickness; and (5) reduced depth distributions (Kleypas 1996; Barnes and Lough 1999;Nugues and Roberts 2003; Fabricius 2005). These changes in coral communities are oftenassociated with: increased algal cover (Fabricius et al. 2005); increased abundance and ratesof bioerosion by macroborers (Tribollet and Golubic 2005); and reduced octocoralabundance and diversity, particularly from zoothanthellate clades (Fabricius and McCorry2006). There has also been evidence of reduced fish diversity and biomass related topredictors of terrestrial runoff (e.g. distance from land, visibility, % of mud in sediments),though some fish species, such as Pleotropomus leopardus, Scarus ghobban, and Siganuslineatus may be naturally more closely associated with coastal reefs (Letourner et al. 1998).In the absence of long-term water quality monitoring data to assess changes to sedimentdelivery over time, the ratios of certain trace elements to calcium (Ca) within long-livedcoral skeletons are good natural tracers of fluvial or pollutant inputs to seawater. Barium(Ba) is one such tracer as ~50-75% of the total dissolved Ba load in nearshore waters issourced from river discharge (Hanor and Chan 1977; Carroll et al. 1993). Ba is attached tofine-grained clay particles in river runoff but desorbs in low salinity estuarine regions (Coffeyet al. 1997). The dissolved Ba moves offshore within the flood plume where it becomesincorporated into coral skeletons in close proportion to its local abundance (Livingston andThompson 1971; McCulloch et al. 2003). The position of a reef across the continental shelf,its relative proximity to highly modified terrestrial catchments and the tidal range will affectexposure to terrestrial discharge and therefore the recurrence interval of major disturbance.Long-term records of coral Ba/Ca concentrations can be used to identify historic periods ofterrestrial disturbance which may have influenced present-day ecological conditions onnearshore reefs (Jupiter et al. 2008).Page | 4
committee who formally declared two additional district-wide, no take areas (Nasue,Namuri), as well as recognized 17 smaller, village-managed closures (Figure 2). Thebackreefs of the Nasue MPA (8.1 km 2 ) are located approximately 5 km southeast of themouth of the Yanawai River, which drains the land surrounding the Mt. Kasi gold mine(Figure 3).Figure 1. Kubulau District and traditional fisheries management area (qoliqoli) located within BuaProvince on Vanua Levu, <strong>Fiji</strong>.LEFT: Figure 2. District MPAs (red outline) and community tabu areas (orange outline) of Kubulauqoliqoli. RIGHT: Figure 3. Photos from the Mt. Kasi gold mine. (photo credits top and middle: A.Jenkins; bottom: E. Tokaduadua)Page | 6
South-western Vanua Levu, around the city of Savusavu, receives a mean annual rainfall of2159 mm (<strong>Fiji</strong> Meteorological Service data, 1977-2006, station V69: 83103), with seasonalpeaks during the summer monsoon between November and April (Figure 4). Watertemperatures vary between 24.7 and 30.2 over a gridded 1⁰ cell between 16.5 ⁰S and 179.5⁰E (Figure 5). There were 22 tropical cyclones within the vicinity of Vanua Levu between1977 and 2007 (Australian Bureau of Meteorology data). Two major incidences of coralbleaching were reported from <strong>Fiji</strong> reefs in 2000 and 2002, though substantial recovery topre-bleaching coral cover was reported within 5 years (Lovell and Sykes 2008).Savusavu Monthly Rainfall 1977-2007Rainfall (mm)70060050040030020010001975 1980 1985 1990 1995 2000 2005 2010Figure 4. Monthly rainfall from Savusavu airport between 1977-2007 with 10 point running mean,displaying no prolonged wet or dry periods during the record.YearIGOSS weekly SST3230Degrees C28262422201980 1985 1990 1995 2000 2005 2010YearFigure 5. Weekly sea surface temperature (SST) data from 1982-2008 from 16.5 ⁰S, 179.5 ⁰E,<strong>downloaded</strong> from http://www.iridl.ldeo.columbia.edu/SOURCES/.IGOSS/.nmc/).Page | 7
Coral core collection and analysisIn January 2007, cores were drilled from massive Porites coral colonies on backreefs withinthe Kubulau traditional fishing grounds. One colony was located approximately 5 km southeastof the Yanawai River mouth and 3 km due west of the Nasue MPA, while a comparisoncore from an offshore location was collected approximately 3 km northwest of the NamenaMPA within the backreef lagoon (Figure 6). All cores were collected using SCUBA using apneumatic, hand-held underwater drill attached to a stainless steel coring barrel.Yanawai R.S3S3Nasue MPAFigure 6. Locations of Poritescoral cores collected within thereefs of Kubulau qoliqoli. Thelocation of the Mt. Kasi mine isindicated with a yellow triangledirectly to the north of theYanawai River.NamenaMPAS2S1Cores were slabbed (~7 mm thick) andslices from three cores (S 2 S 1 ; S 3 S 1 ; S 3 S 3 )were selected for detailed analysis oftrace element concentrations. Slabswere cut to 25 mm x 90 mm piecesand taken to the Australian NationalUniversity where they were cleanedultrasonically in 18 MΩ water, and X-radiographed to visualize annualdensity bands to aid sampling forisotope analysis and chronologyassignment (Figure 7, Table 1). Coralpieces were analysed for traceelement concentrations of 43 Ca, 84 Sr, 138 Ba and 238 U by laser ablation inductively coupledplasma mass spectrometry (LA-ICP-MS) with an ArF excimer attached to a Varian 820 ICP-MS using the exact protocol of Jupiter et al. (2008). All isotopic concentrations werenormalized to 43 Ca (0.13% Ca) to account for variations in coral surface architecture anddensity. Preliminary assessment of data from the S 3 S 1 coral indicate high levels of surfacecontamination that we were unable to remove with standard cleaning techniques, thereforedata from this coral were not analysed further. Data from the remaining two corals weresmoothed using a 10-point running median to remove outliers, followed by a 10-point meanto reduce data volume. Time series of the corals were calibrated by matching Sr/Camaximum values to minimum values from IGOSS 1º C weekly SST records (Beck et al. 1992).For data before 1981, the average week of SST winter minima was used. Data from tissuelayers in the top piece of each core were excluded it contained residual particulate organicmaterial which is typically enriched in Ba (Sinclair 1999).Page | 8
Table 1. Porites coral characteristics, including: date and depth collected, location, length analysedby LA-ICP-MS, and mean growth rate (± standard error)Coral Date Lat Lon Depth Length Growth rate (mm)(m)(cm)S 3 S 3 16 Jan 2007 16˚ 51.566 179˚ 04.513 5 27.2 8.8 ± 0.47S 2 S 1 15 Jan 2007 17˚ 03.176 179˚ 03.983 1.5 23.2 10.3 ± 0.80Figure 7. Example of chronology construction from coral core collected in the south-central GreatBarrier Reef off Scawfell Island. Dashed lines show alignment between: winter maxima of ~weeklySr/Ca (top); seasonal density bands (middle); and winter SST minima (bottom). The same processwas used for constructing chronologies from the <strong>Fiji</strong> corals. (Figure used with permission from(Jupiter 2006)).Ecological surveysReef fish compositionIn January-February 2007, underwater visual census (UVC) of fish were carried out at sitesinside and outside the district-wide MPAs to measure fish abundance and size of thefollowing families: Acanthuridae, Balistidae, Carangidae, Carcharhinidae, Chaetodontidae,Haemulidae, Kyphosidae, Labridae, Lethirinidae, Lutjanidae, Mullidae, Nemipteridae,Pomacanthidae, Scaridae, Scombridae, Serranidae (groupers only), Siganidae, and Zanclidae.Eight sites total (2 forereef and 2 backreef inside and outside) were monitored in andadjacent to the Namena MPA, while six sites total (1 forereef and 2 backreef inside andoutside) only were monitored in and adjacent to the Nasue MPA due to weatherconstraints. Measurements of fish size (total length) and abundance were scored along 5 mx 50 m belt transects at deep (12 -15 m) and shallow depths (5 m – 8 m) at most forereefsites, and at reef tops (0.5 – 2 m) and shallow depths at backreefs sites. Each sighted fish >2 cm was classified to species level within size categories (2-5, 6-10, 11-15, 16-20, 21-25, 26-Page | 9
30, 31-35, 36-40 cm). The length of fishes >40 cm was recorded to the nearest cm toimprove estimates of biomass. Biomass was calculated from size class estimates of length(L T ) and existing published values from Fishbase (Froese and Pauly 2009) used in thestandard weight-length expression M = aL T b , with a and b values preferentially selected fromsites closest to <strong>Fiji</strong> (e.g. New Caledonia). If no length-weight (L-W) conversion factor waspresent for the species, the factors for a species of similar morphology in the same genuswas used (Jennings & Polunin 1996). If a suitable similar species could not be determined,averages for the genera were used. As most of the New Caledonia fishes were measured tofork length (FL), a length-length (L-L) conversion factor was obtained from Fishbase wherepossible to convert from total length (TL) to FL before biomass estimation.Benthic substrate compositionBenthic substrate cover was recorded at 0.5 m interval point intercepts along the same 50 mtransects in 2007 for the following life form classes that were classified into 7 reef strata:unconsolidated substrate (US: rubble, sand, silt); reef matrix (RM: dead coral, reefpavement, crustose coralline algae, coralline algae); macroalgae (MA: all fleshy macroalgae> 2 cm, including cyanobacteria); live hard coral (LC: including Millepora and Tubipora);other soft substrate (OT: including soft corals, sponges, ascidians, anemones); turf algae (TA:≤ 2 cm height on reef pavement)p; and upright coralline algae (UC: e.g. Halimeda spp). Livehard coral was identified to the genus level. In April-May 2009, forereef only shallow anddeep sites were surveyed inside and adjacent to the district MPAs for the same benthiccover classes and in addition, each 0.25 m 2 surrounding the point was given a complexityscore (1 = minimal relief; 2 = some vertical (e.g. boulder corals); 3 = high vertical relief (e.g.branching corals, reef crevices)).Statistical analysesTotal fish and primary target fish abundance, biomass and species number were pooledacross depth for each site. Because the data failed to meet assumptions of normality, nonparametricMann-Whitney U tests were used in Statistica version 7 software to assessdifferences in fish abundance and biomass related to management of the Nasue andNamena MPAs. A principal components analysis (PCA) was performed in Primer version 6software on arcsine-square root transformed benthic strata data from 2007 to evaluatedifferences within and among sites inside and outside the district MPAs. Mann-Whitney Utests were additionally used to assess differences in specific variables (e.g. live coral cover,macroalgae) between the Nasue and Namena regions. Comparisons of 2009 benthic datawere used to assess differences in reef complexity and cover of rubble, macroalgae, livecoral and fast growing Acropora and Pocillopora species to assess whether historical landbaseddisturbance has influenced current benthic community composition. Where datawere normally distributed (macroalgae; Acropora plus Pocilopora cover), t-tests were used:otherwise, non-parametric Mann-Whitney U tests were employed for (live hard coral;rubble; complexity; standard deviation of complexity).Socio-economic surveysMeasures of the levels of internal and external poaching in Kubulau qoliqoli were gauged intwo ways. (1) In November-December 2008, 51 households were surveyed across 8 villagesin Kubulau. Respondents were asked how often they encounter people fishing in breach ofMPA rules (regularly, sometimes, rarely, never), and, if they do witness offences, who arePage | 10
the offenders. A nonparametric Friedman ANOVA was used to assess differences inreponses across villages. (2) Within the four villages (Raviravi, Navatu, Kiobo, Nakorovou)participating in weekly catch per unit effort monitoring between May 2008 and February2009, fishers were asked to draw on a map the locations where they caught fish: maps didnot include the MPA boundaries.ResultsCoral Ba/CaMean coral Ba/Ca from the offshore coral S 2 S 1 between winter 1986 and winter 2006 was4.06 ± 0.48 μmol Ba/Ca (± 1 standard deviation), with minor seasonal variations. The overallmean coral Ba/Ca from the coral drilled close to Nasue MPA between 1977 and 2006 wascomparable (3.96 ± 1.45 μmol Ba/Ca), with greater variability in concentrations throughoutthe record. From winter 1976 to winter 1996, the coral Ba/Ca concentration was low (3.13 ±0.87 μmol Ba/Ca), then became rapidly enriched in Ba (6.12 ± 2.72 μmol Ba/Ca) andremained elevated until the end of 1998, after which higher background Ba/Caconcentrations (4.50 ± 0.84 μmol Ba/Ca) were maintained until 2006 (Figure 8).Figure 8. Coral Ba/Ca from the inshore core (S 3 S 3: blue) collected near Nasue MPA and the offshorecore (S 2 S 1 : purple) collected near Namena MPA.Fish biomass, abundance and species richnessTotal fish biomass (kg/ha) and abundance (#/ha) were significantly less (Mann-Whitney Utest, p < 0.01 and p < 0.001 respectively) inside the Nasue MPA than at control sites directlyto the south and further away from the Yanawai River mouth (Figure 9a,b; Tables 2). Furtheroffshore, neither total fish biomass nor total fish abundance was significantly greater insidethe Namena MPA than outside. When only forereef sites were considered, total fishbiomass and abundance were significantly greater inside the Namena MPA than outside (p
Table 2. Differences (mean ± standard error) between closed and open areas in Nasue and Namenadistrict MPAs in (a) total fish biomass (kg/ha); (b) total fish abundance (#/ha); (c) forereef fishbiomass (kg/ha); and (d) forereef fish abundance (#/ha). Critical z-adjusted values and p-values arereported from Mann-Whitney U tests. Significant p-values are indicated in bold.MPA Closed Open Z-adj p-value(a) Biomass (all sites; kg/ha)Nasue 400.0 ± 149.9 524.0 ± 421.5 -2.901 0.004Namena 976.0 ± 677.3 345.2 ± 70.9 0.433 0.665(b) Abundance (all sites; #/ha)Nasue 1643 ± 137 3243 ± 438 -3.569 < 0.001Namena 4444 ± 822 1711 ± 176 1.167 0.106(c) Biomass (forereef only sites; kg/ha)Nasue 831.4 ± 321.8 510.1 ± 177.5 0.726 0.468Namena 1647.0 ± 587.1 385.4 ± 103.6 2.624 0.009(d) Abundance (forereef only sites; #/ha)Nasue 1739 ± 223 2947 ± 346 -2.552 0.011Namena 6064 ± 1431 1758 ± 249 2.530 0.011aTotal Fish BiomassbTotal Fish Abundancekg / ha180016001400120010008006004002000# / ha6000500040003000200010000NamenaNasueNamenaNasuecTotal Fish Biomass Forereef OnlydTotal Fish Abundance Forereef Onlykg / ha25002000150010005000NamenaNasue# / ha800070006000500040003000200010000NamenaNasueFigure 9. Total reef fish (a) biomass (kg/ha) and (b) abundance (#/ha) inside (grey) and outside(white) district MPAs. (c-d) Total reef fish (a) biomass (kg/ha) and (b) abundance (#/ha) inside (grey)and outside (white) district MPAs for forereef sites only. Error bars are ± 1 standard error.Variation in benthic structureFrom the 2007 data, although live coral cover was significantly greater in and aroundNamena compared with the reefs around Nasue (Mann Whitney U-test; p = 0.01; Table 3),ordination of the transformed, mean percent cover of each benthic strata of each sitePage | 12
Pocillopora corals that tend to recovery quickly from disturbance, but these abundanceswere not significantly greater and the coverage of macroalgae was fairly constant (Table 4).In addition, measures of reef complexity were statistically similar both inside and outsidethe Nasue MPAs (Table 4).Table 3. Differences (mean ± standard error) in 2007 benthic cover per transect between Nasue andNamena monitoring sites, pooled across management (closed plus open). Critical z-adjusted valuesand p-values are reported from Mann-Whitney U tests. Significant p-values are indicated in bold.Benthic Strata Nasue Namena Z-adj p-valueLive hard coral 25.5 ± 2.3 32.2 ± 2.2 -2.535 0.011Macroalgae 2.4 ± 1.3 0.5 ± 0.2 1.781 0.075Reef matrix 17.5 ± 2.6 13.7 ± 1.9 0.961 0.337Unconsolidated substrate 43.9 ± 2.6 34.6 ± 3.2 3.054 0.002Other 8.7 ± 0.9 17.8 ± 1.9 -2.488 0.013Turf algae 12.3 ± 2.1 10.4 ± 1.6 -0.351 0.726Upright coralline algae 0.8 ± 0.4 0.5 ± 0.2 0.057 0.955Table 4. Differences (mean ± standard error) in benthic cover categories per transect betweenclosed and open areas in the Nasue MPA region. T-values(*) and p-values are reported for t-tests fornormally distributed data. Critical z-adjusted(†) values and p-values are reported from Mann-Whitney U tests for non-normal data. Significant p-values are indicated in bold.Benthic Category Closed Open Z-adj / t-value p-valueNasue MPALive hard coral 47.8 ± 2.5 49.6 ± 1.7 0.915* 0.360Macroalgae 2.1 ± 0.7 2.4 ± 0.5 -0.142† 0.887Rubble 41.5 ± 2.9 37.2 ± 2.1 -1.062* 0.292Acropora and Pocillopora 16.7 ± 2.6 15.5 ± 2.6 -0.942† 0.349Complexity 1.97 ± 0.04 1.98 ± 0.04 0.707* 0.479STDEV complexity 0.65 ± 0.03 0.61 ± 0.02 -1.905* 0.057Socioeconomic survey resultsThere were no significant differences by village in response to how frequently therespondent observed infringements of MPA rules in the Kubulau qoliqoli (Friedman’sANOVA, χ 2 4,7 = 5.833, p = 0.559; Figure 12), with most respondents reporting that theysometimes or rarely witnessed offences. Of the 33 respondents who answered the questionof who was committing offences, 75.8% (n = 25) replied that they were non-resource rightsowners coming from outside the Kubulau qoliqoli. Only 9.1% (n = 3) reported that theoffenders came exclusively from within Kubulau, however notably, only 2 of the 8 residentsof Navatu village responded to this question: Navatu residents have been repeatedly caughtfishing within the Namena MPA.Page | 14
Perceptions on Infringement FrequencyEncounter frequencyRegular Never43210Kilaka Nakorovou Nadivakarua Waisa Natokalau Kiobo Navatu NamalataVillageFigure 12. Responses by village to the question “how often do you encounter people fishing inbreach of MPA rules (1 = regularly; 2 = sometimes; 3 = rarely; 4 = never).Synthesis of catch locations from CPUE surveys showed multiple instances of fishing activityfrom within MPA boundaries by local Kubulau fishers, in particular within: Nasue districtMPA; Namuri district MPA; Yamotu ni Oqo and Bagata (Kilaka’s village MPAs); and RewaBota and Cakaulekaleka (Nakorovou’s village MPAs; Figure 13).Figure 13.Locations of catchrecorded by fishersfrom four villages(Raviravi: red;Navatu: purple;Kiobo: blue;Nakorovou: green)during catch perunit effort surveysbetween May 2008and February 2009.Page | 15
DiscussionCurrent day coral reef community composition is a product both of present-day factors andhistorical disturbance (Connell et al. 1997; Hughes and Connell 1999; Jupiter et al. 2008).Predation, competition and recruitment are among some of the major ecological processesthat determine species composition and diversity on reefs. The rates and dynamics of theseprocesses are influenced by natural and man-made disturbances (e.g. tropical cyclones,disease, floods, coral bleaching, overfishing) that cause differential mortality, open space forrecruitment, and shift the balance between trophic levels and functional groups (Hughes1989; Connell et al. 2004). Along inshore to offshore gradients, natural differences inbenthic cover, coral growth rates and species diversity may exist subject to the frequencywith which inshore reefs are exposed to land-based runoff.In undisturbed systems, nearshore reefs can be highly diverse: on the Great Barrier Reef(GBR), at least 97% of hard coral genera (DeVantier et al. 2006), 80% of octocoral genera(Fabricius and Alderslade 2001), and 85% of the fleshy macroalgae (McCook et al. 2000)occur on nearshore reefs adjacent to continental land. Coral cover can be high: across sitessurveyed on the GBR in 2004 by the Australian Institute of Marine Science (AIMS), nearshorereefs averaged 33% live coral cover, with >50% cover at nearly a quarter of the locations(Sweatman et al. 2007). Nearshore reefs may also have higher rates of disturbance: inaddition to the main categories of disturbance that affect outer reefs (e.g. bleaching,cyclone damage, predation, overfishing), nearshore reefs are also subject to both acute andchronic disturbance from terrestrial discharge.Acute pulses of freshwater discharge can cause mass mortality on reefs (Jokiel et al. 1993;van Woesik et al. 1995), while chronically elevated turbidity and nutrients may decreasereef resilience through reduced survivorship of coral recruits (Fabricius et al. 2003).Sedimentation in runoff from an open-cut gold mines (e.g. Misima Island, Papua NewGuinea) can cause coral mortality through smothering, reduce tissue thickness and may berecorded as elevations in trace element to Ca ratios in Porites skeletal records (Barnes andLough 1999; Fallon et al. 2002). Peaks or prolongued enrichment in Porites coral skeletalBa/Ca can coincide with episodic release of sediments delivered to the nearshore and cantherefore be used to assess recurrence frequency of significant land-based disturbance tocoral reefs (McCulloch et al. 2003; Fleitmann et al. 2007; Jupiter et al. 2008).Porites coral colonies distant from runoff and/or upwelling sources tend to have lowbaseline Ba/Ca with variability within the record related to differences in Ba incorporationinto separate skeletal elements and seasonal availability of Ba (Allison 1996; Sinclair 1999).Results from the Kubulau Porites coral Ba/Ca records indicate that, as expected, the offshoreareas around the Namena MPA are not influenced by terrestrial runoff from the mainland.The mean Ba/Ca concentration of the coral record collected near Namena MPA was similarto values recorded from inner-midshelf Porites colonies from the GBR at sites largelyunaffected by river runoff (Jupiter et al. 2008). Prior to 1996, mean coral Ba/Ca values inthe inshore Kubulau coral collected near Nasue MPA were also consistently low, indicatinglittle terrestrial influence and sediment delivery to the nearshore from the Yanawai River.Sediment delivery from Yanawai River flood discharge was likely only substantially elevatedover typically background levels during the period when the Mt. Kasi mine was operational(between 1996 and 1998) and immediately succeeding closure of the mine. The inshorePage | 16
coral Ba/Ca record does not indicate sharp peaks related to specific rainfall events, butrather prolonged enrichment of Ba/Ca. This has been observed previously in inshore coralswhere resuspension from strong tidal currents and release of Ba from sedimentsaccumulated in the mangroves may have contributed to increases in coral Ba/Ca baselinevalues (Jupiter et al. 2008; Prouty et al. in prep). Based on these results, the relevantquestion to ask is, therefore: Is current day reef composition at nearshore reefs adjacent tothe Yanawai River, including the Nasue MPA, shaped by the legacy of this disturbance or hasthere been substantial reef recovery?Upon examining differences in reef fish communities between the Nasue and Namenaregion, and inside and adjacent to the Nasue MPA, it is evident that there must be certaindrivers that have prevented recovery in reef fish abundance, biomass and species richnesswithin the Nasue MPA. One obvious factor is likely longevity of protection: studies haveshown that recovery of large-bodied food fish may take upwards of a decade (Jennings et al.1998; Russ and Alcala 1998). As the Namena MPA has been protected for over 10 years andthe Nasue MPA has only been established since 2005, the duration of closure is likely to be astrong factor explaining the difference in relative performance between MPAs in terms offisheries effectiveness (Jupiter et al. 2010). However, it is particularly striking that the totalfish abundance and biomass was greater at sites outside the Nasue MPA, which are fartheraway from the Yanawai River mouth. Coupled with results from the coral trace elementdata, one immediate assumption might be that the documented terrestrial disturbanceexperienced in the late 1990s on reefs proximate to the Yanawai River may have had lastingeffects on benthic condition.Disturbance that alters the composition and complexity of benthic habitat can have strongimmediate and lagged effects on reef fish assemblages (Graham et al. 2006; Graham et al.2007). On <strong>Fiji</strong>an reefs, reductions in abundance of coral-feeding fish and small-bodieddamselfish have been associated with declines in branching Acropora coral and coralassociatedhabitat complexity, respectively (Wilson et al. 2008). Furthermore, these habitatassociatedreductions in availability of prey can be a more important driver of piscivoreabundance than fishing pressure (Wilson et al. 2008). Yet, there was no significantdifference between sites within (closer to runoff) or adjacent to the Nasue MPA in terms ofcover of any of the benthic strata from the 2007 data. In addition, the 2009 forereef surveysfailed to find any significant difference between Nasue closed and open areas in specificfactors which may indicate recent disturbance (e.g. macroalgal cover, rubble) and/or playstrong roles in structuring reef fish communities (e.g. live coral cover, presence of fastgrowing branching corals, reef complexity). Thus, if the benthos within Nasue MPA wasaffected by the runoff in 1998 which resulted in noted fish and coral kills inshore, thebenthic community and reef structure has recovered substantially and should be able tosupport healthy reef fish communities. Although the coral cover around the Nasue regionsites (pooled closed and open) was significantly lower and unconsolidated substrate wassignificantly higher than the Namena region, these differences are expected in naturalinshore to offshore gradient, and based on the benthic composition and complexity dataalone, the Nasue sites should be able to support healthy reef fish populations.If the sites surveyed within the Nasue MPA were affected by large-scale disturbance fromrunoff in the late 1990s, part of the reason why the benthic communities may have beenPage | 17
able to recover quickly is likely due to: (1) the cessation of mining operations whichremoved the potentially chronic sedimentation stress; and (2) the lack of large-scaleagricultural activity in the region. Unlike the Macuata region of Vanua Levu, where a highproportion of land on lower slopes has been converted to sugarcane, only 1.4% of KubulauDistrict lands are under cultivation for agriculture and little if any nitrogen-based fertilizer isapplied. Whereas in nutrient-rich waters, even low levels of sediment tend to formbiologically mediated “marine snow” that can smother and kill coral recruits (Wolanski andGibbs 1995; Fabricius et al. 2003), in waters with high turbidity but low nutrients, corals mayadapt by altering their morphology or sloughing off particles through mucus production ortissue extension (Rogers 1990; Stafford-Smith and Ormond 1992).Thus, if the benthic habitat of Nasue MPA has either been resistant to sediment impact orrecovered quickly and is similar to areas supporting healthier reef fish populations, there arelikely other explanations for the low reef fish biomass and abundance within the MPA. Onelikely contributing factor is overfishing of Nasue MPA due to non-compliance of communityrules. Signs of overfishing often included reduced biomass and abundance of targetedspecies (Jennings et al. 1999; Pet Soede et al. 2001). Because direct measures of illegalfishing within MPAs were unavailable, the targeted socioeconomic surveys providedvaluable information on fishing pressure, both from the relative amount of infractions bylocal residents (Cinner et al. 2005) and perceived difference in amount of offences by localresidents versus non-resource rights owners from outside of Kubulau District. Although the2008 household surveys from Kubulau represented a smaller than desired sample size(because many heads of household were away earning income harvesting sugarcane innorthern Vanua Levu), they indicated a strong perception that the large majority of noncompliancewith MPA rules comes from poaching by external fishers. In support of thesedata, fishers from the adjacent Wailevu District to the north have been caught repeatedlyinside Nasue MPA. Additionally, local fishers themselves have indicated multiple catchlocations within the Nasue but not Namena MPA (Figure 13). The high incidence of bothlocal and external poaching is most likely due to lack of awareness of MPA boundaries andrules and because the fishers cannot be seen from any of the Kubulau villages. In thetropical Western Pacific where communities are largely responsible for self-enforcement,the visibility of MPAs is one of the most important determinants of its success (Aswani andHamilton 2004).Conclusions and RecommendationsAssessing ecological change and the drivers of change on coral reefs is particularly difficultdue to the complex nature of reef systems and unpredictable responses to multipledisturbances (Fabricius and De'ath 2004). By synthesizing interdisciplinary data frommultiple sources, deductive logic can be used to decipher the most likely major drivers ofeffectiveness of MPAs. For example, had we only investigated coral core records and fishcommunity data, we might have incorrectly assumed that mine runoff had lasting effects onbenthic structure that continues to affect fish recruitment and habitable space.Furthermore, without conducting socioeconomic surveys, we would have only been able toguess at the extent of poaching: in reality, non-compliance is likely to be much morefrequent than reported due to a reticence to admit to personal infractions. Future workshould evaluate the percentage of fish from targeted species below minimum reproductivesize across all study sites (e.g. Fabricius et al. 2005) in order to validate differences inPage | 18
ecovery from fishing pressure between Nasue and Namena MPAs and differences in activefishing inside and adjacent to Nasue MPAs. Surveys could also be performed at higherreplication, sampling more environmental variables, to rule out other factors which mayhave contributed to the differences in fish assemblages inside and outside the Nasue MPA.Some recommendations to improve the effectiveness of Nasue MPA include:• Raise awareness of MPA rules and boundaries among residents of Kubulau District.Following the endorsement and adoption of the Kubulau EBM plan (<strong>WCS</strong> 2009), rulesand regulations were explained in each village and management posters, includingmaps of the current MPA and community tabu boundaries, were posted in everycommunity hall. Follow-up activities are needed to ensure that all residents areaware of the rules and understand the consequences of non-compliance;• Raise awareness of enforcement protocol and options for legal punishment ofoffenders. Protocols for enforcement of national laws and community managementrules are detailed explicitly in the Kubulau EBM plan (<strong>WCS</strong> 2009). Follow-throughdepends largely on the pro-activity of the Kubulau Resource ManagementCommittee (KRMC) and its subcommittee focused on resource management. Tostrengthen awareness of options for enforcement, the KRMC participated in a roleplayexercise where four scenarios were presented and members were asked toevaluate whether management rules had been broken and, if so, what were theavailable options for punishment. However, at the same managementimplementation workshop, the KRMC ranked as high priority the need to obtainmore skills for fisheries monitoring and infringement reporting, which will requireongoing training.• Raise awareness of MPA rules and boundaries among resource-rights owners living inadjacent districts. At an intensive management planning workshop in February 2009,Kubulau leaders and participants suggested that much of the external poaching isbeing done by people originally from Kubulau who still retain traditional fishingrights within the qoliqoli but have since moved to other districts and therefore havenot been educated about the recent management initiatives. KRMC resolved to: (1)visit neighboring districts to raise awareness of management rules for the qoliqoliand MPAs; and (2) produce and distribute fliers detailing MPA boundaries and rulesto be posted at provincial offices, police stations and the regional fisheriesdepartment office in Savusavu.• Increase frequency and efficiency of enforcement patrols. Because patrols requirefuel, which may be costly, the KRMC has committed to developing and submittinggrant proposals with conservation partners to acquire marine radios, which will helpto identify the location of offenders, and fuel to operate the patrol boat. The KRMCwill require assistance with grant proposal writing and development of a rotationalschedule for patrols.• Shift the boundary of the Nasue MPA away from the border with Wailevu. At theFebruary 2009 management planning meeting, a suggestion was proposed to shiftPage | 19
the boundaries of Nasue MPA further south so that it would be at least partiallyvisible from shore. The residents of Kubulau seemed initially resistant to the ideabecause they felt it might encourage more poachers to cross the border fromWailevu District if the area is declared open again to fishing. However, given that reconfigurationoptions for the MPA network will be presented back to the communitywhich optimize fisheries benefits while minimizing costs to fishers (Adams et al.2010), it may be worthwhile to broach the topic again given the degree of poachingin the area.AcknowledgmentsThe authors are grateful to the David and Lucile Packard Foundation and the Gordon andBetty Moore Foundation for supporting this work through phase two of the Ecosystem-Based Management project in <strong>Fiji</strong>. We thank Kathy Walls and Ed Lovell for collecting thePorites corals, and Ed in particular for providing mentorship to S. Shah during initial phasesof coral core preparation and analysis. We are grateful to Malcolm McCulloch for providinglaboratory space and time at the Research School of Earth Sciences at the AustralianNational University to enable high resolution trace element analysis of the coral records.Fraser Hartley and Daniel Egli (of <strong>WCS</strong>) provided invaluable assistance with collation andpreparation of UVC fish and benthic data, while Aaron Jenkins of Wetlands International-Oceania offered his expertise to finalize the <strong>Fiji</strong> fish list to ensure that only species found in<strong>Fiji</strong> are recorded.Page | 20
ReferencesAdams VM, Mills M, Jupiter SD, Pressey RL (2010) Marine opportunity costs: a method for calculatingopportunity costs to multiple stakeholder groups. <strong>Wildlife</strong> <strong>Conservation</strong> <strong>Society</strong>-<strong>Fiji</strong> TechnicalReport no. 01/10, Suva, <strong>Fiji</strong> 34 ppAllison N (1996) Geochemical anomalies in coral skeletons and their possible implications forpalaeoenvironmental analyses. Marine Chemistry 55: 367-379Aswani S, Hamilton RJ (2004) Integrating indigenous ecological knowledge and customary sea tenurewith marine and social science for conservation of bumphead parrotfish (Bolbometoponmuricatum) in the Roviana Lagoon, Solomon Islands. Environmental <strong>Conservation</strong> 31: 69-83Barnes DJ, Lough JM (1999) Porites growth characteristics in a changed environment: Misima Island,Papua New Guinea. Coral Reefs 18: 213-218Beck JW, Edwards RL, Ito E, Taylor FW, Recy J, Rougerie F, Joannot P, Henin C (1992) Sea-surfacetemperature from coral skeletal strontium/calcium ratios. Science 257: 644-647Carroll J, Falkner KK, Brown ET, Moore WS (1993) The role of the Ganges-Brahmaputra mixing zonein supplying barium and 226 Ra to the Bay of Bengal. Geochimica et Cosmochimica Acta 57:2981-2990Cinner JE, Marnane MJ, McClanahan TR (2005) <strong>Conservation</strong> and community benefits fromtraditional coral reef management at Ahus Island, Papua New Guinea. <strong>Conservation</strong> Biology19: 1714-1723Clarke P, Jupiter SD (in press) Law, custom and community-based natural resource management inKubulau District, Republic of <strong>Fiji</strong> Islands. Environmental <strong>Conservation</strong>Coffey M, Dehairs F, Collette O, Luther G, Church T, Jickells T (1997) The behaviour of dissolvedbarium in estuaries. Estuarine, Coastal and Shelf Science 45: 113-121Connell JH, Hughes TP, Wallace CC (1997) A 30-year study of coral abundance, recuitment, anddisturbance at several scales in space and time. Ecological Monographs 67: 461-488Connell JH, Hughes TP, Wallace CC, Tanner JE, Harms KE, Kerr AM (2004) A long-term study ofcompetition and diversity of corals. Ecological Monographs 74: 179-210DeVantier LM, De'ath G, Turak E, Done TJ, Fabricius KE (2006) Species richness and communitystructure of reef-building corals on the nearshore Great Barrier Reef. Coral Reefs 25: 329-340Done TJ, Turak E, Wakeford M, DeVantier L, McDonald A, Fisk D (2007) Decadal changes in turbidwatercoral communities at Pandora Reef: loss of resilience or too soon to tell? Coral Reefs26: 789-805Fabricius K, Alderslade P (2001) Soft Corals and Sea Fans: a comprehensive guide to the tropicalshallow water genera of the central-west Pacific, the Indian Ocean and the Red Sea.Australian Institute of Marine Science, Townsville, AustraliaFabricius K, De'ath G, McCook L, Turak E, Williams DM (2005) Changes in algal, coral and fishassemblages along water quality gradients on the inshore Great Barrier Reef. MarinePollution Bulletin 51: 384-398Fabricius KE (2005) Effects of terrestrial runoff on the ecology of corals and coral reefs: review andsynthesis. Marine Pollution Bulletin 50: 125-146Fabricius KE, De'ath G (2004) Identifying ecological change and its causes: a case study on coral reefs.Ecological Applications 14: 1448-1465Fabricius KE, McCorry D (2006) Changes in octocoral communities and benthic cover along a waterquality gradient in the reefs of Hong Kong. Marine Pollution Bulletin 52: 22-33Fabricius KE, Wild C, Wolanski E, Abele D (2003) Effects of transparent exopolymer particles andmuddy terrigenous sediments on the survival of hard coral recruits. Estuarine, Coastal andShelf Science 57: 613-621Fallon SJ, White JC, McCulloch MT (2002) Porites corals as recorders of mining and environmentalimpacts: Misima Island, Papua New Guinea. Geochimica et Cosmochimica Acta 66: 45-62Page | 21
Fleitmann D, Dunbar RB, McCulloch MT, Mudelsee M, Vuille M, McClanahan TR, Cole JE, Eggins S(2007) East African soil erosion recorded in a 300 year old coral colony from Kenya.Geophysical Research Letters 34: L04401 doi:10.1029/2006GL028525Froese R, Pauly D (2009) FishBase. Graham NAJ, Wilson SK, Jennings S, Polunin NVC, Bijoux JP, Robinson J (2006) Dynamic fragility ofoceanic coral reef systems. Proceedings of the National Academy of Sciences 103: 8425-8429Graham NAJ, Wilson SK, Jennings S, Polunin NVC, Robinson JB, J. P., Daw TM (2007) Lag effects in theimpacts of mass coral bleaching on coral reef fish, fisheries, and ecosystems. <strong>Conservation</strong>Biology 21: 1291-1300Hanor JS, Chan L-H (1977) Non-conservative behavior of barium during mixing of Mississippi Riverand Gulf of Mexico waters. Earth and Planetary Science Letters 37: 242-250Hopley D (1995) Continental shelf reef systems. In: Carter RWG, Woodroffe CD (eds) CoastalEvolution : Late Quaternary Shoreline Morphodynamics. Cambridge University Press,Cambridge, UK, pp 303-340Hughes TP (1989) Community structure and diversity of coral reefs: the role of history. Ecology 70:275-279Hughes TP, Connell JH (1999) Multiple stressors on coral reefs: a long-term perspective. Limnologyand Oceanography 44: 932-940Jennings S, Polunin NVC (1996) Effects of fishing effort and catch rate upon the structure andbiomass of <strong>Fiji</strong>an reef fish communities. The Journal of Applied Ecology 33: 400-412Jennings S, Reynolds JD, Mills SC (1998) Life history correlates of responses to fisheries exploitation.Proceedings of the Royal <strong>Society</strong> B 265: 333-339Jennings S, Greenstreet SPR, Reynolds JD (1999) Structural change in an exploted fish community: aconsequence of differential fishing effects on species with contrasting life histories. Journalof Animal Ecology 68: 617-627Jokiel PL, Hunter CL, Taguchi S, Watarai L (1993) Ecological impact of a freshwater "reef kill" inKaneohe Bay, Oahu, Hawaii. Coral Reefs 12: 177-184Jupiter SD (2006) From cane to coral reefs: ecosystems linkages and downstream responses to landuse intensification. Ph.D. thesis, University of California, Santa Cruz, 300 ppJupiter S, Roff G, Marion G, Henderson M, Schrameyer V, McCulloch M, Hoegh-Guldberg O (2008)Linkages between coral assemblages and coral proxies of terrestrial exposure along a crossshelfgradient on the southern Great Barrier Reef. Coral Reefs 27: 887-903Jupiter SD, Egli DP, Jenkins AP, Yakub N, Hartley F, Cakacaka A, Tui T, Moy W, Naisilisili W, DulunaqioS, Qauqau I, Prasad S (2010) Effectiveness of marine protected area networks in traditionalfishing grounds of Vanua Levu, <strong>Fiji</strong>, for sustainable management of inshore fisheries. <strong>Wildlife</strong><strong>Conservation</strong> <strong>Society</strong>-<strong>Fiji</strong> and Wetlands International-Oceania, Technical Report 03/10, Suva,<strong>Fiji</strong>Kleypas JA (1996) Coral reef development under naturally turbid conditions: fringing reefs nearBroad Sound, Australia. Coral Reefs 15: 153-167Lapointe BE (1997) Nutrient thresholds for bottom-up control of macroalgal blooms on coral reefs inJamaica and southeast Florida. Limnology and Oceanography 42: 1119-1131Letourner Y, Kulbicki M, Labrosse P (1998) Spatial structure of commercial reef fish communitiesalong a terrestrial runoff gradient in the northern lagoon of New Caledonia. EnvironmentalBiology of Fishes 51: 141-159Livingston HD, Thompson G (1971) Trace element concentrations in some modern corals. Limnologyand Oceanography 16: 786-796Lovell E, Sykes H (2008) Rapid recovery from bleaching events - <strong>Fiji</strong> Global Coral Reef MonitoringNetwork assessment of hard coral cover from 1999-2007. 11th International Coral ReefSymposiumMallela J, Perry CT, Haley MP (2004) Reef morphology and community structure along a fluvialgradient, Rio Bueno, Jamaica. Caribbean Journal of Science 40: 299-311Page | 22
McClanahan TR, Hicks CC, Darling ES (2008) Malthusian overfishing and efforts to overcome it onKenyan coral reefs. Ecological Applications 18: 1516-1529McCook LJ (1999) Macroalgae, nutrients and phase shifts on coral reefs: scientific issues andmanagement consequences for the Great Barrier Reef. Coral Reefs 18: 357-367McCook LJ, De'ath G, Price IR, Diaz-Pulido G, Jompa J (2000) Macroalgal resources of the GreatBarrier Reef: taxonomy, distributions and abundances on coral reefs. Report to the GreatBarrier Reef Marine Park Authority.McCulloch M, Fallon S, Wyndham T, Hendy E, Lough J, Barnes D (2003) Coral record of increasedsediment flux to the inner Great Barrier Reef since European settlement. Nature 421: 727-730Nugues MM, Roberts CM (2003) Partial mortality in massive reef corals as an indicator of sedimentstress on coral reefs. Marine Pollution Bulletin 46: 314-323Pet Soede C, Van Dansen WLT, Pet JS, Machiels MAM (2001) Impact of Indonesian coral reef fisherieson fish community structure and the resultant catch composition. Fisheries Research 5: 35-51Pimentel D, Allen J, Beers A, Guinand L, Hawkins A, Linder R, McLaughlin P, Meer B, Musonda D,Perdue D, Poisson S, Salazar R, Siebert S, Stoner K (1993) Soil erosion and agriculturalproductivity. In: Pimentel D (ed) World Soil Erosion and <strong>Conservation</strong>. Cambridge UniversityPress, Cambridge, UK, pp 277-292Pittman SJ, Costa BM, Battista TA (2009) Using lidar bathymetry and boosted regression trees topredict the diversity and abundance of fish and corals. Journal of Coastal Research 53 sp.1:27-38Prouty NG, Field ME, Jupiter SD (in prep) Impacts of land-use change and shoreline modificationcaptured in coral Ba/Ca records, Moloka'i, Hawai'iPurkis SJ, Graham NAJ, Riegl BM (2008) Predictability of reef fish diversity and abundance usingremote sensing data in Diego Garcia (Chagos Archipelago). Coral Reefs 27: 167-178Rogers CS (1990) Responses of coral reefs and reef organisms to sedimentation. Marine EcologyProgress Series 62: 185-202Russ GR, Alcala AC (1998) Natural fishing experiments in marine reserves 1983-1993: roles of lifehistory and fishing intensity in family responses. Coral Reefs 17: 399-416Sinclair DJ (1999) High spatial-resolution analysis of trace elements in corals using laser ablation ICP-MS. Ph.D. thesis, The Australian National University, 388 ppSmith SV, Kimmener WJ, Laws EA, Brock RE, Walsh TW (1981) Kaneohe Bay sewerage diversionexperiment: perspectives on ecosystem response to nutritional perturbation. Pacific Science35: 279-395Smithers SG, Hopley D, Parnell KE (2006) Fringing and nearshore coral reefs of the Great BarrierReef: episodic Holocene development and future prospects. Journal of Coastal Research 22:175-187Stafford-Smith MG, Ormond RFG (1992) Sediment-rejection mechanisms of 42 species of Australianscleractinian corals. Marine and Freshwater Research 43: 683-705Sweatman H, Thompson A, Delean S, Davidson J, Neale S (2007) Status of near-shore reefs of theGreat Barrier Reef 2004. Reef and Rainforest Research Centre Limited, Cairns, Australia, 169ppTribollet A, Golubic S (2005) Cross-shelf differences in the pattern and pace of bioerosion ofexperimental carbonate substrates exposed for 3 years on the northern Great Barrier Reef,Australia. Coral Reefs 24: 422-434van Woesik R, DeVantier LM, Glazebrook JS (1995) Effects of Cyclone 'Joy' on nearshore coralcommunities of the Great Barrier Reef. Marine Ecology Progress Series 128: 261-270van Woesik R, Tomascik T, Blake S (1999) Coral assemblages and physico-chemical characteristics ofthe Whitsunday Islands: evidence of recent community changes. Marine & FreshwaterResearch 50: 427-440Page | 23
Veron JEN (1995) Corals in Space and Time: The Biogeography and Evolution of the Scleractinia.Comstock/Cornell, Ithaca, USA<strong>WCS</strong> (2009) Ecosystem-Based Management Plan: Kubulau District, Vanua Levu, <strong>Fiji</strong>. <strong>Wildlife</strong><strong>Conservation</strong> <strong>Society</strong>, Suva, <strong>Fiji</strong>, 121 ppWilkinson BH (2005) Humans as geologic agents: a deep-time perspective. Geology 33:161-164Wilson SK, Graham NAJ, Polunin NVC (2007) Appraisal of visual assessments of habitat complexityand benthic composition on coral reefs. Marine Biology 151: 1069-1076Wilson SK, Graham NAJ, Pratchett MS, Jones GP, Polunin NVC (2006) Multiple disturbances and theglobal degradation of coral reefs: are reef fishes at risk or resilient? Global Change Biology12: 2220-2234Wilson SK, Fisher R, Pratchett MS, Graham NAJ, Dulvy NK, Turner RA, Cakacaka A, Polunin NVC,Rushton SP (2008) Exploitation and habitat degradation as agents of change within coral reeffish communities. Global Change Biology 14: 2796-2809Wolanski E, Gibbs RJ (1995) Flocculation of suspended sediment in the Fly River Estuary, Papua NewGuinea. Journal of Coastal Research 11: 754-762Page | 24


![RaLand / SeaScape [PDF] - Wildlife Conservation Society](https://img.yumpu.com/49974326/1/190x245/raland-seascape-pdf-wildlife-conservation-society.jpg?quality=85)